You are currently viewing a new version of our website. To view the old version click .
Eng
  • Article
  • Open Access

11 November 2025

Dynamic Pressure Awareness and Spatiotemporal Collaborative Optimization Scheduling for Microgrids Driven by Flexible Energy Storage

,
,
,
,
,
,
and
1
State Grid Henan Electric Power Research Institute, Zhengzhou 450052, China
2
Institute of Electrical Engineering, Chinese Academy of Sciences, Beijing 100190, China
3
School of Electronic, Electrical and Communication Engineering, University of Chinese Academy of Sciences, Beijing 100049, China
*
Author to whom correspondence should be addressed.
This article belongs to the Section Electrical and Electronic Engineering

Abstract

Under the dual carbon goals, microgrids face significant challenges in managing multi-energy flow coupling and maintaining operational robustness with high renewable energy penetration. This paper proposes a novel dynamic pressure-aware spatiotemporal optimization dispatch strategy. The strategy is centered on intelligent energy storage and enables proactive energy allocation for critical pressure moments. We designed and validated the strategy under an ideal benchmark scenario with perfect foresight of the operational cycle. This approach demonstrates its maximum potential for spatiotemporal coordination. On this basis, we propose a Multi-Objective Self-Adaptive Hybrid Enzyme Optimization (MOSHEO) algorithm. The algorithm introduces segmented perturbation initialization, nonlinear search mechanisms, and multi-source fusion strategies. These enhancements improve the algorithm’s global exploration and convergence performance. Specifically, in the ZDT3 test, the IGD metric improved by 7.7% and the SP metric was optimized by 63.4%, while the best HV value of 0.28037 was achieved in the UF4 test. Comprehensive case studies validate the effectiveness of the proposed approach under this ideal setting. Under normal conditions, the strategy successfully eliminates power and thermal deficits of 1120.00 kW and 124.46 kW, respectively, at 19:00. It achieves this through optimal quota allocation, which involved allocating 468.19 kW of electricity at 13:00 and 65.78 kW of thermal energy at 18:00. Under extreme weather, the strategy effectively converts 95.87 kW of electricity to thermal energy at 18:00. This conversion addresses a 444.46 kW thermal deficit. Furthermore, the implementation reduces microgrid cluster trading imbalances from 1300 kW to zero for electricity and from 400 kW to 176.34 kW for thermal energy, significantly enhancing system economics and multi-energy coordination efficiency. This research provides valuable insights and methodological support for advanced microgrid optimization by establishing a performance benchmark, with future work focusing on integration with forecasting techniques.

1. Introduction

Microgrids, as a form of distributed energy system, have made significant advancements in energy management, optimal scheduling of distributed generation sources, and intelligent control. They demonstrate unique advantages in enhancing energy utilization efficiency, improving power supply reliability, and facilitating high penetration of renewable energy sources [,,]. However, Refs. [,,] argued that challenges remain in their adaptability to uncertainties in dynamic environments, optimization efficiency under complex multivariate scenarios, and robustness under extreme conditions.
Existing research has provided multifaceted technical support for the efficient and stable operation of microgrids. In the area of control and protection, Ref. [] systematically outlined a hierarchical control architecture for microgrids, providing a foundational framework for system stability. However, when the operational challenge extends to the coordinated optimization of dynamically coupled multi-energy flows, this control-oriented framework requires augmentation with predictive scheduling capabilities, which is a key focus of the present work. Based on local current measurements, Ref. [] proposed a rapid protection strategy for DC microgrids, which is crucial for system security. Yet, its design objective is inherently focused on fast fault response, leaving the aspect of proactive, spatiotemporal energy allocation—essential for optimizing daily operation—unaddressed. Ref. [] designed a three-layer communication architecture based on OPC UA, effectively supporting real-time interoperability among heterogeneous devices. This represents a significant advancement in data exchange. Nevertheless, the architecture serves as an enabling platform; the intelligence for converting this data into foresighted scheduling decisions against dynamic multi-energy pressures, as proposed in our strategy, remains an open challenge. On the energy scheduling and management front, Ref. [] introduced a spatiotemporal pairing and energy-sharing strategy for microgrids, leveraging deep learning and Transformer models to enhance collaborative utilization efficiency of renewable energy. However, its optimization process does not achieve the closed-loop, proactive allocation driven by real-time pressure awareness that our ‘flexible energy storage’ core concept enables. Ref. [] developed a user-friendly load scheduling tool for building microgrids, achieving rapid optimization of operational curves and cost control. Nonetheless, its limitations in ensuring global optimality and adapting to complex pricing strategies highlight the need for a more sophisticated, system-wide optimization algorithm like our MOSHEO, which is designed for complex multi-objective, spatiotemporal problems. Ref. [] proposed a comprehensive risk-averse stochastic programming and asymmetric Nash bargaining framework for multi-energy microgrids. Their method demonstrated significant economic benefits, reducing the operation costs of each participating microgrid by approximately 5% and the total alliance cost by 5.25%. Furthermore, their distributed algorithm achieved remarkable computational efficiency, saving solution time by 30–40% compared to sequential methods, while effectively ensuring fair benefit allocation and managing uncertainties from renewable energy. This provides good inspiration for this paper. In summary, while significant progress has been made in the realms of microgrid control, communication, and energy scheduling, further in-depth research is needed to address the challenges of tightly coupled multi-energy flows, implement forward-looking energy storage scheduling, and adapt to the dynamic pressures associated with high proportions of renewable energy.
In the field of optimizing management for microgrids and hybrid energy storage systems, existing achievements have advanced energy management technology across multiple levels, from device control to system coordination. The dynamic threshold control algorithm proposed in Ref. [] enhanced the adaptability of energy storage coordination by real-time adjustment of charging and discharging thresholds; however, there remains room for improvement in its threshold optimization mechanism. Ref. [] utilized an improved PPO algorithm to achieve energy efficiency management of up to 84.5%, demonstrating the significant potential of intelligent algorithms in enhancing energy efficiency. Nevertheless, its heavy reliance on training data quality reveals the advantage of our model-based optimization approach (MOSHEO) in scenarios where high-fidelity training data is scarce. At the system architecture level, Ref. [] constructed a hybrid energy-sharing model that innovatively facilitates coordinated configuration and economic dispatch of multiple energy forms across several microgrids, but its shortcoming in addressing renewable energy and load uncertainties directly motivates our incorporation of a dynamic pressure index to quantify and proactively manage such imbalances. The hydrogen storage model developed in Ref. [] that integrated thermal management and degradation modeling has improved the detail transparency of system modeling. Meanwhile, the NARMA-L2 neural network controller from Ref. [] and the extrema search control strategy from Ref. [] enhanced the system’s dynamic response performance from model-dependent and model-independent perspectives, respectively, though exploration of cross-temporal and spatial scale collaborative optimization in these studies remains limited. As research expands from single systems to cooperative multi-microgrid setups, Ref. [] introduced a centralized controller based on deep deterministic policy gradient, optimizing the energy distribution among microgrids through continuous action control. Ref. [] presented a shared energy dual-layer optimization model that innovatively incorporates the residual value of battery retirement to enhance lifecycle economics. These studies offer sophisticated solutions for inter-microgrid coordination and long-term economic planning. A logical and valuable extension, which we explore in this paper, is to empower such systems with the ability to anticipate critical stress moments. Integrating this foresight could enable a more proactive and resilient form of cross-spatiotemporal cooperation, moving beyond optimal response within a predicted scenario towards actively preparing for the most challenging future conditions. In addition, Ref. []’s multi-criteria decision-making framework effectively increased the penetration rate of renewable energy in islanded microgrid clusters by addressing data uncertainty. Meanwhile, Ref. [] conducted a comparative study on consensus, diffusion, and precise diffusion algorithms, providing important algorithmic choices for distributed optimization. While these studies have made significant strides in control strategies, collaborative architectures, and economic optimization, they still lack the foresight perception capabilities for critical stress moments and collaborative optimization mechanisms across temporal and spatial scales when responding to the complexities of dynamically coupled multi-energy flows. Consequently, they have not fully realized anticipatory resource allocation and flexible interdependence among diverse energy types from the ‘present’ to the ‘future,’ indicating important directions for future research.
Existing research on the optimization and solution of microgrid models typically employs artificial intelligence algorithms. For instance, Ref. [] proposed a chaos theory-enhanced Salp Swarm algorithm for optimizing the management of microgrids that include various renewable energy sources and hydrogen storage, significantly reducing operational costs; however, Ref. [] did not consider the proposed algorithm still requires improvement in its ability to adapt to real-time uncertainties. Furthermore, in the domain of addressing extreme event uncertainties, Ref. [] developed a sophisticated risk-averse two-stage restoration model that successfully managed comprehensive uncertainties from typhoon disasters. Their market-aided joint bidding strategy created a win-win situation, significantly enhancing post-disaster restoration cost-efficiency. A key achievement was the synergistic effect of pre- and post-disaster measures, which realized a substantial 13.07% reduction in the overall restoration costs of the multi-energy distribution system. Ref. [] introduces an adaptive robust multi-objective optimization algorithm that addresses uncertainty in microgrid scheduling by balancing robustness and convergence; however, Ref. [] failed to explore its efficiency in high-dimensional decision spaces and large-scale optimization. Ref. [] optimized the dynamic performance of grid-connected photovoltaic systems using a Sparrow Search Algorithm, but its real-time adaptability in complex dynamic environments requires validation. Additionally, reference [] presented an improved slime mold algorithm that enhances frequency control accuracy through a multi-operator strategy, although its robustness under extreme fluctuations in renewable energy still needs testing. In summary, while these studies have improved the stability and economy of microgrids through the introduction of intelligent optimization algorithms, further exploration and refinement are needed regarding dynamic environmental adaptability, general applicability in complex scenarios, and robustness under extreme conditions.
Although existing research has achieved significant results in microgrid architecture design, operation control, and energy management, there are still evident shortcomings in addressing challenges such as the dynamic coupling of multi-energy flows under high-penetration renewable energy integration, robust response to extreme operating conditions, and cross-spatiotemporal scale cooperative optimization. In particular, existing methods generally lack the ability for forward-looking perception of critical system pressure moments, making it difficult to achieve truly predictive energy scheduling and flexible mutual support among multiple types of energy. To address this, this study explores innovative approaches in scheduling strategies and optimization algorithms, aiming to construct an intelligent microgrid scheduling system with dynamic pressure awareness and spatiotemporal collaborative optimization capabilities. Targeting the deficiencies in existing microgrid research regarding dynamic coupling of multi-energy flows, predictive energy storage scheduling, and robustness under extreme conditions, a systematic solution is proposed. The main innovations and contributions are as follows:
A dynamic pressure-aware and spatiotemporal collaborative optimal scheduling strategy driven by “Flexible Energy Storage” is proposed: Operating under the assumption of perfect information for a given scheduling horizon, a closed-loop intelligent decision-making framework of “state perception—dynamic assessment—flexible energy storage—intelligent conversion—load optimization” is constructed. This transcends the functional limitations of traditional energy storage that only achieves spatiotemporal translation of energy. A comprehensive system pressure index is defined, and a spatiotemporal collaborative scheduling weight mechanism is proposed to guide the system in pre-storing and pre-configuring multiple types of energy along optimal spatiotemporal paths, achieving a transition from “passive response” to “active planning.”
The Multi-objective Self-adaptive Hybrid Enzyme Optimization Algorithm (MOSHEO) is proposed. To address the various limitations of the original Enzyme-inspired Optimization Algorithm (EAO), segmented perturbation initialization is introduced. By incorporating systematic bias and segmented perturbations, the initial population is ensured to more uniformly cover the entire search space. A nonlinear time-varying factor is adopted to delay the decay of the search rate, effectively extending the algorithm’s global exploration period. Meanwhile, a multi-source fusion approach is used to control the perturbation intensity, achieving a smooth self-adaptive transition from strong to weak perturbations. When generating candidate solutions, dynamic weighting and distance weighting based on search process information are introduced, effectively preventing the premature loss of population diversity.
The structure of this paper is as follows: Section 1 is the introduction, systematically elaborating on the research background and significance of microgrids, comprehensively reviewing domestic and international research status, and summarizing the innovations and contributions of this paper. Section 2 constructs the microgrid system model and proposes the dynamic pressure-aware and spatiotemporal collaborative optimal scheduling strategy driven by Flexible Energy Storage. Section 3 proposes the Multi-objective Self-adaptive Hybrid Enzyme Optimization Algorithm. Section 4 verifies the effectiveness and universality of the proposed method and strategy through algorithm performance tests and multi-scenario case studies. Section 5 summarizes the full text.

2. Formulation of Village Level Microgrids

The core characteristic of a microgrid is multi-energy flow coupling. By integrating various energy forms, it achieves cascading utilization and synergistic optimization of energy, thereby enhancing energy efficiency, reliability, and economic performance. The topological structure of the microgrid is shown in Figure 1.
Figure 1. The Microgrid system structure.
Due to the numerous variables and features involved in this paper, a nomenclature is provided in Table 1 to facilitate reader comprehension.
Table 1. Nomenclature.

2.1. Equipment Models

(1)
Renewable Energy
Photovoltaic power generation and wind power generation are the primary sources of clean energy in microgrids. The core characteristic is low carbon emissions, and mathematical models are represented by the following equations:
E l P V = E l P V R L t L T C 30 L t L T C + ( T i T i T C ) δ P V + 1 E l W T = E l W T R , W S R W S < W S , o u t E l W T R W S W S , i n W S R W S , i n , W S , i n W S < W S R 0 , e l s e
where E l P V R denotes the rated output power of the photovoltaic unit under standard test conditions; L t represents the actual solar irradiance; L T C is the standard irradiance (1000 W/m2); T i denotes the ambient temperature; T i T C refers to the standard temperature (25 °C); δ P V is the temperature coefficient; E l W T R signifies the rated output power of the wind turbine under standard conditions; W S , t indicates the instantaneous wind speed; W S R is the rated wind speed, typically 12 m/s; W S , i n and W S , o u t represent the cut-in (2.5 m/s) and cut-out (18 m/s) wind speeds, respectively.
(2)
Gas Boilers and Gas Turbines
Gas boilers generate thermal energy using natural gas as fuel within a microgrid. These exhibit high thermal efficiency, typically ranging between 85% and 95%, making them suitable for large-scale heating applications. Gas turbines, on the other hand, consume natural gas to convert chemical energy into thermal energy, demonstrating load-following characteristics. Additionally, these can function as power sources by converting chemical energy into mechanical energy to drive generators, thereby supplying electricity. These energy conversion processes are represented by the following equations:
H l G B = C G B δ H V β G B H l G T = C G T δ H V ( 1 β G T β G T l o s s ) E l G T = β G T δ H V C G T
where C G B is the natural gas consumption of the gas boiler; β G B is the thermal efficiency coefficient of the gas boiler (0.93%); C G T is the natural gas consumption of the gas turbine; β G T l o s s represents the loss coefficient of the gas turbine, typically 0.35%; β G T is the power generation efficiency coefficient of the gas turbine (0.9%); and δ H V signifies the calorific value of natural gas, typically 9.7 kWh/m3.
(3)
Energy Storage Equipment
During off-peak periods in microgrids, energy storage devices operate in charging and heat storage modes. During peak periods, they switch to discharging and heat release modes. By adjusting electrical and thermal energy through charging and discharging, they balance load demands and enhance system stability, as expressed by the following equation:
E S E l = E S E t 1 ( 1 β E ) + γ c h E E l c h Δ t E S E t 1 ( 1 β E ) E l d i s Δ t γ d i s E H S H l = H S H t 1 ( 1 β H ) + γ c h H H l c h Δ t H S H t 1 ( 1 β H ) H l d i s Δ t γ d i s H
where γ c h E is the charging status of the electrical storage device (0.98%); γ d i s E is the discharge efficiency factor (0.98%); E l c h is the charging power; E l d i s is the discharging power; β E is the self-dissipation factor of the device (0.02%); Δ t is the duration of a time step.

2.2. Operational Constraints

Microgrids establish constraints around power balance and equipment operational limitations. Power balance ensures that energy supply equals demand at all times, with the constraint formula as follows:
(1)
Development of the supercapacitor capacity allocation model:
E l G B + E l P V + E l W T + E l G T + E l d i s + E l b u y M G = E l l o a d + E l c h r + E l s e l l M G H l G T + H l G B + H l d i s H l c h r + H l b u y M G = H l l o a d + H l s e l l M G
where E l b u y M G is the power purchased from the main grid by the microgrid; E l s e l l M G is the power sold to the main grid by the microgrid; H l c h is the thermal energy charging power; H l d i s is the thermal energy discharging power; H l b u y M G is the thermal power purchased by the microgrid; H l s e l l M G is the thermal power sold by the microgrid.
The microgrid transaction constraint formula is as follows:
E l t r a d e min E l b u y M G E l s e l l M G E l t r a d e max H l t r a d e min H l b u y M G H l s e l l M G H l t r a d e max E t r a d e M G k E l i n e max H t r a d e M G k H p i p e max
where E l t r a d e min and E l t r a d e max represent the lower and upper bounds for the microgrid’s electrical power exchange with the main grid, respectively; H l t r a d e min and H l t r a d e max denote the corresponding constraints on the minimum and maximum thermal power exchange; E t r a d e M G k and H t r a d e M G k are the net electrical and thermal power exchanged between microgrid k and the common coupling point or other microgrids at time t, as defined in the transaction balance; E l i n e max and H p i p e max represent the transmission capacity limits of the electrical line and heating pipe, respectively.
Equipment operating constraints form the core component of the microgrid model. These constraints define the operational conditions for devices within the system, ensuring the practical feasibility of scheduling. The operating constraint formulas for photovoltaic and wind power generation are as follows:
E l W T min E l W T E l W T max E l P V min E l P V E l P V max Δ E l W T min E l W T t E l W T t 1 Δ E l W T max Δ E l P V min E l P V t E l P V t 1 Δ E l P V max
where E l W T min and E l W T max are the minimum and maximum power output of the wind turbine, respectively.
The operational constraint equations for gas boilers and gas turbines are as follows:
E l G T min E l G T E l G T max H l G B min H l G B H l G B max H l G T min H l G T H l G T max Δ E l G T min E l G T t E l G T t 1 Δ E l G T max Δ H l G B min H l G B t H l G B t 1 Δ H l G B max Δ H l G T min H l G T t H l G T t 1 Δ H l G T max
where E l G T min and E l G T max are the minimum and maximum electrical power output of the gas turbine, respectively; H l G B min and H l G B max are the minimum and maximum thermal power output of the gas boiler, respectively.
The operational constraints for energy storage equipment are as follows:
E S E l min E S E l E S E l max ( 1 μ E S ) E l c h min E l c h ( 1 μ E S ) E l c h max ( 1 μ H S ) H l c h min H l c h ( 1 μ S E ) H l c h max μ H S H l d i s min H l d i s μ H S H l d i s max μ E S E l d i s min E l d i s μ E S E l d i s max
where μ E S ∈{0,1} are binary variables representing the operating status of the electrical storage device, with 0 indicating charging and 1 indicating discharging; E S E l min is the minimum charge and discharge power of the electrical storage device, respectively; E l c h min and E l c h max are the minimum and maximum discharging power of the electrical storage device, respectively; H l d i s min and H l d i s max are the minimum and maximum thermal power output of the thermal storage device, respectively.

2.3. Objective Function

Microgrids are composed of three distinct load zones: urban commercial district microgrids, industrial park microgrids, and residential area microgrids. The formula for the comprehensive cost of a microgrid is as follows:
U t r a d e M G = t = 1 24 ( p b u y p s e l l ) E l t r a d e M G U o m = t = 1 24 k o m E l e q U g a s = t = 1 24 p H V ( E l G T + E l G B ) U p o l l = t = 1 24 [ φ M G U t r a d e M G + κ p o l l ( L G T + L G B ) ] U M G S = min { t = 1 24 ( ζ 1 U t r a d e M G + ζ 2 U o m + ζ 3 ( U g a s + U p o l l ) ) }
where p b u y and p s e l l are the electricity purchase price and electricity sale price, respectively; k o m is the maintenance coefficient of the device; E l t o is the power of the device within the microgrid; LGT and LGT are the fuel characteristic variation values for the gas turbine and gas boiler, respectively; p H V is the unit cost of fuel; φ M G is the trading price of the microgrid; κ p o l l is the pollution cost; with values of 0.6370, 0.2583, and 0.1047, respectively, ζ 1 ~ ζ 3 are the weights obtained from the judgment matrix []; U M G S is the economic cost of the microgrid under three different load types.
The comprehensive cost objective function defined in Equation (9) incorporates economic, operational, and environmental factors. The weights ( ζ 1 , ζ 2 , ζ 3 ) and pollution cost factors are not arbitrary but are derived from established methodologies to ensure the model’s objectivity and relevance. The determination of the weights ζ 1 , ζ 2 , and ζ 3 for the economic costs of the three different load zones (urban commercial district, industrial park, and residential area) was based on the judgment matrix provided in [] using the Analytic Hierarchy Process (AHP). The AHP structured the problem by defining the objective, prioritizing load zones for cost minimization, and the three alternatives, which are the load zones themselves. A panel of microgrid planning and operation experts provided pairwise comparisons, judging the relative importance of each zone against criteria such as peak demand intensity, the economic impact of power outages, and regional energy policy focus. The resulting judgment matrix was processed to obtain the final weights ζ 1 , ζ 2 , and ζ 3 . The consistency ratio (CR) of the matrix was calculated to be 0.04, which is below the threshold of 0.1, confirming the logical consistency of the judgments and the reliability of the derived weights. Furthermore, the specific values used in this study are consistent with the emission cost parameters established in the foundational work of [], ensuring alignment with the referenced bi-level scheduling model.

2.4. A Dynamic Pressure-Aware and Spatiotemporal Collaborative Optimization Scheduling Strategy Driven by Flexible Energy Storage

To address the challenge of achieving dynamic balance between supply and demand in microgrid systems, these systems feature coupled electrical, thermal, and cooling energy flows. This paper proposes a dynamic pressure-aware spatiotemporal collaborative optimization scheduling strategy. The strategy is driven by “flexible energy storage.” This strategy aims to transcend the limitations of traditional energy storage. Traditional storage primarily shifts energy across time and space. Our strategy establishes a closed-loop intelligent decision-making framework, which follows the sequence: “state perception → dynamic assessment → flexible energy storage → smart conversion → load optimization.”
The core innovation lies in two interconnected concepts. First, “Dynamic Pressure Awareness” provides the system with a capability analogous to a “nervous system”. This capability enables the system not only to sense the current state of multi-energy flows but also to quantitatively assess and anticipate future moments of severe supply-demand conflict. This function shifts the system’s operational paradigm. It moves from passively responding to immediate imbalances to proactively identifying and preparing for critical stresses. Second, “Flexible Energy Storage” redefines the role of storage in integrated energy systems. It goes beyond merely shifting electricity in time. The strategy incorporates two key dimensions of flexibility: it decides “what form of energy to store or use” (electricity, heat, or cooling) and “how to optimally allocate it across space and time.” Together, these capabilities allow the system to strategically pre-store and pre-allocate decentralized energy surpluses along optimal spatiotemporal paths, thereby enhancing overall resilience, economy, and operational reliability.
In this study, we establish the theoretical foundation and ideal performance benchmark for this strategy under a key methodological assumption. We assume perfect knowledge of the load and renewable generation profiles throughout the entire optimization period. This assumption allows us to utilize existing data to validate the strategy’s rationality. This approach enables us to isolate and validate the core decision-making logic of the strategy. It also eliminates the confounding effects of forecasting uncertainty.
Under the perfect information assumption, the proposed strategy begins with the construction of a comprehensive system state perception layer. The strategy utilizes a high-precision real-time monitoring network. This network continuously collects data on the supply and load of electrical, thermal, and cooling energy. Building on this foundation, the energy state at each moment t is quantified with precision:
G i ( t ) = max ( 0 , P i s u p p l y ( t ) P i d e m a n d ( t ) ) , i { e , h , c } D i ( t ) = max ( 0 , P i d e m a n d ( t ) P i s u p p l y ( t ) ) , i { e , h , c }
where G i ( t ) is the surplus power of energy source; D i ( t ) denotes the deficit power of energy source; P i s u p p l y ( t ) indicates the energy input within the microgrid; P i d e m a n d ( t ) signifies the energy output from the microgrid; the variables e, h, and c represent electrical energy, thermal energy, and cooling energy, respectively.
This quantification process not only records data but, more importantly, establishes a comprehensive ‘energy situational map’ for the system. This map provides a solid foundation for the intelligent decision-making processes of intelligent energy storage.
After obtaining panoramic state data, the strategy advances to the dynamic pressure assessment phase. Traditional methods often view energy deficits in isolation. They neglect the coupling relationships and substitution potentials among different energy sources. This strategy innovatively proposes a comprehensive pressure index ψ ( t ) for the system. This index considers the overall system perspective. It also integrates the potential for electrical energy surpluses to address deficits in thermal and cooling energy through conversion devices such as heat pumps and electric chillers.
ψ ( t ) = i { e , h , c } [ D i ( t ) j i α i j G i ( t ) ] max t ( i { e , h , c } D i ( t ) ) t * = arg max t * t ψ ( t )
where α i j is the efficiency coefficient for the conversion of energy source j into energy source i, while t* denotes the critical pressure moment when the supply-demand conflict for energy is most pronounced.
Once determined, the core of the strategy—intelligent energy storage-driven spatiotemporal coordinated scheduling—commences comprehensively. This phase embodies the essence of ‘flexible’. The system does not merely store the current surplus energy for future use. Rather, it intelligently decides at each preceding ‘present’ moment what type of energy should be stored, how much should be stored, and how to optimize the storage path. It makes these decisions based on foreseeing the crisis at time t*.
The conversion efficiency coefficient α i j in Equation (11) and γ i j in Equation (14) are critical parameters that quantify the energy loss during the conversion from energy type j to type i. These coefficients are primarily determined by the physical characteristics of the conversion devices (e.g., heat pumps, electric chillers) and are treated as constants for a given device under normal operating conditions in this study. Their values are summarized in Table 2.
Table 2. Key Energy Conversion Efficiencies.
To achieve this, the strategy constructs a spatiotemporal coordinated scheduling weight θ i ( τ ) (As shown in Equation (12)) for each energy source i. The calculation of this index incorporates two key elements: first, the temporal proximity, which indicates that moments τ closer to t* have reduced energy delivery losses and time decay, thus holding greater scheduling value and priority; second, the resource availability, representing the proportion of the available surplus of a particular energy source at a given moment compared to the total available surplus. By integrating these two factors and normalizing them, the strategy generates a scientific scheduling weight for each energy type at every historical moment, ensuring that the limited energy reserves are allocated to the most needed and effective spatiotemporal nodes.
θ i ( τ ) = R i ( τ ) τ = t t * 1 R i ( τ ) 1 t * τ τ = t s t * 1 ( R i ( τ ) τ = t t * 1 R i ( τ ) 1 t * τ )
where R i ( τ ) is the available resource amount of energy source i at moment τ, and ts denotes the start time for scheduling.
Equation (12) ensures the economic efficiency of the energy storage actions, achieving a unification of ‘flexibility’ and ‘rationality.’
Following this, based on the calculated weights and accounting for the cost losses during the energy storage process, the specific energy allocations to be pre-stored or deployed for the critical moment t* are determined for each historical moment.
A i ( τ ) = θ i ( τ ) t i * ω i t * τ
where A i ( τ ) is the target adjustment amount of energy source i at moment τ, and ωi denotes the storage cost coefficient for energy source i.
Subsequently, the strategy enters the intelligent conversion phase of multiple energy flows. Given that electrical energy possesses a high quality and flexible conversion capabilities, after the initial allocation is completed, the strategy examines whether the allocations for thermal and cooling energy exceed their respective available surpluses. If deficits are identified, the system will activate an intelligent energy routing mechanism, prioritizing the use of electrical energy surpluses for supplementation. This follows a clear hierarchy: thermal energy deficits are addressed first, followed by cooling energy deficits. The conversion process is not conducted without limitation; rather, it is constrained by both the real-time status of electrical energy surpluses and the efficiency of conversion devices. The system accurately computes the electrical energy required for achieving the energy conversion while ensuring that the fundamental allocation tasks for electrical energy are not compromised. This process significantly enhances the collaborative synergy between different forms of energy.
F i j ( τ ) = min ( max ( 0 , A j ( τ ) R j ( τ ) ) , max ( 0 , R j ( τ ) A j ( τ ) ) γ i j )
where γ i j denotes the efficiency of converting energy from source i to source j.
After thoroughly leveraging internal resources and making internal adjustments through energy conversion, the strategy accurately calculates the final energy gap that remains, which is compensated by external systems or backup resources following all optimization measures:
Δ i ( τ ) = max ( 0 , A i ( τ ) R i ( τ ) j i F j i ( τ ) )
where Δ i ( τ ) represents the energy gap for energy source i.
Finally, based on the anticipated effects of the series of optimized scheduling measures, the strategy performs intelligent adjustments to the original load curve at the critical moment t*. By reducing the demands for electrical, thermal, and cooling loads at this moment, the system ensures safe and stable operation while significantly decreasing reliance on costly backup resources.
In summary, this strategy integrates several key processes. These include real-time monitoring, situational forecasting, intelligent energy storage, multi-energy conversion, and load regulation. It integrates them into a coherent and systematic decision-making process. The strategy achieves proactive optimization of multi-energy flows in the microgrid across the time dimension. It also enables flexible inter-support among different energy types. This provides robust technical support for establishing an efficient, reliable, and green microgrid system. The parameters are listed in Table 2.
The conversion process is not conducted without limitation; rather, it is constrained by both the real-time status of electrical energy surpluses and the efficiency of conversion devices. The key parameters for the primary energy conversion and storage components considered in this study, including their typical performance ranges and characteristics, are summarized in Table 2. For the modeling in this work, specific nominal values within these typical ranges are used as constants under the perfect foresight assumption. The framework of the proposed strategy is illustrated in Figure 2.
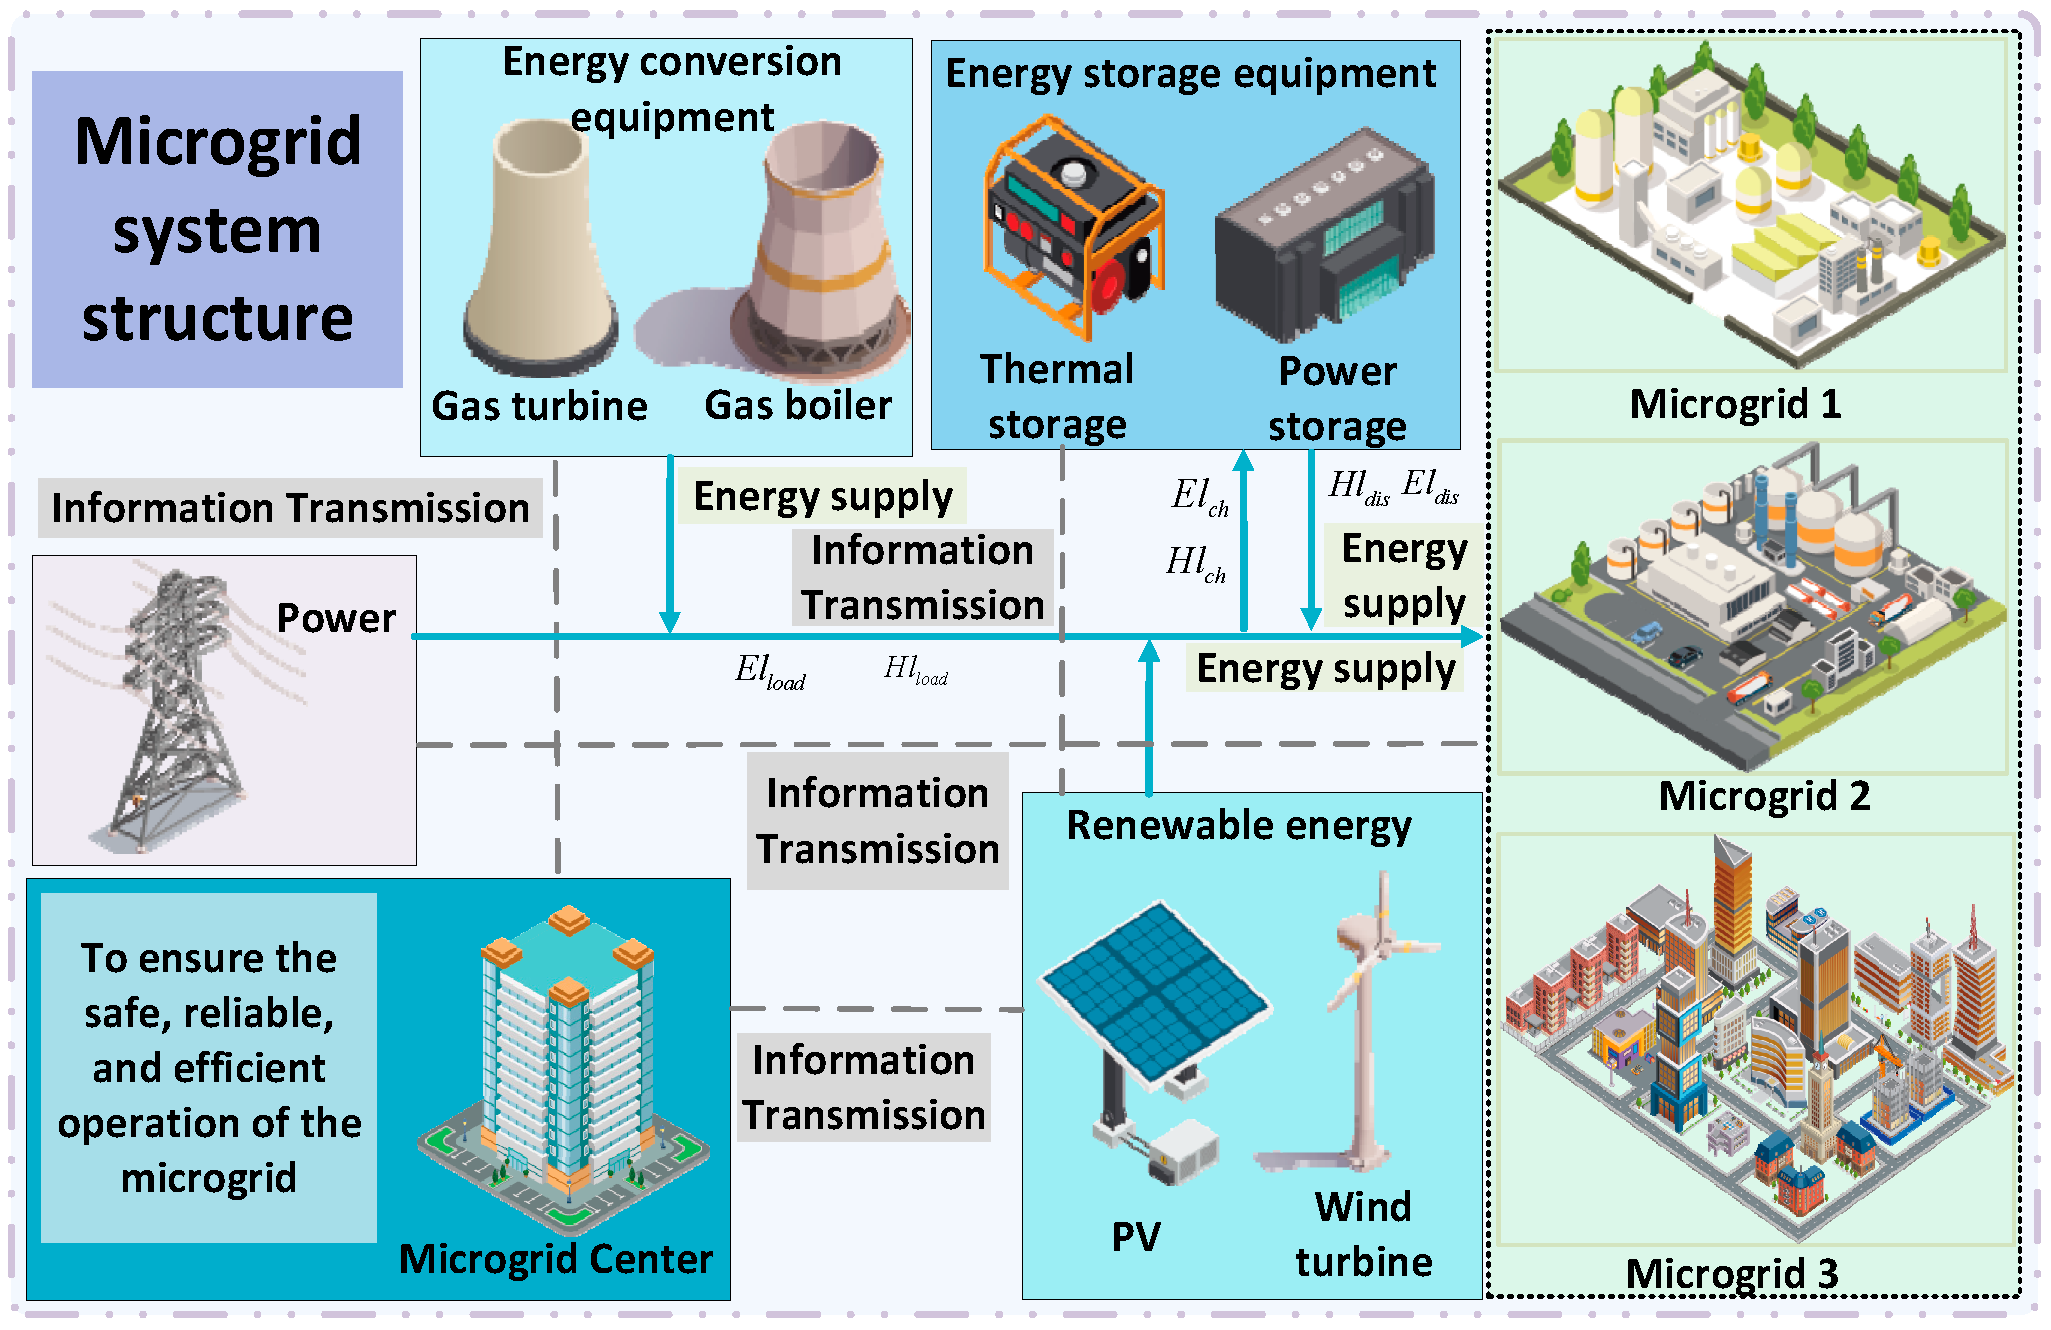
Figure 2. Framework diagram of the proposed strategy.

3. Multi-Objective Self-Adaptive Hybrid Enzyme Optimization

3.1. Self-Adaptive Hybrid Enzyme Optimization (SHEO)

Enzyme Action Optimization Algorithm (EAO) [] is a novel meta-heuristic algorithm that mimics the enzyme mechanism in biological systems. Enzymes, as specialized proteins, accelerate chemical reactions by binding to molecules. Subtle structural changes between enzymes and substrates can enhance reaction rates without consuming enzymes. This algorithm addresses optimization problems by leveraging adaptive mechanisms—selective binding, conformational changes, and cofactor regulation—to promote substrate conversion in complex environments.
The EAO employs random initialization, meaning the positions of substrates are randomly generated.
S x p i t = B l + ( B u + B l ) R a E A , R a E A ~ U 0 , 1 1 × D i
where S x p t is the initial position; Bl is the lower bound of the search space; Bu is the upper bound of the search space; denotes the element-wise multiplication operator.
The enzyme update formula in the EAO is as follows:
S x p i t = R a E A sin ( i t M x i t S x p i t 1 ) + S x b e s t i t S x p i t 1
where S x b e s t t is the position of the optimal solution; it is the current iteration; Mxit is the maximum number of iterations.
During the EAO iteration, the positions of two substrate candidate solutions are generated, with the enzyme position representing the optimal solution. Through adaptive factor and enzyme concentration exploration and adjustment, the formula is as follows:
S x p 1 i t = C E 1 E s + C E 1 i t M x i t ( S x e i t S x p i t 1 ) + S x p i t 1 S x p 2 t = C E 2 E s + C E 2 i t M x i t ( S x e i t S x p i t 1 ) + S x p i t 1 E s = S x p i t 1 S x q i t 1 , p , q { 1 , , n p } ,   p q C E 1 = 0.1 + ( 1 0.1 ) R a E A C E 2 = 0.1 + ( 1 0.1 ) τ 1
where S x e t is the enzyme position; C E 2 is the random variation value of the enzyme concentration; C 1 is the value of the enzyme concentration; τ 1 is a random number between 0 and 1; S x p 1 t is the position of the first candidate solution; S x p 2 t is the position of the second candidate solution; Es is the difference between two randomly selected distinct individuals.
The EAO updates the global optimum, with the formula as follows:
i f   F S x p i t < F S x e i t 1 S x e i t = S x p i t , F S x e i t = F S x p i t
where F · is the fitness function.
However, the initialization of positions in the EAO relies entirely on a uniform random distribution, which may limit the global exploration capability of the initial solutions. The randomness in the algorithm primarily stems from random numbers within [0, 1] and the difference between randomly selected individuals, lacking an exploration mechanism capable of substantial leaps. The variation patterns of enzyme concentration and adaptive factors in EAO are relatively simplistic, primarily dependent on random numbers and linear iterative relationships, making it difficult to adapt to the search requirements of different phases. The two candidate solutions in EAO are updated through the current optimal solution and random individual differences, resulting in a lack of diversity.
The Segment-based Perturbation Initialization method is introduced to ensure that the initial population covers the entire search space more uniformly and extensively, thereby accelerating the convergence trend in the early stages of the algorithm. The improved position initialization is described as follows:
S x p i t = S x p i t + R a E A ( 1 τ 2 S x p i t ) , S x p i t 0.5 ( 1 2 τ 3 S x p i t ) , S x p i t > 0.5
where τ 2 and τ 3 are random numbers between 0 and 1.
By incorporating an offset compensation mechanism, a systematic bias is introduced to the search direction, guiding the population toward more promising regions and enhancing the algorithm’s ability to escape local optima. The improved enzyme position update formula is given as follows:
S x e i t = S x p i t 1 ( 1 τ 4 ) τ 4 + ( 1 i t M x i t ) S x p i t 1
where τ 4 is a random number between 0 and 1.
To decelerate the rate of temporal change and prolong the exploration phase, a nonlinear search strategy is adopted to generate periodic variations, thereby avoiding premature convergence caused by monotonically decreasing patterns. The formula is given as follows:
S x p 1 i t = ε 1 ( S x e i t S x p i t 1 ) + ε 2 e ( S x e i t S x p i t B u B l ) tan ( i t M x i t ) S x p i t 1 ε 1 = ( 2 i t M x i t 1 ) τ 2 + 2 ε 2 = 2 i t M x i t τ 2 τ 3
where ε 1 and ε 2 are stochastic iterative exploration factors.
By adopting a multi-source fusion approach, the variation in perturbation intensity is controlled to facilitate a smooth transition from strong to weak perturbation. Leveraging the information from the search process, diverse and enriched search directions are generated through relative difference-driven mechanisms. The improved candidate solution formulation is given as follows:
S x p 2 i t = ( l + S x p i t 1 S x q i t 1 S x e i t S x p i t 1 ) a + ( S x e i t S x p i t 1 ) + γ ( 1 + sin ( i t M x i t ) S x p i t γ = 1 e ( ( a i t M x i t ) a )
where a is the distance weighting value; l is the proportion value, and γ is the dynamic weighting value.

3.2. Multi-Objective Self-Adaptive Hybrid Enzyme Optimization (MOSHEO)

Based on the adaptive hybrid enzyme optimization algorithm, high-quality solutions are screened through dominance relationships, while grid and crowding distance mechanisms are employed to maintain solution diversity, thereby preserving and updating the non-dominated solution set. The model aims to find not a single optimal solution, but a set of optimal trade-off solutions. The Pareto dominance relationship is formulated as follows:
n { 1 , , N } , P n Q n   a n d   n { 1 , , N } , P n Q n P Q ( n , P n Q n ) ( n , P n Q n )
where P and Q are objective vectors, and N is the number of objective functions.
The dominance relation serves as a method for comparing the relative quality of solutions. It is used to identify solutions that are not worse in all objectives and are better in at least one objective—known as non-dominated solutions. Construct a set of individual pairs. For each pair of individuals in the set, compute the dominance relation:
X = { a , b a b , a , b { 1 , , n p } } R d a , b = dominates k a , k b R D b = 1 ,   if   ( j D l   = b a b , l a b = 1   0 ,   else  
where dominates k a , k b is the dominance judgment function; RDb = 0 indicates that individual b is non-dominated; RDb = 1 indicates that individual b is dominated.
Crowding distance measures the distance between a solution and its adjacent solutions in the objective space. The formulas for the crowding distance of internal individuals and the total crowding distance are as follows:
D c i t , n = k i t + 1 , n k i t 1 , n k n max k n min D C i t = n = 1 N D c i t , n
where k t + 1 , n k t 1 , n is the direct distance in the objective space between an individual and its immediately adjacent left and right neighbors after sorting.
During the iterative process of a multi-objective optimization algorithm, when new solutions are obtained, they are typically compared with existing solutions in the external archive to decide how to update the archive. The multi-objective optimization is implemented through the following steps:
(1)
Initialize the repository to store non-dominated solutions.
(2)
Update the grid by dividing the objective space into multiple hypercubes to manage the distribution of solutions.
(3)
Select leaders from the repository to guide individuals toward the Pareto front.
(4)
Adjust the repository using crowding distance: when the number of solutions in the repository exceeds the set limit, remove solutions with smaller crowding distances to maintain diversity.
To further evaluate the comprehensive performance of the MOSHEO algorithm, this paper conducts an in-depth analysis from the perspective of time complexity. In terms of time complexity, the main computational overhead of the MOSHEO algorithm stems from key steps such as initialization, fitness evaluation, population update, and maintenance of the non-dominated solution set. Let the population size be nP, the number of objective functions be M, the maximum number of iterations be Mxit, the dimension of decision variables be D, and Cf represent the computational complexity of the fitness function. Detailed analysis shows that the time complexity of the initialization phase is O(nP·D), the fitness evaluation phase is O(Mxit·nP·Cf), the population update process is O(Mxit·nP·D), while the non-dominated sorting and crowding distance calculation requires O (Mxit · M·nP2) computational resources. Overall, the total time complexity of the MOSHEO algorithm can be expressed as O (Mxit·nP·(D + M nP + Cf)), which is on the same order of magnitude as classical multi-objective optimization algorithms, demonstrating the algorithm’s feasibility and effectiveness in engineering applications.
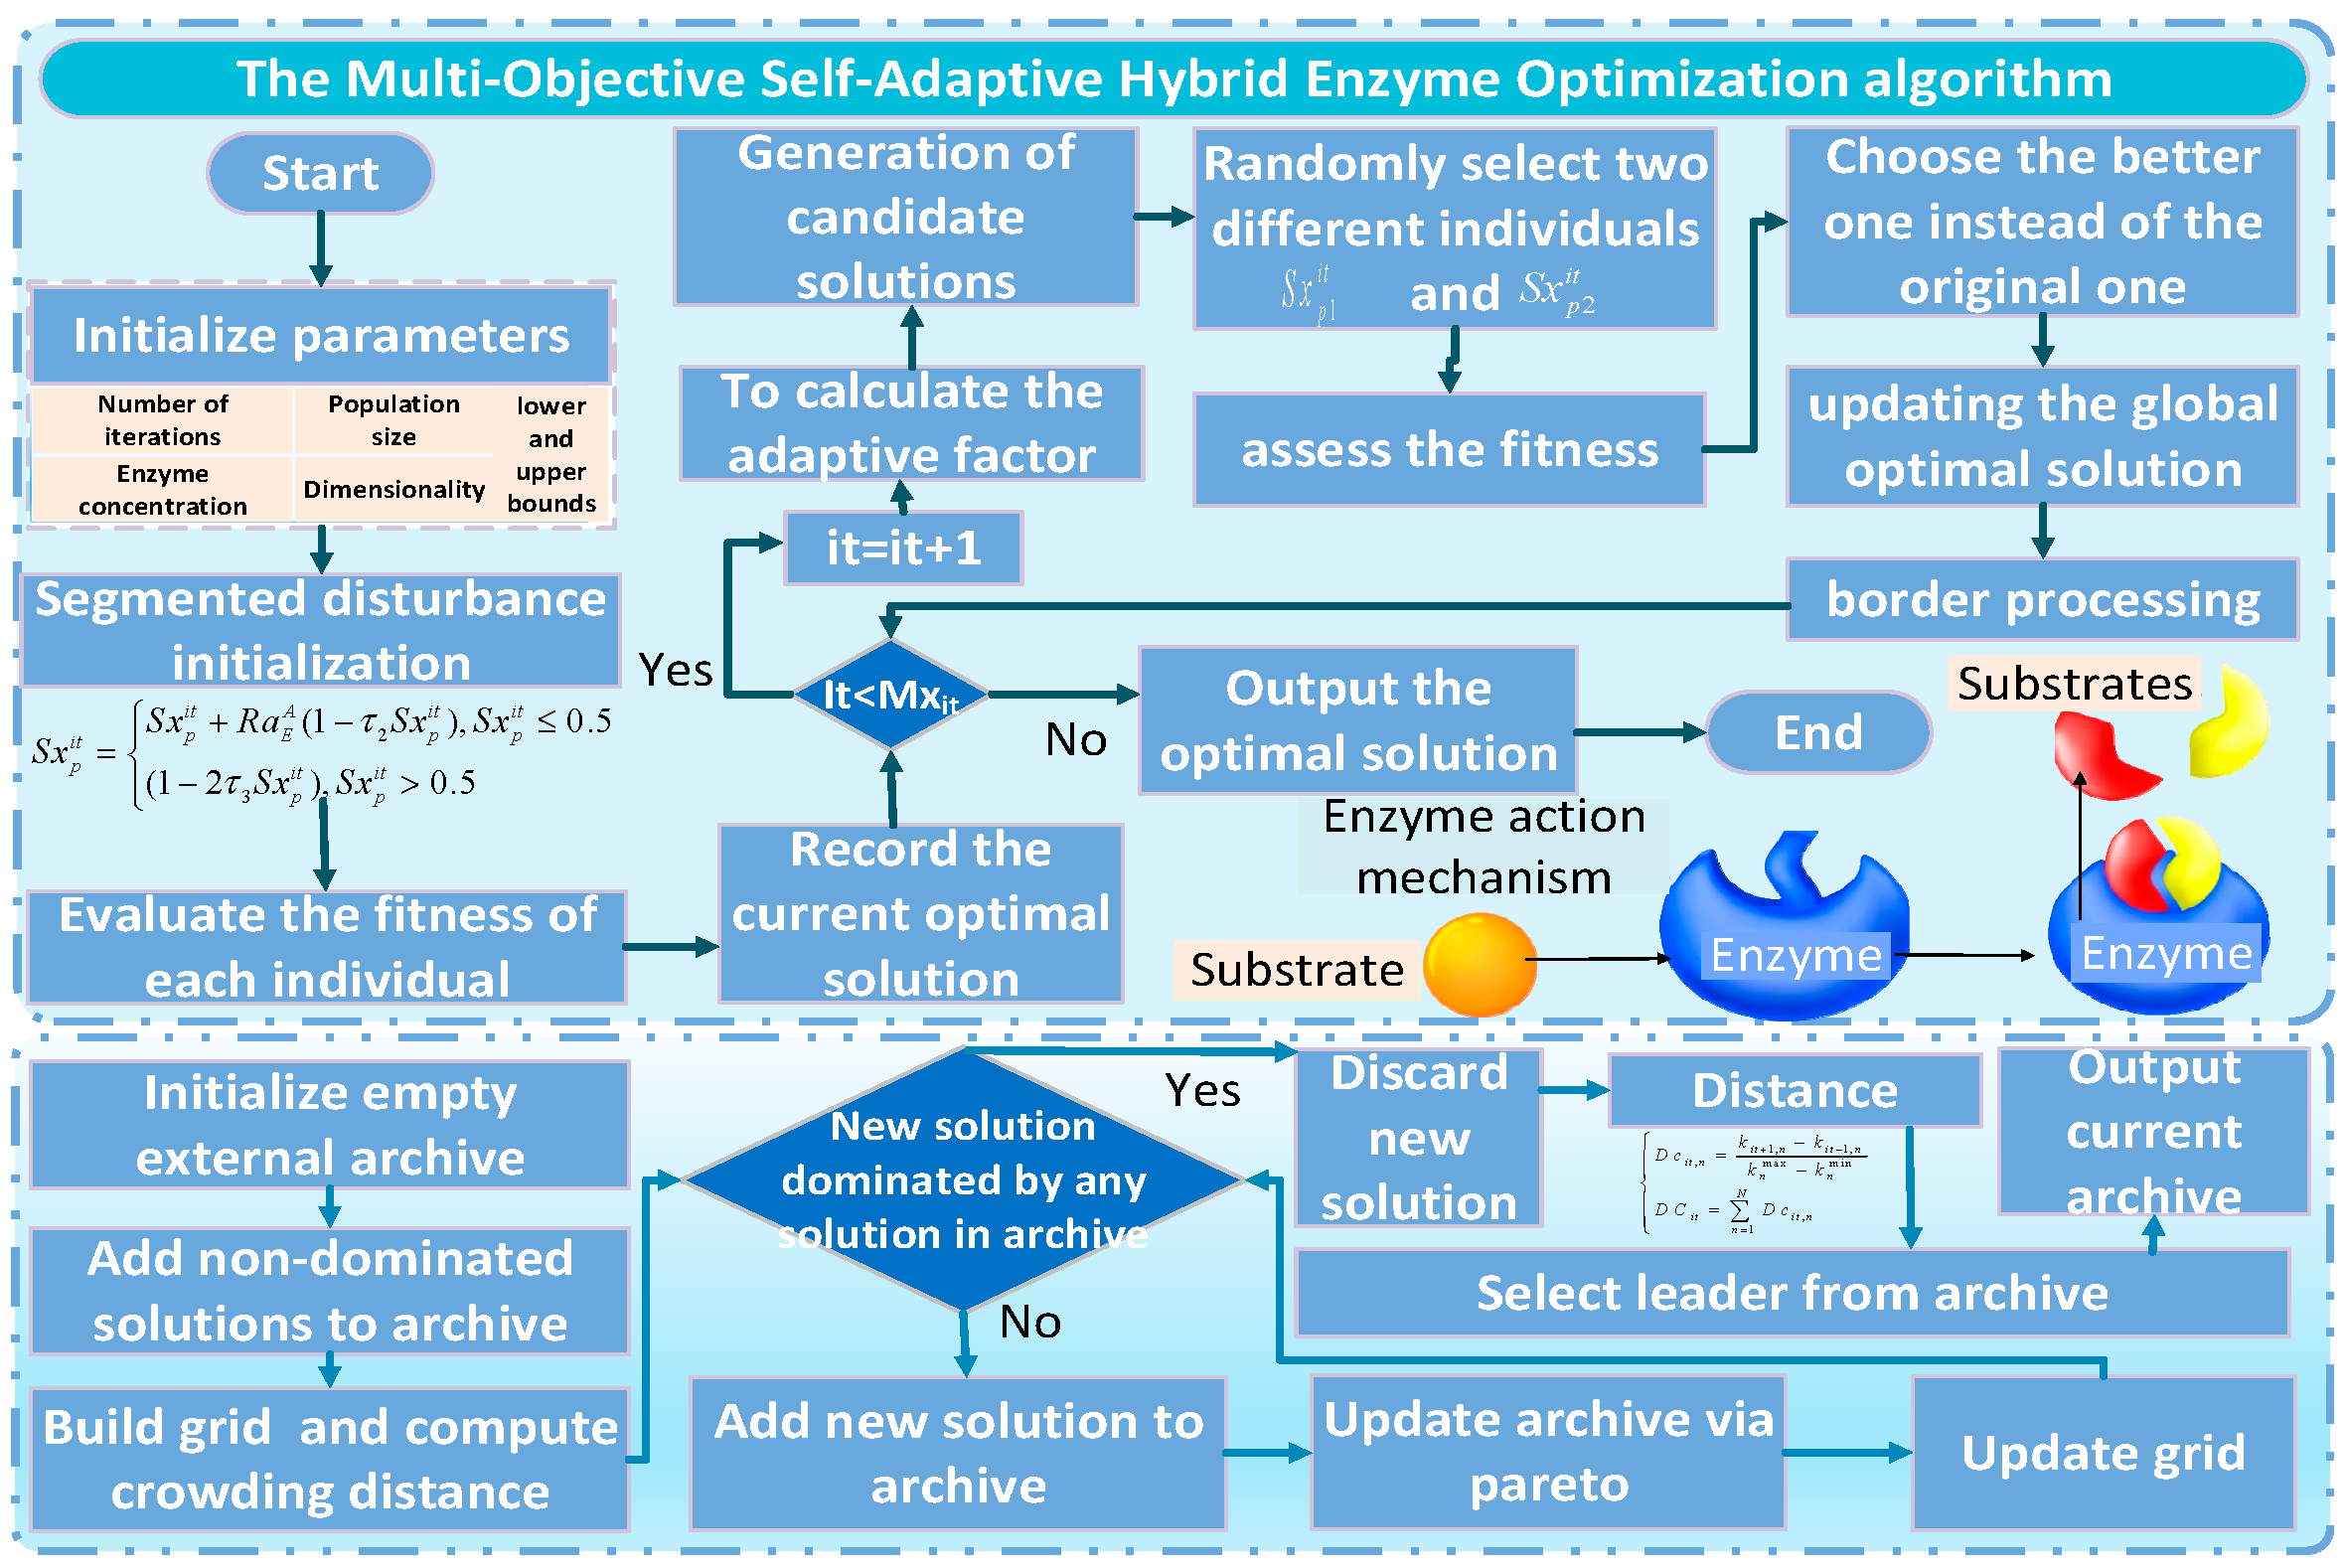
The flowchart of the Multi-Objective Self-Adaptive Hybrid Enzyme Optimization algorithm is shown in Figure 3.
Figure 3. The flow chart of MOSHEO.

3.3. Optimization Process of Multi-Source Sensing Information-Driven Flexibility and Resilience Optimization Model of Microgrids

The specific solution process of this study is as follows:
  • Model establishment and data preparation: Obtain the load curves of electricity, heat, and cooling, predict the output of wind and solar power, and establish the objective function and constraints of the microgrid optimization model.
  • Initialization and solution: Set the algorithm parameters, use the optimization solver for preliminary scheduling, identify the moment of maximum power deficit, and perform energy time-shifting and complementarity through a flexible energy storage and intelligent conversion strategy.
  • Optimization and decision-making: Update the solutions using the optimization algorithm and select the non-dominated solutions to store in the external repository. Obtain the final optimized solution based on crowding distance sorting.
  • Case verification: Verify the competitiveness and universality of the proposed strategy through comparative analysis of multiple cases.
The specific solution process is shown in Figure 4.
Figure 4. The solution process of the microgrid scheduling model.

4. Case Study

The case studies in this chapter were implemented using MATLAB (2019b). The Gurobi Optimizer was used for initial model solving, while the proposed MOSHEO and comparison algorithms were coded and executed in the same environment to ensure a fair comparison.
To validate the effectiveness and superiority of the dynamic pressure-aware spatiotemporal collaborative optimization scheduling strategy proposed in Section 2 and the MOSHEO algorithm designed in Section 3, this chapter designs a comprehensive case study comprising three distinct validation levels. Case 1 aims to test the fundamental performance of the MOSHEO algorithm by comparing it with mainstream multi-objective optimization algorithms on standard test functions and the microgrid optimization model, thereby demonstrating its capability to solve the model established in this paper. Case 2 conducts a comprehensive application validation, intended to showcase the feasibility, economy, and robustness of the proposed complete scheduling framework (the integration of the strategy and the algorithm) under various scenarios, including normal and extreme weather conditions. Case 3 provides a comprehensive evaluation from both investment economics and environmental externality perspectives. This includes capital expenditure analysis using Net Present Value (NPV) and Internal Rate of Return (IRR) metrics across multiple investment scenarios, sensitivity analysis of electricity price spreads and equipment degradation impacts, as well as pollution cost quantification and its influence on system dispatch behavior through multi-scenario sensitivity studies. These cases will clearly show the complete logical chain from the theoretical model to the algorithm solution and then to the final scheduling scheme.

4.1. Case 1: Algorithm Performance Testing

(1)
Standard Multi-objective Benchmark Functions
To validate the effectiveness of the Multi-Objective Self-Adaptive Hybrid Enzyme Optimization, a comparative analysis was conducted against the Multi-Objective Whale Optimization Algorithm (MOWOA) [] and Multi-Objective Optimal Power Flow (MOOPF) [], the Multi-Objective Enzyme Action Optimizer (MOEAO) and the improved Multi-Objective Self-Adaptive Hybrid Enzyme Optimization (MOSHEO). The parameters of all algorithms are listed in Table 3. The parameters in Table 3 are defined as follows: nP represents the population size, Mxit denotes the maximum number of iterations, and WCmax indicates the maximum repository capacity. The parameter C1 serves as the perturbation control coefficient for both MOSHEO and MOEAO, regulating the intensity of systematic bias introduced during the enzyme position update process, which is crucial for balancing exploration and exploitation. The parameter l functions as the proportion value in MOSHEO’s multi-source fusion strategy for generating candidate solutions, contributing to the maintenance of search diversity. Meanwhile, r represents an inherent control parameter in MOWOA that influences the spiral update mechanism during the search process. The parameter configurations for the comparison algorithms (MOEAO, MOWOA, and MOOPF) were set according to the default values recommended in their respective foundational literature [,,] to ensure a fair and consistent performance comparison.
Table 3. Parameter settings for Case 1.
The performance of the algorithms was tested using multi-objective test functions ZDT3, ZDT6, UF1, and UF3. A comparative analysis of MOSHEO, MOEAO, MOOPF, and MOWOA was conducted to validate the effectiveness and superiority of the proposed MOSHEO algorithm. The comparative results of the multi-objective optimization algorithms are presented in Table 4, Table 5 and Table 6.
Table 4. Comparison of IGD indicators.
Table 5. Comparison of SP indicators.
Table 6. Comparison of HV indicators.
As can be seen from Table 4, Table 5 and Table 6, for the ZDT3 test function, the proposed MOSHEO algorithm achieved the best mean IGD value of 0.0052, compared to the worst value of 0.0537 by MOOPF. MOSHEO’s result represents an approximately 7.7% improvement over MOEAO’s value of 0.0056. Furthermore, MOSHEO attained a mean SP value of 0.0026, which is lower than MOEAO’s 0.0071 and MOWOA’s 0.0081, indicating a more uniform distribution of its solution set. Across all four test functions, MOSHEO ranked first in the mean IGD metric and demonstrated a smaller standard deviation in IGD compared to MOEAO, MOWOA, and MOOPF, confirming its superior convergence and stability. Regarding the HV metric, using the UF4 test function as an example, MOSHEO achieved the best mean value of 0.28037, followed by MOEAO’s 0.27766, reflecting MOSHEO’s superior overall coverage in the objective space. In summary, based on the performance comparison across these three metrics, the MOSHEO algorithm performs optimally in terms of convergence, diversity, and uniformity of solution set distribution.
To investigate the influence of key parameters on the performance of MOSHEO, this study selected the population size nP and the perturbation control parameter C1 for sensitivity testing. The results are presented in Table 7. The experiments were based on the ZDT3 test function, using the IGD metric as the evaluation criterion.
Table 7. Parameter Sensitivity Analysis.
Table 7 results indicate that the algorithm achieves optimal performance in terms of convergence accuracy and stability when nP = 100 and C1 = 0.1. The parameter C1 significantly affects the perturbation intensity, where values that are too large or too small can lead to performance degradation. The population size nP, on the other hand, requires a balance between diversity and computational efficiency.
(2)
Practical Microgrid Multi-criteria Optimization
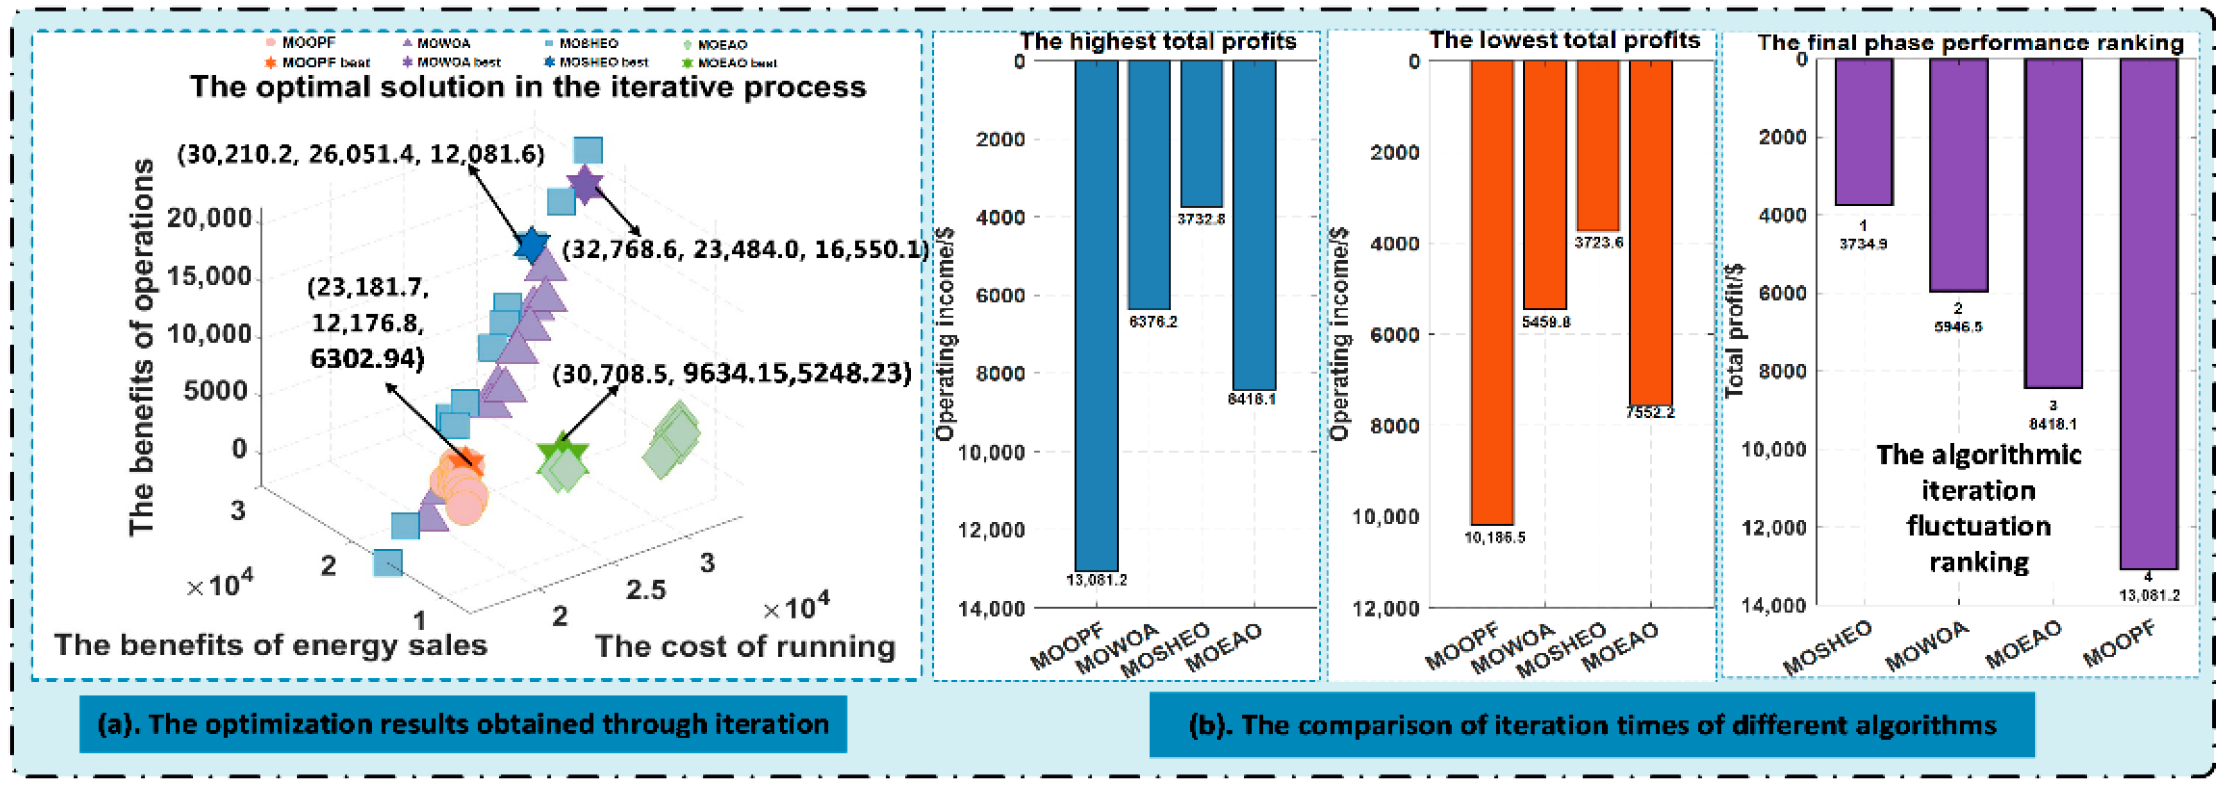
To further demonstrate the superiority of the MOSHEO Pareto front and its effectiveness in the microgrid model, the overall performance of four different algorithms was compared in terms of economic benefits and the variation in the objective function over 50 iterations, as shown in Figure 5.
Figure 5. The economic benefits and iteration record. (Note: MOSHEO achieves the highest total profit of USD 7922.8, demonstrating superior economic efficiency and resource allocation. MOSHEO demonstrates stable and superior convergence characteristics).
As observed in Figure 5a, MOSHEO achieves the highest energy sale revenue of USD 26,051.4, with a total profit (calculated as the sum of operational revenue and energy sale revenue minus energy purchase costs) of USD 7922.8, representing the best overall profitability. Although MOWOA attains the highest operational revenue of USD 16,550.1, its excessively high energy purchase cost of USD 32,768.6 and relatively lower energy sale revenue of USD 23,484.0 result in a lower total profit compared to MOSHEO. Both MOOPF and MOEAO yield negative total profits, indicating significantly inferior performance. MOSHEO demonstrates the most effective resource allocation, as it maintains relatively low purchase costs, maximizes energy sale revenue, and sustains considerable operational revenue, thereby optimizing the total system profit. From the convergence performance over 50 iterations shown in Figure 5b, it can be seen that MOSHEO maintains relatively stable overall performance. MOOPF converges to the worst solution, while MOWOA shows moderate stability and some optimization capability. In conclusion, when solving optimization problems in the microgrid model, the MOSHEO algorithm outperforms the other algorithms in both convergence performance and stability, leading to enhanced profitability.
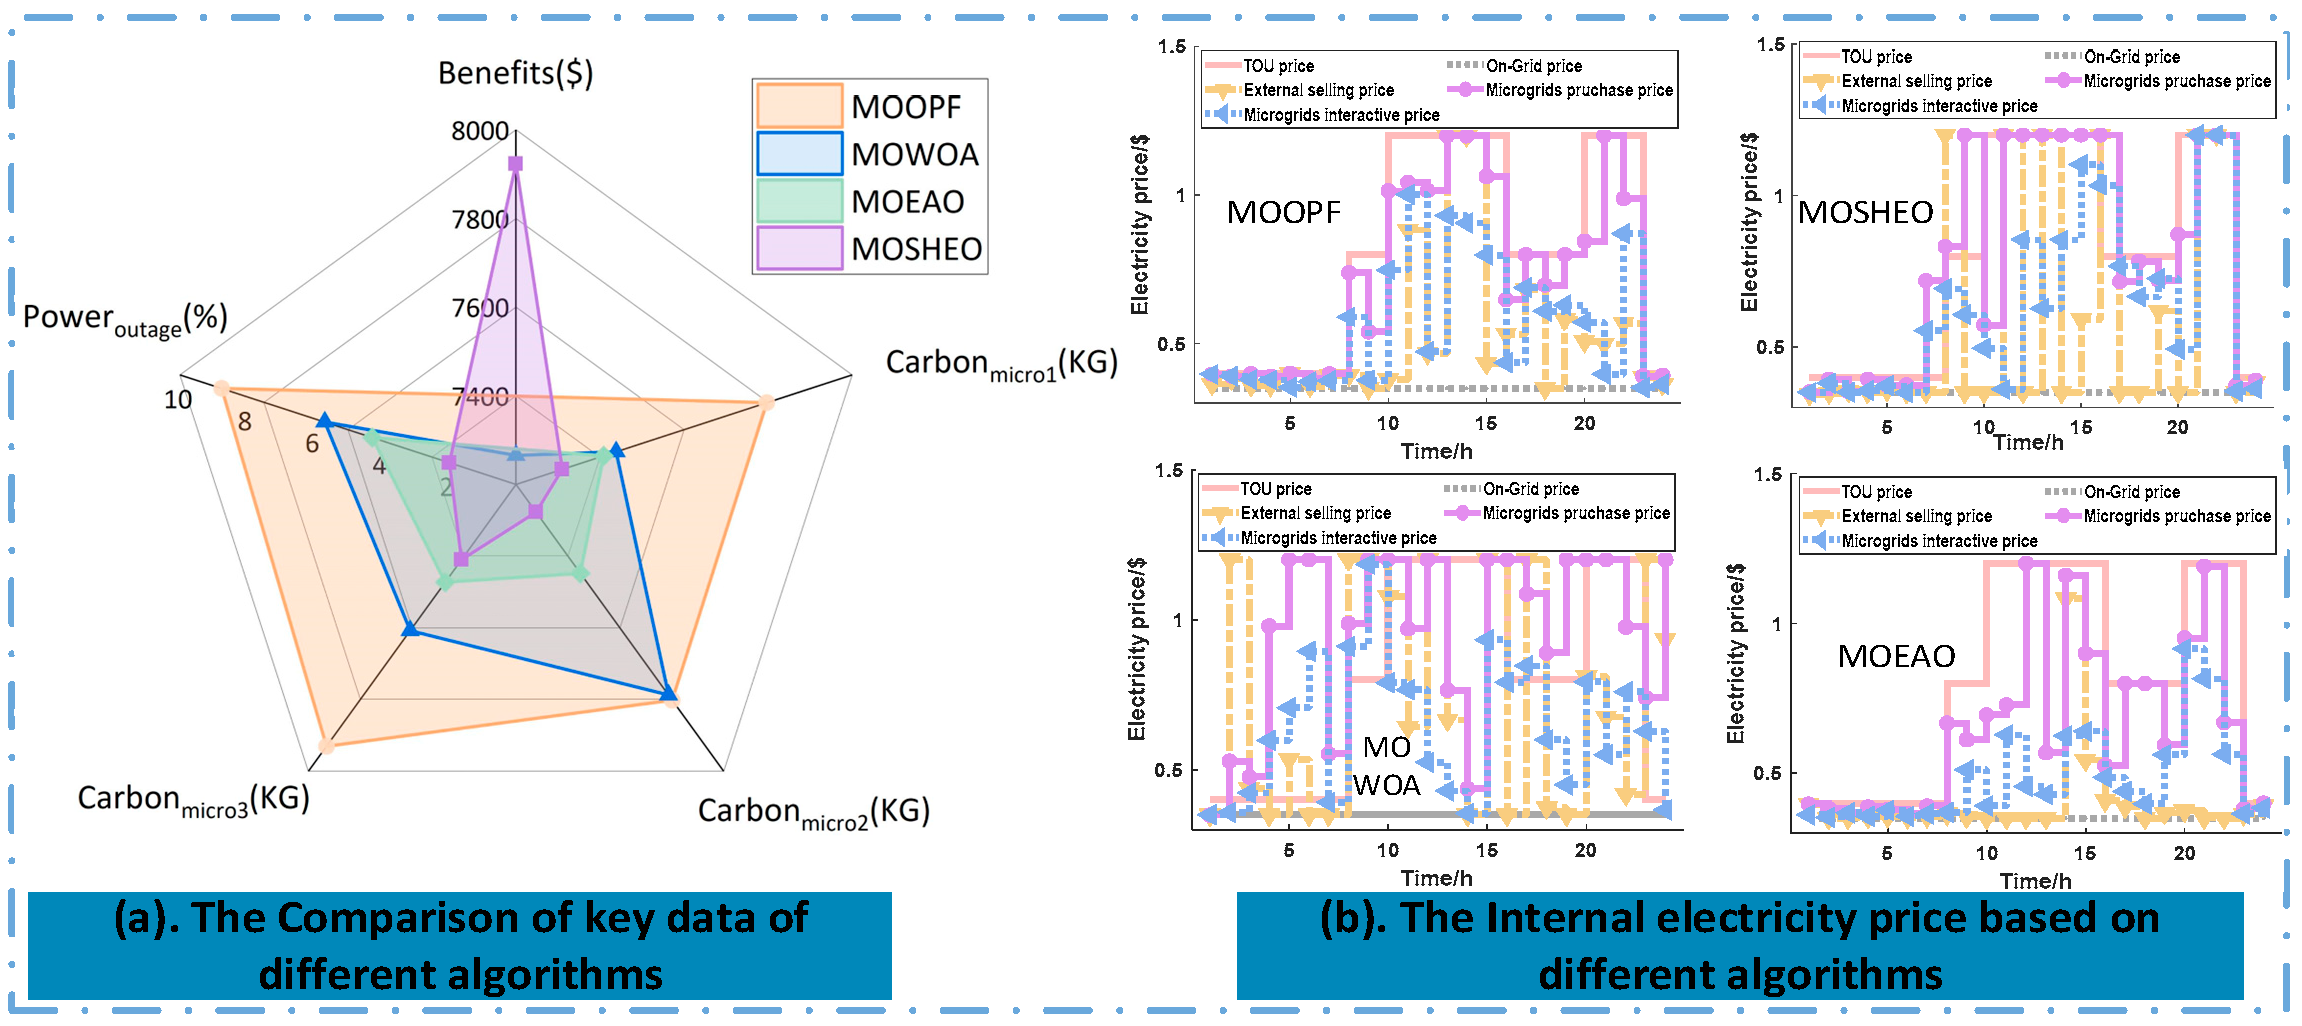
To demonstrate the utility of MOSHEO in power systems, system carbon emissions and reliability (measured by loss of load probability) are considered to verify the performance of MOSHEO in real microgrid problems. Figure 6 shows the profit, the carbon emissions of the microgrid, and the probability of failure, which are the three most important goals in the actual scheduling.
Figure 6. The Comparison of key data of different algorithms. (Note: The MOSHEO algorithm finds the optimal balance among the three conflicting objectives: economy, environmental friendliness, and reliability, while also achieving an economically viable price range.).
As shown in Figure 6a, MOSHEO achieves the highest economic benefit at USD 7922.8. For the carbon emissions across the three microgrid load zones, it records the lowest values on all three indicators, along with the best reliability, exhibiting a power outage probability of only 1.98%. MOWOA achieves a relatively high economic benefit of USD 7265.5; however, its carbon emissions performance is significantly worse than MOSHEO and MOEAO, though still better than MOOPF. MOEAO and MOOPF show poor economic performance, with benefits of −USD 15,826.12 and −USD 4701.96, respectively, indicating operational losses. MOOPF also has the worst reliability, with a power outage probability of 8.76%. These results demonstrate that the MOSHEO algorithm successfully identified the best compromise solution within the Pareto optimal set when solving this complex multi-objective problem. It effectively explores the solution space, ensuring system economy while simultaneously pursuing low carbon emissions and high reliability.
In Figure 6b, MOSHEO’s external electricity selling price for microgrids demonstrates high synergy with the time-of-use electricity price, the temporal trend of the internal microgrid electricity price, and the peak-valley periods: during peak electricity consumption hours such as 10:00 and 20:00, the external selling price synchronously forms peaks, while during off-peak hours like 5:00, the price remains stable in the low range. In contrast, the MOOPF’s external selling price curve exhibits high dispersion, while MOEAO shows flattened peaks and intense fluctuations during non-peak hours. MOSHEO’s external selling price is concentrated within the range of USD 0.35–USD 1.2, with a peak-valley difference of USD 0.85. This difference is sufficient to guide microgrids to shift electricity purchases away from peak hours through price incentives, without causing decision-making chaos due to an excessively large price gap. MOSHEO’s peaks are sharp and occur exclusively during time-of-use peak hours, while the valleys are anchored to a baseline. The economic viability of the price range between USD 0.35 and USD 1.2 not only ensures predictable electricity purchase costs for microgrids during peak hours but also stimulates energy purchases during off-peak hours through stable valley prices.

4.2. Case 2: Feasibility Verification of Load Scheduling Strategies Under Different Proportions of Renewable Energy

Case 2 is designed to validate the process of flexible energy storage and intelligent conversion under two distinct scenarios: normal conditions and extreme weather conditions. The definition of these scenarios is crucial for interpreting the results. The ‘normal conditions’ scenario employs typical diurnal profiles for solar irradiance, wind speed, and ambient temperature, representative of a clear and moderate day. In contrast, the ‘extreme weather’ scenario is defined to simulate a severe cold wave combined with heavily overcast skies, characterized by a significant reduction in renewable generation and a simultaneous spike in heating demand. The key parameters distinguishing these two scenarios are quantified in Table 8.
Table 8. Scenario Definition for Case 2.
Prior to delving into the detailed scheduling outcomes, the impact of the optimization time step (Δt) on the strategy’s performance was investigated. The identification of the critical pressure moment (t*) and the pre-emptive energy allocation are inherently influenced by the temporal resolution of the data. A finer time step can capture load and generation variations more accurately but at a higher computational cost. To illustrate this trade-off, the scheduling strategy was tested under the normal condition scenario using time steps of 15 min, 30 min, and 1 h. Key results, including the identified critical moment, the corresponding power deficit, and the computation time, are summarized in Table 9.
Table 9. Impact of Optimization Time Step on Scheduling Results (Normal Conditions).
As observed in Table 9, a finer time step (e.g., 15 min) can pinpoint the pressure moment with higher temporal precision (18:45 instead of 19:00) and yields a larger estimated power deficit, as it captures steeper power ramps that are smoothed out by coarser time steps. However, this comes at a significant computational overhead, with the 15 min step requiring approximately 9 times the computation time of the 1 h step. Considering the need for a balance between modeling accuracy and computational efficiency for day-ahead scheduling applications, a time step of 1 h is adopted for all subsequent analyses in this paper. This choice effectively captures the major daily trends while maintaining manageable computational requirements.
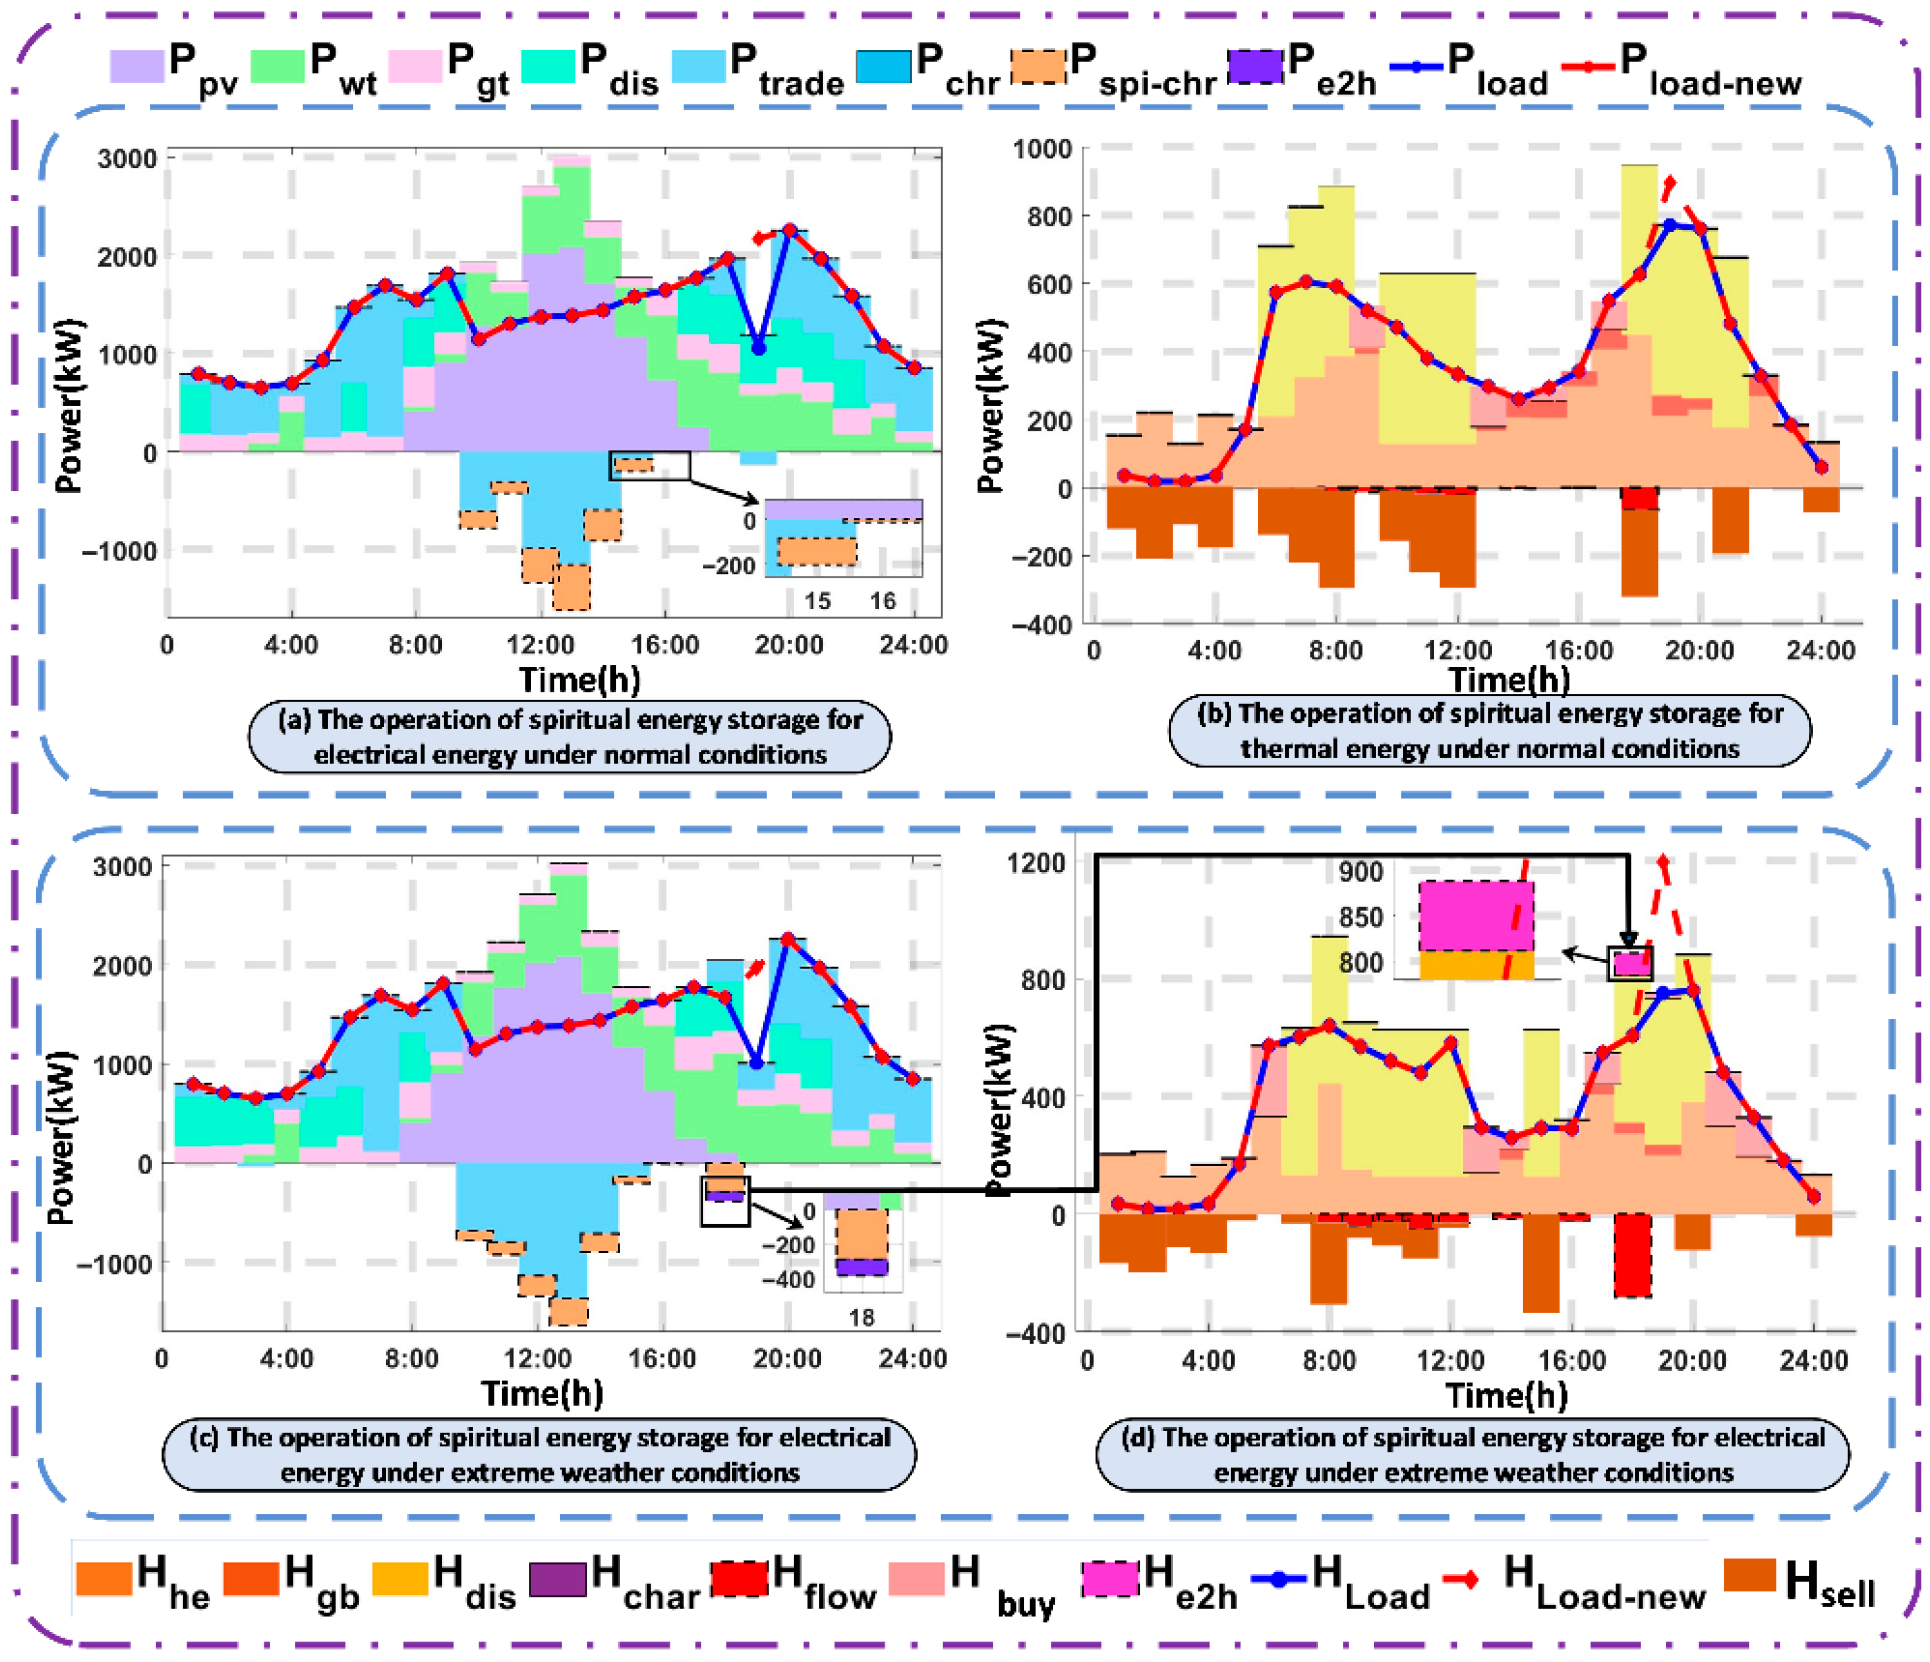
Under the defined scenarios and with a 1 h time step, the proposed strategy is tested. Figure 7 shows the electricity and heat stack charts under normal conditions and extreme weather.
Figure 7. Electricity and heat balance diagrams under normal conditions and extreme weather. (Note: The strategy effectively addresses a 444.46 kW thermal shortfall under extreme weather by converting electricity to heat).
Figure 7a,b show the electricity and heat stack charts under normal conditions. First, it can be seen that the energy of the microgrid is always in balance. For Figure 7a, the key pressure moment calculated by the strategy is 19:00, with an electricity load deficit of 1120.00 kW. After the strategy is implemented, the electricity deficit at 19:00 is eliminated, and the load is scheduled and allocated in advance from 10:00 to 15:00 using a dynamic pressure perception and spatiotemporal collaborative optimization scheduling strategy. The highest electricity allocation is at 13:00, reaching 468.19 kW. In Figure 7b, the heat load deficit is 124.46 kW, which is also transferred using the strategy. The highest heat allocation is at 18:00, reaching 65.78 kW. Figure 7c,d show the balance of electricity and heat in the microgrid under extreme weather conditions. However, compared with Figure 7b, the heat deficit in Figure 7d reaches 444.46 kW at 19:00, and the internal heat energy cannot fill the deficit at this moment using flexible energy storage. At this time, intelligent conversion transforms 95.87 kW of electrical energy at 18:00 into heat energy, as indicated by the black arrow in the figure, which represents the transfer of energy.
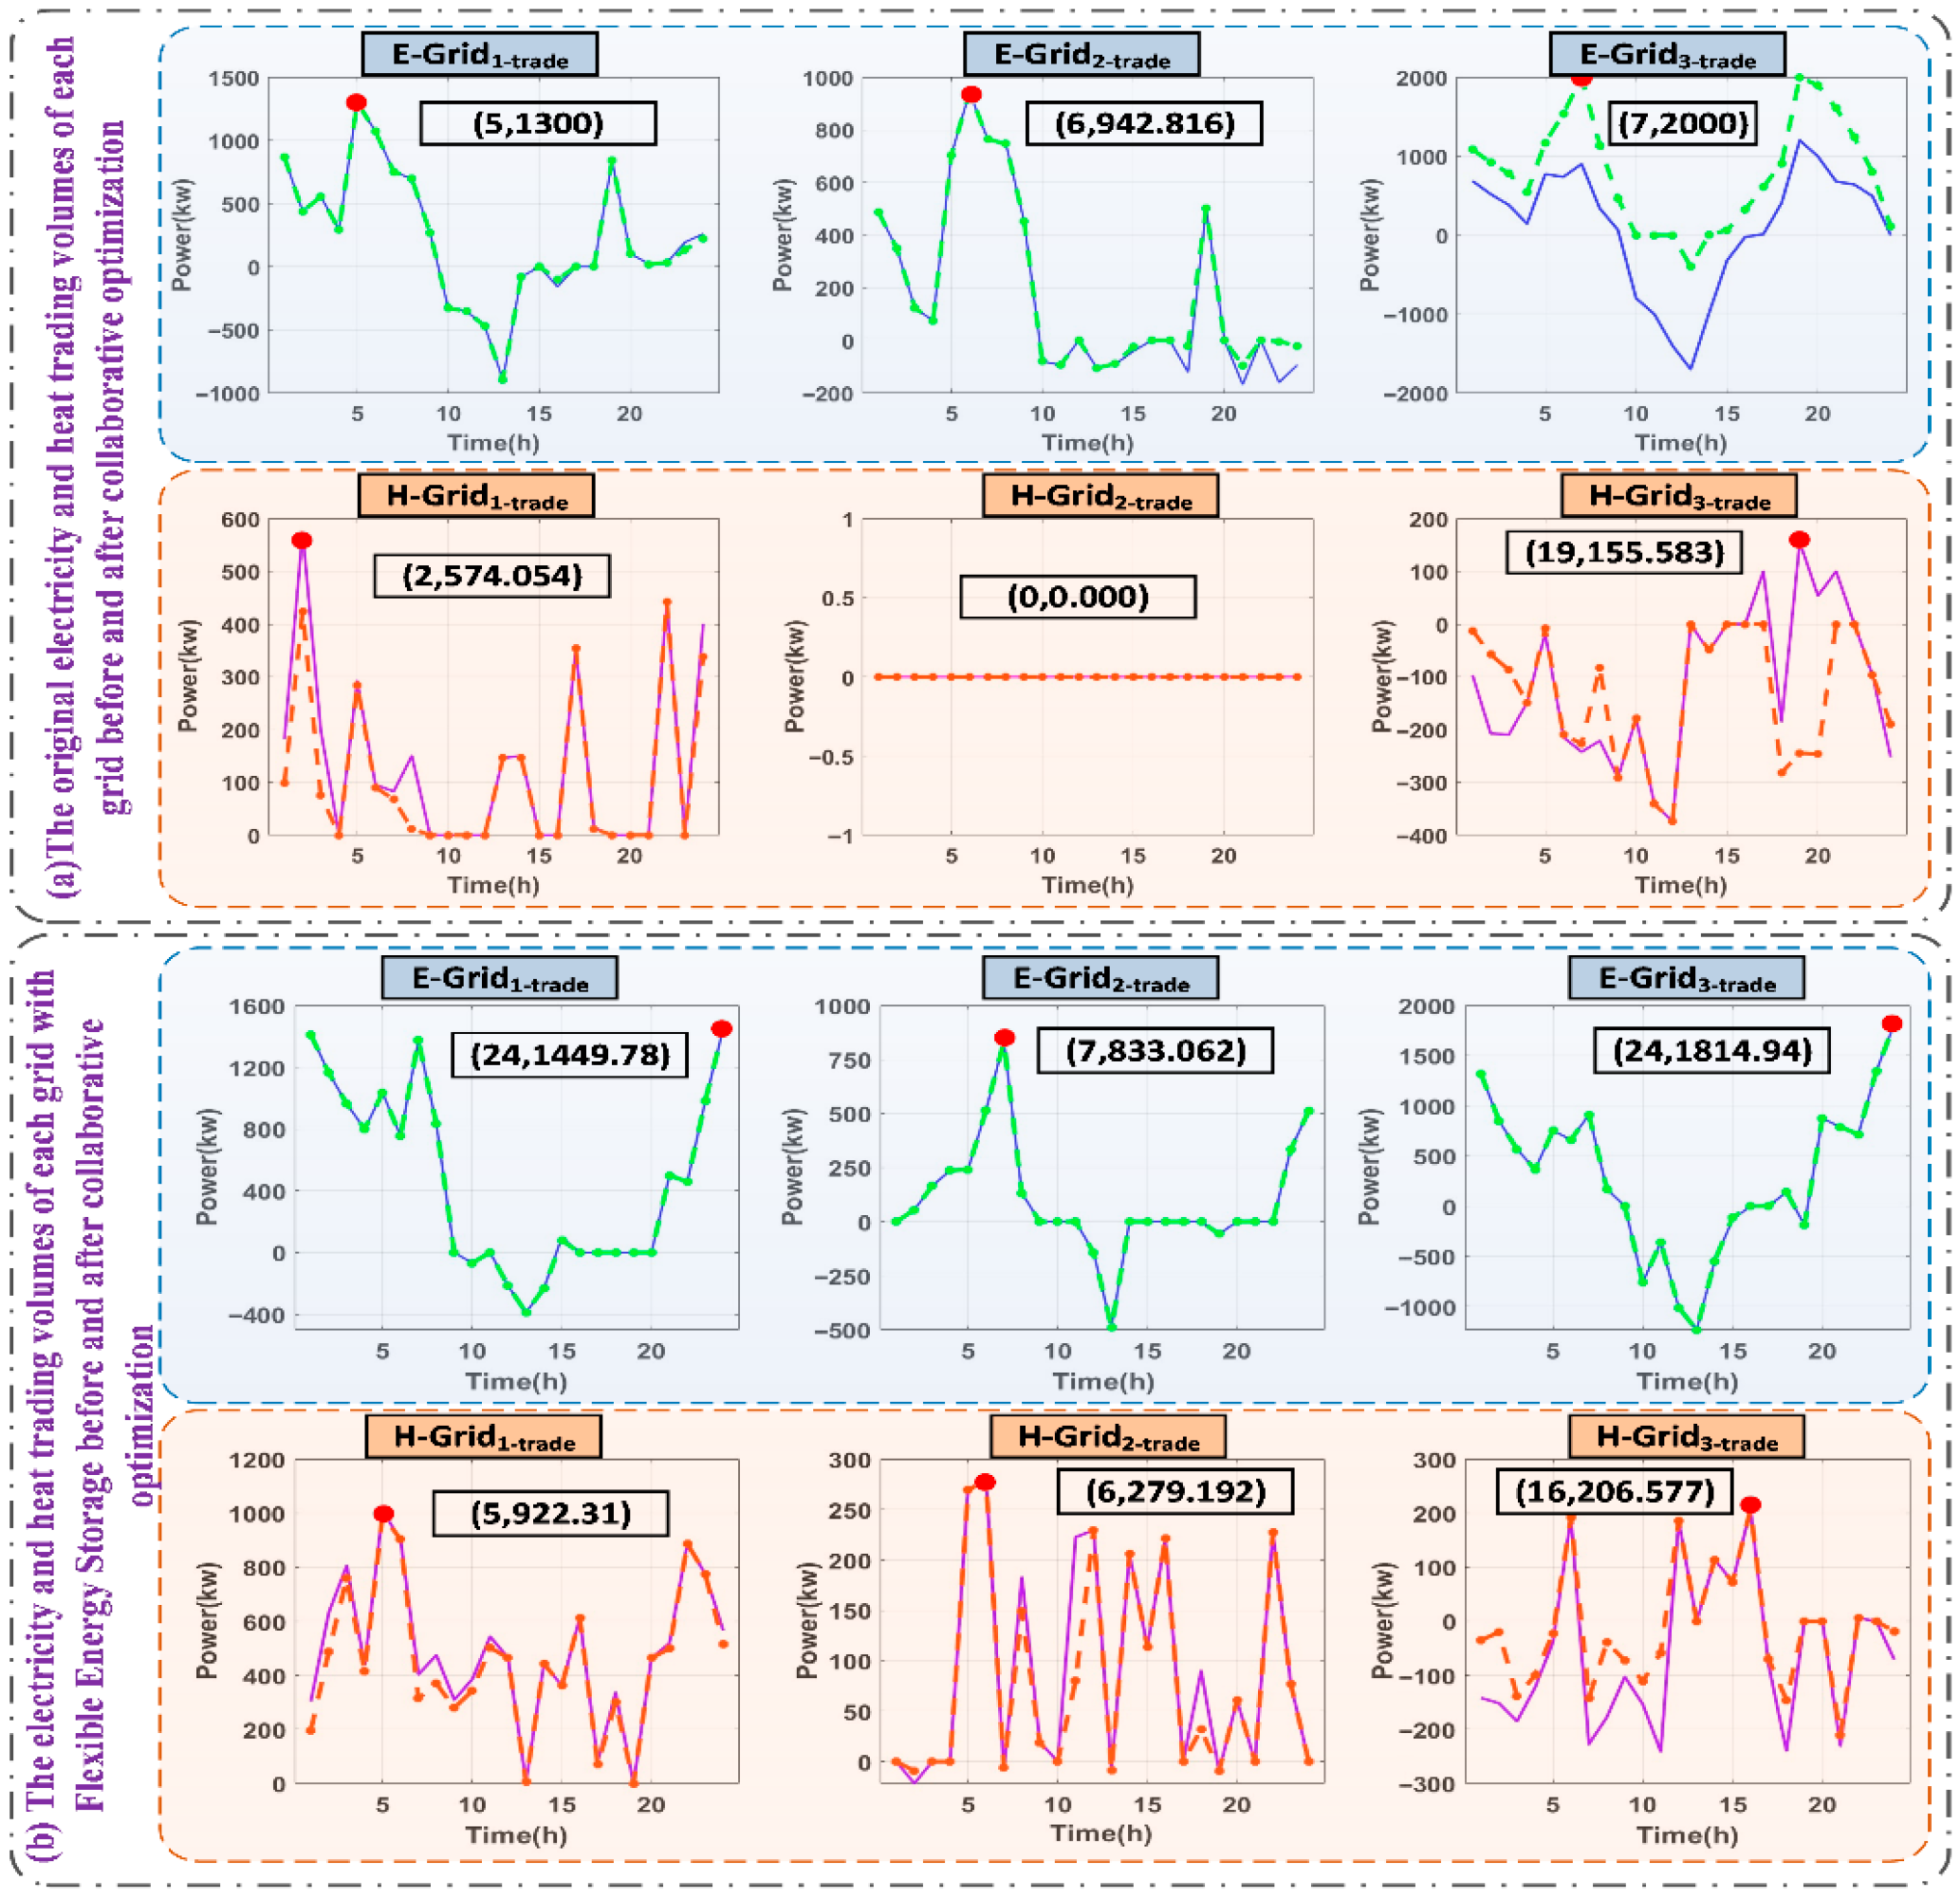
In Figure 8, the blue solid line represents the electricity purchased from or sold to the grid when each microgrid operates independently; the green dashed line indicates the net trading power between each microgrid and other microgrids or energy suppliers after internal coordination. Similarly, the purple solid line represents the heat energy purchased from or sold to the heat supplier when each microgrid operates independently; the red dashed line indicates the net trading power between each microgrid and other microgrids or energy suppliers after internal coordination. From Figure 8a, it can be seen that for electricity, before the introduction of flexible energy storage, the difference in trading power between the internally coordinated microgrid and Microgrid 3 operating independently is significant, with the maximum difference occurring at 13:00, approximately 1300 kW. For heat energy, before the introduction of the flexible energy storage framework, the maximum difference in heat trading occurs at 19:00, approximately 400 kW. Figure 8b shows that after the introduction of flexible energy storage and intelligent conversion, the net trading power of electricity between the internally coordinated microgrid system and the grid operating independently is completely identical, while the difference in heat trading is minimal, with the maximum difference occurring at 1:00, only about 176.3435 kW. This indicates that flexible energy storage significantly enhances the coordinated control efficiency of electricity and heat energy among grids. It is important to note that the case study presented here assumes the electrical and thermal networks within the microgrid cluster have sufficient capacity (i.e., E l i n e m a x and H p i p e m a x are large enough) to accommodate the calculated optimal energy exchanges. This assumption allows for a clear demonstration of the coordination benefits achievable by the proposed strategy itself. The model formulated in Section 2.2, however, is capable of incorporating binding network constraints, which would be a critical factor in large-scale or congested network applications.
Figure 8. Energy trading diagrams between microgrids before and after the introduction of flexible energy storage (Note: The implementation of flexible energy storage reduces the microgrid cluster’s electricity trading imbalance from 1300 kW to zero and the thermal energy imbalance from 400 kW to 176.34 kW, significantly enhancing multi-energy coordination).
This assumption allows for a clear demonstration of the coordination benefits achievable by the proposed strategy itself. The model formulated in Section 2.2, however, is capable of incorporating binding network constraints. To illustrate this capability and assess the strategy’s robustness under practical physical limits, we analyze a scenario with a line capacity limit E l i n e m a x = 1000   kW and a pipe capacity limit H p i p e m a x = 300   kW . The key comparisons are summarized in Table 10.
Table 10. Impact of Network Constraints on System Performance.
The results demonstrate the strategy’s ability to handle constraints and reveal their specific impact. The electrical network constraint ( E l i n e m a x = 1000   kW ) is not binding, as the maximum scheduled power transfer (468.19 kW) is well below the limit. Consequently, the electrical load deficit is still fully eliminated through internal coordination. In contrast, the thermal network constraint ( H p i p e m a x = 300   kW ) is binding at 18:00, where the required thermal transfer (312.46 kW) exceeds the pipeline capacity. This bottleneck disrupts the spatiotemporal scheduling path, preventing the system from fully preparing for the subsequent critical moment at 19:00. As a result, a residual thermal load deficit of 13.84 kW remains at 19:00, which must be covered by purchasing energy from external sources at a higher cost, leading to the observed increase in total operating cost. This analysis quantitatively shows how network constraints can curtail coordination benefits and underscores the importance of the proposed model in identifying such critical bottlenecks.
To further validate the generality and effectiveness of the proposed strategy under different energy structures, sensitivity analyses with varying renewable energy penetration levels were conducted. The penetration level is defined as the ratio of the total available renewable generation (photovoltaic and wind) to the total electrical load within the scheduling horizon. The base case presented in Section 4.2 represents the highest penetration scenario (50%) considered in this study. Three additional scenarios with lower penetration levels—Low, Medium, and High—were simulated by proportionally scaling down the renewable generation outputs while keeping the load profiles unchanged. The key performance metrics, including the eliminated power and thermal deficits at the critical moment and the maximum allocated energy, are summarized in Table 11.
Table 11. Strategy Performance under Different Renewable Energy Penetration Levels.
As illustrated in Table 11, the proposed strategy consistently and effectively eliminates the anticipated energy deficits across all penetration levels. In the Low penetration scenario, the system faces a more severe power deficit (1550.25 kW) due to limited renewable resources, and the strategy responds by scheduling a larger amount of energy in advance (max allocation of 615.80 kW). As renewable penetration increases, both the magnitude of the deficit and the required pre-allocated energy decrease monotonically. This is because the system inherently has more surplus renewable energy available for direct use or conversion during peak hours. This clear trend demonstrates the strategy’s inherent adaptability and scalability. It effectively modulates its actions based on the system’s energy state, proving its robustness and value across a spectrum of microgrid systems with renewable penetration levels up to 50%.
In summary, Case 2 demonstrates the universality, effectiveness, and feasibility of the dynamic pressure perception and spatiotemporal collaborative optimization scheduling strategy under different weather conditions.

4.3. Case 3: Economic Feasibility, Pollution Cost and Sensitivity Analysis

To comprehensively evaluate the investment economics of the proposed dynamic pressure-aware and spatiotemporal collaborative optimization strategy, an analysis was conducted on the capital expenditure (CAPEX) feasibility of introducing flexible energy storage systems (including electrical and thermal storage) and key energy conversion equipment (such as heat pumps and electric chillers). The assessment utilized two key financial metrics, NPV and IRR, and performed multi-scenario sensitivity analyses.
As shown in Table 12, three electricity price scenarios were analyzed: baseline, price spread increased by +20%, and price spread decreased by −20%. The impact of an annual capacity degradation rate of 2% for the energy storage equipment on operational revenue was considered. Under the baseline scenario (50% renewable energy penetration), the proposed strategy results in an average annual operational cost saving of approximately USD 12,500. With the baseline investment cost (USD 150,000) and baseline operational savings (USD 12,500/year), the project has an NPV of USD 18,250 and an IRR of 10.8%. The IRR exceeds the 8% capital cost, indicating the project is financially feasible under baseline conditions. Scenario 3 demonstrates excellent economics, with a high NPV of USD 62,750 and an IRR of 17.5%, indicating strong investment attractiveness. Scenario 2 is economically feasible and can provide excess returns for investors. Conversely, Scenario 1 is not feasible under the current operational revenue (NPV < 0, IRR < 8%), highlighting the importance of technological innovation and policy support to reduce energy storage system costs.
Table 12. Flexible Energy Storage System Investment Cost Scenarios (Unit: USD/kW).
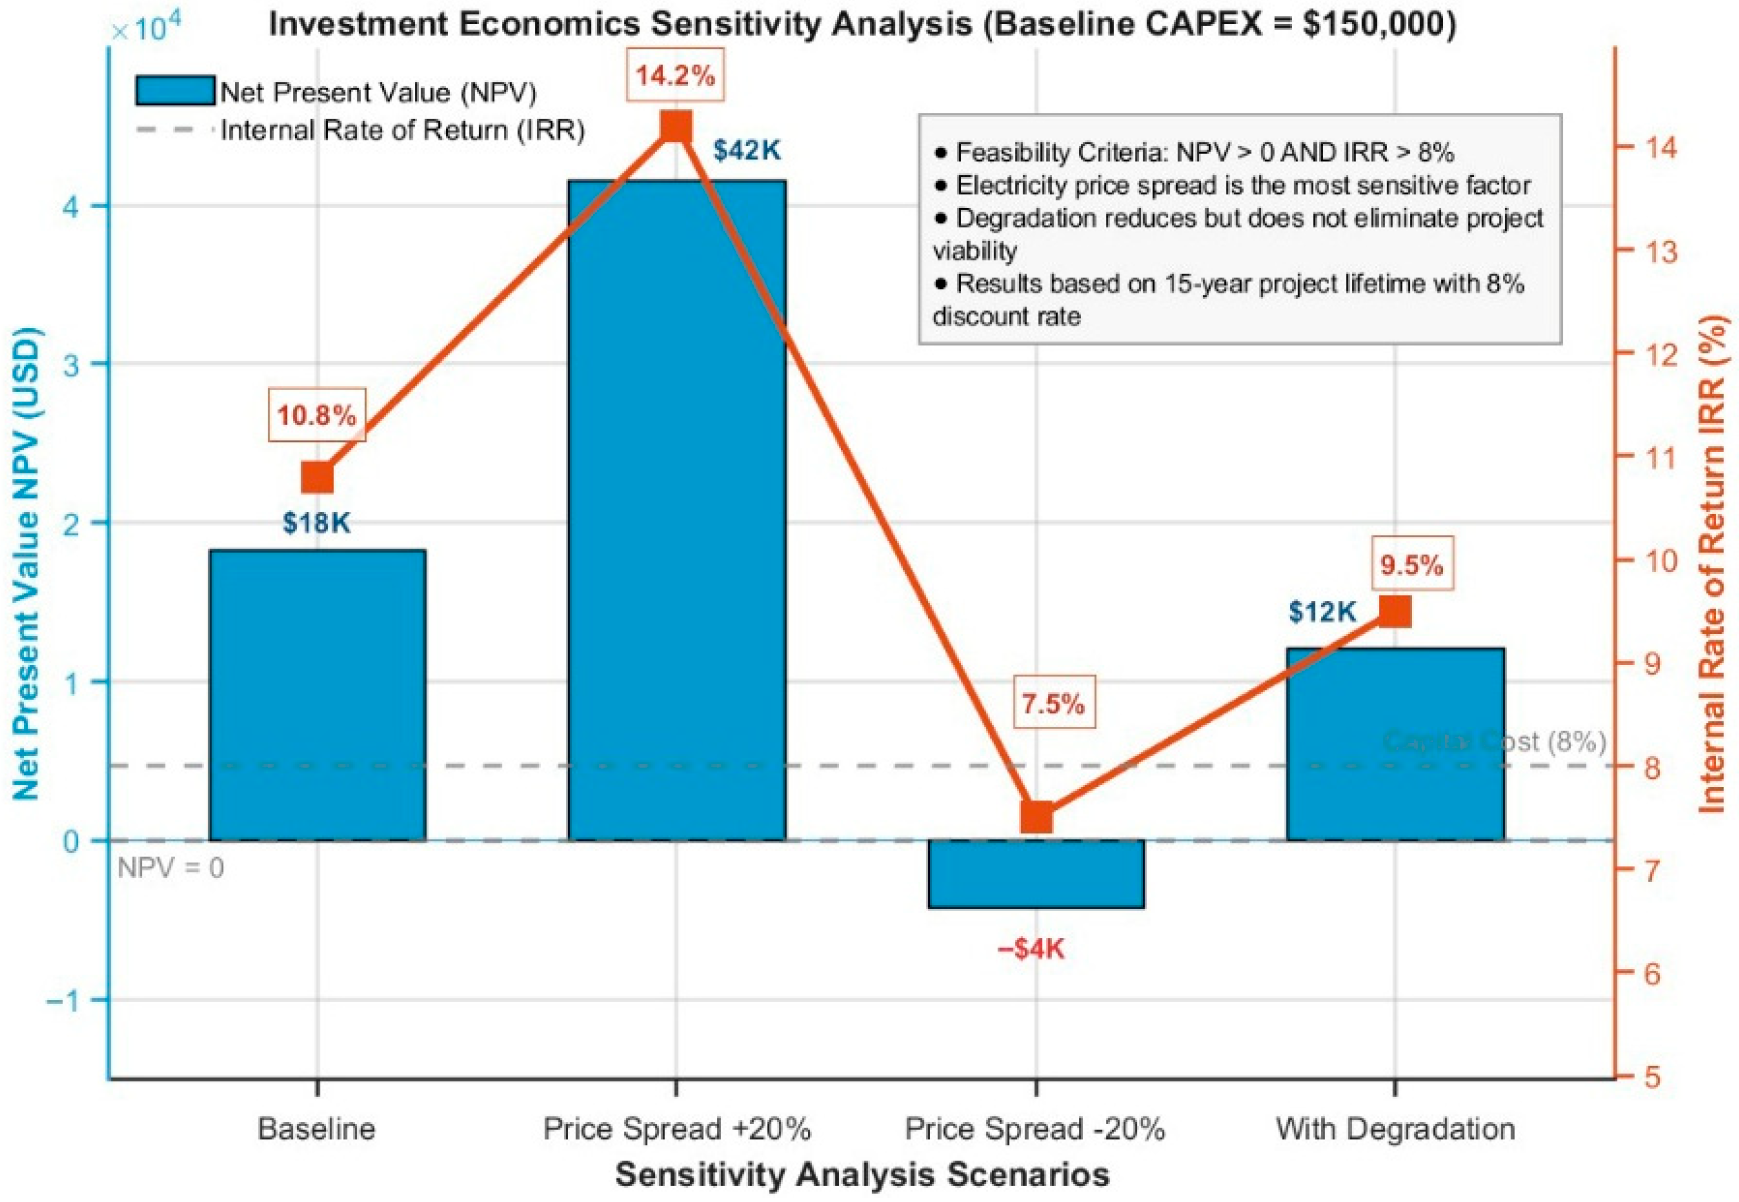
A sensitivity analysis based on the benchmark investment scenario (scenario 2) is performed, and the results are shown in Figure 9.
Figure 9. Comparative analysis of sensitivity (Note: The investment viability is highly sensitive to electricity price spreads, with a +20% change altering NPV from −USD 4200 to USD 41,500, while a 2% annual degradation rate reduces the IRR from 10.8% to 9.5%).
As shown in Figure 9, the electricity price spread significantly impacts economics. When the price spread increases by 20%, the annual operational revenue increases to approximately USD 14,800, the NPV rises to USD 41,500, and the IRR increases to 14.2%. Conversely, when the price spread decreases by 20%, the NPV drops to −USD 4200 and the IRR falls to 7.5%, bringing the project to the breakeven edge. This indicates that ensuring reasonable peak-valley price spreads in electricity market mechanism design is crucial for incentivizing flexible energy storage investment. Considering the annual capacity degradation of 2% for the energy storage equipment leads to a slight year-on-year decrease in operational revenue in the later stages of the project. Under these conditions, the NPV decreases to USD 12,100 and the IRR drops to 9.5%. Although the project remains feasible, the degradation effect cannot be ignored. In practice, optimized battery management systems and dispatch strategies are needed to mitigate degradation, and this should be considered more precisely in financial models. In summary, the buy/sell electricity price spread is the most critical external factor affecting project economics, while equipment degradation is the primary technical risk.
To ensure transparency, the sources of the parameters used to calculate pollution costs are summarized in Table 13.
Table 13. Parameters and Sources for Pollution Cost Coefficient.
To further clarify the quantitative impact of microgrid dispatch on environmental externalities, a sensitivity analysis was conducted on the pollution cost. The changes in key system operation indicators under different pollution costs were analyzed, and the results are shown in Table 14.
Table 14. Sensitivity Analysis Results for Pollution Cost.
As shown in Table 14, the introduction of the pollution cost effectively guides the system dispatch behavior. When Kpoll increases, the optimization algorithm significantly reduces the output of costly gas-fired units (decreased by 8.0% in the strict scenario), shifting instead to purchasing more power from the main grid. Although the total operational cost increases slightly, it successfully achieves a reduction in carbon emissions (−8.0%). The analysis reveals the direct impact of environmental pricing on microgrid operational strategy. Under the “Lenient Scenario,” the lower pollution cost leads to increased output from gas-fired units and a corresponding rise in carbon emissions. This indicates that a reasonable cost signal reflecting the true environmental damage is crucial for incentivizing low-carbon operation in microgrids. Across the three scenarios, the proposed dynamic pressure-aware and spatiotemporal collaborative optimization framework operates stably and provides optimal dispatch schemes under different environmental constraints. The relatively small variation in total operational cost (from −0.5% to +1.7%) demonstrates the strategy’s effectiveness in balancing economic and environmental objectives.

5. Conclusions

Focusing on the challenges of multi-energy flow coupling, dynamic uncertainties, and insufficient robustness under extreme conditions in microgrid systems within the context of the “dual carbon” goals, this paper conducted research on a dynamic pressure-aware and spatiotemporal collaborative optimal scheduling strategy and the MOSHEO. The scientific originality of this work is primarily reflected in the following aspects, validated through theoretical modeling, algorithm design, and multi-scenario case studies:
A novel scheduling paradigm centered on “Dynamic Pressure Awareness” and “Flexible Energy Storage.” This constitutes the core conceptual originality of our research. We have moved beyond the conventional energy storage paradigm of mere “energy time-shifting” by establishing a closed-loop intelligent decision-making framework of “state perception—dynamic assessment—flexible energy storage—intelligent conversion—load optimization.” This framework enables the system to proactively identify future critical pressure moments (t*) and perform spatiotemporally optimal pre-allocation of multi-energy flows. The case studies confirm the paradigm’s effectiveness, successfully eliminating a 1120.00 kW electrical and a 124.46 kW thermal load shortfall at 19:00 through proactive scheduling. Under extreme weather, it ensured stability by converting 95.87 kW of electricity to heat, addressing a 444.46 kW thermal deficit.
The inventive development of the Multi-Objective Self-adaptive Hybrid Enzyme Optimization (MOSHEO) algorithm. To address the limitations of the original Enzyme-inspired Optimization Algorithm, we introduced key innovations, including segmented disturbance initialization, nonlinear time-varying factors, and a multi-source fusion strategy. These improvements are original contributions to the algorithm itself, significantly enhancing its global exploration and convergence performance. The algorithm’s superiority was demonstrated by an approximately 99.3% improvement in the IGD metric on ZDT6 and an SP metric of 0.0026 on ZDT3. In the microgrid scheduling case, MOSHEO achieved a total profit of USD 7922.8, significantly outperforming its counterparts.
Comprehensive validation demonstrating transformative performance gains. The originality of this work is also evidenced by the substantial and comprehensive improvements achieved. The proposed strategy balanced electrical, thermal, and cooling loads effectively, reducing operating costs by approximately 15.3% and improving overall energy utilization efficiency by 18.7% compared to conventional methods. Under extreme conditions, the system maintained 99.2% availability, limiting the cost increase to within 8.5%, showcasing its exceptional robustness and economic resilience.
Future research will further explore cooperative optimization across multiple time scales, with a primary focus on integrating robust short-term forecasting models and uncertainty quantification methods to transition the proposed strategy from an ideal benchmark to a practical online scheduling tool. The impact of forecast errors on strategy performance will be a critical evaluation metric. And validate the strategy’s performance in networks with binding power flow and thermal capacity constraints.

Author Contributions

Writing—original draft preparation, H.L., L.D.; writing—review and editing, Y.-R.H., J.-W.M., J.Z.; visualization, X.-Z.W., L.M.; funding acquisition, J.-Y.Y. All authors have read and agreed to the published version of the manuscript.

Funding

This study was supported by the Research and Application of Virtual Synchronous Support Control Technology for Village-level AC/DC Hybrid Microgrid [Project No. 52170224001R].

Institutional Review Board Statement

Not applicable.

Data Availability Statement

The original contributions presented in this study are included in the article. Further inquiries can be directed to the corresponding author.

Conflicts of Interest

Authors Hao Liu, Li Di, Yu-Rong Hu, Jian-Wei Ma, Ling Miao, Jian Zhao, and Xiao-Zhao Wei were affiliated with State Grid Henan Electric Power Research Institute. The remaining authors declare that the research was conducted in the absence of any commercial or financial relationships that could be construed as a potential conflict of interest.

References

  1. Kumar, S.; Premkumar, M.; Giri, J.; Sharma, S.S.; Hasnain, S.M.M.; Sathish, T.; Zairov, R. Exploring the Spectrum: A Comprehensive Review of Control Methods in Microgrid Systems. Results Eng. 2025, 105470. [Google Scholar] [CrossRef]
  2. Zamani, N.; Bigdeli, M.; Ghorbani, A.; Hassan, H.A. Enhancing the protection of photovoltaic-based DC microgrids using circuit breaker operation sequence. Int. J. Electr. Power Energy Syst. 2025, 172, 111230. [Google Scholar] [CrossRef]
  3. Lee, C.; Kwon, H.; Lee, Y.I. OPC UA-based three-layer architecture for aggregated microgrids integrating edge cloud computing and IEC 62264. J. Ind. Inf. Integr. 2025, 48, 100965. [Google Scholar] [CrossRef]
  4. Valsan, V.; Sai, A.A.; Kumar, A.G.; Devidas, A.R.; Ramesh, M.V. Deep Learning-enabled Spatiotemporal Sustainable Energy Strategy for Rural Multiple Microgrids. Results Eng. 2025, 28, 107569. [Google Scholar] [CrossRef]
  5. Kang, X.; Wang, X.; Liu, Z.; Wu, Y.; Liu, X.; Yan, D. Building microgrid profile scheduler (BMPS): A web-based open tool for operation profile dispatching towards flexible energy system design and control. Energy Build. 2025, 348, 116458. [Google Scholar] [CrossRef]
  6. Wang, Z.; Hou, H.; Zhao, B.; Zhang, L.; Shi, Y.; Xie, C. Risk-averse stochastic capacity planning and P2P trading collaborative optimization for multi-energy microgrids considering carbon emission limitations: An asymmetric Nash bargaining approach. Appl. Energy 2024, 357, 122505. [Google Scholar] [CrossRef]
  7. Li, J.; Feng, B.; An, Y.; Gao, X.; Yan, C.; Li, M. A coordinated control algorithm for DC microgrid energy storage system based on dynamic threshold control strategy. Results Eng. 2025, 28, 107146. [Google Scholar] [CrossRef]
  8. Li, L. Optimizing microgrid energy management with hybrid energy storage systems using reinforcement learning methods. Sustain. Comput. Inform. Syst. 2025, 47, 101177. [Google Scholar] [CrossRef]
  9. Li, L.; Zhou, X.; Chen, S.; Bi, G.; Zhu, Z.; Fan, Y. Bi-level optimization of configurations and scheduling for the multi-microgrid system (MMS) considering shared hybrid electric-hydrogen energy storage service. Glob. Energy Interconnect. 2025. [Google Scholar] [CrossRef]
  10. Janke, S.; Crawford, C.; Truelove, A.; Lenio, M.; Hashemi, B. Regenerative hydrogen energy storage modelling for northern microgrid energy design. Renew. Energy 2026, 256, 123979. [Google Scholar] [CrossRef]
  11. Erdogan, B.; Tumay, M.; Savrun, M.M.; Cuma, M.U. A NARMA-L2 ANN-controlled hybrid storage-based energy management framework for enhanced microgrid operation. J. Energy Storage 2025, 134, 118241. [Google Scholar] [CrossRef]
  12. Ganesh, R.; Saha, T.K.; Kumar, M.L.S.S. Extremum seeking technique for the optimal energy storage integration to standalone PV based microgrid. Electr. Power Syst. Res. 2025, 248, 111968. [Google Scholar] [CrossRef]
  13. Aklo, N.J.; Almousawi, A.Q.; Hammood, H.; Al-Ibraheemi, Z.A.M. Deep deterministic policy gradient-based energy storage control and distribution between two microgrids. e-Prime-Adv. Electr. Eng. Electron. Energy 2025, 13, 101096. [Google Scholar] [CrossRef]
  14. He, Y.; Zhang, Y. Optimal configuration of shared energy storage for multi-microgrid systems: Integrating battery decommissioning value and renewable energy economic consumption. Energy Convers. Manag. 2025, 343, 120156. [Google Scholar] [CrossRef]
  15. Zahid, H.; Zulfiqar, A.; Adnan, M.; Iqbal, M.S.; Shah, A.; Abbasi, U.; Mohamed, S.E.G. Transforming nano grids to smart grid 3.0: AI, digital twins, blockchain, and the metaverse revolutionizing the energy ecosystem. Results Eng. 2025, 27, 105850. [Google Scholar] [CrossRef]
  16. Ces, N.P.L.; Almada, J.B.; Tofoli, F.L.; Sampaio, R.F.; Melo, L.S.; Leão, R.P.S. Comparative analysis of distributed optimization algorithms for economic dispatch in microgrids with energy storage systems. J. Energy Storage 2025, 132, 117693. [Google Scholar] [CrossRef]
  17. Zhao, F. Optimizing Microgrid Management with Intelligent Planning: A Chaos Theory-Based Salp Swarm Algorithm for Renewable Energy Integration and Demand Response. Comput. Electr. Eng. 2024, 120, 109847. [Google Scholar] [CrossRef]
  18. Wang, Z.; Hou, H.; Wei, R.; Li, Z. A Distributed Market-Aided Restoration Approach of Multi-Energy Distribution Systems Considering Comprehensive Uncertainties from Typhoon Disaster. IEEE Trans. Smart Grid 2025, 16, 3743–3757. [Google Scholar] [CrossRef]
  19. Feng, X.; Cui, L.; Ren, D.; Pan, A.; Hong, J. A new adaptive robust multi-objective optimization algorithm for dispatching of microgrids design. Eng. Appl. Artif. Intell. 2025, 159, 111715. [Google Scholar] [CrossRef]
  20. Akarne, Y.; Essadki, A.; Nasser, T.; Annoukoubi, M.; Charadi, S. Optimized control of grid-connected photovoltaic systems: Robust PI controller based on sparrow search algorithm for smart microgrid application. Glob. Energy Interconnect. 2025, 8, 523–536. [Google Scholar] [CrossRef]
  21. Conteh, I.M.; Salawudeen, A.T.; Abdulsalami, A.O.; Du, Q. An improved triangular mutated slime mould algorithm for developing an optimized frequency control of a Bi-zonal islanded microgrid power system. Results Eng. 2025, 25, 104306. [Google Scholar] [CrossRef]
  22. Liu, Z.F.; Luo, X.F.; Chen, X.R.; Huang, Y.H.; Liu, Y.Y.; Tang, Y.; Kang, Q.; Guo, L. An innovative bi-level scheduling model with hydrogen-thermal-electricity co-supply and dynamic carbon capture strategies for regional integrated energy systems considering hybrid games. Renew. Energy 2024, 237, 121682. [Google Scholar] [CrossRef]
  23. Rodan, A.; Al-Tamimi, A.-K.; Al-Alnemer, L.; Mirjalili, S.; Tiňo, P. Enzyme action optimizer: A novel bio-inspired optimization algorithm. J. Supercomput. 2025, 81, 686. [Google Scholar] [CrossRef]
  24. Du, P.; Ye, Y.X.; Wu, H.; Wang, J. Study on deterministic and interval forecasting of electricity load based on multi-objective whale optimization algorithm and transformer model. Expert Syst. Appl. 2025, 268, 126361. [Google Scholar] [CrossRef]
  25. Zhu, J.H.; Yu, X.B.; Wang, F.; Mao, Y. Multi-objective optimal power flow problem using constrained dynamic multitasking multi-objective optimization algorithm. Swarm Evol. Comput. 2025, 93, 101850. [Google Scholar] [CrossRef]
Disclaimer/Publisher’s Note: The statements, opinions and data contained in all publications are solely those of the individual author(s) and contributor(s) and not of MDPI and/or the editor(s). MDPI and/or the editor(s) disclaim responsibility for any injury to people or property resulting from any ideas, methods, instructions or products referred to in the content.

Article Metrics

Citations

Article Access Statistics

Multiple requests from the same IP address are counted as one view.