Article

Performance and Economic Analysis of an Absorption Heat Transformer-Assisted LNG Cold Energy Power Generation System

1
School of Energy and Environment, Southeast University, Nanjing 210096, China
2
School of Mechanical Engineering, Tongji University, Shanghai 200092, China
3
Institute of Science and Technology for Carbon Neutrality, Southeast University, Nanjing 210096, China
4
Yangtze River Delta Carbon Neutrality Strategy Development Institute, Southeast University, Nanjing 210096, China
*
Author to whom correspondence should be addressed.
Eng 2025, 6(11), 315; https://doi.org/10.3390/eng6110315
Submission received: 28 September 2025 / Revised: 28 October 2025 / Accepted: 2 November 2025 / Published: 5 November 2025

Abstract

Against the backdrop of increasing global LNG trade and the growing demand for efficient cold energy recovery, this study addresses the limitations of LNG cold energy power generation systems in onshore LNG-receiving terminals by innovatively integrating a Type II Absorption Heat Transformer (AHT) to utilize waste heat. A steady-state model of the AHT-LNG-CEPG system was developed to evaluate performance under different organic working fluids and operational parameters. Results indicate that R32, propane, propene, and R143a significantly enhance system performance. The system achieves optimal performance when the AHT condensation temperature is 40 °C and the LNG-CEPG evaporation temperature is 30 °C, with R32 identified as the most effective working fluid. Economic analysis confirms the system’s viability, demonstrating that optimizing LNG-CEPG equipment can reduce costs. Under a 20-year operational lifetime (OL), the system using R32 achieves the lowest Levelized Cost of Electricity (LCOE) and Payback Period (PP) at 0.084 USD/kWh and 7.86 years, respectively. These findings provide practical insights for industrial applications.

1. Introduction

Natural gas has been extensively utilized globally as a low-carbon emission fossil energy source and is widely regarded as the optimal complementary option to renewable energy sources for reducing carbon emissions in energy systems [1]. In recent years, global natural gas demand has exhibited a steady annual increase. In 2020, global demand reached 3840 billion cubic meters (bcm), with projections indicating a rise to 5625 bcm by 2050 [2]. As natural gas exists in a gaseous state at ambient temperature, rendering it inconvenient for transportation, it undergoes liquefaction for transit and is stored in tanks to achieve a significant volume reduction [3]. Over recent decades, global LNG (liquefied natural gas) trade volume has progressively expanded. In 2024, global LNG trade volumes reached 411.24 million tons, with China solidifying its position as the world’s largest importer at 76.65 million tons, while the United States remained the dominant exporter with 88.30 million tons. LNG must first be transported to storage tanks at coastal LNG-receiving terminals. When needed, it is regasified and delivered to end-users. Due to its extremely low initial temperature (approximately −162 °C), seawater is typically used as the heat source for regasification. During this process, a substantial amount of cold exergy is released, reaching up to 830 kJ/kg [4]. Recovering this cold energy offers significant economic benefits. Consequently, with the continued growth in LNG trade volume, LNG cold energy recovery is poised for substantial development prospects [5,6].
Currently, the primary techniques for recovering cold energy from LNG include electricity production [7,8], air separation [9], desalination of seawater [10], cryogenic energy storage using liquid air [11], and capture of carbon dioxide [12]. Among these, power generation has emerged as the most widely adopted method for LNG cold energy utilization, owing to its negligible environmental effects, operational adaptability, and considerable economic advantages [13]. Among the various LNG cold-to-power conversion technologies—such as direct expansion [14], Rankine cycle [15,16], Organic Rankine Cycle (ORC) [17], Brayton cycle [18], and Kalina cycle [19]—the Organic Rankine Cycle stands out as the most widely adopted solution in practical applications due to its operational simplicity, system stability, and high reliability [20]. In a conventional LNG cold energy power generation (LNG-CEPG) system based on ORC technology, the organic working fluid undergoes the following continuous process: it is first condensed into liquid state within the condenser, pressurized by the organic working fluid pump, and subsequently directed to the evaporator where it absorbs thermal energy from heat sources such as seawater and undergoes vaporization. The resulting vapor then expands through a turbine to generate electricity before finally returning to the condenser, thus completing the thermodynamic cycle [21].
In recent decades, significant research efforts have been devoted to the study of LNG cold energy power generation systems utilizing the Organic Rankine Cycle (ORC), primarily focusing on heat source selection, cycle configuration (single vs. multi-stage), and organic working fluid optimization. Zhen Tian et al. [22] utilized waste heat from marine engine exhaust gases and jacket cooling water as the ORC heat source for LNG cold energy recovery. Their results indicated that reducing evaporation pressure and increasing condensation pressure enhanced both energy efficiency and economic performance, while optimizing the expander could reduce system capital costs. Bao, J.J. [23] et al. investigated the impact of different ORC stages and Combined Cycle (CC) configurations integrating direct expansion with ORC on LNG cold energy recovery system performance. They found that for the same number of stages, systems employing ORC incurred higher costs than CC systems but delivered higher net power output; moreover, increasing the number of stages significantly raised investment costs. Li, B. et al. [24] investigated a dual-loop ORC-LNG configuration, reporting enhancements in thermal and exergy efficiencies by 43.3% and 63.7%, respectively, relative to traditional single-loop ORC systems. Their analysis further highlighted R134a as the most effective working fluid for simultaneously optimizing thermal and exergy performance within the proposed dual-loop framework. Rao et al. [25] evaluated the performance of various working fluids in an LNG cold energy power generation system utilizing solar thermal energy to drive the ORC process. Their findings indicated that R143a, R290, and R1270 demonstrated the most favorable thermodynamic characteristics for this specific application. He et al. [26], researching ORC systems for LNG cold energy recovery, determined that R236fa achieved higher thermal efficiency. Liu, Q. et al. [27] investigated working fluid selection for seawater-driven ORC cold energy recovery systems, finding R32 and R1270 more suitable for single-stage ORC, while R170, R41, R744, and R1123 were better suited for multi-stage ORC configurations. He, T.B. et al. [28] analyzed the influence of LNG-side fluid types on the performance of single-stage ORC systems recovering LNG cold energy. Their results showed that using pure R1270 yielded the highest thermal and exergy efficiency. Critically, they noted that in practical applications, zeotropic mixtures frequently exhibit suboptimal thermal matching with the LNG vaporization curve, leading to increased exergy destruction within the evaporator.
The aforementioned research landscape reveals that regarding cycle configuration, increasing the number of ORC stages within LNG cold energy power generation (LNG-CEPG) systems enhances thermal efficiency but incurs the significant drawback of elevated costs [29]. Concerning working fluid selection, pure fluids remain the predominant choice in practical applications, as zeotropic mixtures frequently encounter challenges in achieving optimal thermal matching with the LNG vaporization curve. In terms of heat sources, clean energy sources like geothermal energy are commonly utilized for the ORC [30]. However, geographical constraints often limit the availability of such heat sources at most LNG-receiving terminals [28,31]. Type II Absorption Heat Transformers (AHTs), widely employed for district heating in industrial parks, utilize substantial amounts of medium-temperature heat to generate high-temperature heat [32]. Nevertheless, a significant portion of heat is dissipated via cooling water in the AHT condenser. The current literature primarily focuses on areas such as working fluid pair selection in AHT [33], system structure optimization [34], the impact of various system parameters on AHT performance [35], and the integration of clean energy sources (e.g., solar energy) with AHT for building heating systems [32]. However, research on utilizing the cooling water from the AHT condenser remains unexplored. If this resource can be effectively harnessed—for instance, as a heat source for LNG-CEPG—it would present broad prospects for future research.
Building upon this background and the current research status, this study establishes an integrated AHT-LNG-CEPG system combining AHT with LNG-CEPG. A steady-state mathematical model of the system is developed. An optimized organic working fluid is selected for the LNG-CEPG subsystem. The influence of varying AHT condensation temperatures and LNG-CEPG evaporation temperatures on system performance is analyzed. Finally, an economic assessment of the system under optimal operating conditions is conducted. The results presented in this study are derived from simulation software, which, to some extent, facilitates further design optimization of the LNG-CEPG system and is expected to provide valuable insights for practical engineering applications of LNG cold energy recovery.

2. System Description

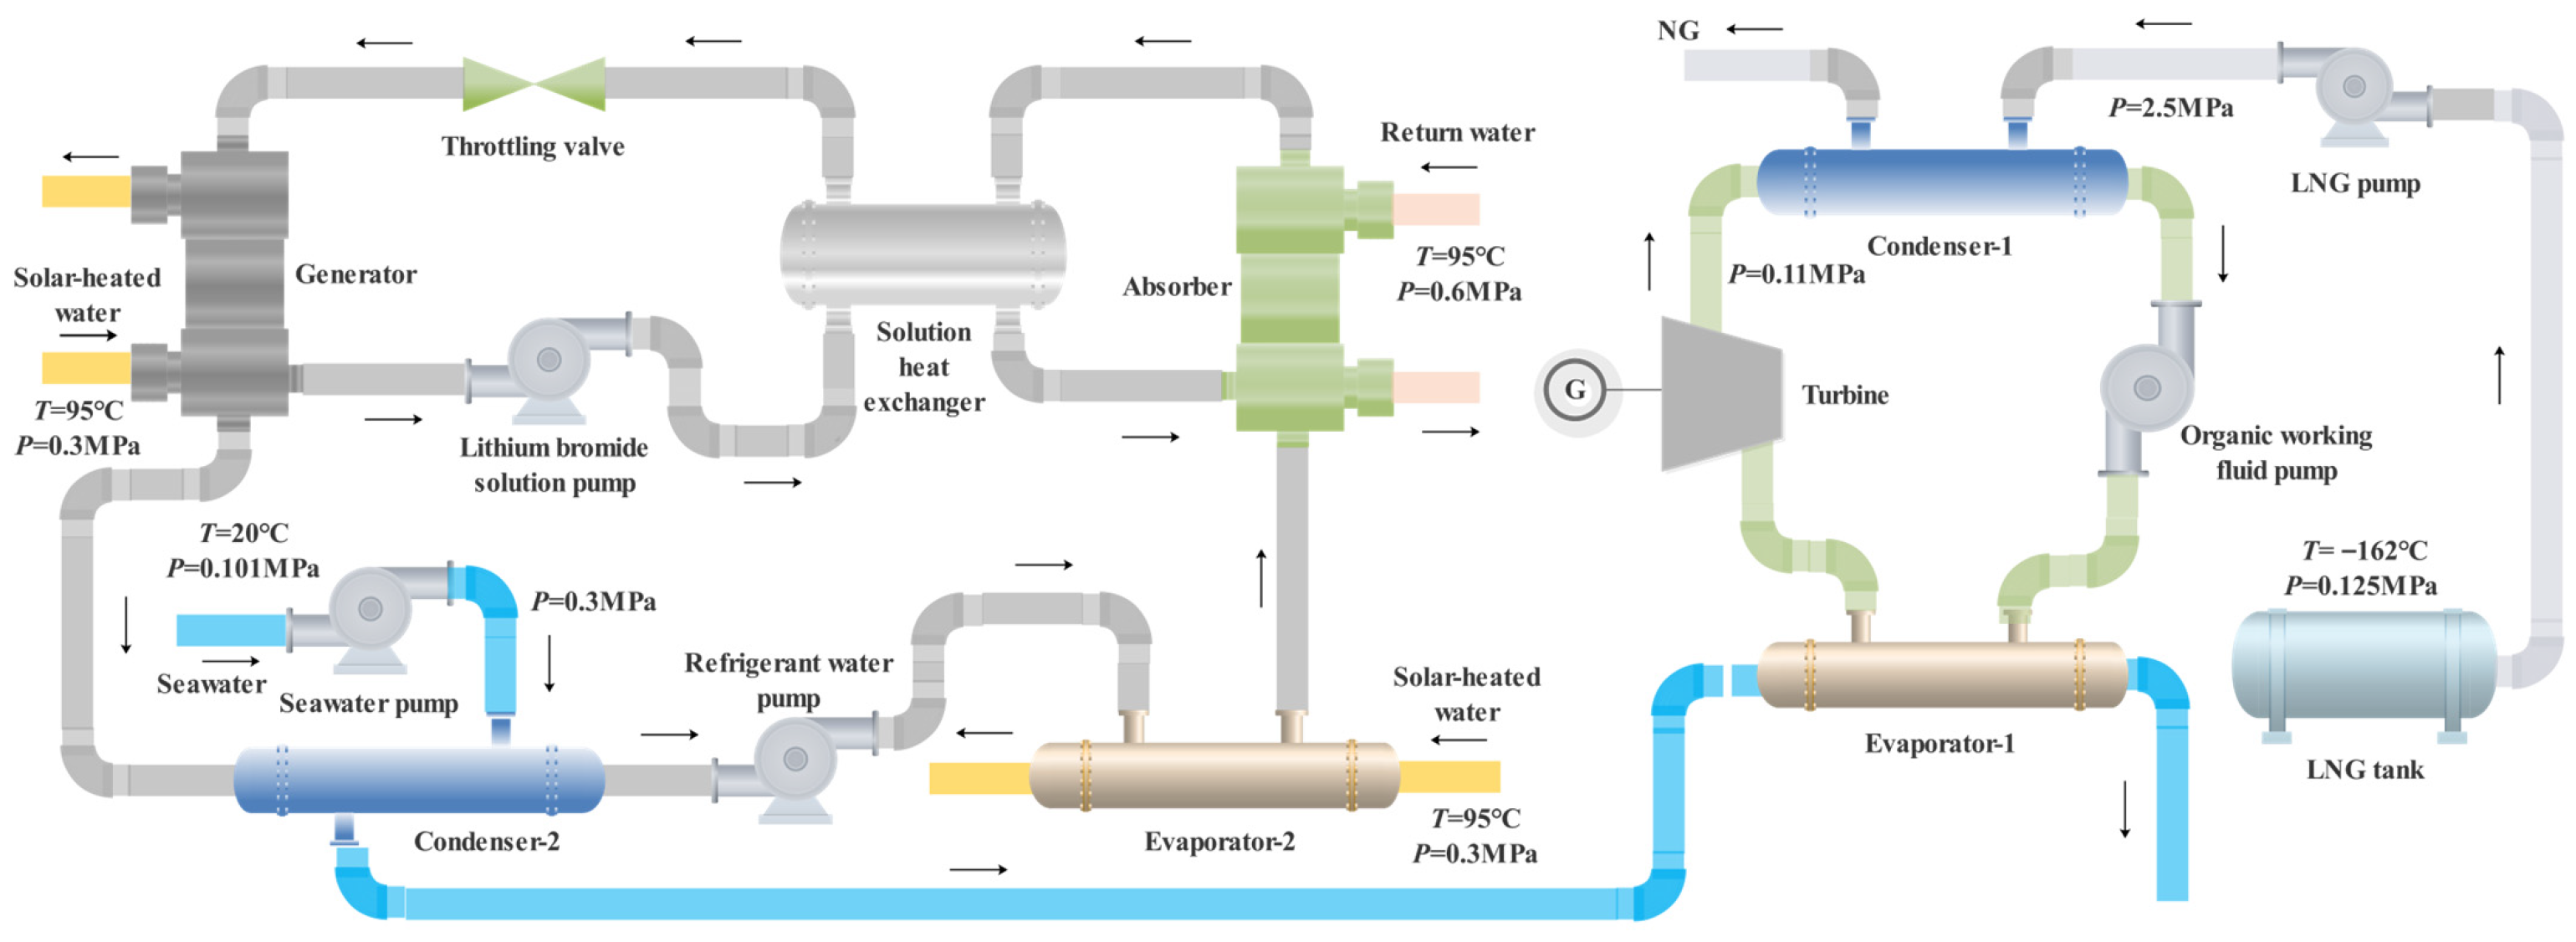
The integration architecture of the proposed system, which combines a Type II Absorption Heat Transformer (AHT) with a liquefied natural gas cold energy power generation (LNG-CEPG) unit, is illustrated schematically in Figure 1. The overall system comprises two primary subsystems: an ORC-based LNG cold energy power generation system and a Type II Absorption Heat Transformer (AHT) system.
The LNG cold energy power generation subsystem primarily consists of a single ORC. LNG flows from the storage tank and is pressurized to the required delivery pressure by the LNG pump. It then passes through Condenser-1 of the ORC, where it absorbs heat and subsequently exits the system as warmed natural gas (NG). The working process within the ORC proceeds as follows: initially, saturated liquid organic working fluid is pressurized by the refrigerant pump and enters Evaporator-1. Within Evaporator-1, the fluid is heated by seawater, transforming it into a saturated vapor state. This saturated vapor then expands through the turbine, generating mechanical work that is converted into electrical energy. Finally, the expanded vapor enters Condenser-1, where the cold energy from the LNG stream causes it to condense back into saturated liquid, thereby completing the cycle.
The second-type absorption heat pump heating system employs a lithium bromide–water mixture as the working pair and typically utilizes clean energy as the medium-temperature heat source. In this study, solar-heated water serves as the input heat source, with a temperature range generally around 95 °C [32,36], supplying thermal energy to both the generator and Evaporator-2. Seawater acts as the cooling medium, providing cold energy to Condenser-2. A significant portion of the heat released within the absorber is transferred to the district heating return water, elevating its temperature for subsequent heating applications. The internal working process of the AHT proceeds as follows: dilute LiBr solution is heated by solar-heated water within the generator, causing the evaporation of low-pressure water vapor and resulting in a concentrated solution. The generated water vapor flows to the AHT’s Condenser-2, where it is condensed into saturated liquid water by seawater cooling. This liquid water is then pressurized by the liquid water pump and delivered to Evaporator-2. Within Evaporator-2, the water is heated and evaporated by solar-heated water, transforming into high-temperature, high-pressure vapor which subsequently enters the absorber. Meanwhile, the concentrated solution from the generator is pressurized by the solution pump and passes through the solution heat exchanger for recuperative heating. It then enters the absorber, where it absorbs the incoming high-pressure vapor from Evaporator-2. This absorption process releases substantial heat into the district heating return water. Following absorption, the solution reverts to a dilute state and flows through the solution heat exchanger, transferring heat to the incoming concentrated solution stream. Finally, the diluted solution passes through a throttling valve to reduce its pressure before re-entering the generator to commence the next cycle.
The integration between the LNG-CEPG and AHT systems is achieved through seawater acting as an intermediary heat transfer medium. Seawater first serves as the cooling fluid entering Condenser-2 of the AHT. After being warmed within Condenser-2, this seawater then acts as the thermal source, flowing into Evaporator-1 of the ORC subsystem to transfer heat to the organic working fluid.

3. Model Establishment

To facilitate efficient simulation and computational analysis, the steady-state mathematical model of the AHT-LNG-CEPG system was constructed under the following simplifying assumptions:
(1)
The entire system operates under steady-state conditions.
(2)
Pressure drops and heat losses in pipelines and heat exchangers are negligible [37].
(3)
The isentropic efficiencies of the pumps and the turbine remain constant during the simulation process [37].
(4)
The working fluid exiting Condenser-1 and Condenser-2 is in a saturated liquid state [37].
(5)
The working fluid exiting Evaporator-1 and Evaporator-2 is in a saturated vapor state [37].
(6)
The organic working fluid exiting the turbine is in a superheated vapor state (contains no liquid phase).
(7)
During the simulation process, the throttle valve operates under an isenthalpic condition [38].
(8)
The thermophysical properties of seawater were replaced by those of pure liquid water [38].

3.1. Mass and Energy Analysis

During steady-state operation of the system, mass and energy balance equations for all components were formulated in accordance with the principles of mass conservation and the first law of thermodynamics [39]:
m ˙ i n = m ˙ o u t
m ˙ h i n m ˙ h o u t + Q ˙ + W ˙ = 0
where subscripts i n and o u t denote inflow and outflow streams, respectively; m ˙ represents mass flow rate; Q ˙ represents heat transfer rate; h represents specific enthalpy; and W ˙ represents power output.
The isentropic efficiency of the turbine is calculated as follows:
W t u r , i s e = m ˙ o w f n n 1 C F P i n ρ i n P o u t P i n n 1 n 1
n = ln P o u t P i n ln ρ o u t ρ i n
C F = h o u t h i n n n 1 ( P o u t ρ o u t P i n ρ i n )
where n denotes the polytropic volume exponent, CF is the correction factor, ρ o u t denotes the density of the fluid at the outlet under isentropic expansion conditions, and h o u t denotes the enthalpy of the fluid at the outlet under isentropic expansion.
Furthermore, the turbine’s power output can be expressed in terms of enthalpy difference as follows [40]:
W t u r = ε t u r W t u r , i s e = m o f h t u r , i n h t u r , o u t
The vapor quality at the turbine outlet is determined using the following expression:
x = h o u t h s l h s s h s l
where h s s and h s l denote the specific enthalpy of saturated vapor and saturated liquid, respectively.
The total pump power consumption of the system can be expressed as
W p , t o t a l = W L N G p + W s w p + W o w f p + W L i B r s p + W r e f w p
where W L N G p represents the input power of the LNG pump, W s w p represents the input power of the seawater pump, W o w f p represents the input power of the organic working fluid pump, W L i B r s p represents the input power of the lithium bromide solution pump, and W r e f w p represents the input power of the refrigerant water pump within the heat pump subsystem.
Assuming constant fluid density during pump pressurization, the ideal power requirement for a pump is calculated as
W p , i d e = m ˙ P o u t P i n ρ l
The actual input power for each pump is calculated by [41]
W L N G p = m ˙ L N G h L N G , o u t h L N G , i n = W L N G p , i d e / ε p
W s w p = m ˙ s w h s w , o u t h s w , i n = W s w p , i d e / ε p
W o w f p = m ˙ o w f h o w f , o u t h o w f , i n = W o w f p , i d e / ε p
W L i B r s p = m ˙ L i B r s h L i B r s , o u t h L i B r s , i n = W L i B r s p , i d e / ε p
W r e f w p = m ˙ r e f w h r e f w , o u t h r e f w , i n = W r e f w p , i d e / ε p
The net electrical power generated by the system is defined as follows:
W n e t = W t u r W p , t o t a l
Furthermore, the heat transfer rates for Condenser-1, Condenser-2, Evaporator-1, Evaporator-2, the generator, and the absorber in the system are given by
Q h e = m ˙ c f h c f , o u t h c f , i n = m ˙ h f h h f , i n h h f , o u t
The system heating capacity is defined as
Q h l = Q A = m ˙ c f h c f , o u t h c f , i n = m ˙ h f h h f , i n h h f , o u t
where Q A denotes the heat transfer rate of the absorber.
The system thermal efficiency is defined by [42]
η t = W n e t + Q h l Q E 1 + Q G + Q E 2

3.2. Exergy Analysis

In thermodynamics, the concept of exergy refers to the maximum useful work that can be obtained from a system when it reaches equilibrium with a specified reference environment [43]. Unlike total energy, exergy is partially destroyed during system operation. The magnitude of exergy destruction serves as a critical indicator of system performance. Therefore, exergy analysis provides a more rigorous assessment of a system’s thermodynamic efficiency. For the AHT-LNG-CEPG system, the exergy flow can be expressed as [44]
E = m ˙ h h 0 T 0 s s o u t
where T 0 represents the ambient temperature, taken as 25 °C.
The exergy destruction within each component can be calculated by
I = E i n E o u t
The exergy destruction for the condensers, evaporators, absorber, and generator is given by [45]
I h e = E h f , i n + E c f , i n E h f , o u t E c f , o u t
I h e = m ˙ h f T 0 s h f , o u t s h f , i n + m ˙ c f T 0 s c f , o u t s c f , i n
The exergy destruction for the turbine is expressed as
I t u r = E t u r , i n E t u r , o u t W t u r
I h e = m ˙ o w f T 0 s o w f , o u t s o w f , i n
The exergy efficiency of the system can be expressed as follows:
η e x = W t u r + Δ E r w E L N G E N G + Δ E s w + Δ E s h w + W p , t o t a l
where Δ E r w represents the exergy acquired by the district heating return water, Δ E s w denotes the exergy input from seawater, and Δ E s h w denotes the exergy input from solar-heated water.
While exergy efficiency evaluates the system’s ability to convert input exergy into net work output, significant exergy destruction occurs during heat transfer processes. To better characterize the system’s utilization capability of the exergy acquired from both LNG and solar-heated water, a novel parameter termed the Exergy-to-Work Ratio ( η E W R ) is specifically defined as the ratio of useful work output to acquired exergy:
η E W R = W t u r + Δ E r w Δ E o w f , C 1 + Δ E L i B r s , G + Δ E r e f w , E 2
where Δ E o w f , C 1 denotes the exergy acquired by the organic working fluid at Condenser-1, Δ E L i B r s , G denotes the exergy acquired by the lithium bromide solution at the generator, and Δ E r e f w , E 2 denotes the exergy acquired by the refrigerant water at Evaporator-2.

3.3. Economic Analysis

To assess the economic feasibility of the proposed system, a comprehensive economic evaluation was performed. The total capital investment (IIC) mainly consists of expenses related to equipment procurement (EPC), auxiliary materials (AMC), and installation services (IC). Specific cost estimation methods for each category are provided in Table 1.
To comprehensively evaluate the economic performance of the system considering the heat pump supplying district heating and the electrical power output sold to the grid, the Annual Total Profit (ATP) is calculated as follows:
A T P = A O H × W n e t × E P τ × I I C
Given that the system operates exclusively during daylight hours, the annual operating hours (AOH) are set at 4000. The electricity price (EP) is defined as the projected 2025 average industrial rate in Nanjing, valued at 0.1115 USD/kWh. Additionally, the annual operation and maintenance cost coefficient (τ) is established at 6% [46].
The Payback Period (PP) is defined as
P P = I I C A T P
The Levelized Cost of Electricity (LCOE) is determined by applying the following formula:
L C O E = I I C + i = 1 O L τ × I I C 1 + r i i = 1 O L A O H × W n e t 1 + r i
The operational lifetime (OL) of the system is set to 20 years, while the discount rate (r) is assumed to be 5%.

3.4. Preliminary Selection of Organic Working Fluids

The preliminary selection of organic working fluids must adhere to the following fundamental criteria:
  • High stability, low corrosivity, and good safety;
  • Low Global Warming Potential (GWP) and Ozone Depletion Potential (ODP);
  • Critical parameters of the organic working fluid must exceed the system’s maximum operating parameters;
  • The saturation temperature of the working fluid under atmospheric pressure must remain below the minimum seawater temperature encountered in the system’s operating environment.
Based on these criteria, nine organic working fluids were preliminarily selected; their physical, safety, and environmental properties are presented in Table 2.

3.5. Simulation Parameters

The composition of LNG used in the system simulation is presented in Table 3. The operating parameters for the system simulation are given in Table 4.

3.6. Model Validation

Due to the limited research on integrating AHT with LNG-CEPG systems, this study adopts the system configuration from Reference [47] for validation. Reference [47] presents a single-stage ORC using ethylene as the working fluid with LNG evaporation pressure set at 6 bar. Simulation results of Reference [47]’s system using our model are shown in Table 5. The results demonstrate close agreement with literature data. Minor discrepancies primarily stem from the recuperative heat exchanger incorporated in Reference [47]’s ORC system, which elevates the organic fluid temperature at the evaporator inlet, reduces evaporator heat transfer, and marginally increases both thermal efficiency and exergy efficiency. Configuration 5 in Reference [29] presents a single-stage ORC system using propane as the organic working fluid. A comparative analysis between the simulation results and the data from Reference [29] is summarized in Table 6. To ensure the thermodynamic consistency and accuracy of the simulation model, the overall energy and exergy balances of the entire system were verified under the aforementioned operating conditions. As the relative errors in the results presented in Table 5 and Table 6 are all less than 5%, it can be reasonably concluded that the simulation model used in this study is valid.

4. Results and Discussion

4.1. Selection of Organic Working Fluids

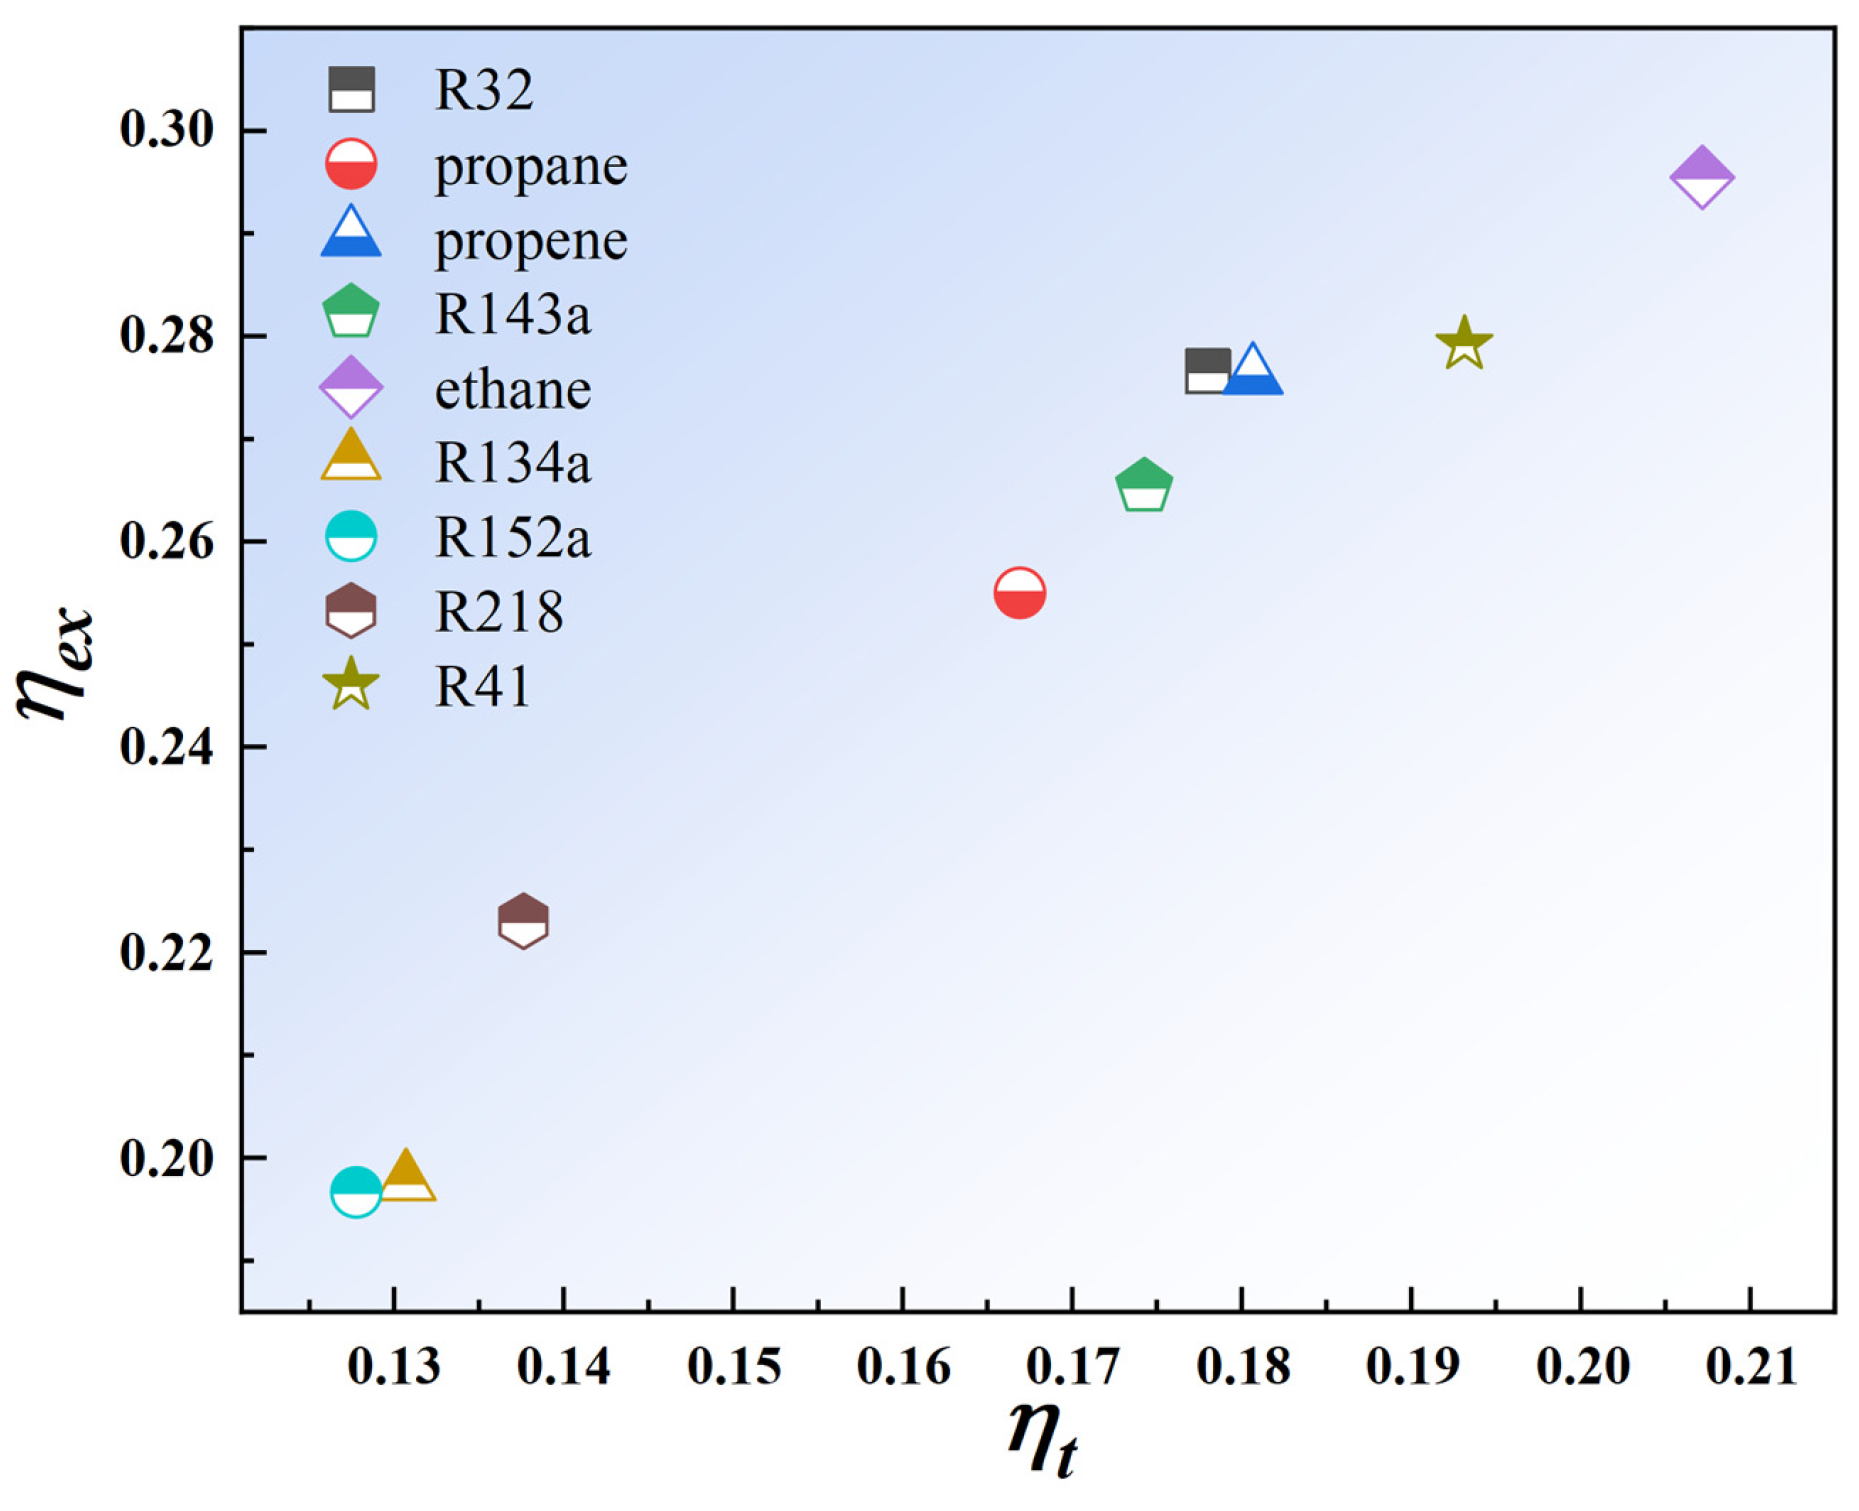
Owing to distinct physical properties among different organic working fluids, their operational temperature ranges vary significantly. To enhance ORC efficiency and minimize exergy destruction, an optimal working fluid must be selected from the 10 preliminarily screened candidates to improve cold energy recovery. Since working fluids pertain exclusively to the ORC subsystem, this section focuses solely on the LNG cold energy power generation (LNG-CEPG) system excluding the AHT subsystem. For Evaporator-1, the heat source is substituted with 20 °C seawater. The η t and η e x of the LNG-CEPG system across the 10 candidate working fluids are presented in Figure 2, while W n e t and η E W R are shown in Figure 3.
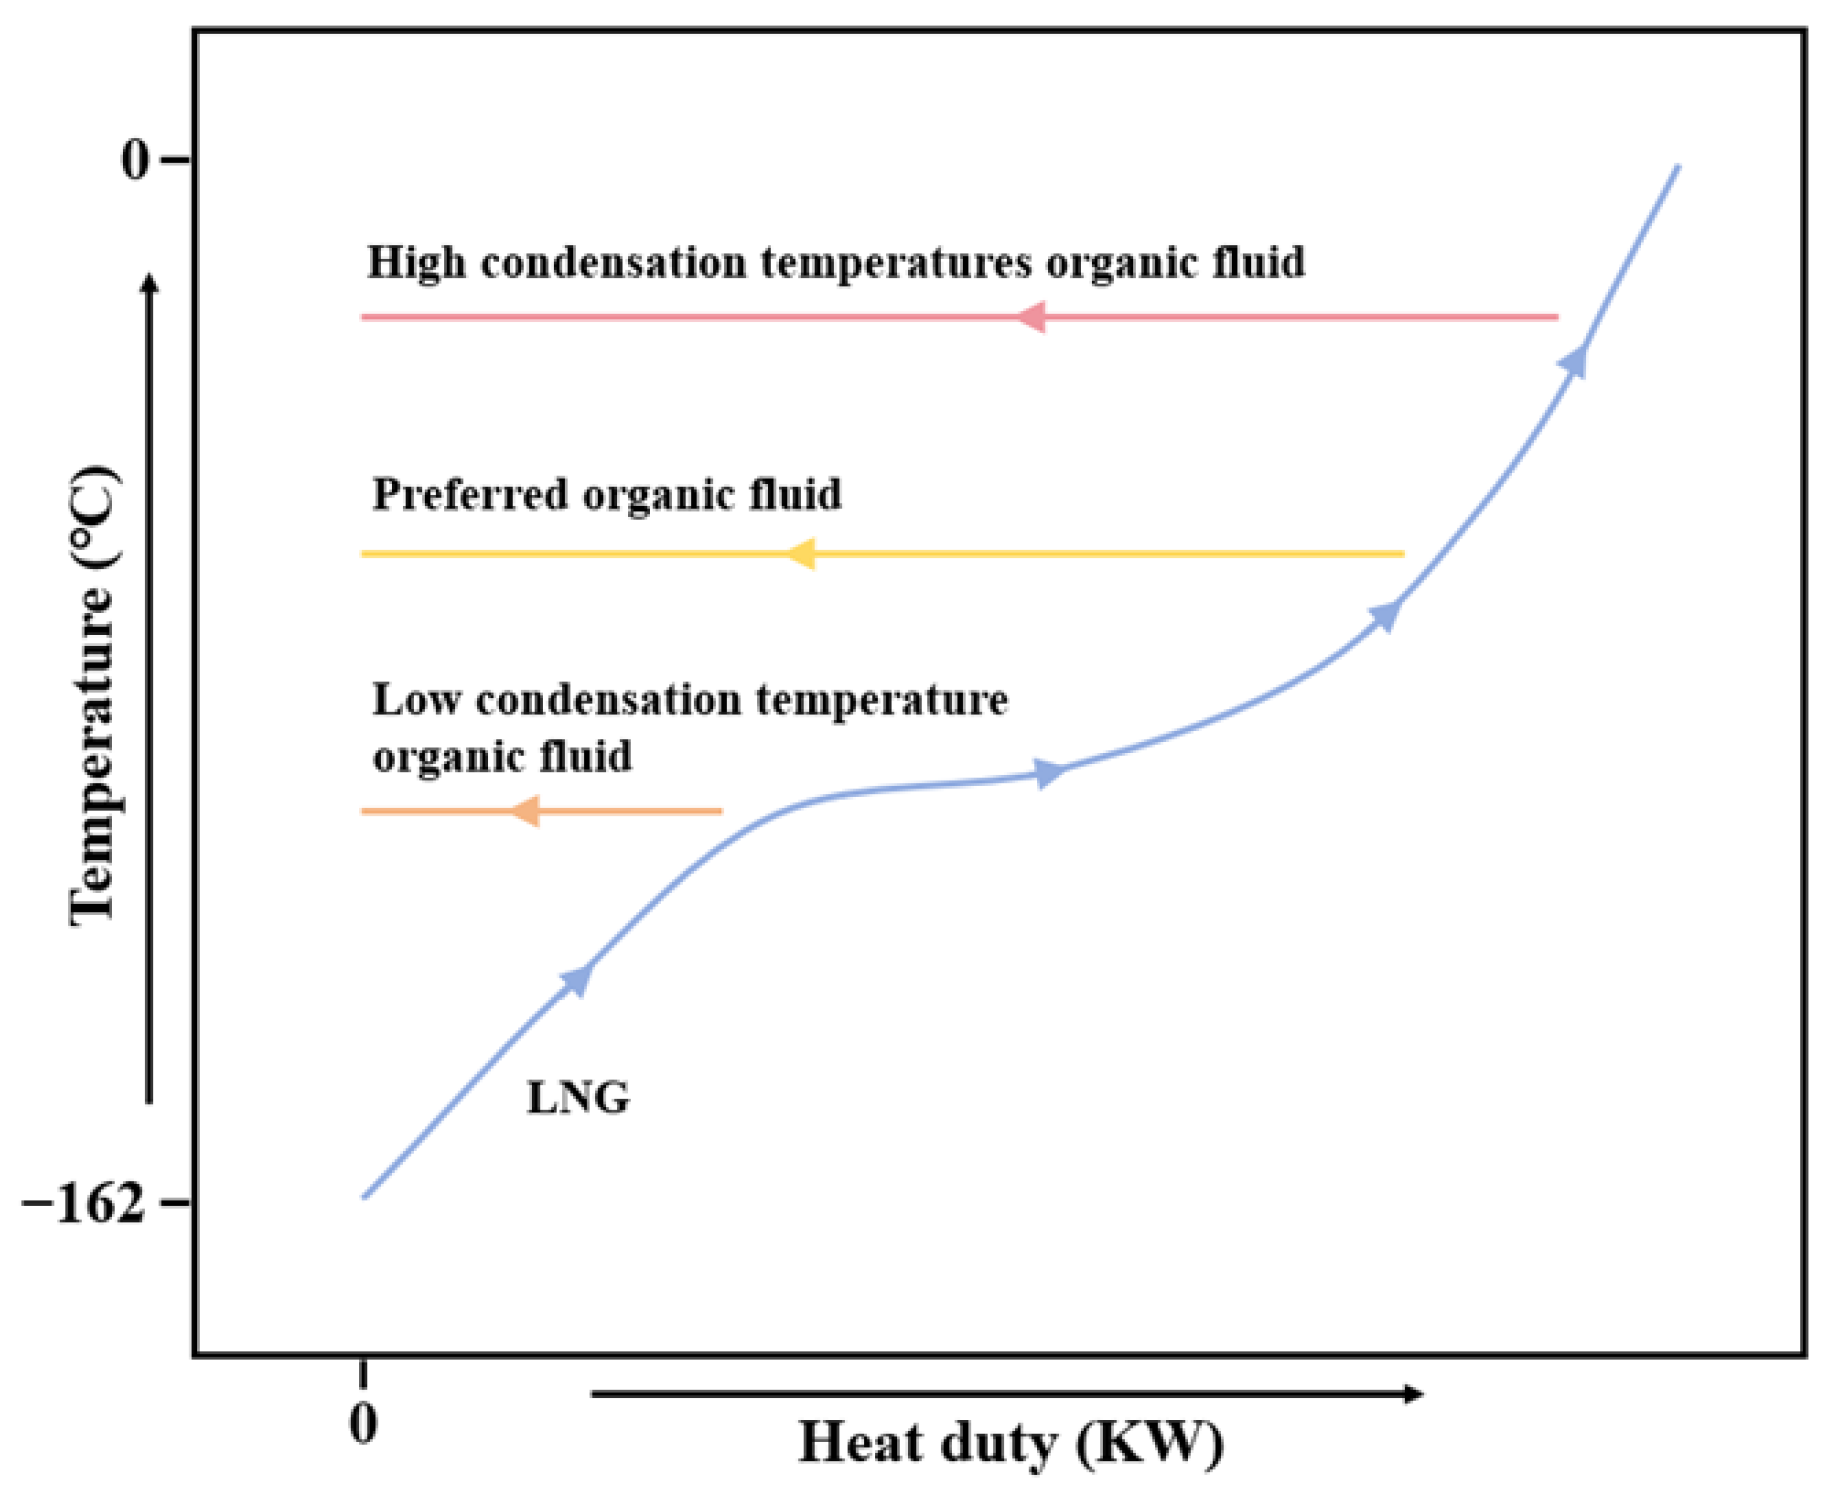
As evidenced in Figure 2 and Figure 3, system η t , η e x , η E W R , and W n e t exhibit considerable variation across working fluids. This divergence primarily stems from differences in physical properties, particularly condensation temperature, which affects thermal matching between the working fluid and LNG during heat exchange, consequently impacting all performance metrics. Figure 4 demonstrates that fluids with higher condensation temperatures expand the LNG cold energy recovery temperature range. However, they incur excessive heat exchange temperature differences with LNG, resulting in poor thermal profile matching, increased exergy destruction, and degraded system performance. Conversely, fluids with lower condensation temperatures reduce the heat exchange temperature difference with LNG but narrow the effective cold energy recovery temperature range, diminishing overall recovery efficiency.
As observed in Figure 3, system η t and η e x vary substantially among fluids. Candidates positioned near the top-right quadrant of the plot should be prioritized, while R134a, R152a, and R218 exhibit significantly inferior performance and are excluded from consideration. Similarly, Figure 4 indicates that W n e t and η E W R differ considerably across fluids. Following the same selection principle, ethane and R41 are eliminated. Synthesizing both figures, R32, propane, propene, and R143a are identified as optimal working fluids for further analysis.

4.2. Impact of AHT Condensation Temperature on System Performance

To better understand the impact of different parameters on system performance, this section builds upon the four preferred working fluids identified in Section 4.1. Under the condition of an LNG-CEPG evaporation temperature of 20 °C, the influence of different AHT condensation temperatures on system performance is investigated to identify the optimal AHT condensation temperature for improved system performance.
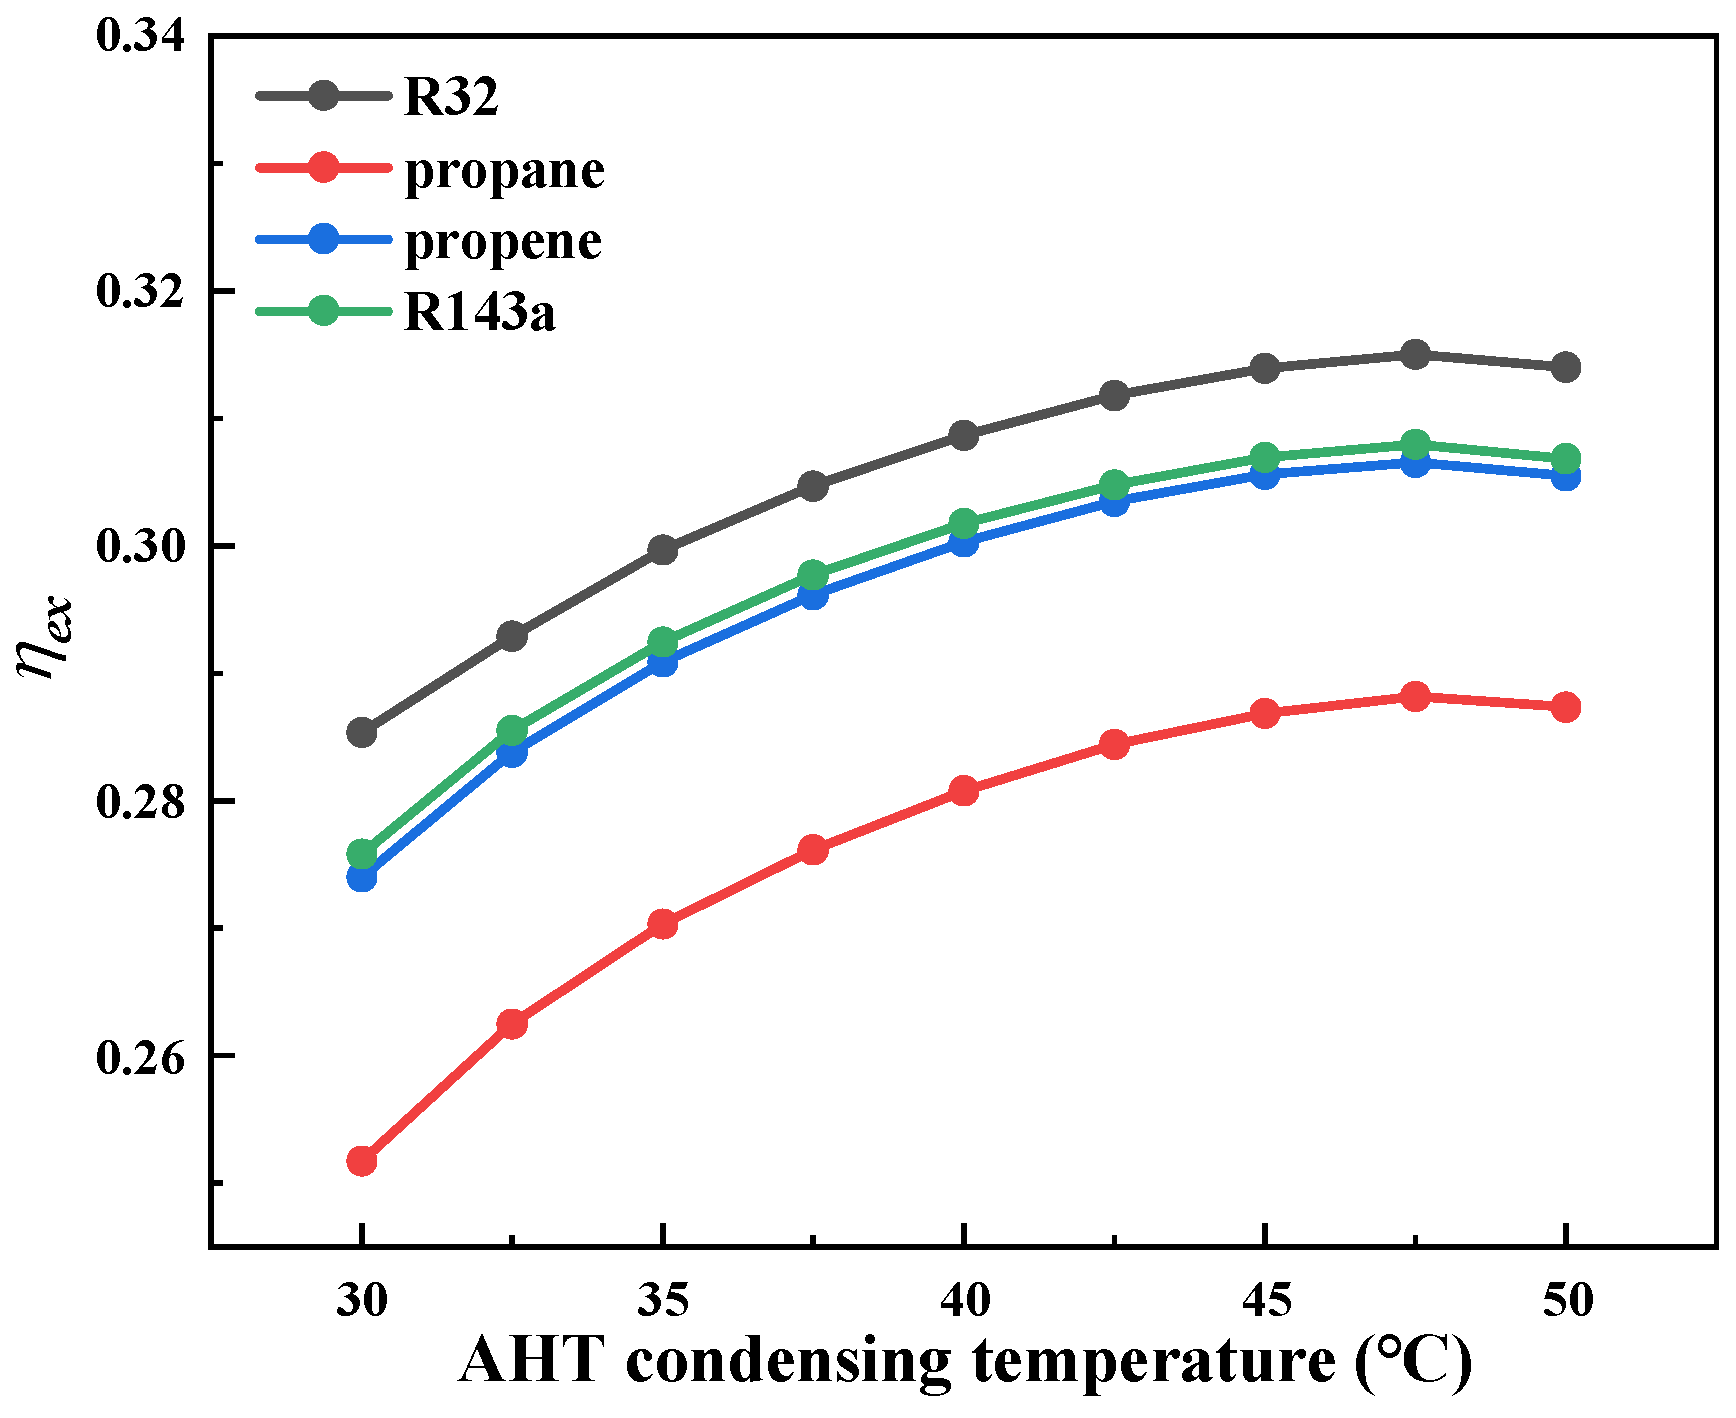
Figure 5, Figure 6 and Figure 7 illustrate the variations in system η t , η e x , and η E W R for different working fluids and AHT condensation temperatures. Figure 5 and Figure 6 show the changes in η t and η e x with respect to the AHT condensation temperature for different working fluids. It can be observed that as the condensation temperature increases, both η t and η e x for all working fluids initially rise and then decline. The condensation temperature of the AHT increased from 30 °C to 47.5 °C, with average growth rates of 6.60% and 3.27% for η t and η e x , respectively. Among them, the working fluid R32 demonstrates superior performance, followed by R143a and propene, while propane performs the poorest. When R32 is used as the working fluid, both η t and η e x reach their maximum values of 24.0% and 31.50%, respectively. Figure 5 and Figure 6 also reveal that the growth trends of η t and η e x gradually slow down as the AHT condensation temperature increases and begin to decline after the AHT condensation temperature exceeds 47.5 °C. This is primarily because the increase in AHT condensation temperature raises the temperature of seawater after passing through Condenser-2, thereby increasing the seawater inlet temperature of the LNG-CEPG Evaporator-1. The increase in the average temperature difference between seawater and the working fluid enhances heat transfer. According to the heat transfer equation Q = U A Δ T m , under a fixed heat transfer area, a larger average temperature difference significantly improves heat transfer efficiency. This leads to an increase in the mass flow rate of the working fluid, resulting in higher turbine output work. However, as the AHT condensation temperature continues to rise, the AHT condensation pressure and generation pressure also increase, which deteriorates the water evaporation effect in the generator, reduces generation capacity, decreases heat exchange at Condenser-2, and lowers the circulating water flow rate. Consequently, the heating capacity of the AHT decreases significantly. Although the average heat transfer temperature difference at Evaporator-1 continues to increase, it is insufficient to offset the negative impact caused by the reduction in the AHT’s generation capacity. As a result, the growth in both the η t and η e x of the system slows down and even declines.
Figure 7 shows that as the AHT condensation temperature increases, the η E W R under different working fluids first rises and then declines. This is primarily because the increase in AHT condensation temperature weakens the AHT generation capacity, leading to a significant reduction in heat supply and a decrease in the system’s net output power. Meanwhile, the input exergy increases due to the higher seawater inlet temperature at the LNG-CEPG Evaporator-1, which enhances the exergy obtained by the working fluid, thereby reducing the system’s η E W R .
At a condensation temperature of 40 °C, the exergy work ratio for all working fluids reaches its maximum value, with propene exhibiting the highest η E W R of 0.667. Based on the growth trends of η t and η e x , when the AHT condensation temperature increases from 30 °C to 40 °C, η t and η e x show average increases of 5.51% and 2.61%, respectively. However, when the temperature further rises from 40 °C to 50 °C, the average increases are only 1.09% and 0.66%. For the same 10 °C increment in AHT condensation temperature, the growth rates of η t and η e x differ by approximately fourfold and threefold, respectively. This indicates that as the AHT condensation temperature increases, the marginal gains in η t and η e x diminish. Additionally, since η E W R reaches its maximum value at an AHT condensation temperature of 40 °C, it can be concluded that the system achieves optimal performance when the AHT condensation temperature is set at 40 °C.

4.3. Impact of LNG-CEPG Evaporation Temperature on System Performance

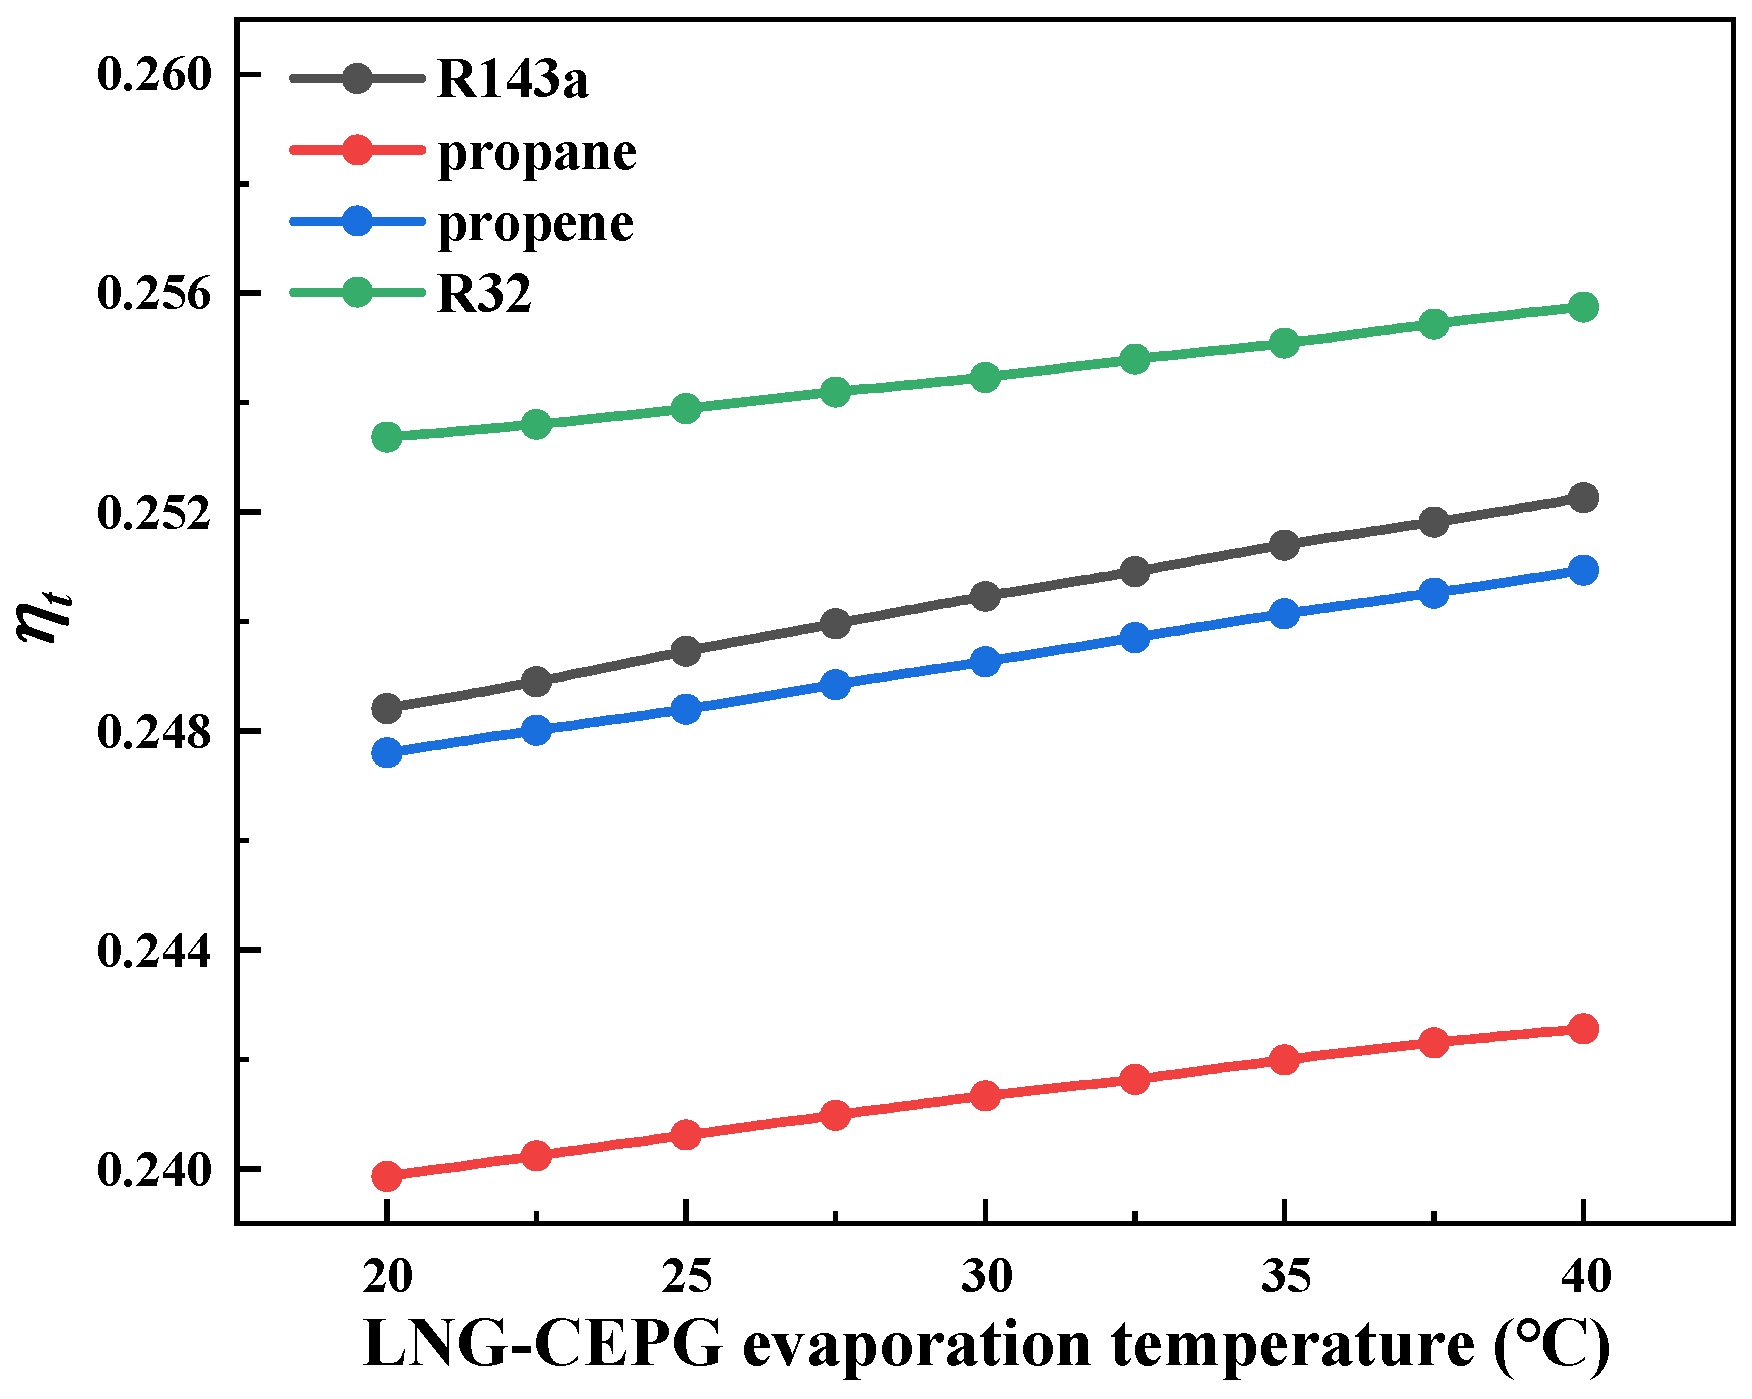
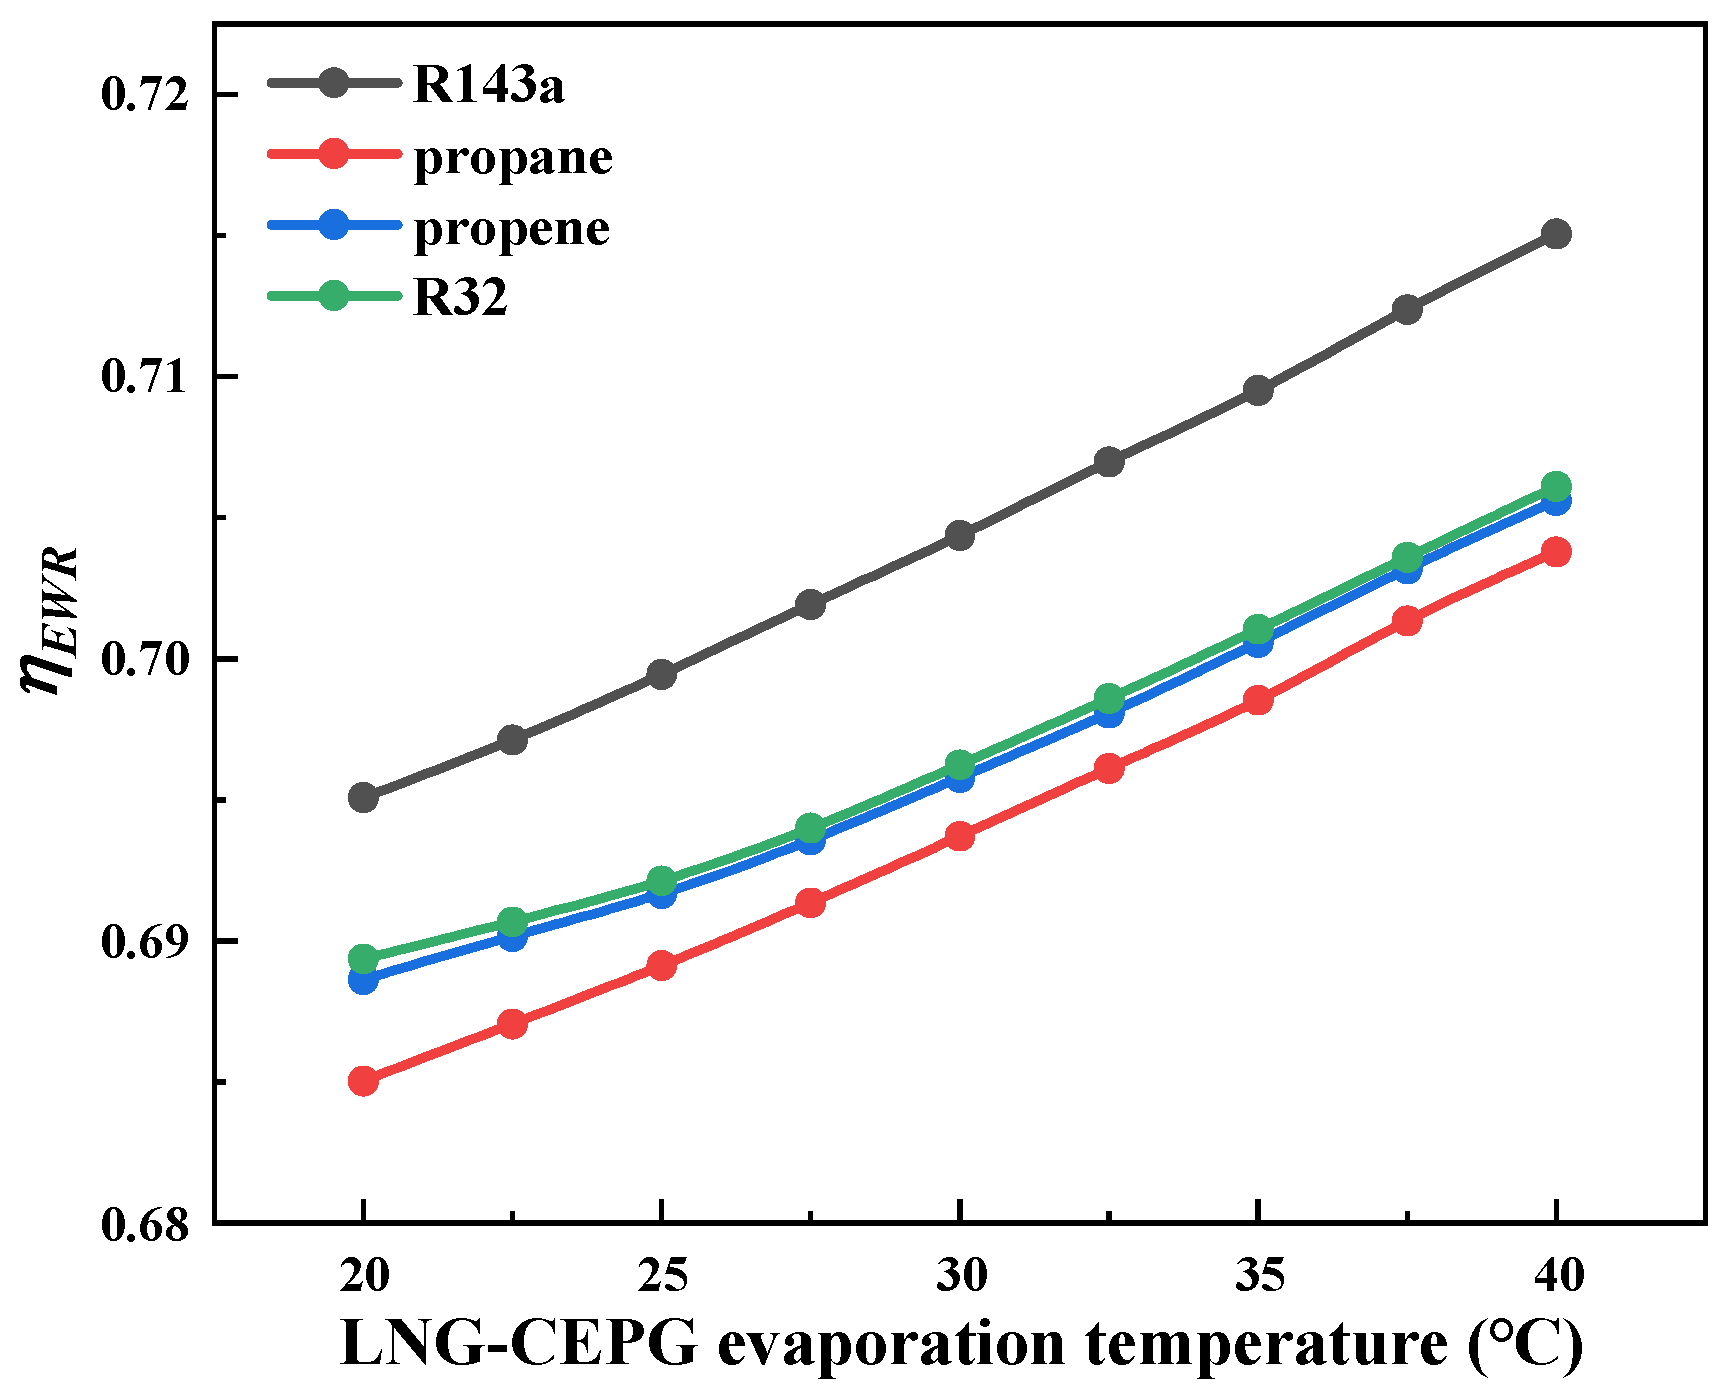
Based on four selected working fluids, this section examines the influence of different LNG-CEPG evaporation temperatures on system performance. Figure 8, Figure 9 and Figure 10, respectively, demonstrate the variations in system η t , η e x , and η E W R with LNG-CEPG evaporation temperature for different working fluids. The results show that η t , η e x , and η E W R all increase with rising evaporation temperature, though η t exhibits relatively slower growth. When the LNG-CEPG evaporation temperature increases from 20 °C to 40 °C, the average improvements in η t , η e x , and η E W R for the four working fluids reach 1.23%, 3.90%, and 2.38%, respectively. This phenomenon primarily occurs because the working fluid at the hot side of LNG-CEPG Evaporator-1 becomes superheated after evaporation. As the degree of superheat increases, the superheated heat transfer section expands, reducing the overall heat transfer coefficient. With fixed heat transfer area in Evaporator-1, this leads to decreased thermal load and reduced organic working fluid flow rate. However, the increased working fluid temperature at turbine inlet ultimately enhances output power, thereby improving overall system thermal efficiency. Nevertheless, due to the relatively low superheat and short superheated section in Evaporator-1, the reduction in thermal load remains limited, resulting in only modest η t improvement. Higher LNG-CEPG evaporation temperatures introduce superheat at Evaporator-1 outlet, which reduces the average heat transfer temperature difference between seawater and working fluid in Evaporator-1, consequently decreasing exergy destruction and improving both η e x and η E W R . The improvement in η e x and η E W R is significantly greater than that of η t , with increases higher by 217% and 93%, respectively. However, excessive superheat may potentially cause turbine surge risks and increase system instability. Based on the conclusion presented in Section 4.2 that the system performance is optimal when the AHT condensation temperature is 40 °C, it can be determined that the system exhibits superior performance when the LNG-CEPG evaporation temperature is set at 30 °C.
As evidenced in Figure 8, Figure 9 and Figure 10, the R32 working fluid demonstrates superior η t and η e x , followed by R143a and propene, while propane exhibits the lowest performance in both metrics. Regarding η E W R , R143a achieves optimal performance, with propene and propane ranking second and third, respectively.
For the AHT subsystem, its coefficient of performance (COP) across all operating conditions in this study ranges from 0.49 to 0.52. Compared with Reference [35], the AHT component in our system also demonstrates favorable thermodynamic performance.

4.4. Economic Analysis

To assess the economic feasibility and scalability potential of the proposed system, this section conducts an economic evaluation focusing on the cost composition, Levelized Cost of Electricity (LCOE), and static Payback Period (PP). The variation in LCOE with system design life is examined under different optimized working fluids, with the AHT condensation temperature held constant at 40 °C and the LNG-CEPG evaporation temperature set at 30 °C.
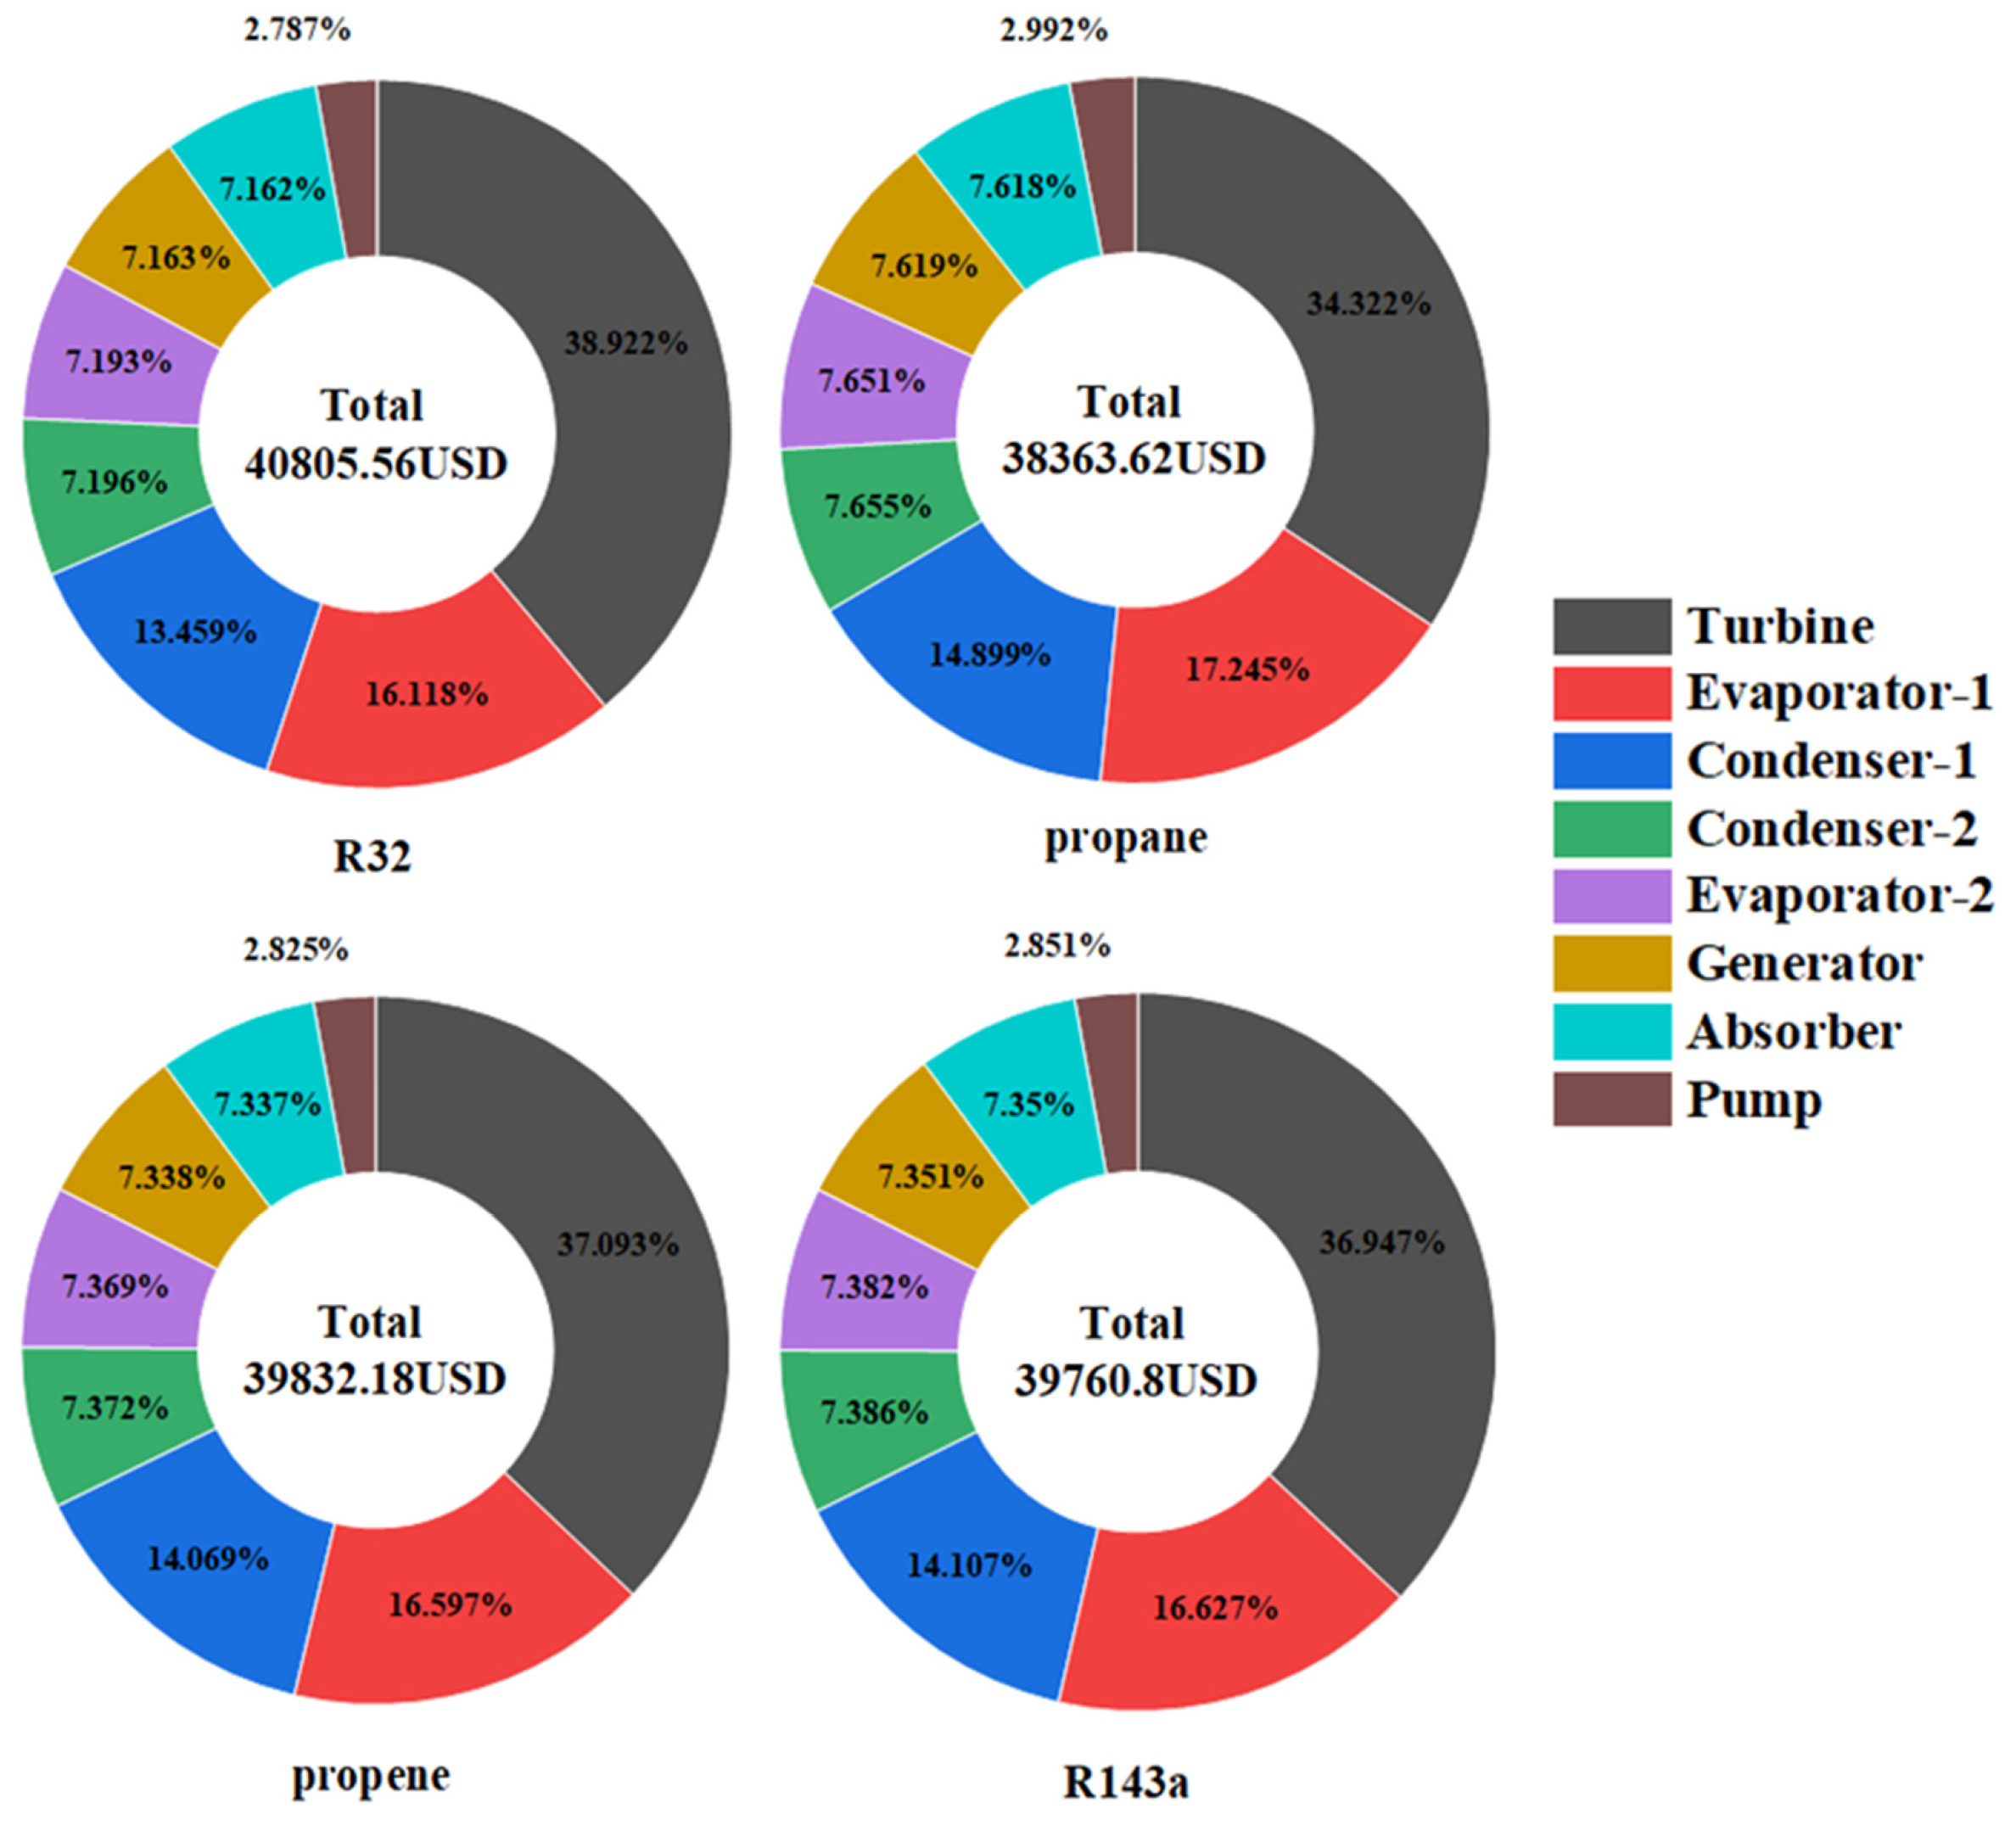
Considering the relatively small thermal load of the solution heat exchanger, its cost is assumed negligible. The AHT-LNG-CEPG equipment costs primarily consists of the generator, Evaporator-2, Condenser-2, and absorber in the AHT section; and Condenser-1, Evaporator-1, turbine, and pump in the LNG-CEPG section.
Figure 11 displays the total system cost and individual equipment cost distributions across different working fluids. The turbine consistently emerges as the highest cost component, regardless of working fluid, commanding an average 36.821% of total costs, followed by Evaporator-1 at 16.647% and Condenser-1 at 14.134%. This cost distribution profile clearly indicates that the LNG-CEPG section constitutes the primary cost center of the integrated system.
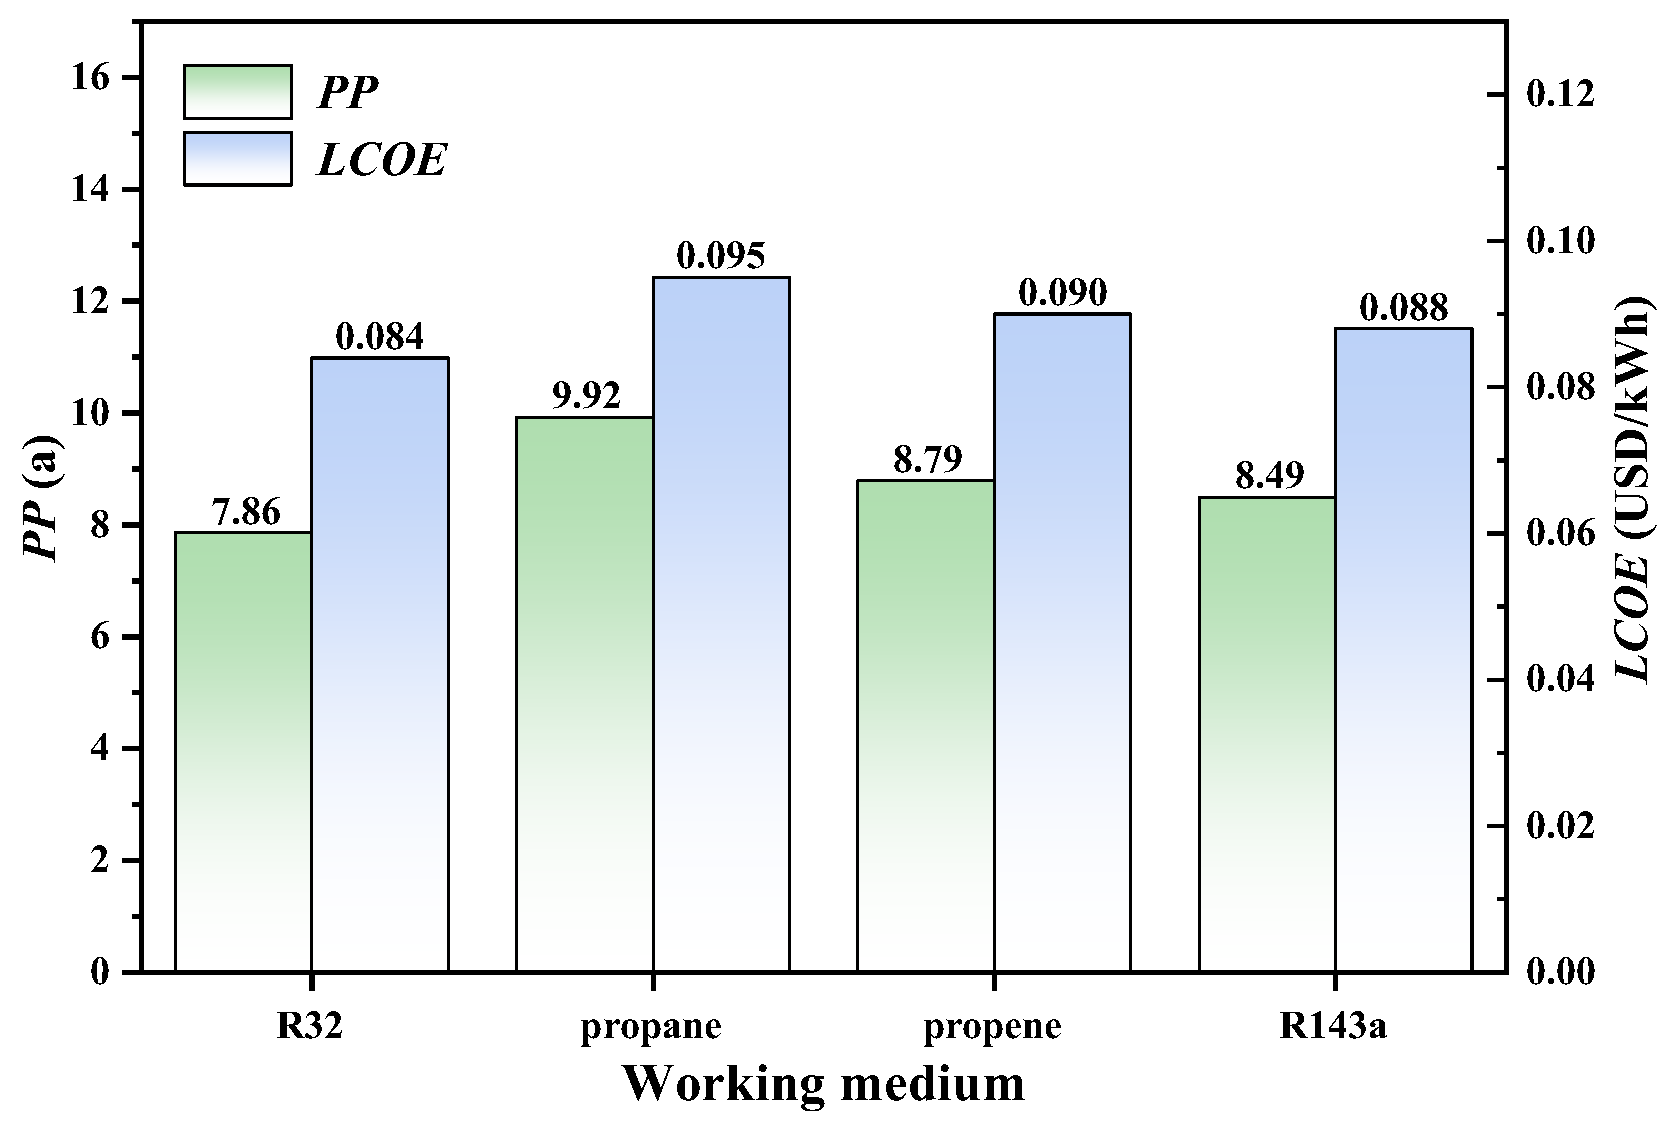
Figure 12 presents the system’s PP and LCOE under four different working fluids with a 20-year design lifespan. The results demonstrate that using R32 as the working fluid achieves the most favorable economic performance, with the lowest PP of 7.86 years and LCOE of $0.084/kWh. Propene and R143a show intermediate economic indicators, while propane yields the least favorable results with the highest PP and LCOE values among the four working fluids.
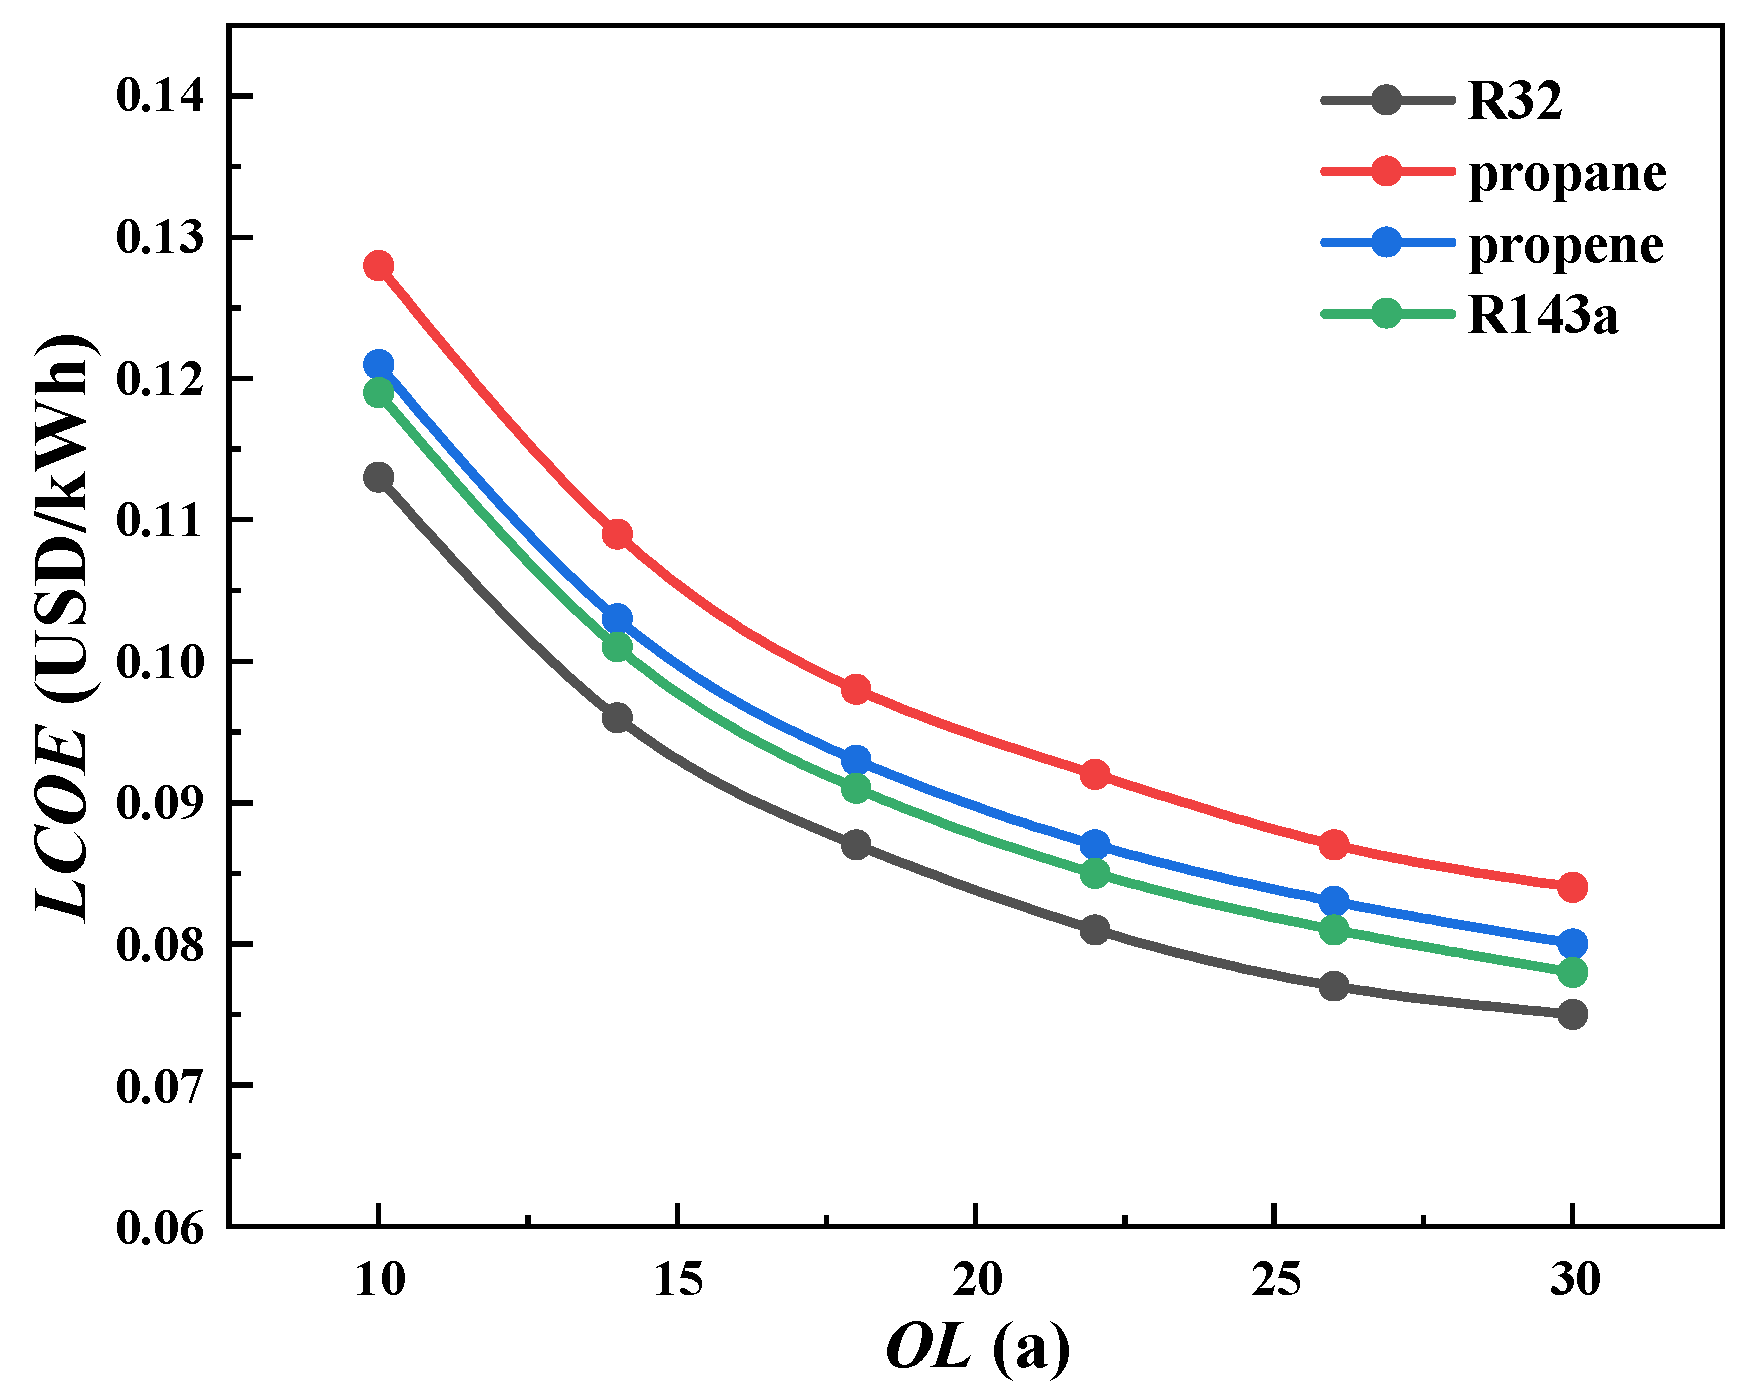
Figure 13 illustrates the variation in system LCOE with design OL for different working fluids. As the design life increases, the system LCOE shows a gradual decline, attributable to the annual cost reduction and profit increase resulting from the amortization of initial investment costs over extended operational periods. When the OL increases from 10 to 30 years, the system’s LCOE decreases by an average of $0.041 per kWh, representing an average reduction of 34.09%. Notably, the R32 working fluid demonstrates significantly lower LCOE values compared to other alternatives, indicating superior economic performance. At the 30-year design life mark, the average LCOE across all four working fluids reaches its minimum value of $0.079/kWh.
In practical engineering applications, using solar-heated water as the heat source for the AHT system as described in this study will require additional initial investment in components such as solar collectors. For different regions, the literature [48] indicates that variations in solar irradiance intensity also affect the total initial investment, Payback Period (PP), and Levelized Cost of Energy (LCOE). Regions with higher solar irradiance intensity tend to have lower total initial investment, while areas with lower irradiance may still achieve higher profitability. For large-scale industrial applications, the literature [49] shows that although increasing the capacity of solar collectors leads to a significant rise in the total initial investment, the cost growth of components such as solar collectors is nonlinear. As a result, the lifecycle cost of the system can be reduced by up to approximately 34%. For the system described in this paper, taking the working fluid R32 and a 20-year OL as an example, when additional components such as solar collectors are incorporated, the total initial investment increases significantly. According to Equation (29), for every 1% increase in the total initial investment, the system’s LCOE increases by 0.51%. However, as the area of solar collectors expands, the revenue generated also rises substantially. This indicates that large-scale implementation of the system would achieve lower LCOE and a shorter PP compared to the small-scale system discussed in this study.

4.5. A Comparison of Different LNG Cold Energy Power Generation Systems

Due to the novelty of the system proposed in this study, direct comparisons with identical systems are challenging. Therefore, the performance under the optimal operating condition identified in this work was compared with that of single-stage Organic Rankine Cycle (ORC) systems driven by different heat sources and utilizing LNG cold energy for power generation. The results are shown in Table 7. Compared with the performance metrics under the optimal cost rate in Reference [38] the thermal efficiency of the system proposed in this study is significantly higher, while the exergy efficiency is slightly lower than the results reported in Reference [38]. This difference is attributed to the integration of the Absorption Heat Transformer (AHT), which enhances the heating output and thereby improves the overall thermal efficiency. In comparisons with references [28,50], both the thermal and exergy efficiencies of the proposed system are markedly superior. This is because the aforementioned references used seawater as the heat source, which has a lower temperature than the heat source employed in the ORC subsystem of our system, resulting in lower thermal and exergy efficiencies in those studies.
Overall, the innovative system presented in this paper demonstrates significant advantages in cold energy recovery for power generation and district heating compared to the results reported in the literature.
Table 7. Comparison with different LNG cold energy power generation systems.
ParametersPresent WorkRef. [38]Ref. [28]Ref. [50]
Structure and compositionAHT-LNG-CEPGGSF-ORCSORC-LNGORC-DEC
Organic working fluidR32R601R1270Propane
Thermal source typeAHT condenser cooling waterGeothermal waterSeawaterSeawater
ηt (%)24.812.810.411.2
ηex (%)32.433.315.321.4

4.6. Limitations and Future Work

This study proposes a novel system that integrates an Absorption Heat Transformer (AHT) with an LNG cold energy power generation system, and conducts performance and economic analyses based on simulation software. Although the model has been developed in accordance with established thermodynamic principles, it is important to acknowledge its limitations and the uncertainties arising from various factors. Firstly, the research findings are derived from numerical simulations under specific assumptions; thus, the steady-state simulation results may differ from real-world engineering applications characterized by dynamic fluctuations. For example, the isentropic efficiencies of pumps and turbines are assumed constant in the simulations, whereas in practice, these values vary with changes in the thermodynamic properties of the organic working fluid. Secondly, the economic analysis relies on equipment cost estimates from the literature, and time-sensitive data such as electricity prices are subject to change over time. Actual capital investment and operational expenses can vary significantly depending on the timeframe, geographic location, market conditions, and specific project requirements. Lastly, the use of solar-heated water as the AHT heat source only considers daytime operation; nighttime conditions are not discussed in this study. Additionally, the operational scenario involving the addition of components such as solar collectors has not been discussed in this study.
To address these limitations and uncertainties and facilitate the transition from simulation to practical engineering application, future work will focus on the following directions: first, establishing a small-scale experimental platform to validate the simulation results under laboratory conditions, which will provide an empirical foundation for practical implementation. Second, incorporating thermal energy storage to enable nighttime operation and developing dynamic models to simulate fluctuations in solar irradiance. Third, conducting comprehensive, location-specific techno-economic analyses that include actual supplier quotations, installation costs, and detailed operational strategies will be essential for accurate pre-commercialization feasibility assessment. Despite these limitations and uncertainties, the innovative approach and systematic analysis presented in this study offer valuable insights, demonstrate the thermodynamic feasibility of the system, and establish a foundation for subsequent experimental and practical applications.
5. Conclusions

This study establishes an integrated LNG cold energy recovery system combining an Absorption Heat Transformer (AHT) with an LNG cold energy power generation system (LNG-CEPG). By utilizing seawater first as cooling water for temperature elevation and subsequently as the ORC heat source, the system achieves synergistic enhancement of both ORC power generation and AHT heat supply. Based on thermodynamic modeling, working fluid selection, performance analysis, and economic evaluation, the main conclusions are as follows:
  • Regarding working fluid selection, R32, propane, propene, and R143a demonstrate superior performance compared to other initially screened working fluids.
  • Increasing the AHT condensation temperature enhances system performance metrics including η t and η e x . The system achieves maximum η E W R at an AHT condensation temperature of 40 °C. When using R32 as the working fluid, the system demonstrates superior η t and η e x . Conversely, propene as the working fluid yields higher η E W R values.
  • System performance improves with increasing LNG-CEPG evaporation temperature, though η t exhibits slower growth. Considering turbine operational stability, the system demonstrates optimal performance at an LNG-CEPG evaporation temperature of 30 ℃. The R32 and R143a working fluids yield the most superior system performance under these conditions.
  • The turbine consistently represents the highest cost component across all working fluid conditions, accounting for an average of 36.8% of total system costs, followed by Evaporator-1 and Condenser-1. This cost distribution suggests that optimizing the LNG-CEPG system can be prioritized for equipment cost reduction. When employing R32 as the working fluid, the system achieves optimal economic performance with the lowest LCOE of 0.084 USD/kWh and PP of 7.86 years. The LCOE exhibits a consistent downward trend with increasing operational life OL, reaching an average minimum value of 0.079 USD/kWh at 30 years OL.

Author Contributions

X.L.: Investigation, Conceptualization, Formal analysis, Methodology, Software, Validation, Writing—original draft, Writing—review and editing. Y.M.: Investigation, Data curation, Formal analysis. Z.L.: Investigation, Software, Resources. L.C.: Conceptualization, Supervision, Funding acquisition, Writing—review and editing. All authors have read and agreed to the published version of the manuscript.

Funding

This work was supported by the Scientific and Technological Innovation Project of Carbon Emission Peak and Carbon Neutrality of Jiangsu Province (BE2023090).

Institutional Review Board Statement

Not applicable.

Informed Consent Statement

Not applicable.

Data Availability Statement

The original contributions presented in this study are included in the article. Further inquiries can be directed to the corresponding author.

Conflicts of Interest

The authors declare that they have no known competing financial interests or personal relationships that could have appeared to influence the work reported in this paper.

Abbreviations

The following abbreviations are used in this manuscript:
AMCAuxiliary material costs
AOHAnnual operating hours
ATPAnnual total profit
EPElectricity price
EPCEquipment procurement costs
ICInstallation costs
IICInitial investment costs
LCOELevelized cost of electricity
LNGLiquefied natural gas
LNG-CEPGLNG cold energy power generation
AHTAbsorption heat transformer
OLOperating life
PPPayback period
NGNatural gas
ORCOrganic Rankine Cycle

References

  1. Li, J.; Fan, X.; Li, Y.; Wang, Z.; Gao, Z.; Ji, W.; Chen, L.; Wang, J. A novel system of liquid air energy storage with LNG cold energy and industrial waste heat: Thermodynamic and economic analysis. J. Energy Storage 2024, 86, 111359. [Google Scholar] [CrossRef]
  2. Srilekha, M.; Dutta, A. Design and optimization of boil-off gas recondensation process by recovering waste cold energy in LNG regasification terminals. Chem. Eng. Res. Des. 2024, 205, 292–300. [Google Scholar] [CrossRef]
  3. Sun, D.; Wang, C.; Shen, Q. A compression-free re-liquefication process of LNG boil-off gas using LNG cold energy. Energy 2024, 294, 130894. [Google Scholar] [CrossRef]
  4. Jiang, Q.; Wan, S.; Pan, C.; Feng, G.; Li, H.; Feng, H.; Meng, B.; Gu, J.; Feng, Y. Thermodynamic design and analysis of air-liquefied energy storage combined with LNG regasification system. Int. J. Refrig. 2024, 160, 329–340. [Google Scholar] [CrossRef]
  5. He, T.; Chong, Z.R.; Zheng, J.; Ju, Y.; Linga, P. LNG cold energy utilization: Prospects and challenges. Energy 2019, 170, 557–568. [Google Scholar] [CrossRef]
  6. Kanbur, B.B.; Xiang, L.; Dubey, S.; Choo, F.H.; Duan, F. Cold utilization systems of LNG: A review. Renew. Sust. Energy Rev. 2017, 79, 1171–1188. [Google Scholar] [CrossRef]
  7. Chen, K.; Yu, H.; Fan, G.; Zhang, Y.; Dai, Y. Multi-objective optimization of a novel combined parallel power generation system using CO2 and N2 for cascade recovery of LNG cryogenic energy. Energy Convers. Manag. 2022, 256, 115395. [Google Scholar] [CrossRef]
  8. Kim, K.; Lee, U.; Kim, C.; Han, C. Design and optimization of cascade organic Rankine cycle for recovering cryogenic energy from liquefied natural gas using binary working fluid. Energy 2015, 88, 304–313. [Google Scholar] [CrossRef]
  9. Tesch, S.; Morosuk, T.; Tsatsaronis, G. Advanced exergy analysis applied to the process of regasification of LNG (liquefied natural gas) integrated into an air separation process. Energy 2016, 117, 550–561. [Google Scholar] [CrossRef]
  10. He, T.; Zhang, J.; Mao, N.; Linga, P. Organic Rankine cycle integrated with hydrate-based desalination for a sustainable energy–water nexus system. Appl. Energy 2021, 291, 116839. [Google Scholar] [CrossRef]
  11. Qi, M.; Park, J.; Kim, J.; Lee, I.; Moon, I. Advanced integration of LNG regasification power plant with liquid air energy storage: Enhancements in flexibility, safety, and power generation. Appl. Energy 2020, 269, 115049. [Google Scholar] [CrossRef]
  12. Zhao, L.; Dong, H.; Tang, J.; Cai, J. Cold energy utilization of liquefied natural gas for capturing carbon dioxide in the flue gas from the magnesite processing industry. Energy 2016, 105, 45–56. [Google Scholar] [CrossRef]
  13. Chen, W.; Huang, Z.; Chua, K.J. Sustainable energy recovery from thermal processes: A review. Energy Sustain. Soc. 2022, 12, 46. [Google Scholar] [CrossRef]
  14. Franco, A.; Giovannini, C. Optimal design of direct expansion systems for electricity production by LNG cold energy recovery. Energy 2023, 280, 128173. [Google Scholar] [CrossRef]
  15. Sun, Z.; Zhang, H.; Zhang, T.; Lin, L.; Lin, K. Optimizations and comparison of three two-stage Rankine cycles under different heat source temperatures and NG distribution pressures. Energy Convers. Manag. 2020, 209, 112655. [Google Scholar] [CrossRef]
  16. Yu, H.; Kim, D.; Gundersen, T. A study of working fluids for Organic Rankine Cycles (ORCs) operating across and below ambient temperature to utilize Liquefied Natural Gas (LNG) cold energy. Energy 2019, 167, 730–739. [Google Scholar] [CrossRef]
  17. Zhang, H.; Cavazzini, G.; Benato, A. Multi-objective optimisation of ORC–LNG systems using the novel One-shot Optimisation method. Energy 2024, 313, 133629. [Google Scholar] [CrossRef]
  18. Wu, J.; Shang, L.; Pan, Z.; Zhou, L. Energy, Exergy, Economic, Exergoeconomic, and Exergoenvironmental (5E) Analyses and Optimization of a Novel Three-Stage Cascade System Based on Liquefied Natural Gas Cold Energy. Energy Technol. 2022, 10, 2200228. [Google Scholar] [CrossRef]
  19. Ghaebi, H.; Namin, A.S.; Rostamzadeh, H. Exergoeconomic optimization of a novel cascade Kalina/Kalina cycle using geothermal heat source and LNG cold energy recovery. J. Clean. Prod. 2018, 189, 279–296. [Google Scholar] [CrossRef]
  20. Joy, J.; Chowdhury, K. Enhancing generation of green power from the cold of vaporizing LNG at 30 bar by optimising heat exchanger surface area in a multi-staged organic Rankine cycle. Sustain. Energy Technol. Assess. 2021, 43, 100930. [Google Scholar] [CrossRef]
  21. Bao, J.; Zhang, R.; Lin, Y.; Zhang, N.; Zhang, X.; He, G. The effect of the arrangements for compression process and expansion process on the performance of the two-stage condensation Rankine cycle. Energy Convers. Manag. 2018, 159, 299–311. [Google Scholar] [CrossRef]
  22. Tian, Z.; Yue, Y.Y.; Zhang, Y.; Gu, B.; Gao, W.Z. Multi-Objective Thermo-Economic Optimization of a Combined Organic Rankine Cycle (ORC) System Based on Waste Heat of Dual Fuel Marine Engine and LNG Cold Energy Recovery. Energies 2020, 13, 1397. [Google Scholar] [CrossRef]
  23. Bao, J.; Lin, Y.; Zhang, R.; Zhang, N.; He, G. Effects of stage number of condensing process on the power generation systems for LNG cold energy recovery. Appl. Therm. Eng. 2017, 126, 566–582. [Google Scholar] [CrossRef]
  24. Li, B.; Xie, H.; Sun, L.; Gao, T.; Xia, E.; Liu, B.; Wang, J.; Long, X. Advanced exergy analysis and multi-objective optimization of dual-loop ORC utilizing LNG cold energy and geothermal energy. Renew. Energy 2025, 239, 122164. [Google Scholar] [CrossRef]
  25. Rao, W.-J.; Zhao, L.-J.; Liu, C.; Zhang, M.-G. A combined cycle utilizing LNG and low-temperature solar energy. Appl. Therm. Eng. 2013, 60, 51–60. [Google Scholar] [CrossRef]
  26. He, S.N.; Chang, H.W.; Zhang, X.Q.; Shu, S.M.; Duan, C. Working fluid selection for an Organic Rankine Cycle utilizing high and low temperature energy of an LNG engine. Appl. Therm. Eng. 2015, 90, 579–589. [Google Scholar] [CrossRef]
  27. Liu, Q.; Song, J.; Duan, Y. Comparative thermodynamic analyses of Rankine cycles using different working fluids for LNG cold energy recovery. Case Stud. Therm. Eng. 2025, 69, 105952. [Google Scholar] [CrossRef]
  28. He, T.; Ma, H.; Ma, J.; Mao, N.; Liu, Z. Effects of cooling and heating sources properties and working fluid selection on cryogenic organic Rankine cycle for LNG cold energy utilization. Energy Convers. Manag. 2021, 247, 114706. [Google Scholar] [CrossRef]
  29. Joy, J.; Chowdhury, K. Appropriate number of stages of an ORC driven by LNG cold energy to produce acceptable power with reasonable surface area of heat exchangers. Cryogenics 2022, 128, 103599. [Google Scholar] [CrossRef]
  30. Pan, Z.; Fu, Y.; Chen, H.; Song, Y. Thermodynamic analysis of a cascade organic Rankine cycle power generation system driven by hybrid geothermal energy and liquefied natural gas. Front. Energy Res. 2024, 12, 1474714. [Google Scholar] [CrossRef]
  31. Xia, W.; Huo, Y.; Song, Y.; Han, J.; Dai, Y. Off-design analysis of a CO2 Rankine cycle for the recovery of LNG cold energy with ambient air as heat source. Energy Convers. Manag. 2019, 183, 116–125. [Google Scholar] [CrossRef]
  32. López-Pérez, L.A.; Torres-Díaz, T.; Grajales, S.G.P.; Prieto, J.J.F.; Romero, D.J.; Pérez, J.A.H.; Huicochea, A. Solar Water Heating System with Absorption Heat Transformer for Annual Continuous Water Heating. Processes 2024, 12, 1650. [Google Scholar] [CrossRef]
  33. Gong, Y.; Liu, F.; Sui, J.; Wang, X.; Jin, H. Comparative analysis of thermodynamic performance of high-temperature absorption heat transformers using various ionic liquids as working pairs. Int. J. Refrig. 2024, 165, 434–445. [Google Scholar] [CrossRef]
  34. Shen, Z.; Li, S.; Feng, L.; Jin, Z.; Du, K.; Li, Y.; Sheng, W. Performance research of a solution cross-type absorption-resorption heat transformer using NH3/H2O work fluid. Appl. Therm. Eng. 2024, 246, 122874. [Google Scholar] [CrossRef]
  35. Santos, M.; Pinho, C.; Campos, J. Thermodynamic Simulations of a Single-Stage Absorption Heat Transformer Utilizing Low-Temperature Waste Heat (60 °C). Processes 2025, 13, 1001. [Google Scholar] [CrossRef]
  36. Ibarra-Bahena, J.; Dehesa-Carrasco, U.; Montiel-González, M.; Romero, R.J.; Venegas-Reyes, E. Feasibility analysis of a hot water solar system coupled to an absorption crossMark heat transformer. Appl. Therm. Eng. 2017, 114, 1176–1185. [Google Scholar] [CrossRef]
  37. Bao, J.; Yuan, T.; Zhang, L.; Zhang, N.; Zhang, X.; He, G. Comparative study of liquefied natural gas (LNG) cold energy power generation systems in series and parallel. Energy Convers. Manag. 2019, 184, 107–126. [Google Scholar] [CrossRef]
  38. Pan, J.; Li, M.; Zhu, M.; Li, R.; Tang, L.; Bai, J. Energy, exergy and economic analysis of different integrated systems for power generation using LNG cold energy and geothermal energy. Renew. Energy 2023, 202, 1054–1070. [Google Scholar] [CrossRef]
  39. Eghtesad, A.; Afshin, H.; Kazemzadeh Hannani, S. Energy, exergy, exergoeconomic, and economic analysis of a novel power generation cycle integrated with seawater desalination system using the cold energy of liquified natural gas. Energy Convers. Manag. 2021, 243, 114352. [Google Scholar] [CrossRef]
  40. Feng, Y.; Hung, T.; Greg, K.; Zhang, Y.; Li, B.; Yang, J. Thermoeconomic comparison between pure and mixture working fluids of organic Rankine cycles (ORCs) for low temperature waste heat recovery. Energy Convers. Manag. 2015, 106, 859–872. [Google Scholar] [CrossRef]
  41. Badami, M.; Bruno, J.C.; Coronas, A.; Fambri, G. Analysis of different combined cycles and working fluids for LNG exergy recovery during regasification. Energy 2018, 159, 373–384. [Google Scholar] [CrossRef]
  42. Ma, J.; Song, X.; Zhang, B.; Mao, N.; He, T. Optimal design of dual-stage combined cycles to recover LNG cold energy and low-temperature waste thermal energy for sustainable power generation. Energy Convers. Manag. 2022, 269, 116141. [Google Scholar] [CrossRef]
  43. Pan, J.; Li, M.; Li, R.; Tang, L.; Bai, J. Design and analysis of LNG cold energy cascade utilization system integrating light hydrocarbon separation, organic Rankine cycle and direct cooling. Appl. Therm. Eng. 2022, 213, 118672. [Google Scholar] [CrossRef]
  44. Bao, J.; Lin, Y.; Zhang, R.; Zhang, N.; He, G. Strengthening power generation efficiency utilizing liquefied natural gas cold energy by a novel two-stage condensation Rankine cycle (TCRC) system. Energy Convers. Manag. 2017, 143, 312–325. [Google Scholar] [CrossRef]
  45. Park, S.C.; Son, C.H.; Lee, H.S.; Lim, S.T.; Yoon, J.W.; Choi, M.K.; Seol, S.H. Performance analysis of an organic Rankine cycle with an internal heat exchanger considering turbine pressure ratio and efficiency. Energy 2023, 285, 129507. [Google Scholar] [CrossRef]
  46. Wang, Z.; Li, J.; Li, Y.; Fan, X.; Gao, Z.; Ji, W.; Chen, L.; Wang, J. Thermodynamic and economic analysis of multi-generation system based on LNG-LAES integrating with air separation unit. Energy 2024, 306, 132441. [Google Scholar] [CrossRef]
  47. Tsougranis, E.-L.; Wu, D. A feasibility study of Organic Rankine Cycle (ORC) power generation using thermal and cryogenic waste energy on board an LNG passenger vessel. Int. J. Energy Res. 2018, 42, 3121–3142. [Google Scholar] [CrossRef]
  48. Gilani, H.A.; Hoseinzadeh, S. Techno-economic study of compound parabolic collector in solar water heating system in the northern hemisphere. Appl. Therm. Eng. 2021, 190, 116756. [Google Scholar] [CrossRef]
  49. Jin, X.; You, S.; Huang, G.; Lai, A.C.K. Techno-economic assessment of the solar-assisted heat pump latent heat thermal energy storage system for water heating. Energy Build. 2023, 301, 113657. [Google Scholar] [CrossRef]
  50. Wan, T.; Bai, B.; Zhou, W. Exergy destruction analysis of a power generation system utilizing the cold energy of LNG. Heliyon 2023, 9, e19393. [Google Scholar] [CrossRef]
Figure 1. Schematic diagram of AHT-LNG-CEPG.
Eng 06 00315 g001
Figure 2. ηt and η e x of the system under different organic working fluid conditions.
Eng 06 00315 g002
Figure 3. Wnet and η E W R of the system under different organic working fluid conditions.
Eng 06 00315 g003
Figure 4. Schematic diagram of the heat exchange curve between LNG and organic working fluid.
Eng 06 00315 g004
Figure 5. ηt vs. AHT condensation temperature under different organic working fluids.
Eng 06 00315 g005
Figure 6. ηex vs. AHT condensation temperature under different organic working fluids.
Eng 06 00315 g006
Figure 7. ηEWR vs. AHT condensation temperature under different organic working fluids.
Eng 06 00315 g007
Figure 8. ηt vs. LNG-CEPG evaporation temperature under different organic working fluids.
Eng 06 00315 g008
Figure 9. ηex vs. LNG-CEPG evaporation temperature under different organic working fluids.
Eng 06 00315 g009
Figure 10. ηEWR vs. LNG-CEPG evaporation temperature under different organic working fluids.
Eng 06 00315 g010
Figure 11. Equipment cost distribution of the AHT-LNG-CEPG system under different organic working fluid conditions.
Eng 06 00315 g011
Figure 12. LCOE and PP of the AHT-LNG-CEPG system with different organic working fluids.
Eng 06 00315 g012
Figure 13. Variation in LCOE with OL for the AHT-LNG-CEPG system under different organic working fluids.
Eng 06 00315 g013
Table 1. The estimation model of IIC.
ItemPrice
IICIIC = EPC + AMC + IC
EPCTurbine705.2477 USD/kW [46]
Pump1510.3516 USD/kW [46]
Heat exchanger48.6458 USD/kW [46]
AMC10% × EPC [46]
IC25% × EPC [46]
Table 2. Physical, safety, and environmental properties of the preliminarily selected organic working fluids.
Organic Working FluidPhysical PropertiesSafety ParametersEnvironmental Metrics
T b p ° C T f r ° C T c ° C P c M P a ODPGWP
R32−51.91−136.8178.115.782A20675
propane−42.11−187.6296.744.2512A30~20
propene−47.91−185.2091.064.555-0~20
R143a−47.52−111.8172.213.761A303800
R218−37.08−147.771.872.64A108600
R41−78.55−143.3344.135.897-097
ethane−88.82−187.7832.174.7722A30~20
R134a−26.36−103.3101.064.059A10<1
R152a−24.30−118.59113.264.517A20140
Tbp: Boiling point (at standard atmosphere); Tfr: Freezing point; Tc: Critical temperature; Pc: Critical pressure.
Table 3. Composition of LNG.
ComponentMethaneEthanePropanen-Butanen-PentaneNitrogen
Mole fraction (%)88.56.531.50.40.1
Table 4. Key operational parameters for system simulation.
ParameterValue
Initial temperature of LNG−162 °C
Initial temperature of seawater20 °C
Initial pressure of LNG0.125 MPa
Delivery pressure of NG2.5 MPa
Pumping pressure of seawater0.3 MPa
Initial pressure of seawater0.101 MPa
Condensation pressure in ORC0.11 MPa
Minimum approach temperature in heat exchanger5 °C
Isentropic efficiency of turbine0.9
Isentropic efficiency of pump0.85
Concentration of lithium bromide aqueous solution55%
Mass flow of lithium bromide aqueous solution720 kg/h
Import temperature of solar hot water95 °C
Inlet temperature of the return water in heating network95 °C
Import pressure of solar hot water0.3 MPa
Inlet pressure of the return water in heating network0.6 MPa
Ambient temperature25 °C
Ambient pressure0.101 MPa
Table 5. Comparative validation results against reference [47].
ParametersPresent ModeRef. [47]Relative Error (%)
Organic working fluidethyleneethylene-
Wnet (kW)334.5346.63.49
ηt (%)22.4923.584.62
ηex (%)23.6424.553.71
Table 6. Comparative validation results against reference [29].
ParametersPresent ModeRef. [29]Relative Error (%)
Organic working fluidpropanepropane-
Wnet (kW)211621702.49
ηt (%)8.658.973.57
ηex (%)18.7319.674.78
Disclaimer/Publisher’s Note: The statements, opinions and data contained in all publications are solely those of the individual author(s) and contributor(s) and not of MDPI and/or the editor(s). MDPI and/or the editor(s) disclaim responsibility for any injury to people or property resulting from any ideas, methods, instructions or products referred to in the content.