Article

Driving Green Through Lean: A Structured Causal Analysis of Lean Practices in Automotive Sustainability

by
Matteo Ferrazzi
* and
Alberto Portioli-Staudacher
Department of Management, Economics and Industrial Engineering, Politecnico di Milano, 20156 Milano, Italy
*
Author to whom correspondence should be addressed.
Eng 2025, 6(11), 296; https://doi.org/10.3390/eng6110296 (registering DOI)
Submission received: 10 July 2025 / Revised: 24 September 2025 / Accepted: 2 October 2025 / Published: 1 November 2025
(This article belongs to the Section Chemical, Civil and Environmental Engineering)

Abstract

The urgent global challenge of environmental sustainability has intensified interest in integrating Lean Management practices with environmental objectives, particularly within the automotive industry, a sector known for both innovation and high environmental impact. This study investigates the systemic relationships between 16 lean practices and three environmental performance metrics: energy consumption, CO2 emissions, and waste generation. Using the Fuzzy Decision-Making Trial And Evaluation Laboratory (DEMATEL) methodology, data were collected from seven lean experts in the Italian automotive industry to model the cause–effect dynamics among the selected practices. The analysis revealed that certain practices, such as Total Productive Maintenance (TPM), just-in-time (JIT), and one-piece-flow, consistently act as influential drivers across all environmental objectives. Conversely, practices like Statistical Process Control (SPC) and Total Quality Management (TQM) were identified as highly dependent, delivering full benefits only when preceded by foundational practices. The results suggest a strategic three-step implementation roadmap tailored to each environmental goal, providing decision-makers with actionable guidance for sustainable transformation. This study contributes to the literature by offering a structured perspective on lean and environmental sustainability in the context of the automotive sector in Italy. The research is supported by a data-driven method to prioritize practices based on their systemic influence and contextual effectiveness.

1. Introduction

The pursuit of environmental sustainability has become one of the defining global imperatives of the 21st century [1]. This collective shift gained formal momentum with the adoption of the United Nations’ 2030 Agenda for Sustainable Development, a comprehensive blueprint comprising 17 Sustainable Development Goals (SDGs) that address social, economic, and environmental challenges [2]. Four of these goals are directly related to climate action, sustainable industry, and responsible resource consumption, issues in which the manufacturing sector plays a pivotal role [3]. Manufacturing accounts for approximately one-third of global energy consumption, largely due to energy-intensive processes such as raw material extraction, transformation, and assembly. Furthermore, the transportation of manufactured goods significantly contributes to greenhouse gas emissions. As a result, reducing energy use and environmental impact in this sector is critical to meeting global sustainability targets [1]. However, the solution does not lie in halting industrial activity but rather in transforming manufacturing processes through the adoption of cleaner technologies, circular economy principles, renewable energy sources, and sustainability-driven management approaches [4].
In this context, Lean Management emerges as a promising strategy [5]. Originally developed to improve efficiency and eliminate waste within production systems, lean has evolved to align with environmental objectives [6,7]. Core lean principles not only reduce cost and increase quality but also enhance resource efficiency and minimize environmental waste [8]. This synergy has led to the “Green and Lean” approach, where Lean Management and environmental sustainability reinforce one another in promoting sustainable manufacturing [9,10,11]. Among industrial sectors, the automotive industry provides a particularly relevant context for studying this convergence [12]. As one of the most environmentally impactful and innovation-driven sectors, it has historically embraced lean principles to respond to global competition and rising efficiency demands [13]. From Ford’s early assembly lines to Japan’s just-in-time systems and statistical controls, the sector has often led the way in production innovation [14]. Today, however, the industry faces mounting challenges: increasing carbon emissions, volatile resource costs, and pressure to transition toward cleaner production systems. These dynamics make the automotive sector not only a major contributor to environmental degradation but also a key arena for sustainable transformation [15]. Despite the growing attention to lean’s environmental implications, the academic literature remains fragmented. Many studies have examined individual lean tools or focused narrowly on specific environmental indicators [16]. There is limited research adopting a systems perspective to explore the interdependencies among lean practices and their collective effect on multiple dimensions of environmental performance [17]. Moreover, few works have employed rigorous, data-driven methods to quantify these relationships and guide strategic implementation [18]. This study addresses these gaps by applying the Fuzzy-DEMATEL method to identify and analyze the cause-and-effect relationships among 16 lean practices within the Italian automotive industry. Through expert-based evaluation, this study models how each practice influences environmental performance and identifies which practices serve as key drivers for sustainability-oriented transformation. The paper proceeds as follows: Section 2 presents a structured literature review, highlighting the conceptual overlap between lean and environmental sustainability; Section 3 outlines the research methodology, including expert selection, data collection, and the application of Fuzzy-DEMATEL; Section 4 details the results, providing causal diagrams for three types of environmental performance; Section 5 presents a critical discussion on the results emerged; Section 6 discusses theoretical implications, limitations, and suggestions for future research. By integrating lean principles into a structured environmental performance framework, this research provides both theoretical and practical contributions to the growing field of sustainable operations management.

2. Literature Review

This literature review has two primary objectives. First, it aims to identify the Lean Management practices most frequently associated with improved environmental performance in manufacturing, through a systematic literature review. Second, it seeks to critically assess the state of the art to uncover key research gaps, which will serve as the foundation for this study’s research questions.

2.1. Systematic Literature Review on Lean and Environmental Performance

A systematic literature review has been conducted to synthesize existing knowledge, critically evaluate prior studies, and identify gaps in the literature [5]. The research was conducted using the SCOPUS database. Starting from a defined query ((“lean practices” OR “lean tools” OR “lean manufacturing” OR “lean management”) AND (“environmental practices” OR “environmental sustainability” OR “green practices” OR sustainable manufacturing” OR “ecoefficiency” OR “environmental performance”)), the initial records obtained have been filtered, first limiting them to articles written in English and second, through the title and abstract, excluding articles not related to manufacturing, such as agriculture, services, and the supply chain. Then, through a full reading, further articles were considered out of scope because of their distance from the focus on lean and environmental sustainability, like a major focus on Lean Management only, without investigating its linkage with environmental sustainability; articles about Industry 4.0; or articles mainly focused on the other pillars of the Triple Bottom Line (Profit and People). Hence, the following literature review is based on a total of 107 articles; all refer to the impact of lean manufacturing on environmental sustainability. Despite this, the articles were categorized into two groups: Pool A and Pool B. Pool A: Articles that primarily delve into the assessment of how lean manufacturing practices affect environmental performance in manufacturing contexts, while also scrutinizing the variables that play a role in shaping the impact of lean manufacturing on environmental sustainability performance. Their significance is amplified as they distinctly demonstrate how specific lean manufacturing practices affect environmental sustainability performance. Pool B: Papers that explore the theoretical aspects of the fusion of lean manufacturing techniques with green manufacturing principles. These papers clarify how lean manufacturing methodologies have been adapted and merged with environmental sustainability practices to promote more sustainable production environments. These articles hold a moderate level of significance in the context of this literature review, as they provide a more overarching perspective on the impact of lean manufacturing on environmental sustainability.
Among the foundational references in this domain is the work of Shah and Ward 2003, who proposed 22 lean practices grouped into four bundles: just-in-time (JIT), Total Quality Management (TQM), Total Productive Maintenance (TPM), and Human Resource Management (HRM) [19]. Their classification has guided much of the subsequent literature. Building on this foundation, [20] extended the list by introducing eight additional practices and reorganizing them into five categories: supplier-related, production planning and control, process technology, human resources, and customer satisfaction. This more nuanced classification allows for a richer understanding of how lean practices contribute to environmental goals across various organizational functions. Based on the literature and in line with [20]’s framework, this study focuses on the following 16 lean practices (Table 1). These practices were selected for their demonstrated influence on environmental performance across various studies and manufacturing sectors. In particular, several articles have been published in the last five years showing the positive impact of lean practices on environmental performance. Specifically, there have been examples of how VSMs have led to improved energy savings [21], how continuous improvement processes have resulted in a reduction in CO2 consumption [22], and how JIT has contributed to a decrease in waste generation [16].

2.2. Research Gaps and Emerging Questions

While the reviewed literature broadly confirms that lean practices can support environmental sustainability, it also reveals significant limitations [23]. Most notably, prior studies tend to evaluate individual practices in isolation, neglecting the interdependencies that exist within a lean system [21]. This fragmented view overlooks potential synergistic effects, as described by Dieste et al., 2020, as a “multiplier effect”, whereby the combined implementation of multiple lean practices generates a greater environmental impact than the sum of individual efforts [16]. Furthermore, this research aims to address the limitations highlighted by [20] in their study and to continue the line of research they initiated. The authors themselves identified a limitation of their research and thus a starting point for future research: the consideration of interactions between Lean Management practices to investigate their effect on the environmental sphere. To date, the literature has provided positive evidence of the use of Lean Management for improved environmental performance [24]. Still, the examination of these benefits has focused on the implementation of individual practices rather than considering Lean Management as a unified set of practices. The authors themselves suggest using the DEMATEL methodology to incorporate the internal and external dependencies that exist between Lean Management practices. Indeed, [20] themselves identified a challenge for organizations in establishing the correct sequence of implementing lean practices to achieve a better environmental performance [20]. To supplement the existing literature and fill these gaps, this research aims to investigate the cause-and-effect relationships between Lean Six Sigma practices and environmental sustainability. Furthermore, it is interesting to study how these relations change, considering three different aspects of environmental performance: energy consumption, CO2 emissions, and waste generation.
In particular, the subset of lean practices to be investigated must be selected based on the analyzed sector, and the reasoning is similar for targeting environmental performance. In fact, the specific characteristics of the production processes in different sectors may influence the effectiveness of certain lean practices [25]. The industry chosen for this study is the automotive sector because it presents a high degree of maturity in implementing lean practices. Indeed, the automotive industry is the cradle of the Lean Management philosophy, which originated from the popularization of Toyota’s lean production approach, known as the Toyota Production System, and then spread from the 1980s under the name Lean Management [26]. Since then, this sector has continued to develop and refine lean practices, becoming one of the most advanced sectors in this field and establishing itself as a benchmark. Furthermore, the automotive sector is one of the primary contributors to industrial pollution and the significant environmental impact worldwide. Substantial consumption of natural resources, energy, and raw materials indeed characterizes this sector.
In light of the literature review, the following research questions are formulated:
  • RQ1: What are the cause–effect relationships among lean practices aimed at enhancing environmental sustainability?
  • RQ2: How do these relationships differ when evaluating distinct environmental performance indicators: energy consumption, CO2 emissions, and waste generation?
By addressing these questions, this study contributes to a more comprehensive understanding of how lean systems can be strategically leveraged for sustainability in complex manufacturing environments, particularly within the automotive sector. Figure 1 summarizes the overall study framework. Starting from the identification of research gaps through the literature review, the framework highlights the formulation of the research questions, followed by the methodological approach adopted (Fuzzy DEMATEL), and the subsequent stages of the results and discussion. This graphical representation provides a clear overview of the logical flow of this study and the steps undertaken to address the research questions.

3. Methodology

To address the research questions and explore the impact of lean practices on environmental performance and their interconnections, this study employed the Decision-Making Trial and Evaluation Laboratory (DEMATEL) technique [27]. The DEMATEL approach has been considered one of the best tools for dealing with the importance of causal relationships among evaluation criteria. DEMATEL was chosen because of its ability to confirm interdependence among the considered factors and its capacity to derive a direct graph illustrating the interrelationships among factors [18]. The origins of the DEMATEL method are rooted in graph theory, providing a valuable approach for addressing complex problems through visualization. DEMATEL proves effective in constructing and analyzing the structure and relationships among the components within a system or a set of available alternatives. Matrices or diagrams within DEMATEL illustrate causal relationships among system factors or elements, categorizing them into two clusters: causal factors and effect factors. This investigation proves highly beneficial for visualizing intricate contextual relationships among elements, including their interdependencies and the extent of their influence on other factors within the system. Understanding these structural relationships enables researchers to navigate complex system issues by grasping the intricate causal connections and the severity of their impacts on others. Factors that exert greater influence on others are considered higher-priority “dispatchers”, while those more influenced by others are lower-priority “receivers”.
Specifically, the methodology employed in this study is Fuzzy DEMATEL. Fuzzy has been preferred because in DEMATEL, a variable pairwise impact is taken as input, commonly obtained through expert suggestions. However, in real-world scenarios, the majority of decisions are uncertain due to the lack of precise knowledge regarding objectives, constraints, and potential actions [18]. In this uncertain context, decision-making processes are significantly influenced by the imprecision and vagueness inherent in subjective judgments. Instead, fuzzy set theory provides an effective solution to address such vagueness issues, offering a mathematical framework for representing and managing vagueness in decision-making [28]. Therefore, to address the inherent uncertainty in human thinking and decision-making, this study employs fuzzy logic to extend decision-makers’ preferences to fuzzy numbers using a fuzzy linguistic scale [29].

3.1. Expert Selection

The authors conducted interviews with experts in Lean Management who had more than 8 years of work experience in the automotive industry. The data was collected over a period of six months. A “purposive sampling” approach was used. Purposive sampling allows researchers to align with their research objectives while managing the degree of variation among the interviewed individuals [30]. Furthermore, the willingness of the experts to be involved in the research, a driver used in the choice of the interviewees, increases the richness of data thanks to their commitment [31]. Some have studies stated that for multi-criteria decision-making models such as DEMATEL, the optimal number of interviewees ranges from 5 to 15 [30]. To ensure the reliability and relevance of the data collected, the selection of experts for this study was based on the following key criteria:
  • Industry Experience: All experts had a minimum of 8 years of professional experience in the automotive industry, ensuring deep knowledge of sector-specific processes, challenges, and dynamics.
  • Lean Management Specialization: Each expert was a recognized specialist in Lean Management within the automotive sector, providing informed insights into the implementation of lean practices and their environmental implications.
  • Supply Chain Diversification: Experts were selected from different points along the automotive supply chain, including both component manufacturers and final product assemblers. This diversification enabled a comprehensive perspective across various operational contexts.
  • Nationality and Contextual Consistency: Only Italian experts were included to maintain cultural and regulatory consistency. This helped ensure homogeneity in the responses and a focused analysis of Lean Management practices in the Italian automotive industry.
The final number of experts involved in this study was 7. The final sample of experts involved in the study is presented in Table 2.

3.2. DEMATEL Computation

A 16 × 16 matrix was created to collect the responses involved in the research. The matrix has in both rows and columns the 16 lean practices to be analyzed. Each expert was asked to fill in all the cells of this matrix to represent the degree of impact of Ei practice compared to that of Ej practice on improving the environmental performance, which formed the Ak impact matrix. The pairwise comparison scale designated five levels, with scores of 0, 1, 2, 3, and 4 representing “much less impactful,” “less impactful,” “equally impactful,” “more impactful,” and “much more impactful,” respectively [32]. The seven experts involved were asked to assign scores based on their opinions. Three matrices, like the 16 × 16 matrix, were submitted to the experts. These three matrices represented the three types of environmental performance under analysis. The questions submitted, one for each matrix, were as follows:
  • How much more impactful is practice X than practice Y in reducing energy consumption?
  • How much more impactful is practice X than practice Y in reducing CO2 emissions?
  • How much more impactful is practice X than practice Y in reducing waste generation?
Experts returned the matrices filled in according to their experience and knowledge of the subject, with a number from 0 to 4 in each cell. The numerical and linguistic scales shown in Table 3 have been employed in this instance.
Suppose that the alternatives are evaluated according to the i-th criterion with the fuzzy numbers fij = 1,…J (where J is the number of alternatives). For the triangular fuzzy numbers fij = (lij, mij, rij), j = 1,…, J, the crisp value of the j’-th criterion could be determined using the following four steps of the Converting Fuzzy numbers into Crisp Scores (CFCS) algorithm.
  • Normalization:
rmaxi = maxi ri,j,
lmini = minj li,j,
Δmaxmin = rmaxilmini
Compute for all alternatives aj, j = 1,…, J:
xlj = (li,jlmini)/maxmin
xmj = (mi,jlmini)/Δmaxmin
xrj = (ri,jlmini)/Δmaxmin
Compute left (ls) and right (rs) normalized values, for j = 1,…, J:
xlsj = xmj/(1 + xmjxlj)
xrsj = xrj/(1 + xrjxmj)
Compute the total normalized crisp value, for j = 1,…, J:
xcrispj = (xlsj (1 − xlsj) + xrsj xrsj)/(1 + xlsj + xrsj)
Compute crisp values for j = l,…, J:
fij = lmini + xcrispjΔmaxmin
Below is reported the DEMATEL process applied to the matrices regarding the reduction in energy consumption [33].
  • Step 1: Generation of average matrix
The n × n average matrix Z is found by averaging all of the experts’ previous responses defuzzificated.
  • Step 2: Normalized initial direct-relation matrix (X)
Based on the average matrix Z, the normalized initial direct-relation matrix X can be obtained through Equations (11) and (12).
S = min (∑nj=1 zrj,ni=1 zij)
X = Z/S
  • Step 3: The total relation matrix (T)
The total relation matrix T is an n × n matrix as follows:
T = ∑q=1 Xi = X1 + X2 + … + Xq = X(1 − X)/(1 − X) = X(1 − X)−1
which represents an n × n identity matrix. A continuous decrease in the direct effects of problems along the powers of matrix X guarantees solutions that are convergent to matrix inversion.
  • Step 4: Prominence and Relevance
Determine row (Ri) and column (Dj) sums for each row I and column J from the total relation matrix (T). That is,
Dj = ∑nj=1 trj ∀j
Rj = ∑nj=1 tij ∀j
The row values Ri are the overall direct and indirect effects of the practice i on other practices. Similarly, the column values Dj represent the overall direct and indirect effects of all barriers on barrier j. Determine the overall prominence (Pi) of barrier i and the net effect (Ei) of barrier i using Equations (16) and (17).
Pi = Ri + Dj|i = j
Ei = Ri + Dj|i = j
The larger the value of Pi, the greater the overall prominence (visibility/importance/influence) of barrier i in terms of its overall relationships with other practices. If Ei > 0, then practice i is a net cause, or foundation, of other practices. If Ei < 0, then practice i is a net effect of other practices.
  • Step 5: Set a threshold and draw the cause–effect diagram.
To clarify the structural connections among the criteria while maintaining a manageable level of system complexity, it becomes essential to establish a threshold value for filtering out insignificant effects within the matrix T. In this study, the threshold value refers to the minimum strength of influence required for a relationship between two practices to be considered significant in the causal diagram. If the threshold is set too low, the map becomes excessively dense, making it difficult to distinguish relevant cause–effect relationships. If set too high, important connections may be omitted, resulting in an incomplete representation. To reduce subjectivity, the threshold was not arbitrarily chosen but computed as the mean value of the elements in the total relation matrix (T) plus 1.5 and 2 standard deviations (μ + 1.5σ; μ + 2σ). This statistical criterion ensures an objective basis for distinguishing significant from strong relationships [29]. Finally, the impact relation map is drawn by plotting the coordinate values of each factor onto a scatter plot with a horizontal axis (D + R) and a vertical axis (D − R), with the origins of the axes as the average value for prominence and zero. Therefore, reading the map along the x-axis, it is possible to recognize a factor of higher importance on the right side of the graph, while more marginal factors are displayed on the left.

4. Results

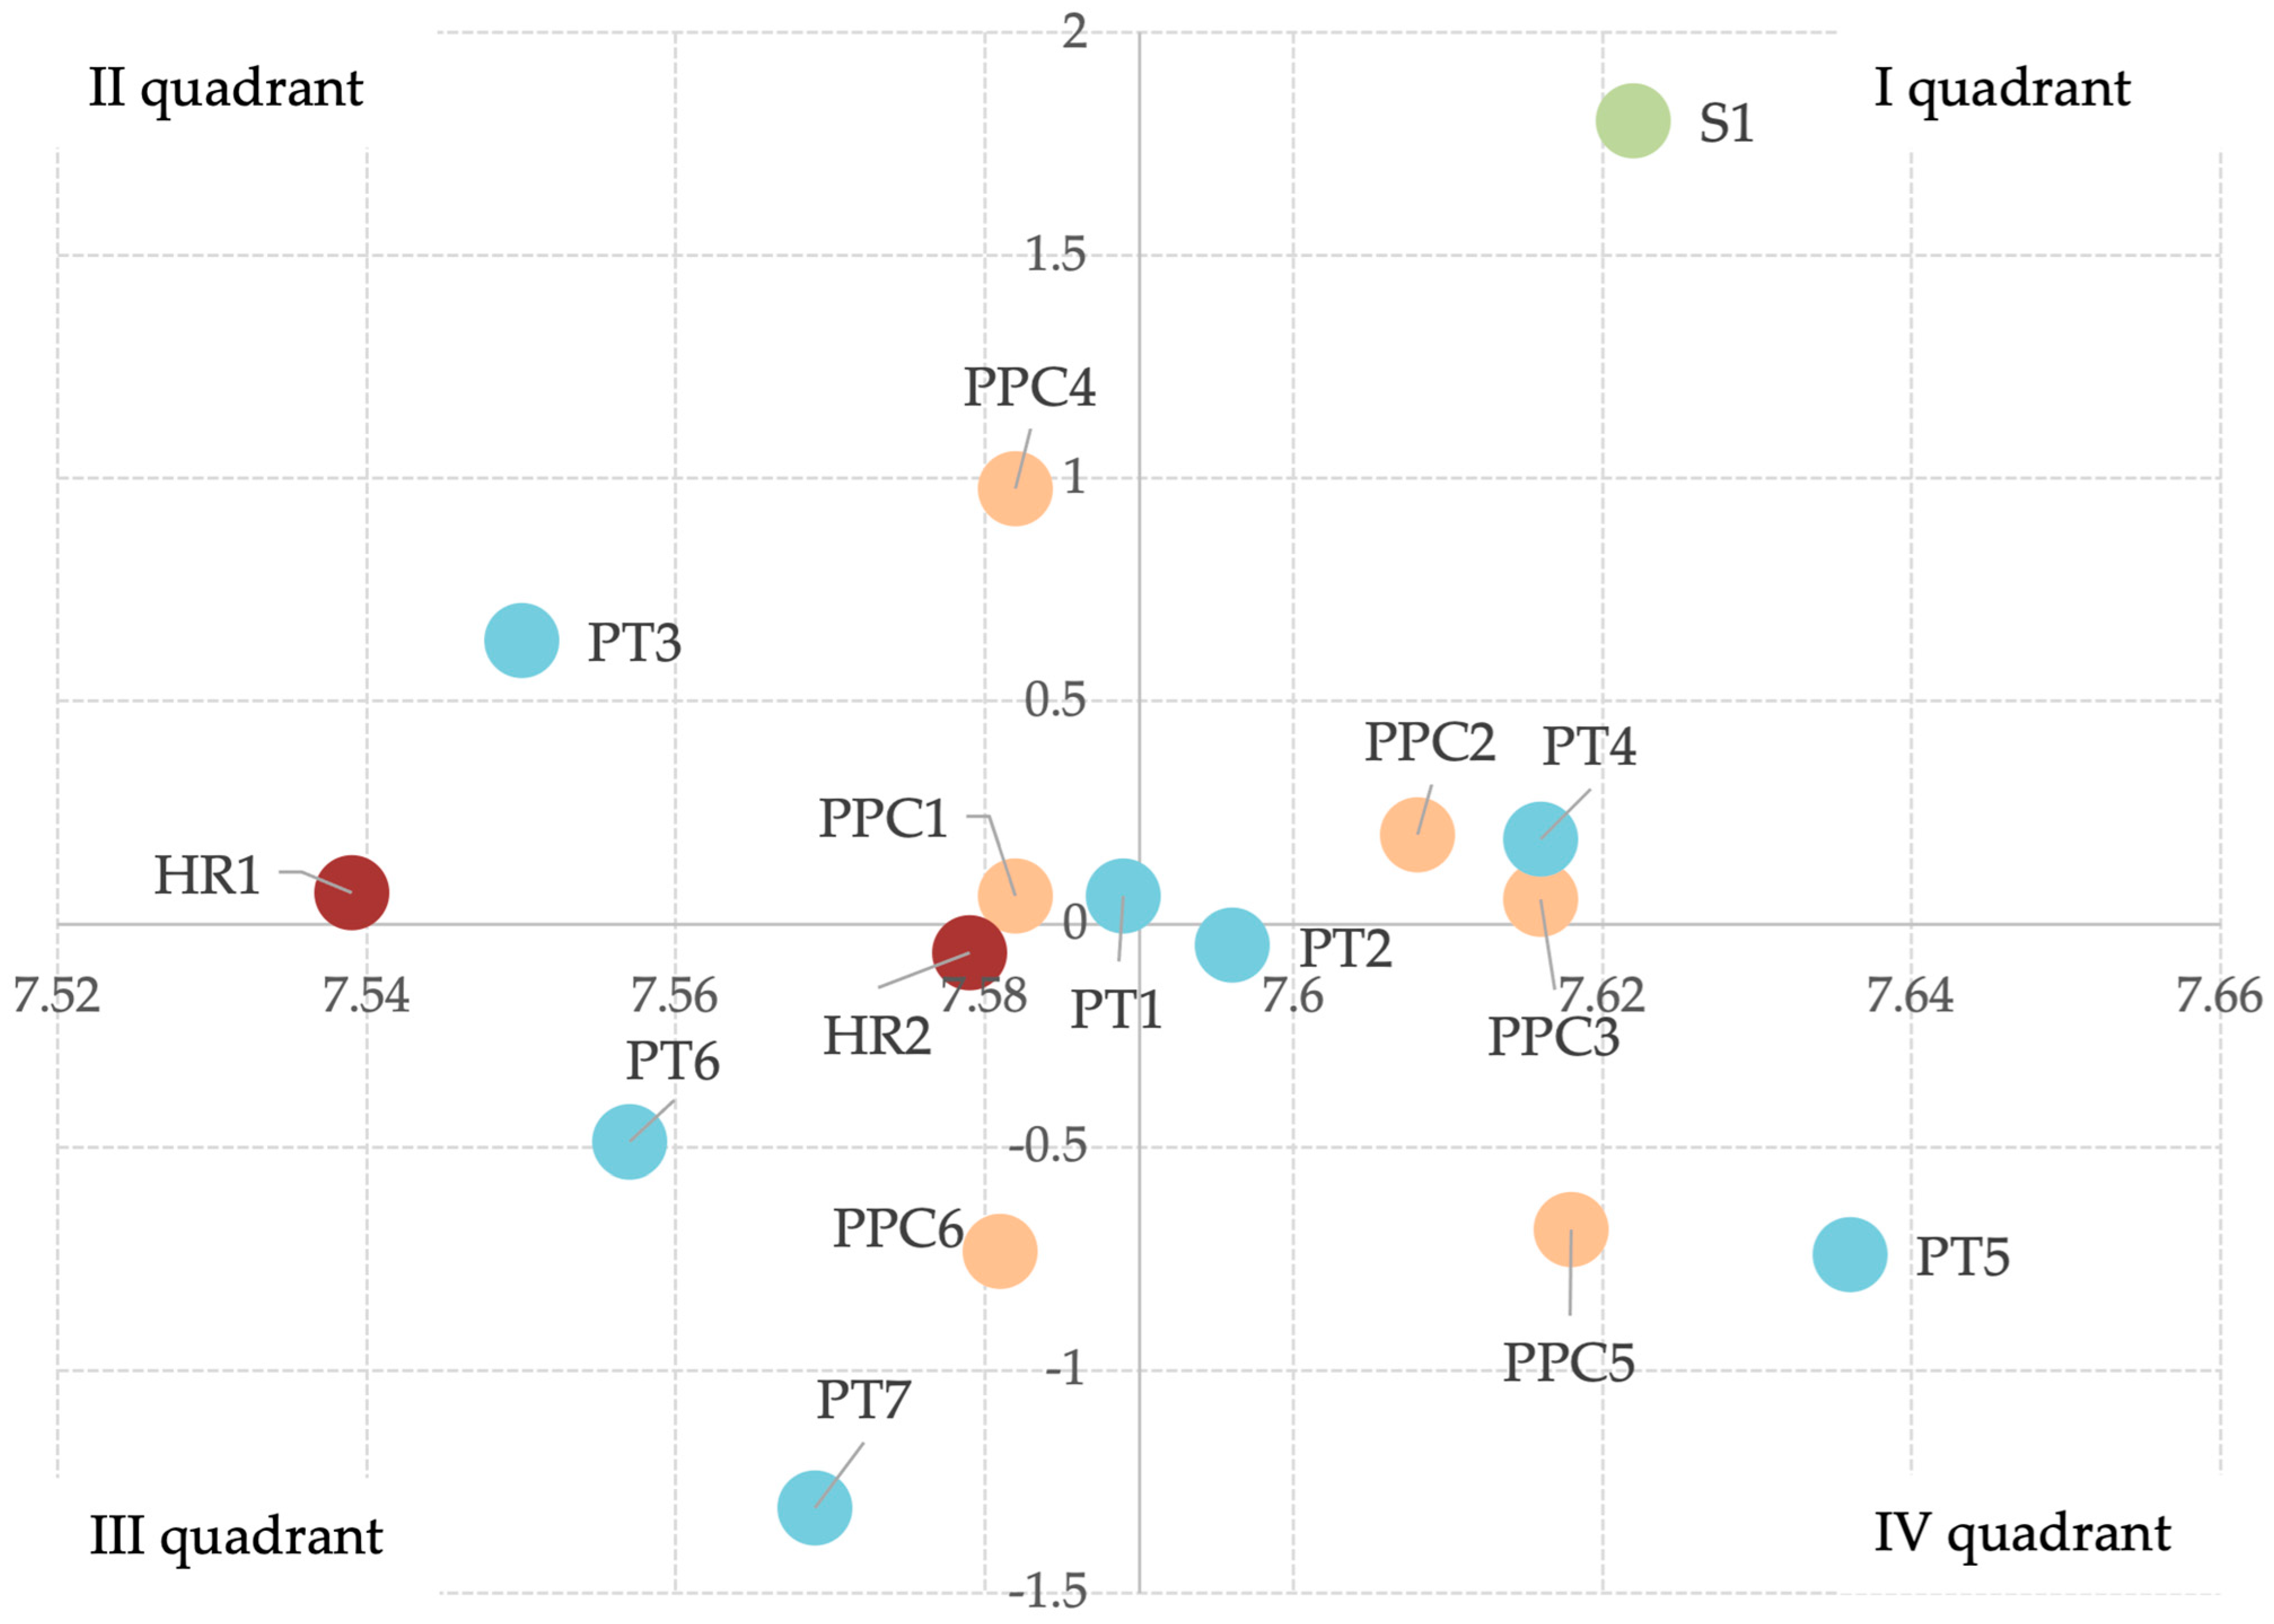
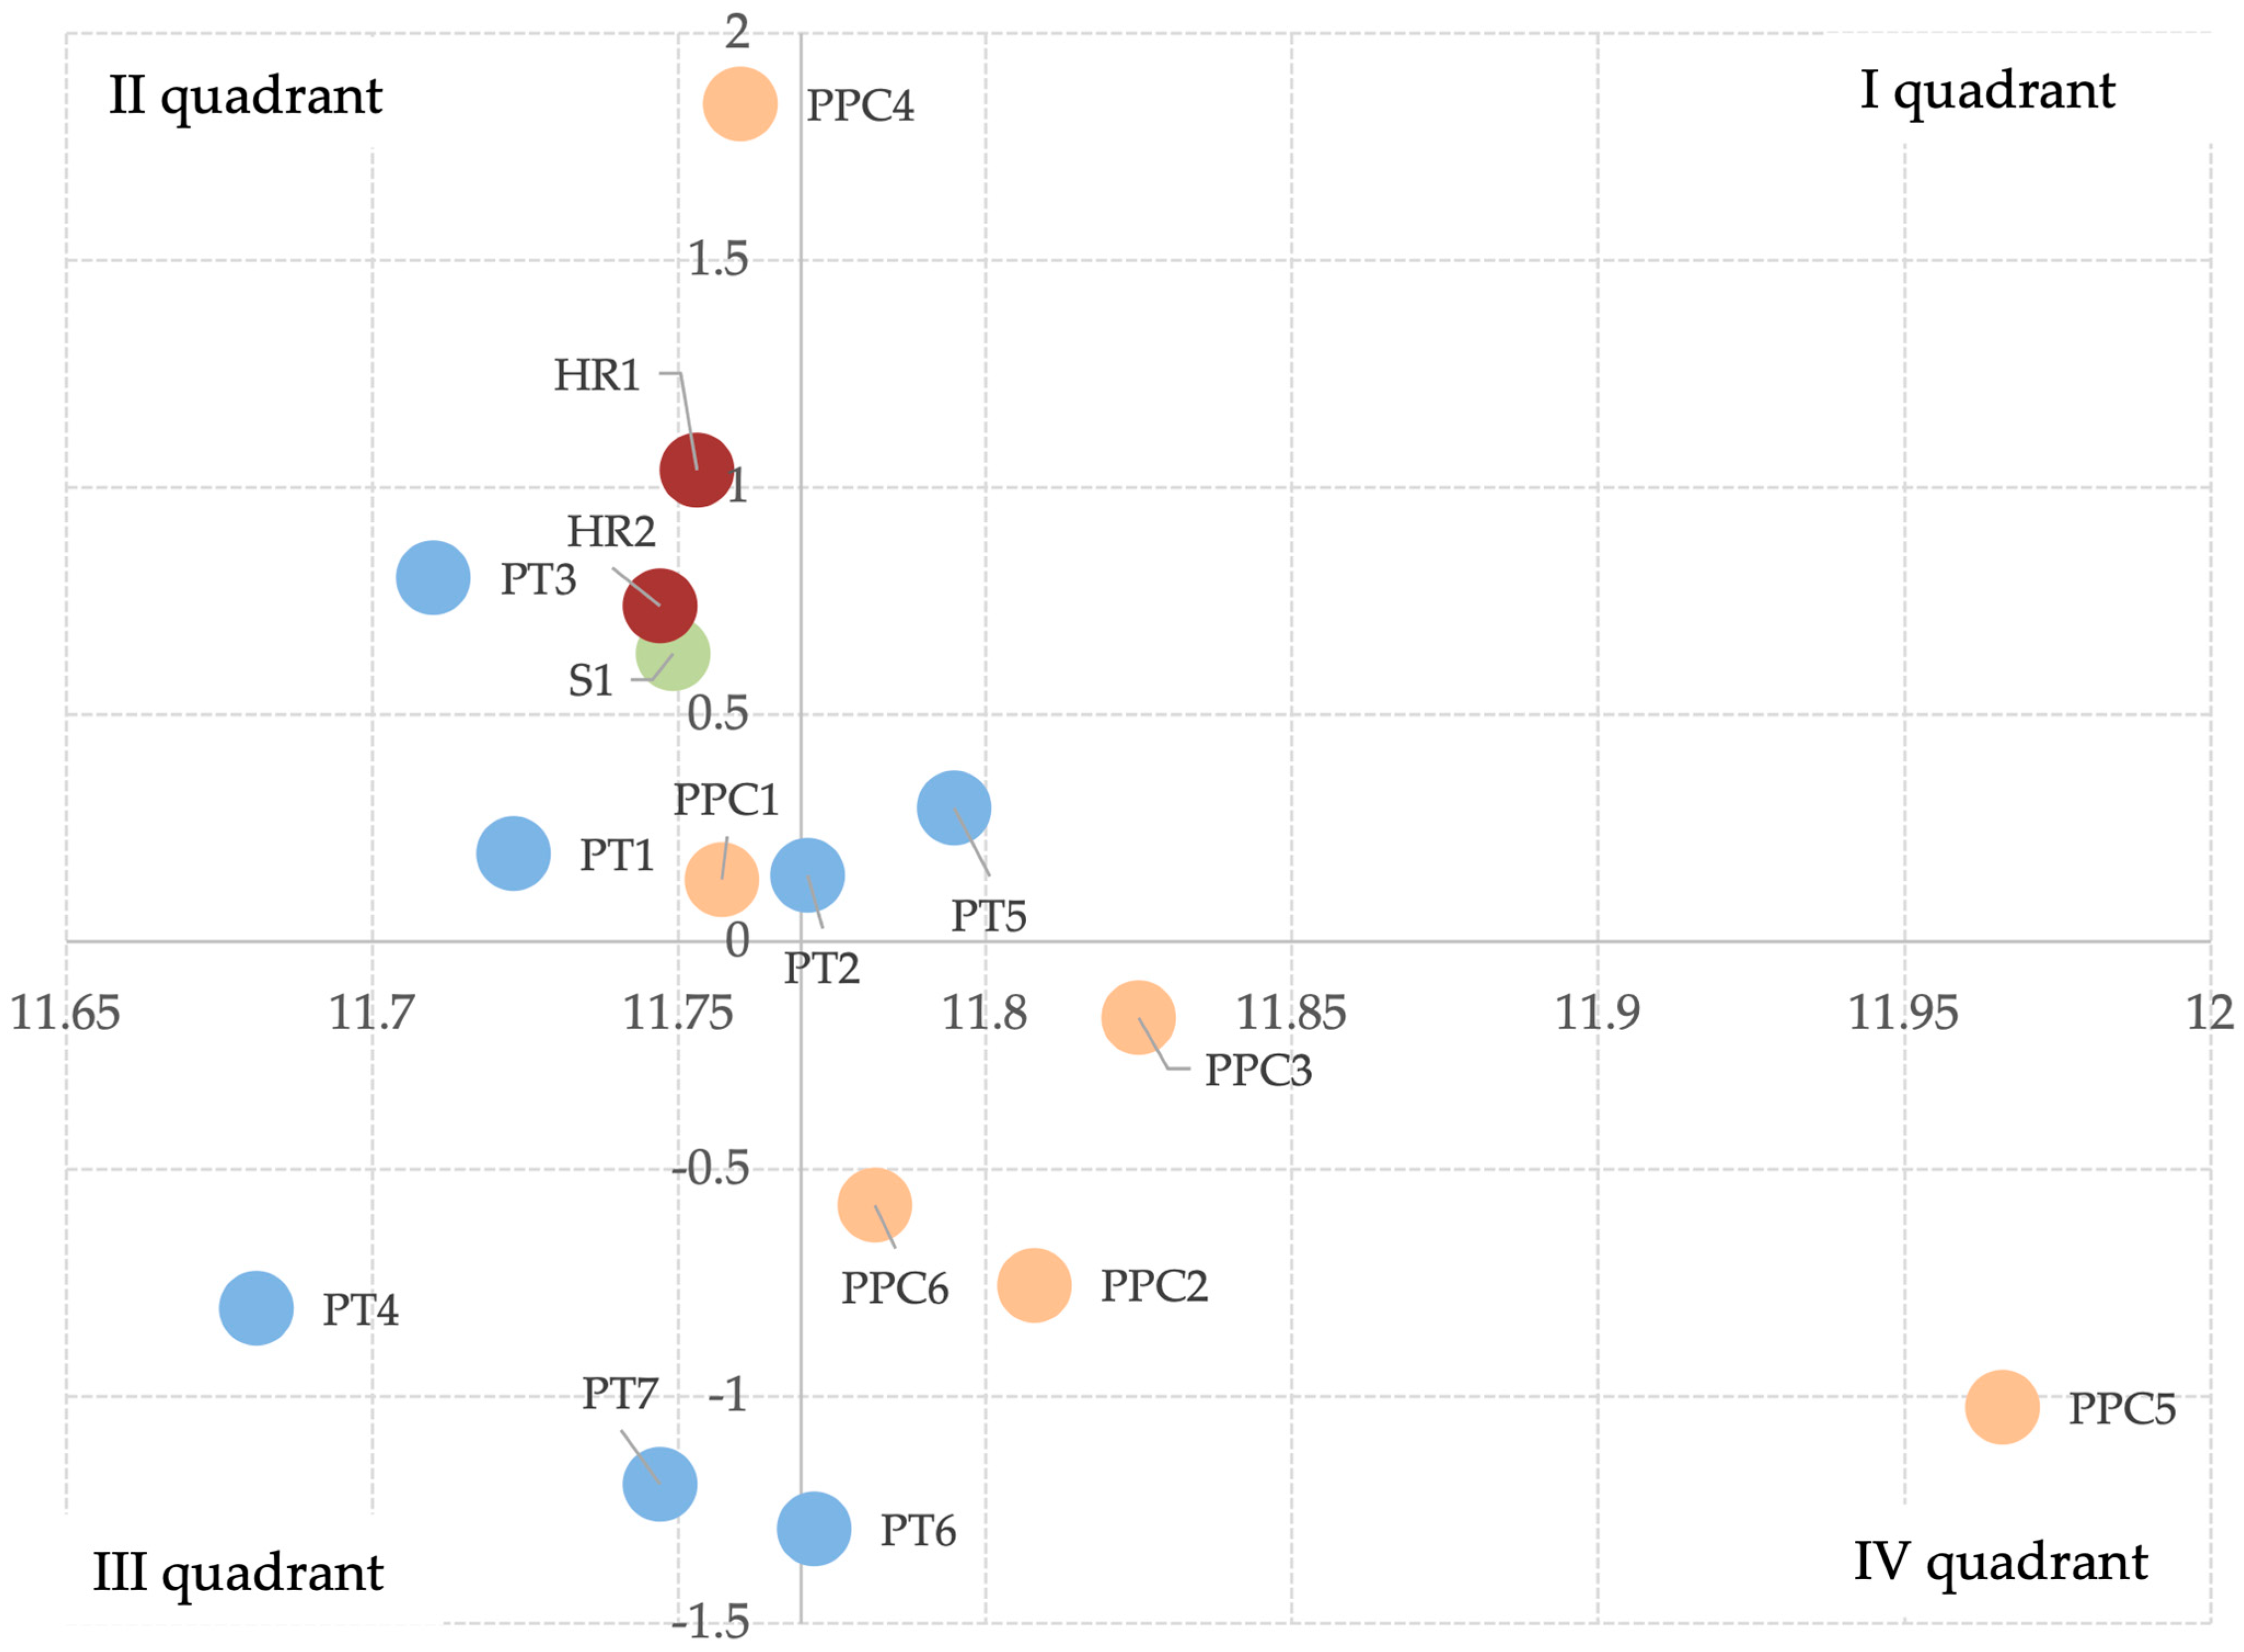
The impact relation map is generated by plotting the coordinate values of each practice on a scatter plot, where the horizontal axis represents prominence (D + R) and the vertical axis represents relation (D − R). Consequently, when examining the map along the x-axis, it becomes feasible to identify the practices of greater significance located towards the right side of the graph, while the less significant ones are depicted on the left. On the other hand, the y-axis displays the most influencing practices at the top of the map, while at the bottom, it is possible to identify those that are more likely to be influenced in the model. Each quadrant in the causal diagram represents the meaning and characteristics of practices. Core practices (I quadrant) have high prominence, so their occurrence brings about a wide range of influences and interactions, such as triggering or exacerbating other practices and inducing feedback. Driving practices (II quadrant) have low prominence, so they influence the others but produce few interactions. Their occurrence produces effects on only a few factors, so their improvement may have a limited impact on the overall achievement of the target environmental performance. Independent practices (III quadrant) are characterized by minor influences and interactions with other practices, being independent and isolated. Lastly, impact practices (IV quadrant) have high prominence; they are among the most important practices and require the most attention. Their levels of impact on the achievement of environmental performance are associated with their dependence on other factors and the ability to manage their causal factors. Decision-makers can visually identify the complex causal relationships between practices and highlight additional valuable insights.
Following the theoretical overview, this section delves into the practical results of the research. Here, the main results are presented within the context of the three distinct types of environmental performance, shedding light on the role and implications of individual Lean Management practices in this regard.

4.1. Results Related to Energy Reduction

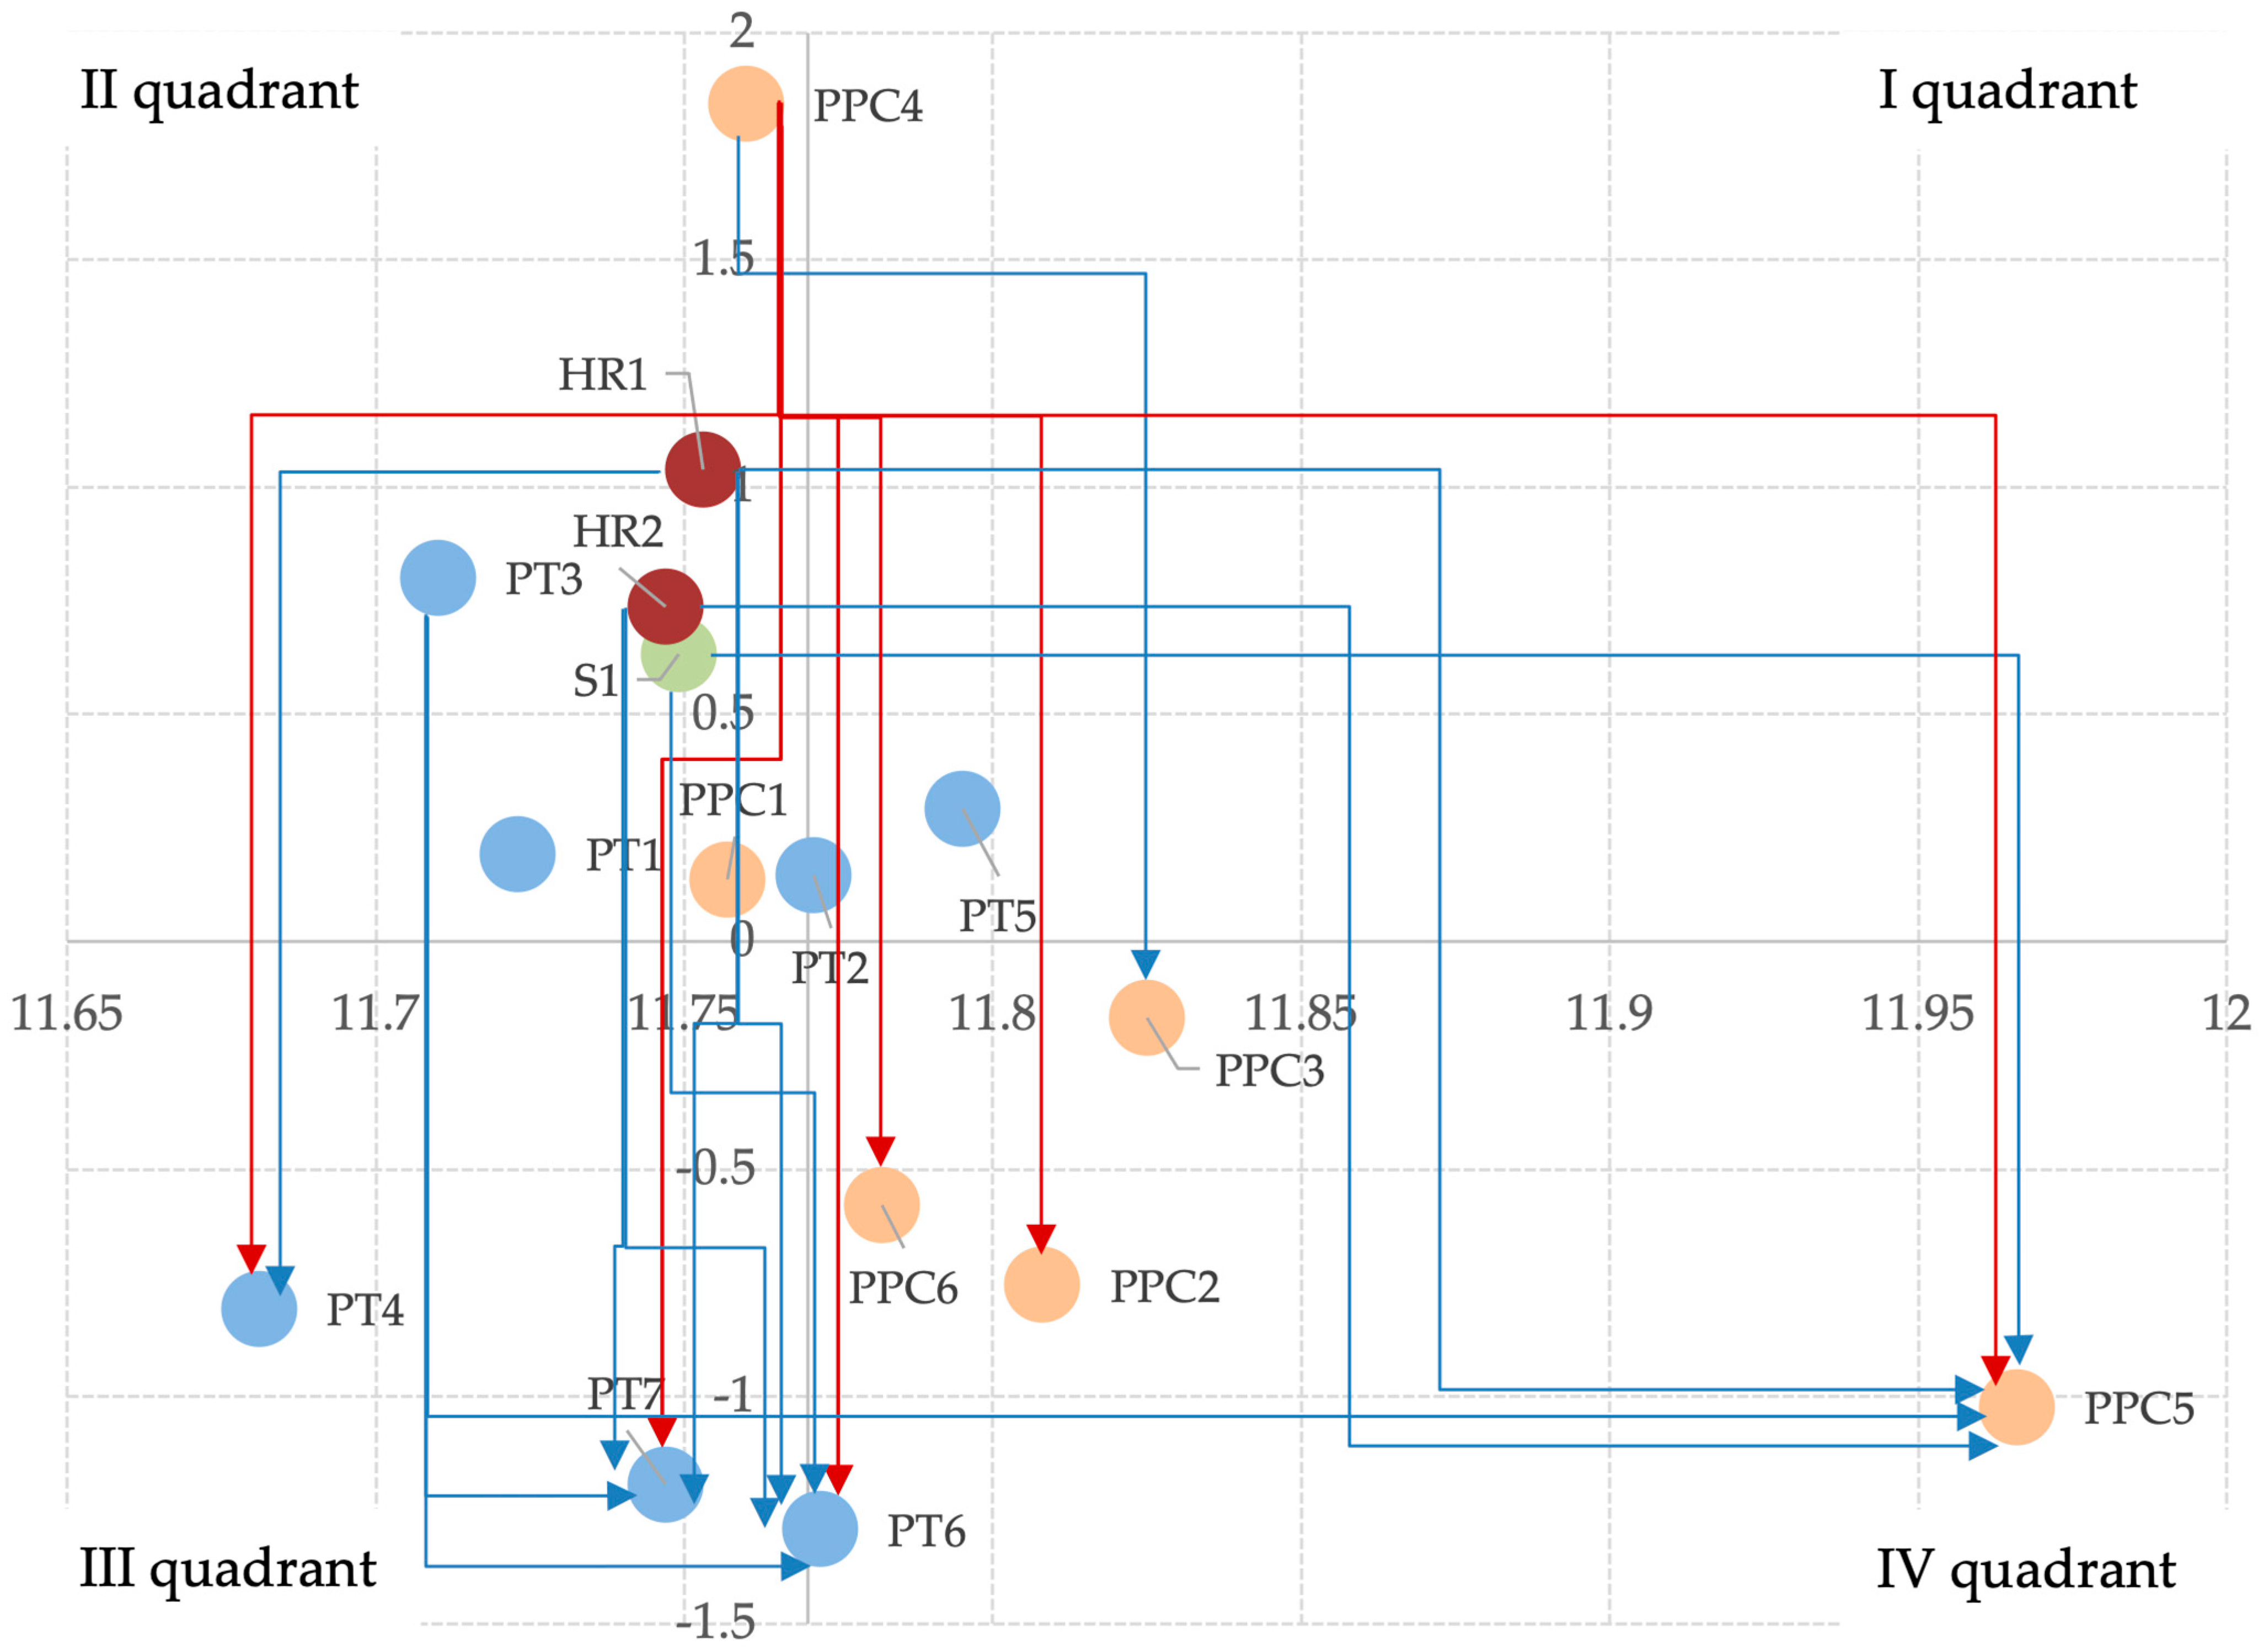
Figure 2 was created by plotting the coordinates of (D + R) and (D − R) reported in Table 4. The average value for prominence is 11.990, where the x-axis intersects with the y-axis. A total of 11 out of 16 practices are on the right-hand side of the graph, i.e., they have a higher-than-average prominence value. In contrast, on the y-axis, eight practices have a value greater than zero, thus characterizing themselves as causal practices, and an equal number as influenced practices, having a negative D − R value. The higher the D − R value, the stronger the influence exerted by the practice, and the lower it is, the more the practice is influenced by others. What emerges is that TPM is the practice with the highest D − R value (1.638) and 5S the one with the lowest (−1.934). In the first quadrant, seven key practices are displayed which play a key role in achieving environmental sustainability. Pull production (PPC2) is the most important practice in the quadrant; hence, it is the rightmost one. In order of influence, in this quadrant, there are also Jidoka (PT1), JIT (S1), Standardize work (HR2), SMED (PPC1), and Layout size and shape (PT4), which is very close to the origin of the axis. One-piece-flow (PT3) and Kaizen (HR1) are driving practices, both with a similar level of influence, but different prominence. Kaizen is the practice with the lowest prominence score (11.731). The third quadrant houses three practices that, although relevant, can be considered relatively independent of the other practices: Cellular Manufacturing (PT2) is the most relevant and influential among these, alongside VSMs (PT6) and 5S (PT5), with the latter having the lowest D-R. The fourth quadrant includes Heijunka (PPC3), the most prominent practice (12.150), with a level of relation close to zero; SPC (PPC5); Root cause analysis (PPC6); and TQM (PT7), all of which have a value of prominence higher than the average and a relation value lower than zero, which means that these practices are effects of the most influential practices.

4.2. Results Related to CO2 Emission Reduction

Figure 3 was created by plotting the coordinates of D + R and D − R reported in Table 5. The average value for prominence is 7.590, where the x-axis intersects with the y-axis. A total of 7 out of 16 practices are located on the right-hand side of the graph, indicating that they have a higher-than-average prominence value. Thus, less than half of the practices analyzed were significant in achieving the desired environmental performance. In contrast, on the y-axis, nine practices have a value greater than zero, thus characterizing themselves as causal practices, and nine are influenced practices, having a negative D − R value. What emerges is that JIT is the practice with the highest D − R value (1.803), and TQM is the one with the lowest (−1.309). In the first quadrant, four key practices are displayed which play a crucial role in achieving environmental sustainability. JIT (S1) is significantly distant from the other practices and is the most influential and the second most prominent. The other practices in this quadrant are distributed close to the x-axis, including Layout size and shape (PT4) and Heijunka (PPC3), which have similar prominence scores, as well as pull production (PPC2). Jidoka (PT1) lies almost at the origin of the axis, with a small deviation, resulting in it belonging to the second quadrant. The other driving practices are TPM (PPC4), SMED (PPC1), one-piece-flow (PT3), and Kaizen (HR1), of which the latter two are the two least prominent practices (7.550, 7.539). The third quadrant comprises four practices: Standardize work (HR2), which is very close to the prominence axis; Root cause analysis (PPC6); TQM (PT7); and VSMs (PT6), the least prominent practice in the quadrant. The fourth quadrant includes 5S (PT5), the most prominent practice (7.636) for achieving reductions in CO2 emissions. It is noteworthy that 8 practices out of 16 have D − R values close to zero, resulting in the dots being distributed along the x-axis.

4.3. Results Related to Waste Reduction

Figure 4 was created by plotting the coordinates of D+R and D-R reported in Table 6. The average value for prominence is 11.772, where the x-axis intersects with the y-axis. Seven out of the sixteen practices, those positioned on the right-hand side of the graph, exhibit a prominence value that exceeds the average. Thus, less than half of the practices analyzed were significant in achieving the desired environmental performance. In contrast, on the y-axis, nine practices have a value greater than zero, thus characterizing themselves as causal practices, and seven are influenced practices, having a negative D − R value. What emerges is that TPM is the practice with the highest D − R value (1.843), and VSMs are the practice with the lowest (−1.292). In the first quadrant, there are two core practices: 5S (PT5) and Cellular Manufacturing (PT2). Although they are not distant from the others, they have prominence values near the average. Most of the practices are driving factors, placed in the second quadrant. In here, there is TPM (PPC4), which is the most influential practice, followed by Kaizen (HR1); One-piece-flow (PT3), which is less prominent among these practices but still influential; Standardize work (HR2); JIT (S1); Jidoka (PT1); and SMED (PPC1). Practices in the third quadrant are positioned very low, with similar D-R scores but significantly different levels of prominence; meanwhile, TQM (PT7) is very close to the y-axis and thus has a D + R score just below average, Layout size and shape (PT4) is far behind, making it the least prominent practice (11.681). The fourth quadrant includes five practices, which are close to the y-axis, with the exception of SPC (PPC5), which clearly stands out as the most important practice (11.966). Continuing to follow the order of importance, one finds Heijunka (PPC3), pull production (PPC2), Root cause analysis (PPC6), and VSMs (PT6), with a prominence very close to the average and the lowest result. Remarkably, this graph is concentrated around the y-axis.

5. Discussion

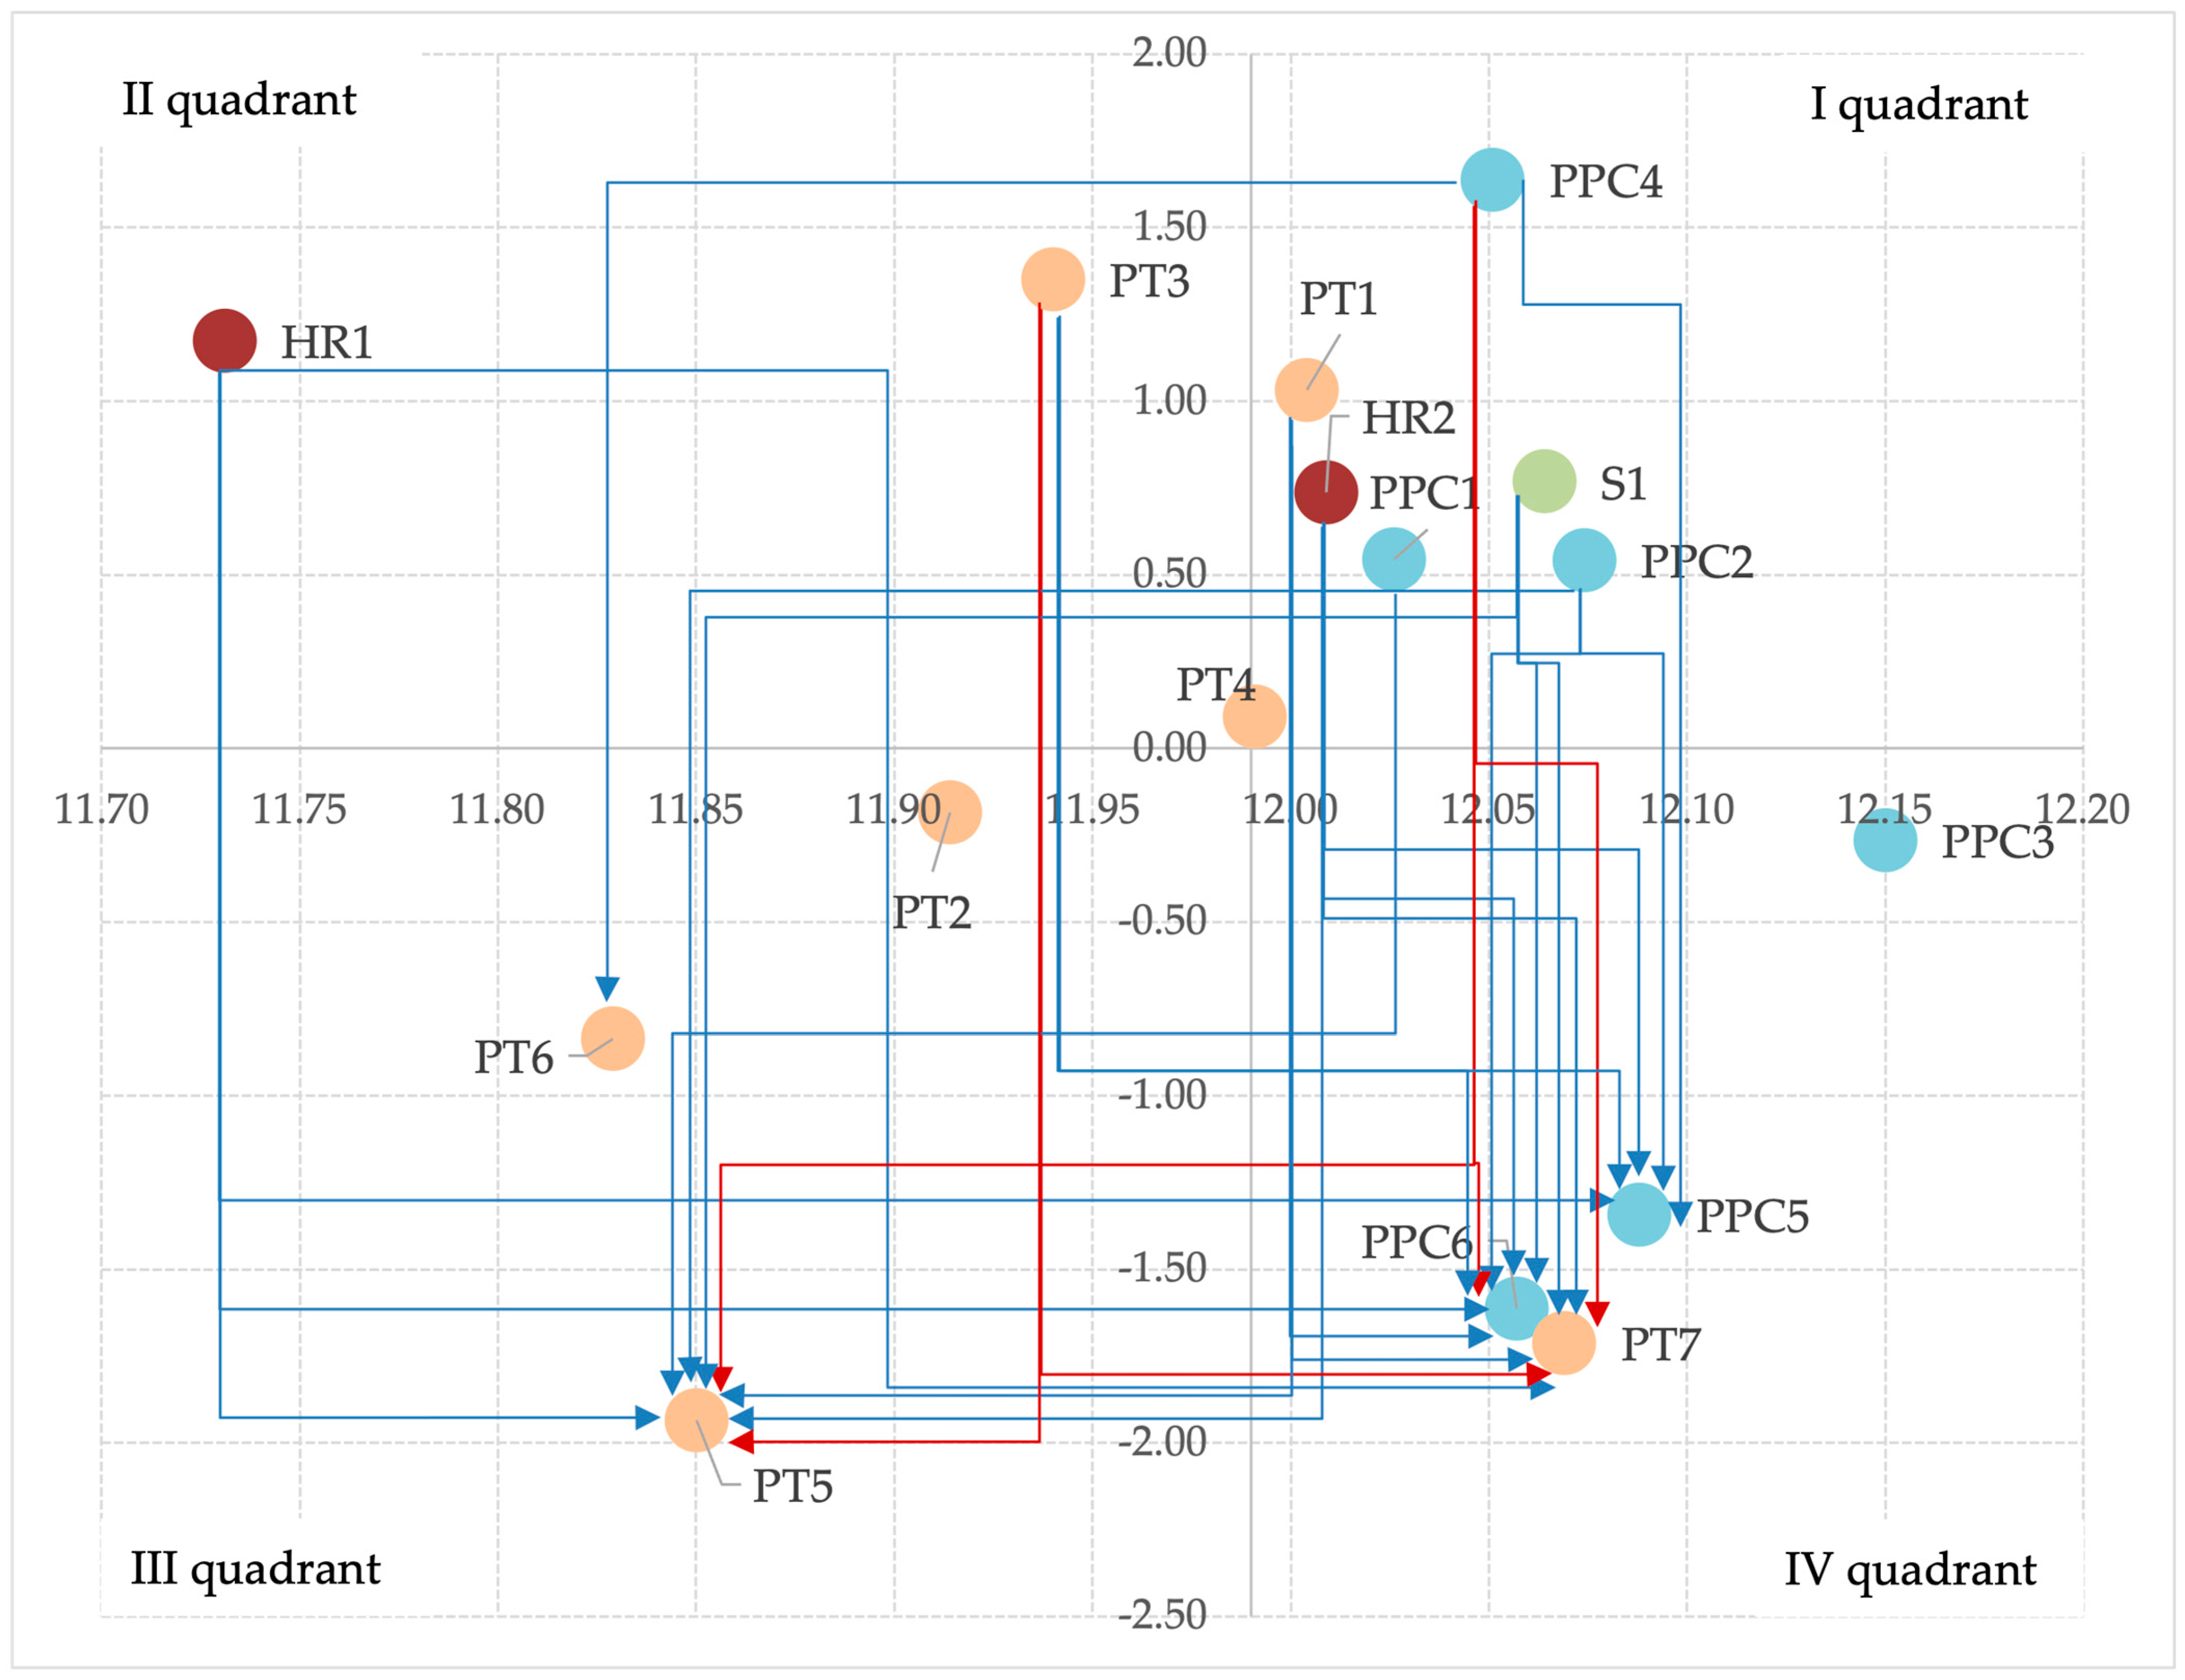
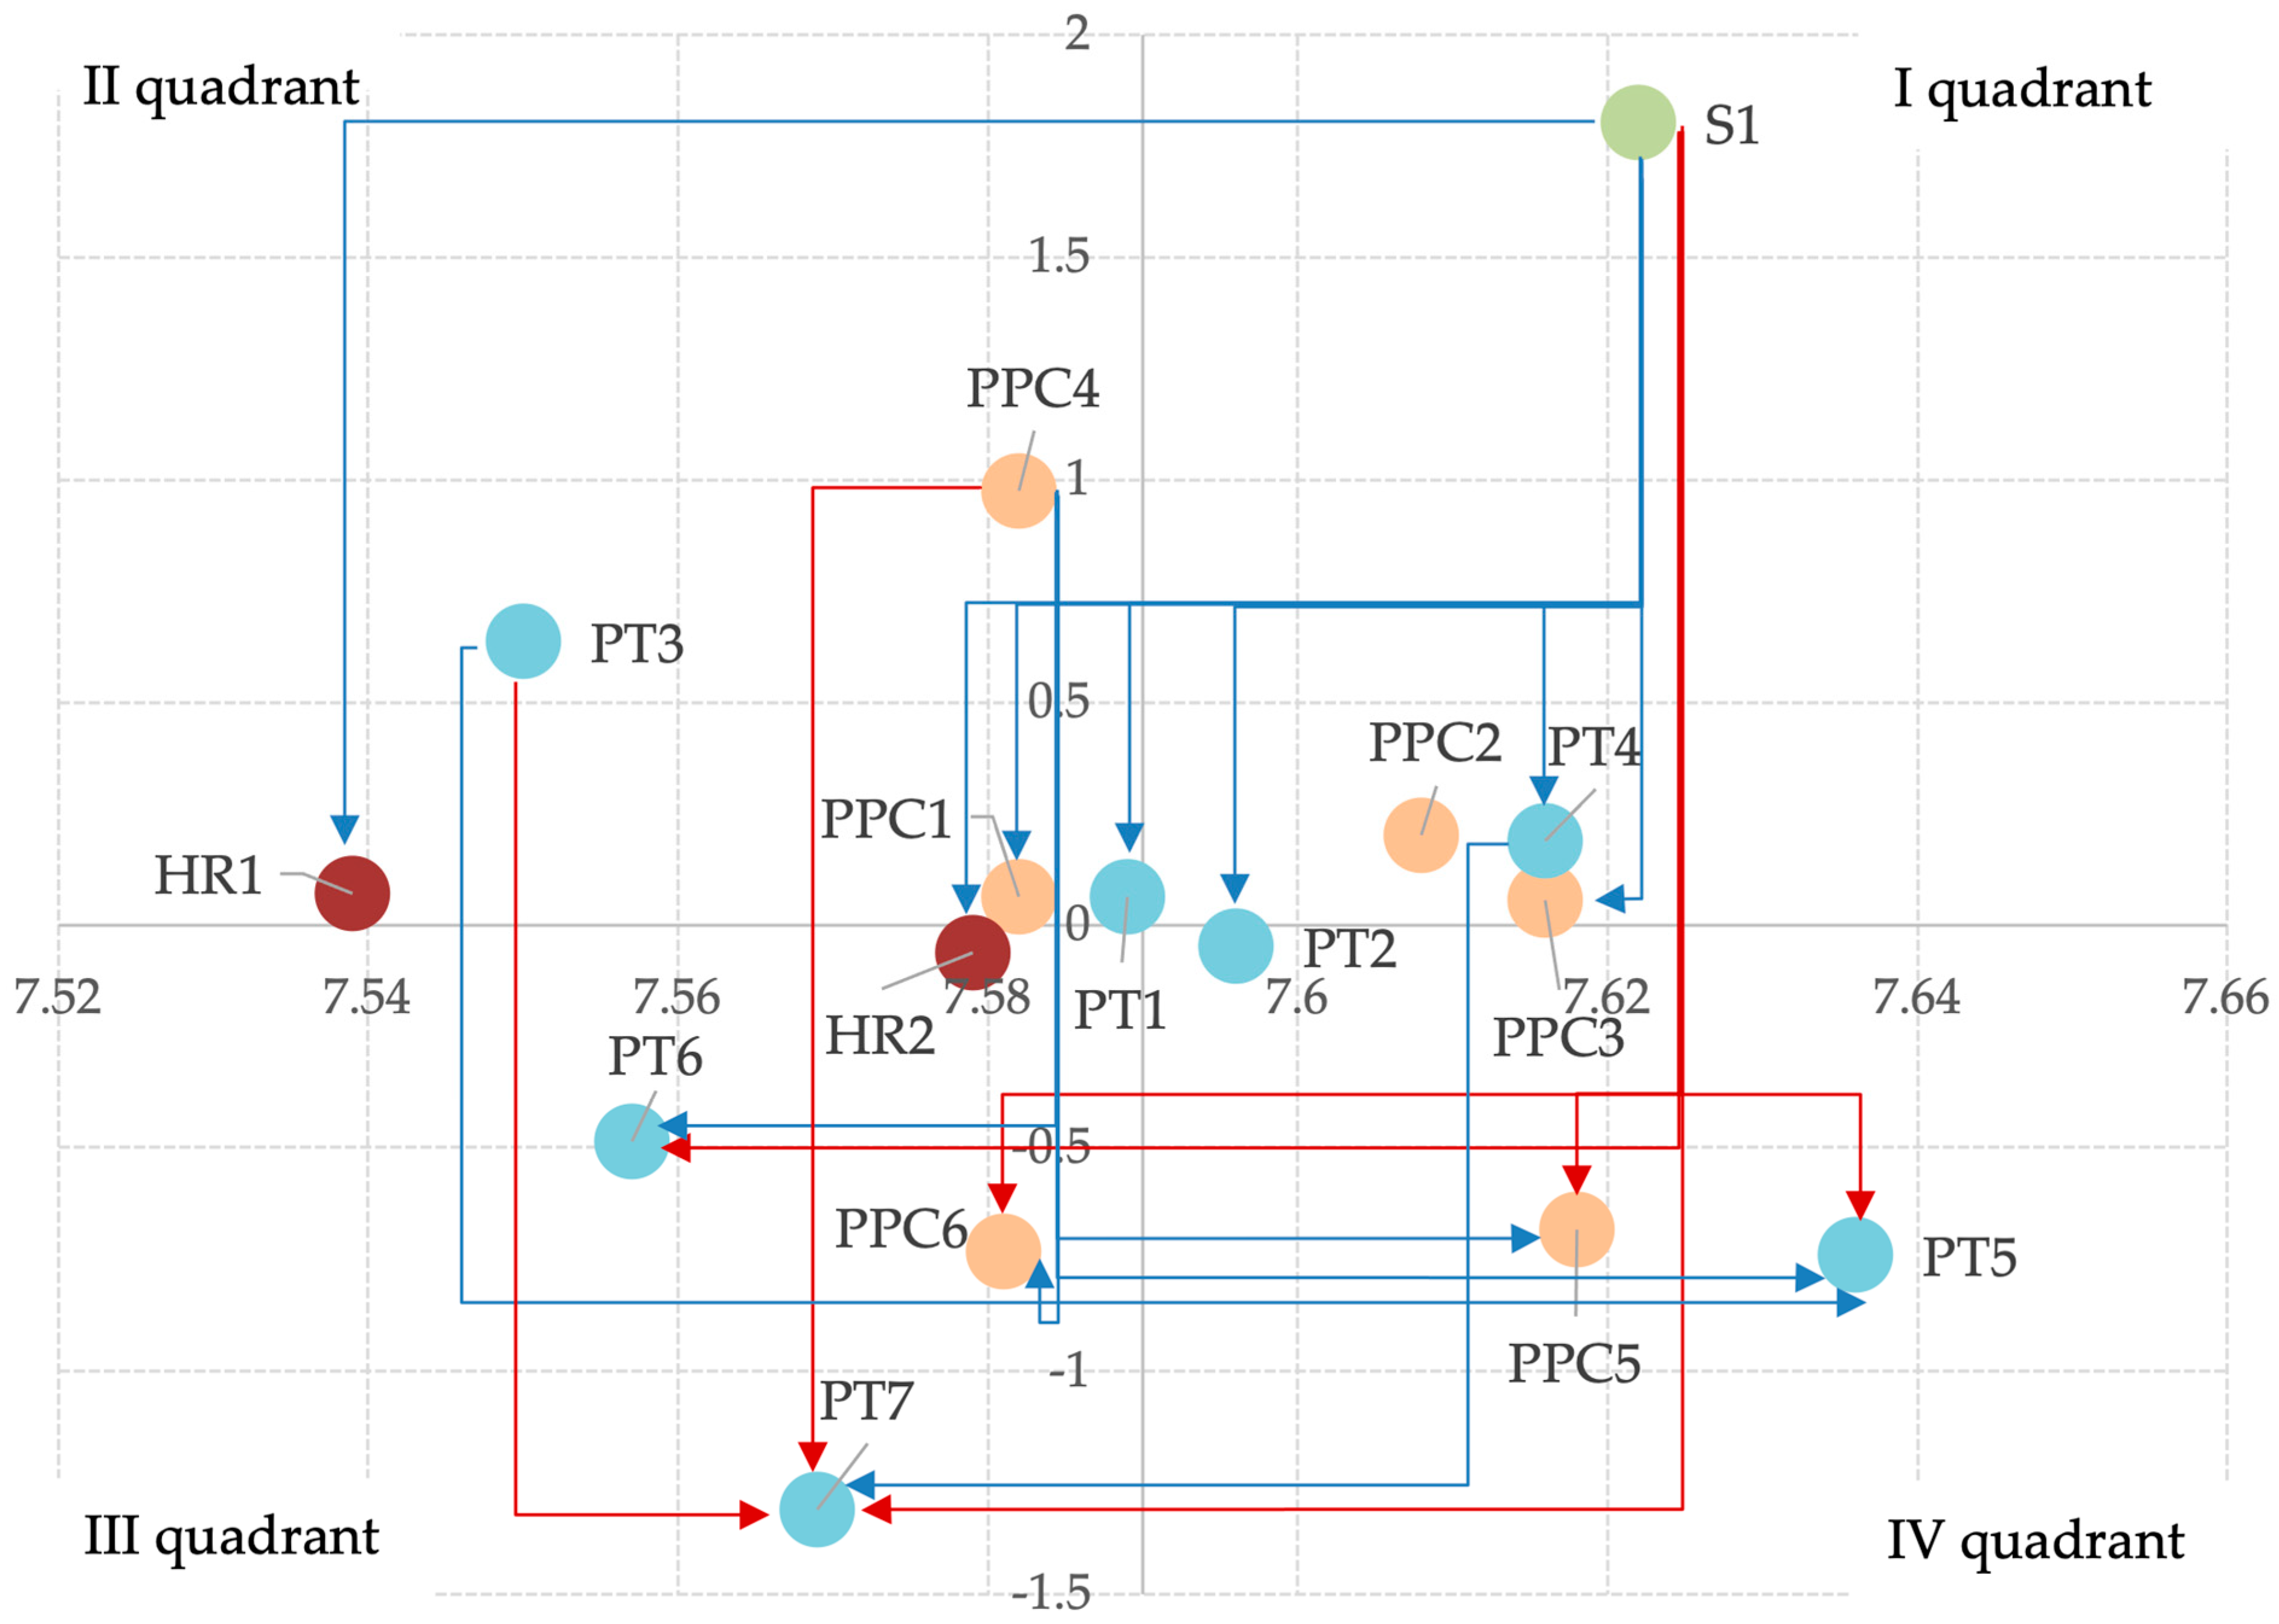
The results generated through the Fuzzy DEMATEL methodology offer a valuable foundation for understanding the dynamic interrelationships among lean practices and their respective influence on environmental performance outcomes. Central to this analysis is the construction of the impact relation maps, which visually represent the directional connections among practices based on the values in the total relation matrix. Only those relationships that surpassed a statistical relevance threshold were considered for graphical representation, ensuring clarity and significance in the analysis. Two thresholds were used to filter these values: a lower threshold (t1 = μ + 1.5σ), which identifies significant relationships and is highlighted in blue, and a higher threshold (t2 = μ + 2σ), representing strong relationships and shown in red. Given the density of possible interactions, only values above the first threshold were used to construct the cause–effect diagrams. These diagrams illustrate the flow of influence among practices, allowing for the identification of practices that act as key drivers and those that are more dependent or outcome-oriented. From the patterns identified in the maps, a structured sequence of implementation steps was derived. Although the DEMATEL methodology does not explicitly prescribe such sequencing, the steps presented in this study emerge as a practical interpretation of the causal structures identified. This sequential logic is intended to provide companies with actionable guidance on how to prioritize lean practices when aiming to enhance environmental performance. The first step includes practices that exhibit both high prominence and strong causal influence. These are typically located in the upper-right quadrant of the impact maps and represent foundational practices from which many causal arrows originate. Together with these, practices that are highly prominent and relatively autonomous are also assigned to the first step, as their independent influence makes them suitable entry points into a lean implementation process. The second step comprises those practices that, while slightly less prominent, still exert a noteworthy influence on others. These are often supportive or enabling practices that reinforce the effectiveness of the practices introduced in the first step. They are essential for stabilizing the lean system and for creating the operational conditions necessary for deeper integration. The third and final step includes the most prominent dependent practices, often identified as intertwined receivers. These practices absorb influence from others and require the prior implementation of causal practices to fully express their contribution to environmental performance. Their effectiveness is contingent upon the successful activation and integration of upstream elements in the lean system. The discussion section is structured into three main analytical sections, corresponding to the environmental dimensions investigated: energy consumption reduction, CO2 emission reduction, and waste generation reduction. Each section begins with an objective reading of the impact relation map, followed by a critical evaluation of the role of each lean practice. The implementation steps are then proposed based on the observed causal logic. A final integrative section compares the role each lean practice plays across all three environmental objectives, highlighting patterns of consistency as well as context-specific variations.

5.1. Energy Reduction Discussion

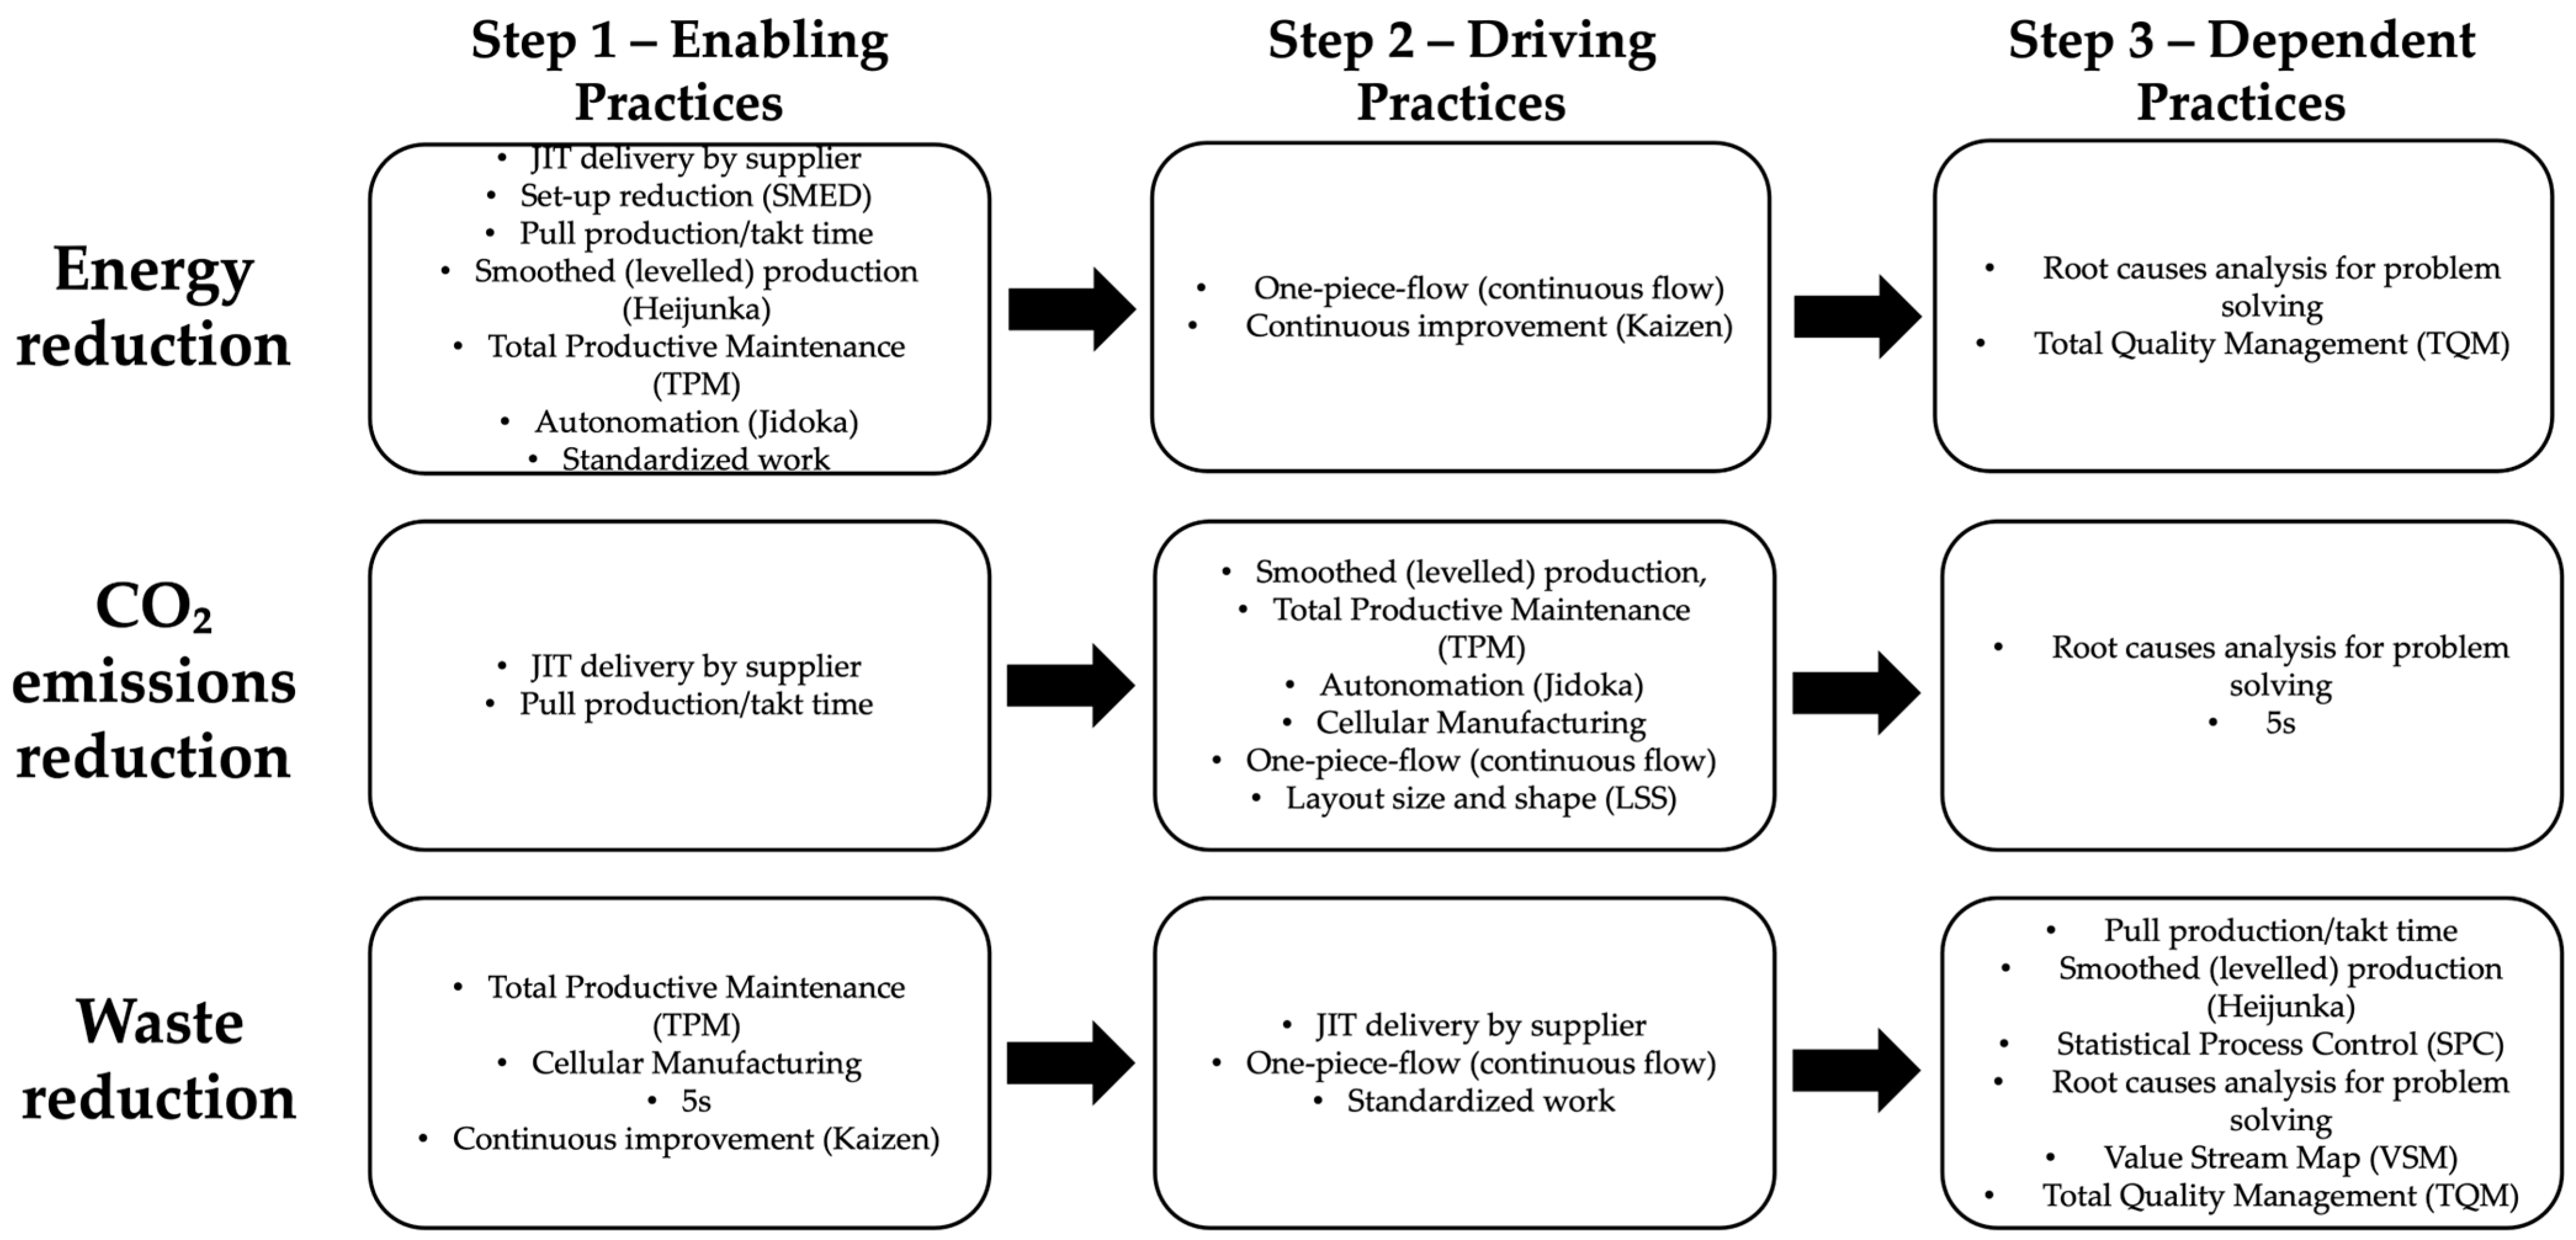
The analysis of the DEMATEL impact relation graph for energy reduction revealed 27 significant relationships among lean practices (Figure 5). Among these, five stood out for their strength, with three of the most impactful connections originating from Total Productive Maintenance (TPM), directed toward 5S, Total Quality Management (TQM), and Root cause analysis (Table 7). Additionally, one-piece-flow showed two strong causal links, reinforcing its strategic role in improving energy efficiency. Heijunka emerged as a uniquely independent practice, neither influencing nor being influenced by others. Its positioning suggests that it can be implemented independently to achieve immediate benefits in stabilizing the production flow and reducing energy-related variability. Other practices, particularly those in the third and fourth quadrants, showed strong dependency on others. For example, 5S and Root cause analysis receive a high number of influence arrows, indicating that their effectiveness relies on the prior adoption of causal practices such as TPM, one-piece-flow, and Kaizen. This dependency structure necessitates a sequential approach to implementation. Standardized work and Kaizen emerged as influential enablers. Standardized work helps create consistent procedures, minimizing variability and inefficiencies. Kaizen, despite its low prominence, is critical due to its enabling effect on other key practices like SPC and TQM. TPM is confirmed as a cornerstone practice in energy reduction, both directly and indirectly. It reduces downtime and supports other practices by improving equipment reliability. This is well-supported by prior research [16,34]. Proper implementation of TPM also involves organizational engagement and training, reinforcing its role as a cultural and technical enabler. Pull production and JIT were also highlighted for their systemic benefits in reducing energy waste, particularly through streamlined processes, just-in-time delivery, and spatial optimization. These practices significantly reduce unnecessary production and storage, contributing to energy efficiency. Based on the prominence and influence scores, the roadmap for energy reduction is structured into three steps. Step 1 includes foundational practices such as TPM, Standardized work, JIT, pull production, SMED, and Jidoka. Heijunka is also included here due to its independence and direct impact. Step 2 consists of enabling practices like one-piece-flow and Kaizen, which support the effectiveness of both foundational and dependent practices. These must be introduced before the next group to ensure full system integration. Step 3 involves dependent but critical practices such as SPC, Root cause analysis, and TQM. These require the stable environment created by Steps 1 and 2 to deliver their full value in monitoring and improving energy performance. Practices excluded from the roadmap, Cellular Manufacturing, Layout size and shape, 5S, and VSMs, showed low prominence and high dependency, indicating limited standalone impact on energy reduction in the automotive context.

5.2. CO2 Emission Reduction Discussion

The analysis of lean practices in relation to CO2 emission reduction reveals a distinct structure of causality and dependency (Figure 6). Among all practices, just-in-time (JIT) stands out as the most influential, initiating multiple causal relationships that impact several downstream practices (Table 8). This underlines its strategic importance in efforts to reduce emissions by minimizing overproduction, excessive inventory, and energy-intensive storage. JIT, along with pull production, both located in the first quadrant of the DEMATEL map, form the backbone of Step 1. Their integration into operations supports a demand-driven production system that avoids wasteful activities and aligns with lower CO2 generation. The benefits are amplified when these practices are closely coordinated with suppliers to minimize transportation frequency and reduce energy consumption. Step 2 comprises enabling practices that facilitate or support the implementation of JIT and pull production. These include one-piece-flow, TPM, Heijunka, Jidoka, and Cellular Manufacturing. These practices stabilize production, improve machine efficiency, and enhance flow, all of which indirectly contribute to emission reductions. Although less prominent individually, their combined effect supports the broader low-emission system. In Step 3, we identify practices that are strongly dependent on others to function effectively. Statistical Process Control (SPC) and 5S emerge as highly influenced practices that require the foundational practices in Steps 1 and 2 for their benefits to be realized. SPC plays a critical role in monitoring emissions-related process variables, while 5S supports workplace organization that can lead to reduced energy use and waste. Several practices, SMED, Root cause analysis, VSMs, TQM, Kaizen, and Standardized work, were excluded from this roadmap due to low prominence and limited impact. While relevant in broader lean systems, their direct influence on CO2 reduction in the analyzed context was deemed minimal by experts.

5.3. Waste Reduction Discussion

The waste reduction analysis uncovered a broader network of relationships, indicating that more lean practices are relevant in this area (Figure 7). Total Productive Maintenance (TPM) emerged again as the most causally dominant practice. Its proactive maintenance strategies not only reduce downtime but also help prevent the generation of scrap and defective products (Table 9). TPM, along with 5S, Kaizen, and Cellular Manufacturing, forms the basis of Step 1. These practices are either highly prominent or notably independent, making them ideal starting points for waste reduction. 5S and Kaizen foster a clean, organized, and continuously improving environment, while Cellular Manufacturing allows for more efficient layouts and material handling. In Step 2, practices like one-piece-flow, Standardized work, and JIT act as stabilizers and enablers. By improving flow, reducing overproduction, and ensuring consistency, these practices create the conditions necessary for effective waste minimization across the supply chain. Step 3 includes practices with high dependency but important roles in long-term waste management: SPC, Heijunka, pull production, Root cause analysis, VSMs, and TQM. These are positioned in the fourth quadrant and depend heavily on upstream practices. Their success is contingent on the presence of a mature lean system established through Steps 1 and 2. They help identify inefficiencies, reduce defects, and fine-tune processes to eliminate recurring waste. SMED, Jidoka, and Layout size and shape were excluded due to low prominence and lack of systemic influence.

5.4. Cross-Analysis of Lean Practices Across Environmental Performance

This section offers a comparative analysis of the three aspects of environmental performance examined. A first notable observation is the different density of interrelations between practices across the three graphs. Energy performance exhibited the highest number of connections, suggesting that improving energy efficiency often requires a more complex integration of multiple lean practices. However, when examining only the strongest connections (values above µ + 2σ), CO2 and waste presented more critical dependencies, while energy had fewer dominant links despite its overall network density. Across all three cases, certain practices showed remarkable consistency in their position and role. For instance, Statistical Process Control (SPC) consistently appeared in Quadrant IV, indicating its essential but highly dependent role in improving environmental outcomes. SPC’s reliance on other enabling practices, like one-piece-flow and Kaizen (both consistently found in Quadrant II), confirms the importance of structuring implementation hierarchies. Other practices, such as pull production and Heijunka, frequently occupied the right half of the graphs, either Quadrant I or IV, highlighting their overall importance regardless of the targeted performance. Particularly in waste reduction, both were found to be intertwined receivers, underlining their dependency on foundational practices for full impact. Conversely, practices such as JIT, SMED, TPM, and Jidoka often appeared in the upper half of the graph, indicating their significant influence. Though they may shift between Quadrants I and II depending on the performance evaluated, their influence on other practices is consistent. Successfully implementing these influential practices requires more than operational readiness. Strong leadership commitment, company-wide engagement, and adequate training are vital for embedding these methodologies into everyday processes. Their significance lies not only in their standalone benefits but also in their capacity to activate other high-impact lean practices.
Table 10 summarizes the roadmap placements of each practice across the three environmental targets. Several practices, JIT, pull production, Heijunka, TPM, SPC, and one-piece-flow, appear in at least one step for each performance type, demonstrating their central importance. Notably, one-piece-flow and SPC maintain identical roles across all three analyses: one-piece-flow as a foundational enabler (Step 2) and SPC as a final-phase executor (Step 3). While most high-priority practices appeared in multiple roadmaps, some were exclusive to a single performance. For example, SMED is prioritized only for energy, Layout size and shape only for CO2, and VSMs only for waste. These unique placements suggest that their effectiveness may be context-specific and could merit further investigation. When practices are grouped by bundle, it becomes evident that Production Planning and Control is the most dominant across all three sustainability dimensions. Process Technology practices are particularly prominent in CO2 and waste scenarios, while Human Resource practices, such as Kaizen and Standardized work, are more relevant in energy and waste contexts. This insight may guide managers in tailoring their lean strategies based on the environmental outcome they are aiming to improve.
An additional key point emerging from the graphical analysis is that each dimension of environmental performance unfolds as a specific pathway of the relationships among Lean Management practices (Figure 8). This article highlights that there is no single universal model for all types of performance; rather, each environmental goal requires a distinct and sequential combination of LMPs, with driving, enabling, and dependent practices changing in each case. This differentiation is particularly valuable for companies in the automotive sector, as it provides ad hoc implementation roadmaps that guide firms in selecting and prioritizing practices according to the environmental outcome pursued. In this sense, this study’s contribution goes beyond describing abstract correlations, translating the causal relationships among lean practices into concrete and customized operational pathways for each sustainability target.

6. Conclusions

This study aimed to explore the cause–effect relationships among lean practices targeting environmental sustainability (RQ1) and to understand how these relationships vary when evaluating different environmental performance indicators: energy consumption, CO2 emissions, and waste generation (RQ2). Through the application of the Fuzzy DEMATEL methodology, the research presents a comprehensive, data-driven model for identifying and structuring lean interventions within the Italian automotive industry.
In response to RQ1, the analysis revealed that lean practices are not isolated tools but part of a deeply interconnected system. Certain practices act as causal drivers, exerting influence over many others, while others are receivers, whose effectiveness depends on upstream implementation. For example, Total Productive Maintenance (TPM), just-in-time (JIT), and one-piece-flow emerged as high-leverage drivers across the system, enabling the implementation and success of more dependent practices like Statistical Process Control (SPC), TQM, and Root cause analysis. This systemic view helps move beyond the traditional, siloed evaluation of lean tools and offers a framework for phased implementation grounded in actual interdependencies. Regarding RQ2, the relationships among lean practices vary significantly depending on the specific environmental outcome being considered. Practices relevant to energy consumption showed greater overall connectivity and dispersion across prominence levels, suggesting that energy efficiency relies on a broader and more integrated application of lean practices. In contrast, practices related to CO2 emissions and waste reduction revealed more concentrated networks, with fewer but stronger interdependencies. Notably, practices such as pull production and Heijunka maintained high prominence across all three dimensions, indicating their central role in sustainable manufacturing regardless of the specific objective. Meanwhile, practices such as SMED, Layout size and shape, and VSMs were found to have performance-specific relevance, highlighting the need for contextual adaptation of lean systems.
For practitioners, this research provides an actionable roadmap to prioritizing and sequencing lean initiatives for enhancing environmental performance. Managers can utilize cause–effect diagrams and the three-step implementation model to tailor interventions according to the environmental goal they prioritize, whether it is reducing energy, minimizing emissions, or cutting waste. The identification of foundational and enabling practices ensures that efforts are focused where they can generate the greatest systemic benefit. Furthermore, this study emphasizes the need for strong organizational commitment and training, especially when implementing cornerstone practices like TPM and JIT, which require cultural and operational integration across the organization. Academically, this study helps fill a gap in the literature by adopting a systems-thinking approach to lean and environmental sustainability. It confirms the presence of synergies, both linear and nonlinear, among lean practices and introduces a methodology (Fuzzy DEMATEL) to capture and model these dynamics rigorously. By comparing results across multiple performance indicators, the research also sets the stage for further comparative analyses across industries or geographical contexts. Future studies could refine the model by integrating performance data, validating causality with longitudinal observations, or exploring additional environmental metrics such as water use or lifecycle emissions. In summary, this work presents a novel framework to guide both research and practice in designing lean systems that are not only operationally efficient but also environmentally responsible.

Limitations and Directions for Future Research

Despite the valuable insights generated, this study presents several limitations that should be acknowledged. First, the model is grounded in expert judgment, which, although informed and domain-specific, inherently involves subjectivity and potential bias. The initial input matrices provided by the experts may reflect individual perceptions and could be influenced by the ambiguity or uncertainty surrounding the causal relationships among lean practices. A second limitation concerns the selection of lean practices included in the analysis. While the practices were carefully chosen based on the literature and sector relevance, they may not represent the full spectrum of tools applicable to environmental sustainability. Additional or alternative practices could yield different interdependencies and implementation priorities. Moreover, this study adopts a theoretical and methodological lens without incorporating real-world constraints related to implementation feasibility. Factors such as resource availability, organizational culture, or workforce readiness, critical in practice, were not directly considered in this framework. The scope of the sample also introduces boundaries. All experts consulted were Italian professionals working within the automotive industry. While this ensured a homogeneous and sector-specific understanding, it also limited the generalizability of the findings. Expanding the panel to include experts from diverse national and cultural backgrounds could help reduce contextual bias and validate the robustness of the causal models across various settings. Similarly, applying the same methodology to other industrial sectors, or even to service environments, could provide new insights and extend the applicability of the proposed framework. These limitations open avenues for future research. Comparative cross-country studies, validation through empirical case studies, integration with performance data, or the inclusion of social and economic dimensions of sustainability (beyond environmental indicators) represents promising directions for enhancing the model and its practical relevance.

Author Contributions

Conceptualization, M.F.; Methodology, M.F.; Writing—original draft, M.F.; Visualization, M.F.; Supervision, A.P.-S. All authors have read and agreed to the published version of the manuscript.

Funding

This research received no external funding.

Data Availability Statement

Data is available on request.

Conflicts of Interest

The authors declare no conflict of interest.

References

  1. Acerbi, F.; Sassanelli, C.; Terzi, S.; Taisch, M. A Systematic Literature Review on Data and Information Required for Circular Manufacturing Strategies Adoption. Sustainability 2021, 13, 2047. [Google Scholar] [CrossRef]
  2. Sarkar, B.; Ullah, M.; Sarkar, M. Environmental and Economic Sustainability through Innovative Green Products by Remanufacturing. J. Clean. Prod. 2022, 332, 129813. [Google Scholar] [CrossRef]
  3. Transforming Our World: The 2030 Agenda for Sustainable Development Transforming Our World: The 2030 Agenda for Sustainable Development Preambl; United Nations: New York, NY, USA, 2015.
  4. Skalli, D.; Charkaoui, A.; Cherrafi, A.; Shokri, A.; Garza-Reyes, J.A.; Antony, J. Analysis of Factors Influencing Circular-Lean-Six Sigma 4.0 Implementation Considering Sustainability Implications: An Exploratory Study. Int. J. Prod. Res. 2024, 62, 3890–3917. [Google Scholar] [CrossRef]
  5. Ferrazzi, M.; Frecassetti, S.; Bilancia, A.; Portioli-Staudacher, A. Investigating the Influence of Lean Manufacturing Approach on Environmental Performance: A Systematic Literature Review. Int. J. Adv. Manuf. Technol. 2024, 136, 4025–4044. [Google Scholar] [CrossRef]
  6. Ferrazzi, M.; Tortorella, G.L.; Li, W.; Costa, F.; Portioli-Staudacher, A. From People to Performance: Leveraging Soft Lean Practices for Environmental Sustainability in Large-Scale Production. Sustainability 2025, 17, 3955. [Google Scholar] [CrossRef]
  7. Frecassetti, S.; Bassel, K.; Kaustav, K.; Matteo, F.; Portioli-Staudacher, A. Introducing Lean Practices through Simulation: A Case Study in an Italian SME. Qual. Manag. J. 2023, 30, 90–104. [Google Scholar] [CrossRef]
  8. Ferrazzi, M.; Li, W.; Tortorella, G.L.; Costa, F.; Portioli-Staudacher, A. Assessing the Environmental Benefits of Lean Practices in the Manufacturing Industry: An Interpretive Ranking Process Analysis. J. Clean. Prod. 2025, 525, 146405. [Google Scholar] [CrossRef]
  9. Siegel, R.; Antony, J.; Garza-Reyes, J.A.; Cherrafi, A.; Lameijer, B. Integrated Green Lean Approach and Sustainability for SMEs: From Literature Review to a Conceptual Framework. J. Clean. Prod. 2019, 240, 118205. [Google Scholar] [CrossRef]
  10. Garza-Reyes, J.A. Lean and Green-a Systematic Review of the State of the Art Literature. J. Clean. Prod. 2015, 102, 18–29. [Google Scholar] [CrossRef]
  11. Zhu, X.Y.; Zhang, H. Construction of Lean-Green Coordinated Development Model from the Perspective of Personnel Integration in Manufacturing Companies. Proc. Inst. Mech. Eng. B J. Eng. Manuf. 2020, 234, 1460–1470. [Google Scholar] [CrossRef]
  12. Sunmola, F.; Mbafotu, O.R.; Salihu-Yusuf, M.L.; Sunmola, H.O. Lean Green Practices in Automotive Components Manufacturing. Procedia Comput. Sci. 2024, 232, 2001–2008. [Google Scholar] [CrossRef]
  13. Mamat, R.C.; Md Deros, B.; Ab Rahman, M.N.; Omar, M.K.; Abdullah, S. Soft Lean Practices for Successful Lean Production System Implementation in Malaysia Automotive Smes: A Proposed Framework. J. Teknol. 2015, 77, 141–150. [Google Scholar] [CrossRef]
  14. Abu, F.; Gholami, H.; Saman, M.Z.M.; Zakuan, N.; Streimikiene, D.; Kyriakopoulos, G.L. An Sem Approach for the Barrier Analysis in Lean Implementation in Manufacturing Industries. Sustainability 2021, 13, 1978. [Google Scholar] [CrossRef]
  15. Rossini, M.; Costa, F.; Staudacher, A.P.; Tortorella, G. Industry 4.0 and Lean Production: An Empirical Study. IFAC-PapersOnLine 2019, 52, 42–47. [Google Scholar] [CrossRef]
  16. Dieste, M.; Panizzolo, R.; Garza-Reyes, J.A. Evaluating the Impact of Lean Practices on Environmental Performance: Evidences from Five Manufacturing Companies. Prod. Plan. Control 2020, 31, 739–756. [Google Scholar] [CrossRef]
  17. Dieste, M.; Panizzolo, R.; Garza-Reyes, J.A.; Anosike, A. The Relationship between Lean and Environmental Performance: Practices and Measures. J. Clean. Prod. 2019, 224, 120–131. [Google Scholar] [CrossRef]
  18. Ferrazzi, M.; Costa, F.; Frecassetti, S.; Portioli-Staudacher, A. Unlocking Synergies in Lean Manufacturing for Enhanced Environmental Performance: A Cross-Sector Investigation through Fuzzy DEMATEL. Clean. Logist. Supply Chain. 2025, 15, 100219. [Google Scholar] [CrossRef]
  19. Shah, R.; Ward, P.T. Lean Manufacturing: Context, Practice Bundles, and Performance. J. Oper. Manag. 2003, 21, 129–149. [Google Scholar] [CrossRef]
  20. Bai, C.; Satir, A.; Sarkis, J. Investing in Lean Manufacturing Practices: An Environmental and Operational Perspective. Int. J. Prod. Res. 2019, 57, 1037–1051. [Google Scholar] [CrossRef]
  21. Ferrazzi, M.; Portioli-Staudacher, A. Applying the Value Stream Map to Streamline Energy Consumption: Analysis of an Italian Company. In Advances in Production Management Systems. Production Management Systems for Responsible Manufacturing, Service, and Logistics Futures; Alfnes, E., Romsdal, A., Strandhagen, J.O., von Cieminski, G., Romero, D., Eds.; APMS 2023; IFIP Advances in Information and Communication Technology; Springer: Cham, Switzerland, 2023; Volume 689. [Google Scholar] [CrossRef]
  22. Ferrazzi, M.; Frecassetti, S.; Staudacher, A.P. Influence of the Lean Approach on Corporate Environmental Sustainability: A Case Study. In Lean, Green and Sustainability; McDermott, O., Rosa, A., Sá, J.C., Toner, A., Eds.; ELEC 2022; IFIP Advances in Information and Communication Technology; Springer: Cham, Switzerland, 2023; Volume 668. [Google Scholar] [CrossRef]
  23. Dieste, M.; Panizzolo, R.; Garza-Reyes, J.A. A Systematic Literature Review Regarding the Influence of Lean Manufacturing on Firms’ Financial Performance. J. Manuf. Technol. Manag. 2021, 32, 101–121. [Google Scholar] [CrossRef]
  24. Abualfaraa, W.; Salonitis, K.; Al-Ashaab, A.; Ala’raj, M. Lean-Green Manufacturing Practices and Their Link with Sustainability: A Critical Review. Sustainability 2020, 12, 981. [Google Scholar] [CrossRef]
  25. Gaikwad, L.; Sunnapwar, V. Development of an Integrated Framework of LGSS Strategies for Indian Manufacturing Firms to Improve Business Performance: An Empirical Study. TQM J. 2021, 33, 257–291. [Google Scholar] [CrossRef]
  26. Ben Ruben, R.; Vinodh, S.; Asokan, P. Implementation of Lean Six Sigma Framework with Environmental Considerations in an Indian Automotive Component Manufacturing Firm: A Case Study. Prod. Plan. Control 2017, 28, 1193–1211. [Google Scholar] [CrossRef]
  27. Singh, C.; Singh, D.; Khamba, J.S. Analyzing Barriers of Green Lean Practices in Manufacturing Industries by DEMATEL Approach. J. Manuf. Technol. Manag. 2020, 32, 176–198. [Google Scholar] [CrossRef]
  28. Ben Ruben, R.; Vinodh, S.; Asokan, P. ISM and Fuzzy MICMAC Application for Analysis of Lean Six Sigma Barriers with Environmental Considerations. Int. J. Lean Six Sigma 2018, 9, 64–90. [Google Scholar] [CrossRef]
  29. Ferrazzi, M.; Ye, F.; Frecassetti, S.; Portioli-Staudacher, A. Investigating the Relationship Among Lean Manufacturing Practices to Improved Eco-Efficiency Performance: A Fuzzy DEMATEL Analysis. In Challenging the Future with Lean; van Kollenburg, T., Kokkinou, A., McDermott, O., Eds.; ELEC 2023; IFIP Advances in Information and Communication Technology; Springer: Cham, Switzerland, 2024; Volume 681. [Google Scholar] [CrossRef]
  30. Costa, F.; Lispi, L.; Staudacher, A.P.; Rossini, M.; Kundu, K.; Cifone, F.D. How to Foster Sustainable Continuous Improvement: A Cause-Effect Relations Map of Lean Soft Practices. Oper. Res. Perspect. 2019, 6, 100091. [Google Scholar] [CrossRef]
  31. Frecassetti, S.; Rossini, M.; Portioli-Staudacher, A. Unleashing Industry 4.0: Leveraging Lean Practices to Overcome Implementation Barriers. IEEE Trans. Eng. Manag. 2024, 71, 10797–10814. [Google Scholar] [CrossRef]
  32. Lin, R.-J. Using Fuzzy DEMATEL to Evaluate the Green Supply Chain Management Practices. J. Clean. Prod. 2013, 40, 32–39. [Google Scholar] [CrossRef]
  33. Wu, W.-W.; Lee, Y.-T. Developing Global Managers’ Competencies Using the Fuzzy DEMATEL Method. Expert. Syst. Appl. 2007, 32, 499–507. [Google Scholar] [CrossRef]
  34. Logesh, B.; Balaji, M. Experimental Investigations to Deploy Green Manufacturing through Reduction of Waste Using Lean Tools in Electrical Components Manufacturing Company. Int. J. Precis. Eng. Manuf.-Green Technol. 2021, 8, 365–374. [Google Scholar] [CrossRef]
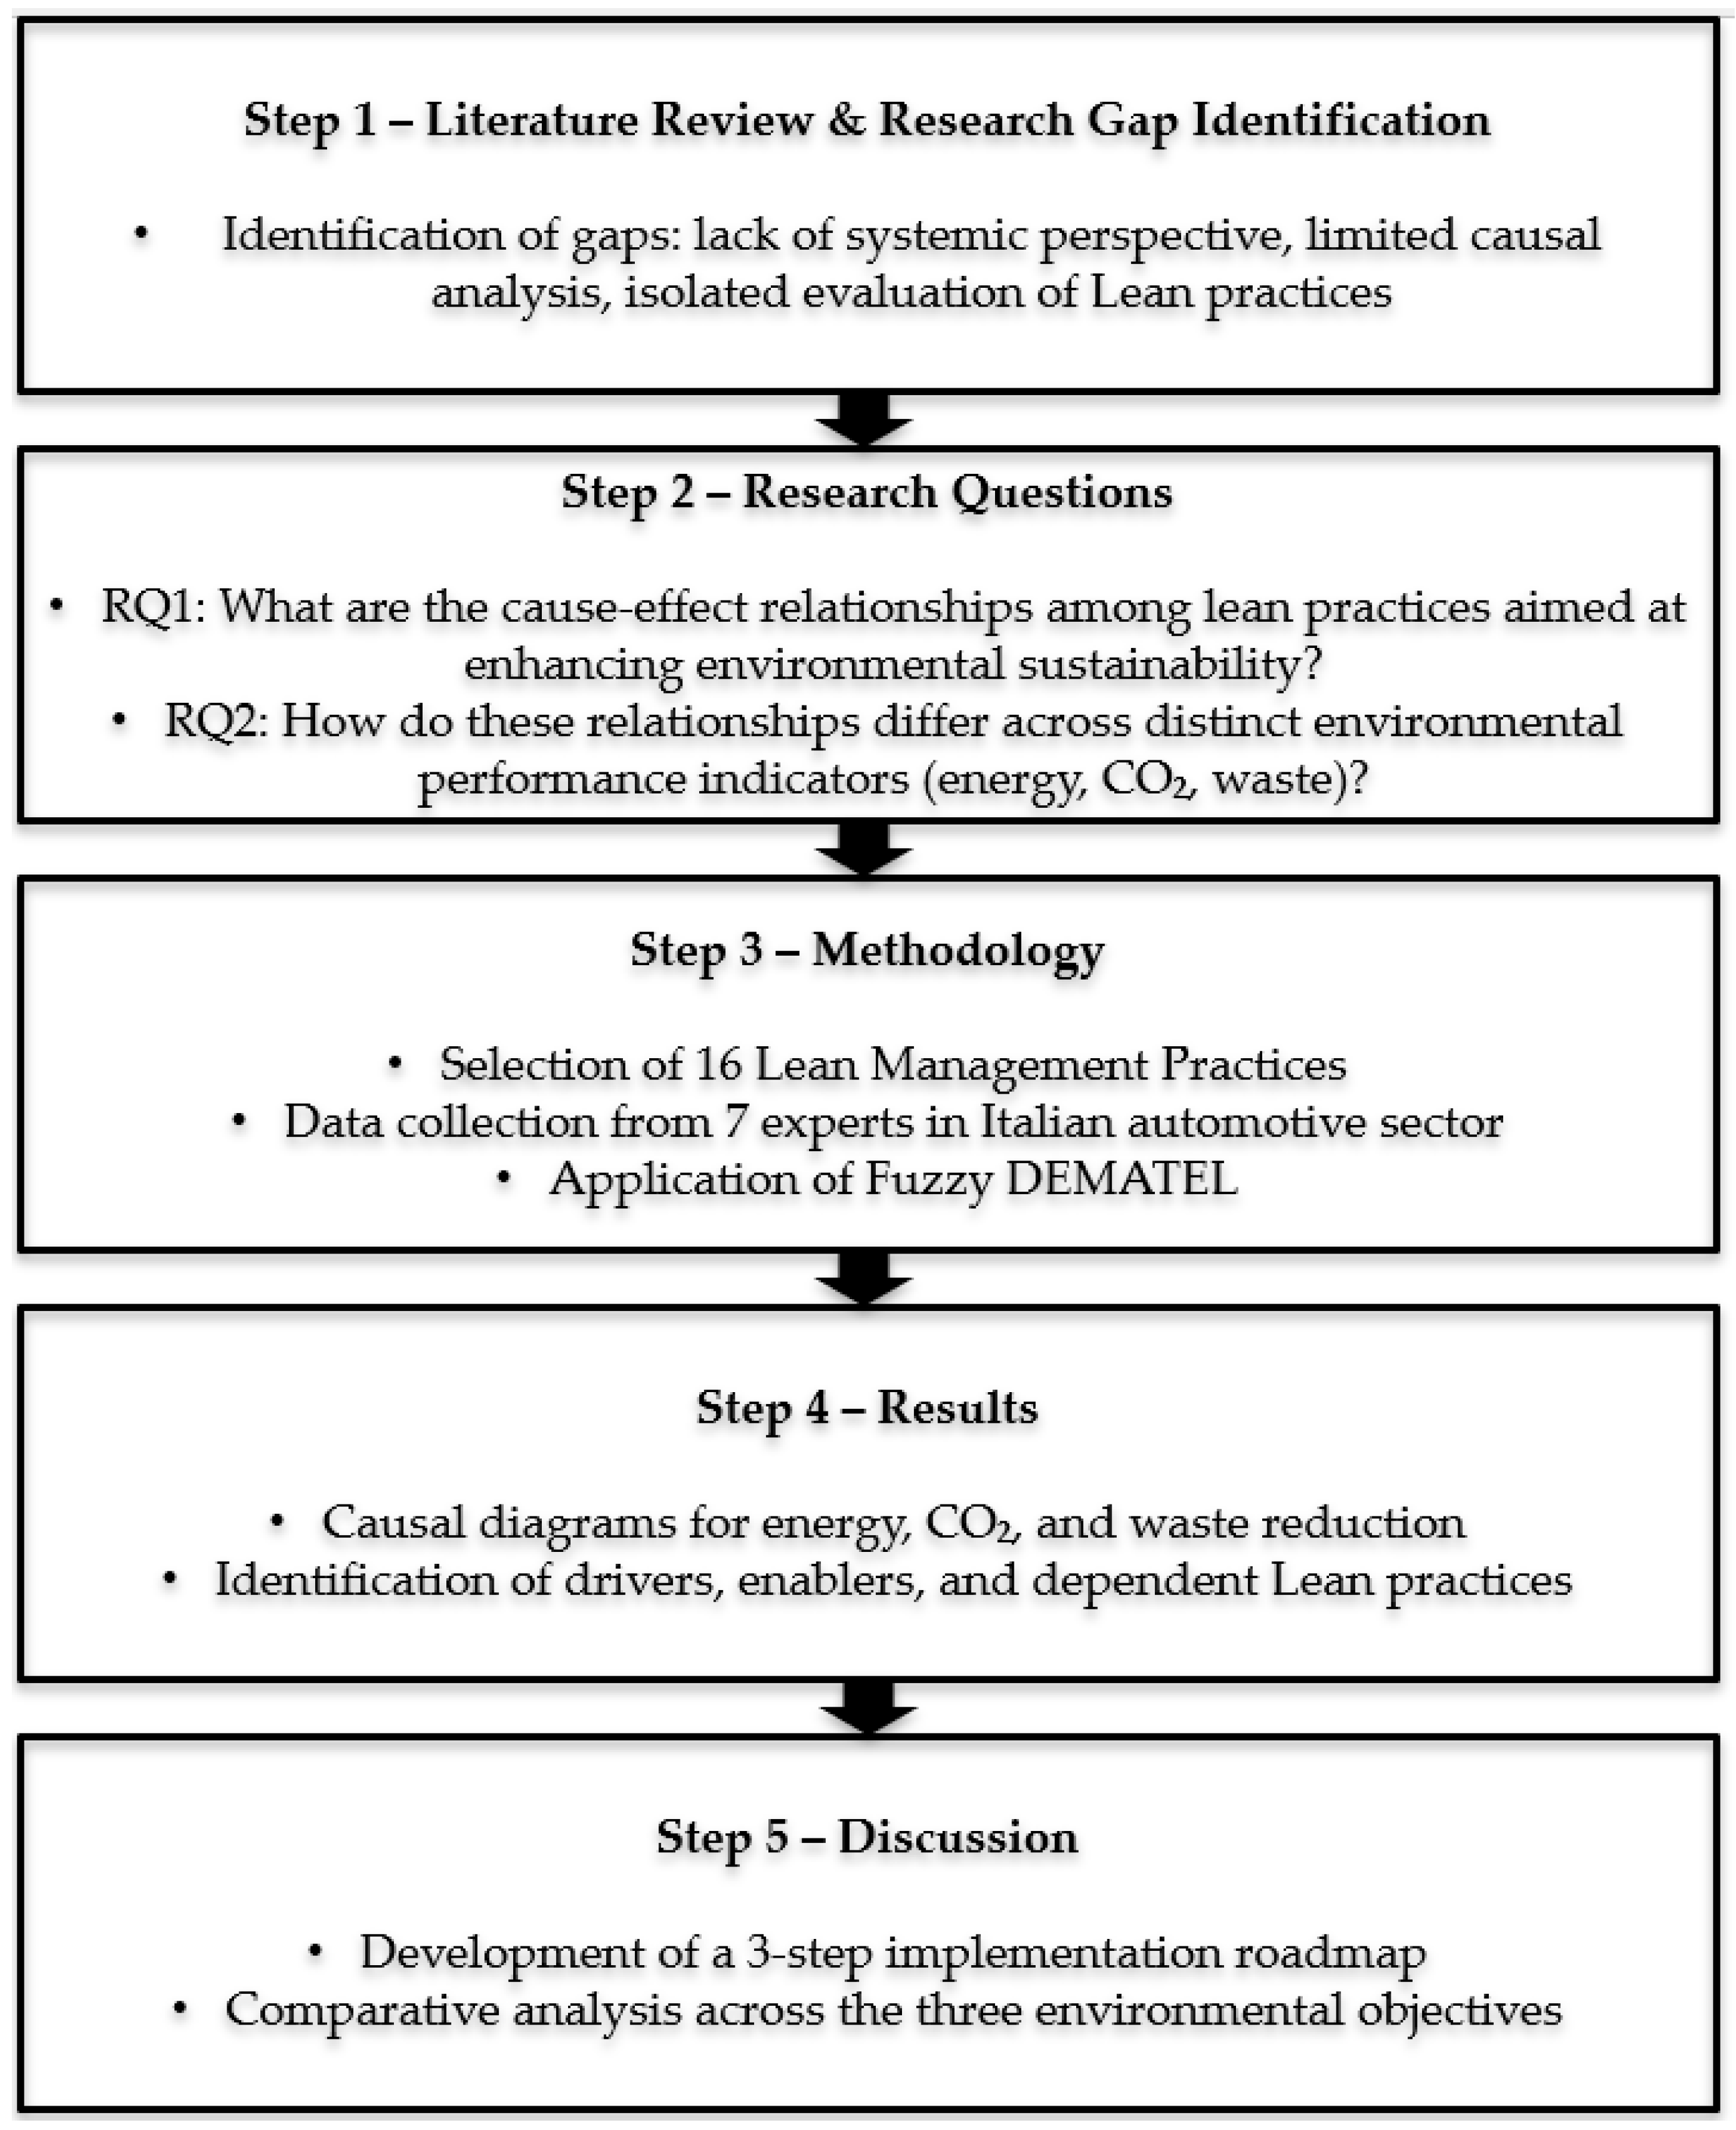
Figure 1. Study framework.
Eng 06 00296 g001
Figure 2. Relation map for energy reduction.
Eng 06 00296 g002
Figure 3. Relation map for CO2 emission reduction.
Eng 06 00296 g003
Figure 4. Relation map for waste reduction.
Eng 06 00296 g004
Figure 5. Graph with LMP relations for energy reduction.
Eng 06 00296 g005
Figure 6. Graph with LMP relations for CO2 emission reduction.
Eng 06 00296 g006
Figure 7. Graph with LMP relations for waste reduction.
Eng 06 00296 g007
Figure 8. Causal maps of lean practices for energy, CO2, and waste reductions.
Eng 06 00296 g008
Table 1. Lean Manufacturing Practices to be investigated [20].
BundlesLean Manufacturing PracticesPractices ID
SupplierJIT delivery by supplierS1
Production Planning and ControlSingle-Minute Exchange of Dies (SMED)PPC1
Pull production/takt timePPC2
Smoothed (leveled) production (Heijunka)PPC3
Total Productive Maintenance (TPM)PPC4
Statistical Process Control (SPC)PPC5
Root cause analysis for problem solvingPPC6
Process TechnologyAutonomation (Jidoka)PT1
One-piece-flow (continuous flow)PT2
Cellular ManufacturingPT3
Layout size and shapePT4
5SPT5
Value Stream Maps (VSMs)PT6
Total Quality Management (TQM)PT7
Human ResourcesContinuous improvementHR1
Standardized workHR2
Table 2. Lean Manufacturing practices to be investigated.
Expert IDRoleSupply Chain PositioningYears of Experience
1Associate DirectorFinal assembly10+
2Senior Project ManagerFinal assembly10+
3Lean ManagerComponent production10+
4Quality ManagerComponent production10+
5Continuous Improvement ManagerComponent production10+
6Program ManagerComponent production8
7Head of OperationsComponent production8
Table 3. Numerical and linguistic scales for the Fuzzy DEMATEL.
Linguistic VariableInfluence ScoreCorresponding Triangular Fuzzy Numbers (l,m,r)
much less impactful0(0,0,0.25)
less impactful1(0,0.25,0.5)
equally impactful2(0.25,0.5,0.75)
more impactful3(0.5,0.75,1)
much more impactful4(0.75,1,1)
Table 4. Prominence and relation values for energy reduction.
Practices IDLean Manufacturing PracticesRDD + RD − R
S1JIT delivery by supplier6.425.6512.060.77
PPC1Single-Minute Exchange of Dies (SMED)6.295.7412.030.54
PPC2Pull production/takt time6.315.7712.070.54
PPC3Smoothed (leveled) production (Heijunka)5.946.2112.15−0.26
PPC4Total Productive Maintenance (TPM)6.845.2112.051.64
PPC5Statistical Process Control (SPC)5.376.7112.09−1.34
PPC6Root cause analysis for problem solving5.226.8412.06−1.61
PT1Autonomation (Jidoka)6.525.4912.001.03
PT2Cellular Manufacturing 5.876.0511.91−0.18
PT3One-piece-flow (continuous flow)6.655.2911.941.35
PT4Layout size and shape6.045.9511.990.09
PT55S4.966.8911.85−1.93
PT6Value Stream Maps (VSMs)5.506.3311.83−0.84
PT7Total Quality Management (TQM)5.186.8912.07−1.71
HR1Continuous improvement (Kaizen)6.455.2811.731.18
HR2Standardized work6.375.6412.010.74
Table 5. Prominence and relation values for CO2 emission reduction.
Practices IDLean Manufacturing PracticesRDD + RD − R
S1JIT delivery by supplier2.914.717.621.80
PPC1Single-Minute Exchange of Dies (SMED)3.763.827.580.06
PPC2Pull production/takt time3.703.917.610.20
PPC3Smoothed (leveled) production (Heijunka)3.783.847.620.06
PPC4Total Productive Maintenance (TPM)3.304.287.580.98
PPC5Statistical Process Control (SPC)4.153.477.62−0.68
PPC6Root cause analysis for problem solving4.163.427.58−0.73
PT1Autonomation (Jidoka)3.763.837.590.06
PT2Cellular Manufacturing3.823.777.60−0.05
PT3One-piece-flow (continuous flow)3.464.097.550.64
PT4Layout size and shape3.713.907.620.19
PT55S4.193.457.64−0.74
PT6Value Stream Maps (VSMs)4.023.547.56−0.49
PT7Total Quality Management (TQM)4.443.137.57−1.31
HR1Continuous improvement (Kaizen)3.733.817.540.07
HR2Standardized work3.823.767.58−0.06
Table 6. Prominence and relation values for waste reduction.
Practices IDLean Manufacturing PracticesRDD + RD − R
S1JIT delivery by supplier5.566.1911.750.63
PPC1Single-Minute Exchange of Dies (SMED)5.815.9511.760.14
PPC2Pull production/takt time6.285.5311.81−0.76
PPC3Smoothed (leveled) production (Heijunka)6.005.8311.83−0.17
PPC4Total Productive Maintenance (TPM)4.966.8011.761.84
PPC5Statistical Process Control (SPC)6.505.4711.97−1.02
PPC6Root cause analysis for problem solving6.185.6011.78−0.58
PT1Autonomation (Jidoka)5.775.9611.720.19
PT2Cellular Manufacturing5.815.9611.770.15
PT3One-piece-flow (continuous flow)5.466.2611.710.80
PT4Layout size and shape6.245.4411.68−0.81
PT55S5.756.0411.800.29
PT6Value Stream Maps (VSMs)6.535.2411.77−1.29
PT7Total Quality Management (TQM)6.475.2811.75−1.19
HR1Continuous improvement (Kaizen)5.366.4011.751.04
HR2Standardized work5.506.2411.750.74
Table 7. Energy reduction—total relation matrix with thresholds (Threshold 1: 0.45; highlighted in blue. Threshold 2: 0.48; highlighted in red).
S1PPC1PPC2PPC3PPC4PPC5PPC6PT1PT2PT3PT4PT5PT6PT7HR1HR2
S10.330.400.390.420.340.450.460.370.400.350.410.470.430.460.360.38
PPC10.360.330.380.410.340.440.450.370.400.350.400.460.420.450.360.38
PPC20.370.380.330.400.340.450.450.370.400.360.400.460.420.450.340.37
PPC30.350.360.370.340.330.420.420.350.380.330.380.430.390.420.330.36
PPC40.410.410.420.440.320.480.490.400.430.380.420.490.460.490.380.41
PPC50.320.330.320.350.300.330.390.320.340.290.340.390.360.390.290.31
PPC60.310.320.320.350.290.370.330.300.330.300.330.380.340.380.290.31
PT10.390.390.390.420.360.450.470.330.420.370.410.480.440.480.360.38
PT20.350.350.360.380.320.410.430.330.320.320.370.420.390.430.330.35
PT30.400.400.400.430.370.470.470.380.430.320.410.480.440.490.370.39
PT40.350.360.360.390.330.420.430.350.380.340.330.440.410.440.340.36
PT50.290.300.290.330.280.350.360.280.320.270.310.310.340.370.270.29
PT60.320.340.330.360.300.390.400.310.350.300.340.400.320.410.310.33
PT70.310.320.320.340.280.360.380.290.330.280.320.380.340.320.290.31
HR10.380.380.400.430.360.460.460.370.410.360.400.420.310.460.310.39
HR20.380.380.390.410.350.460.460.370.410.360.390.420.350.460.350.33
Table 8. CO2 emission reduction—total relation matrix with thresholds (Threshold 1: 0.29; highlighted in blue. Threshold 2: 0.31; highlighted in red).
S1PPC1PPC2PPC3PPC4PPC5PPC6PT1PT2PT3PT4PT5PT6PT7HR1HR2
S10.180.300.280.290.260.330.330.290.300.270.290.340.320.340.300.30
PPC10.180.190.240.240.210.270.270.240.240.220.230.260.250.280.240.24
PPC20.200.240.190.240.210.280.280.240.250.220.240.270.260.290.240.25
PPC30.190.240.240.190.210.260.260.240.240.220.240.260.260.280.240.25
PPC40.210.270.270.270.190.290.290.270.280.250.270.290.290.320.260.27
PPC50.160.220.210.220.190.190.240.220.220.200.220.240.230.260.220.22
PPC60.160.210.200.220.190.230.190.220.220.200.210.240.230.250.220.22
PT10.190.240.240.240.210.260.190.230.250.220.230.270.260.280.240.24
PT20.190.240.230.240.200.260.260.230.190.220.250.260.260.280.240.24
PT30.200.250.250.260.230.280.280.260.260.190.250.290.270.310.250.26
PT40.200.250.240.240.210.270.270.240.250.240.250.280.260.290.240.25
PT50.160.220.220.220.190.210.240.210.230.200.220.190.230.260.220.21
PT60.170.230.220.220.190.250.250.220.220.200.220.250.190.270.220.22
PT70.150.200.200.200.170.220.210.200.200.170.200.190.190.190.190.20
HR10.180.240.240.240.210.260.260.240.240.220.240.260.250.280.190.25
HR20.180.240.230.230.210.260.260.240.220.220.230.270.230.270.230.19
Table 9. Waste reduction—total relation matrix with thresholds (Threshold 1: 0.43; highlighted in blue. Threshold 2: 0.45; highlighted in red).
S1PPC1PPC2PPC3PPC4PPC5PPC6PT1PT2PT3PT4PT5PT6PT7HR1HR2
S10.320.390.420.400.330.440.400.370.380.360.410.380.440.420.360.37
PPC10.350.320.400.380.310.420.400.360.370.340.390.370.420.420.350.36
PPC20.320.350.320.360.300.390.370.340.340.320.360.340.390.380.320.33
PPC30.340.370.390.320.310.400.380.360.360.340.400.370.410.400.340.34
PPC40.400.430.450.430.310.470.450.430.430.400.460.420.480.470.390.40
PPC50.330.340.370.360.300.330.370.340.340.320.340.330.380.380.310.32
PPC60.340.350.370.370.290.380.320.350.350.330.340.340.390.390.320.33
PT10.370.370.400.380.310.410.390.320.370.340.400.370.420.410.340.35
PT20.360.370.400.380.310.410.390.320.350.320.400.370.420.410.340.35
PT30.380.390.420.400.340.430.410.390.390.320.420.380.440.430.350.36
PT40.330.340.370.340.290.380.360.330.330.320.380.330.380.380.310.32
PT50.360.380.410.380.320.420.400.370.380.360.410.320.420.410.350.35
PT60.310.320.350.340.280.370.350.320.330.310.350.330.320.370.300.31
PT70.320.320.360.340.280.360.350.330.330.310.350.330.370.320.310.31
HR10.380.390.430.410.340.440.420.390.400.380.440.400.440.440.320.38
HR20.370.380.420.400.340.440.410.390.390.370.430.390.430.430.350.32
Table 10. Practice step for each environmental performance.
Practices IDLean Manufacturing PracticesEnergy ReductionCO2 Emission ReductionWaste Reduction
S1JIT delivery by supplierStep 1Step 1Step 2
PPC1Single-Minute Exchange of Dies (SMED)Step 1--
PPC2Pull production/takt timeStep 1Step 1Step 3
PPC3Smoothed (leveled) production (Heijunka)Step 1Step 2Step 3
PPC4Total Productive Maintenance (TPM)Step 1Step 2Step 1
PPC5Statistical Process Control (SPC)Step 3Step 3Step 3
PPC6Root cause analysis for problem solvingStep 3-Step 3
PT1Autonomation (Jidoka)Step 1Step 2-
PT2Cellular Manufacturing-Step 2Step 1
PT3One-piece-flow (continuous flow)Step 2Step 2Step 2
PT4Layout size and shape-Step 2-
PT55S-Step 3Step 1
PT6Value Stream Maps (VSMs)--Step 3
PT7Total Quality Management (TQM)Step 3-Step 3
HR1Continuous improvement (Kaizen)Step 2-Step 1
HR2Standardized workStep 1-Step 2
Disclaimer/Publisher’s Note: The statements, opinions and data contained in all publications are solely those of the individual author(s) and contributor(s) and not of MDPI and/or the editor(s). MDPI and/or the editor(s) disclaim responsibility for any injury to people or property resulting from any ideas, methods, instructions or products referred to in the content.