Article

Assessing Fault Slip Probability and Controlling Factors in Shale Gas Hydraulic Fracturing

1
Xinjiang Key Laboratory of Efficient Utilization and Sequestration of Carbon Dioxide, Karamay Campus, China University of Petroleum (Beijing), Karamay 834000, China
2
Hainan Institute of China University of Petroleum (Beijing), Sanya 572024, China
3
Oil Extraction Technology Research Institute of Xinjiang Oilfield Company, Karamay 834000, China
*
Author to whom correspondence should be addressed.
Eng 2025, 6(10), 272; https://doi.org/10.3390/eng6100272 (registering DOI)
Submission received: 27 July 2025 / Revised: 14 September 2025 / Accepted: 30 September 2025 / Published: 11 October 2025

Abstract

Fault slips induced by hydraulic fracturing are the primary mechanism of casing de-formation during deep shale gas development in Sichuan’s Luzhou Block, where de-formation rates reach 51% and severely compromise productivity. To address a critical gap in existing research on quantitative risk assessment systems, we developed a probabilistic model integrating pore pressure evolution dynamics with Monte Carlo simulations to quantify slip risks. The model incorporates key operational parameters (pumping pressure, rate, and duration) and geological factors (fault friction coefficient, strike/dip angles, and horizontal stress difference) validated through field data, showing >90% slip probability in 60% of deformed well intervals. The results demonstrate that prolonged high-intensity fracturing increases slip probability by 32% under 80–100 MPa pressure surges. Meanwhile, an increase in the friction coefficient from 0.40 to 0.80 reduces slip probability by 6.4% through elevated critical pore pressure. Fault geometry exhibits coupling effects: the risk of low-dip faults reaches its peak when strike parallels the maximum horizontal stress, whereas high-dip faults show a bimodal high-risk distribution at strike angles of 60–120°; here, the horizontal stress difference is directly proportional to the slip probability. We propose optimizing fracturing parameters, controlling operation duration, and avoiding high-risk fault geometries as mitigation strategies, providing a scientific foundation for enhancing the safety and efficiency of shale gas development.

1. Introduction

Deep shale gas is a crucial alternative in China’s energy strategy. Owing to its superior reservoir conditions, the Luzhou Block in Sichuan Province, with superior reservoir conditions, is recognized as the region with the greatest development potential in this field [1,2,3]. In Well Lu 203, a daily shale gas production of 1.379 × 10⁶ m3 was achieved through horizontal drilling and hydraulic fracturing, demonstrating the maturity of China’s deep shale gas extraction technologies and breakthroughs in large-scale development [4,5]. However, casing deformation has become a critical bottleneck constraining efficient production. In December 2022, the casing deformation rate of deep shale gas wells in the Luzhou Block reached 51.0%, with the Well Lu 203 area exhibiting an even higher rate of 68.6% [6,7,8]. Casing deformation can cause loss of fracturing stages, bridge plug obstructions, and even well abandonment, typically reducing single-well production by over 30% and severely compromising development efficiency. Field analyses indicate that most deformations are shear-induced S-shaped deformations, showing high consistency with fault slip dynamics. Spatial correlation analyses reveal that 91.6% of deformation points align with antithetic faults and microseismic zones [9,10], confirming that fault slip induced by hydraulic fracturing is the primary cause of casing deformation.
Extensive studies by domestic and international researchers demonstrate that hydraulic fracturing universally activates faults. For example, seismic wave and fluid response analyses confirm that disturbances 50 km away can alter the poroelastic parameters of injection layers in Oklahoma [11]; spatiotemporal clustering analysis establishes that seismic activities in the Delaware Basin are primarily induced by hydraulic fracturing, followed by wastewater reinjection [12]. The EGS Collab experiments provide a valuable case study on fault reactivation potential, demonstrating that a low shear-to-normal stress ratio and the inability to effectively pressurize a healed fracture are critical constraints on hydraulic stimulation-induced slip [13]. Scholars have investigated fault activation mechanisms comprehensively, focusing on fault-slip-induced casing deformation. Regarding fault slip modeling, research on Changning-Weiyuan shale indicates that when the clay content of a fault gouge falls below a certain threshold, velocity weakening occurs, triggering unstable slip during fracturing [14]. Friction tests demonstrate that high-pressure fluids reduce the fracture surface friction coefficient from 0.6 to near 0, inducing stick-slip behavior [15]. Furthermore, analyses highlight that seepage of fracturing fluid seepage along fracture-fault intersections expands the activation zone [16,17]. A study on shale reservoir hydraulic fracturing establishes that increased construction displacement and fluid viscosity significantly accelerate fault activation and raise casing failure risk, while also validating imperfect cementing and high-hardness cement sheaths as effective mitigation strategies [18]. This case study further demonstrates that hydraulic fracturing significantly elevates the probability of fault slip-induced casing deformation, yet this risk can be effectively mitigated through geomechanical modeling and optimized fracturing parameters such as reduced displacement and scale [19]. In slip risk analysis, slip criteria based on focal mechanisms and geomechanical coupling models have been established, with positive correlations proposed between slip magnitude, formation elastic modulus, and moment magnitude [20,21]; a slip model accounting for strata above and below faults has been developed, analyzing inverted-S slip patterns in multi-stage fracturing [22], Additionally, dynamic models verify that increased fracturing stages and displacement exacerbate slip, while longer fault length, wellbore angles <30°, and high in situ stress differences elevate risks [23,24]. Recent 3D coupled hydro-mechanical modeling further confirms that the in situ stress regime critically controls fault slip behavior, with strike-slip settings exhibiting significantly higher risks of large seismic slip and magnitude compared to thrust or normal faulting regimes [25]. Numerical modeling confirms that elevated injection rates and extended durations significantly increase fault-slip probability, while strategically placed production wells reduce Coulomb failure stress by 30%, providing quantifiable parameters for Monte Carlo simulations of hydraulic fracturing-induced seismic risk [26]. An open-source tool for fault slip analysis has been developed to aid mitigation measures [27]. Net fracture pressure has been identified as the key control factor, with casing grade and wall thickness optimization showing limited effects on severe deformation [28]. Zoned injection control in Kansas has also been proposed, effectively reducing induced seismicity through graded injection reduction [29]. Recent studies have further systematized casing deformation into three mechanistic types and developed integrated deterministic workflows combining geomechanics and discrete fracture networks to achieve predictive accuracy up to 78% for specific geological layers [30]. Furthermore, data-driven approaches leveraging machine learning and game theory were recently employed to decipher the complex, non-linear interactions between geological and engineering factors driving casing deformation, yielding interpretable risk templates for field application [31]. While prior research elucidated fault slip as the core mechanism and proposed mitigation strategies, most risk quantification efforts remain focused solely on injection wells. They fail to account for fracturing in horizontal wells and lack the application of probabilistic Monte Carlo simulation methods required for refined risk management. Although Monte Carlo simulations incorporating uncertain rock mechanical parameters and thermal-stress coupling effects have been used to quantitatively define the probability of fault reactivation under fluid injection, enabling probabilistic safe operating envelopes [32], this approach has not been extensively applied to the specific context of fault-slip and casing deformation risk in shale gas horizontal wells.
This study establishes a fault slip probability model for the Luzhou Block based on pore pressure evolution. First, we calculate frictional/perforation/bending pressure drops to determine the fracture fluid pressure. Second, we assess fault connection via fracture extension models and determine critical fault stress states using the Mohr-Coulomb criterion, defining the slip probability index Ps (Ps = pore pressure/critical pore pressure). Finally, Monte Carlo simulations quantify uncertainty in friction coefficients, fault attributes, and stress differentials. The results provide a basis for casing deformation prevention, with the technical roadmap shown in Figure 1.

2. Fault Slip Probability Calculation Model

This section describes a fault slip probability model based on pore pressure evolution to quantitatively evaluate the risk of fault slip induced by hydraulic fracturing. The core premise is that fluid pressure disturbances during fracturing propagate through fracture networks to adjacent faults, altering the fault plane’s effective stress state. Slip occurs when shear stress exceeds the fault’s shear strength—satisfying the Coulomb slip criterion—potentially leading to casing deformation. The model computes the ratio of fault pressure to critical pore pressure and employs Monte Carlo simulation to quantify slip probability, providing quantitative criteria for pre-fracture risk assessment.

2.1. Calculation of Fault Pressure

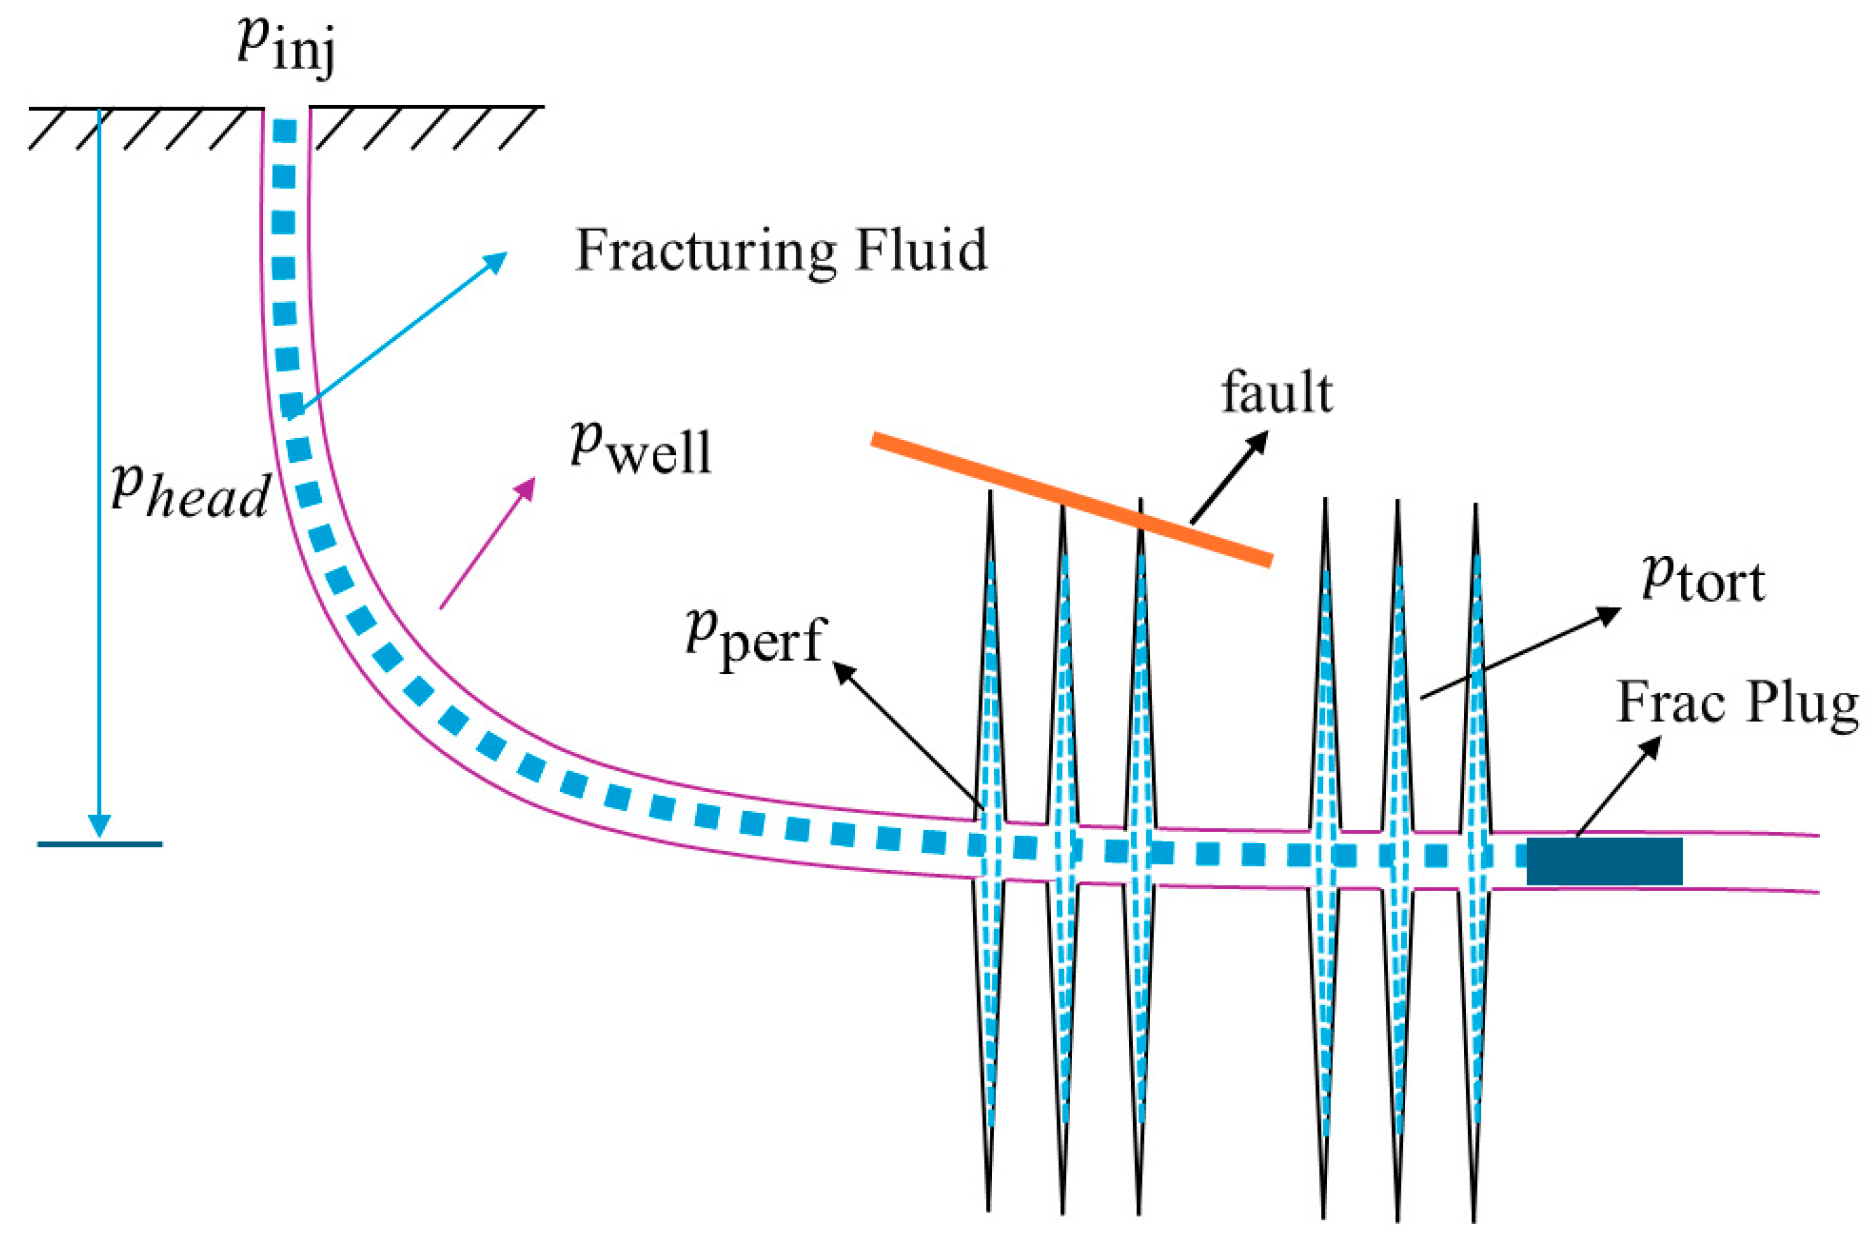
Fluid pressure disturbance is the primary driver of fault slip. Figure 2 illustrates pressure and friction distribution during hydraulic fracturing:
Based on the fluid pressure and friction distribution during hydraulic fracturing, the fracture fluid pressure is expressed as [33]:
p f = p inj p total + p head ,
where p inj is the wellhead injection pressure, p total is the cumulative pressure drop, and p head is the hydrostatic pressure. p total comprises three components:
1.
Wellbore friction loss p well :
p well = f L D 1 2 ρ 4 Q π D 2 2 ,
where f is the pipe friction coefficient, L is the pipe length, D is the pipe inner diameter, ρ is the fluid density, and Q is the flow rate.
2.
Perforation friction loss p perf :
p perf = 1 2 ρ Q C d n perf π ( d perf / 2 ) 2 2 ,
where C d is the perforation discharge coefficient, n perf is the number of perforations, and d perf is the perforation diameter.
3.
Near-wellbore tortuosity friction loss p tort :
p tort = K nwb Q β nwb ,
where K nwb is the near-wellbore tortuosity coefficient, and β nwb is the flow exponent.
The fracture extension length determines whether hydraulic connectivity to the fault exists, as illustrated in Figure 2. According to the PKN model, the fracture half-length [34] is:
L = 0.654 G Q 3 1 ν μ h 4 1 / 5 t 4 / 5 ,
where L is the fracture half-length, G is the shear modulus, ν is Poisson’s ratio, μ is the fracturing fluid viscosity, h is the fracture height, and t is injection time.
If Ldfault, where dfault is the minimum distance between the fracturing stage and the fault, direct hydraulic connection occurs, and the fault pressure P pore = p f . Otherwise, pressure propagates to the fault via diffusion, requiring transient pressure modeling. The pore pressure increment [35] is:
Δ P = Q 4 π k H μ α 0 t   1 τ e r 2 / 4 α τ d τ ,
where Δ P is the pressure increment, k is the permeability, H is formation thickness, α is hydraulic diffusivity, and r is the radial distance from the fracture tip to the fault. The fault zone pore pressure is therefore:
P pore = P o +   Δ P ,
where Po is the initial pore pressure. Equations (1)–(7) enable fault pressure calculation for slip risk assessment through comparison with the critical pore pressure defined by the Coulomb criterion.

2.2. Deterministic Probability Calculation of Fault Slip

To assess the risk of fault slip during hydraulic fracturing, the model employs the Coulomb criterion to calculate the critical pore pressure. The geometric relationship between in situ stresses and an arbitrary fault plane is illustrated in Figure 3.
First, the normal and shear stresses on any fault plane are computed based on the fault dip and strike, as shown in Equations (8)–(12):
l = c o s ( θ h ) = s i n δ c o s ϕ ,
m = c o s ( θ H ) = s i n δ s i n ϕ ,
n = c o s ( θ V ) = c o s δ ,
σ n = σ H l 2 + σ h m 2 + σ v n 2 ,
τ = ( σ H l ) 2 + ( σ h m ) 2 + ( σ v n ) 2 σ n 2 ,
where δ and ϕ are the fault dip and strike, respectively; l , m , and n are the direction cosines in the principal stress coordinate system; σ H , σ h , and σ v are the maximum horizontal principal stress, minimum horizontal principal stress, and vertical in situ stress, respectively; and σ n and τ are the normal stress and shear stress on the fault plane, respectively. According to the Mohr-Coulomb strength theory, the critical pore pressure for fault slip is:
P crit = σ n τ C μ f ,
where μ f is the fault friction coefficient and C is the fault cohesion. The fault slip probability P s is:
P s = P pore P crit × 100 % .

2.3. Probabilistic Calculation of Fault Slip Uncertainty

Given the challenges in precisely measuring geomechanical parameters such as in situ stress, fault dip, and strike, as well as the variability inherent in operational parameters such as pumping pressure and pumping rate, these factors are inherently uncertain and are best characterized using probability distributions (e.g., normal, uniform). Traditional deterministic models, which overlook such uncertainties, may lead to erroneous risk assessments. To quantify the impact of geomechanical parameter uncertainties on fault slip risk, this study employs the Monte Carlo simulation method—a numerical approach that leverages random sampling of parameter values and extensive repeated trials to characterize uncertainty through probabilistic statistical laws. Specifically, random samples are drawn from the probability distributions of key parameters, the deterministic slip probability calculation is executed ≥10,000 times, the frequency of risk events is tallied, and the cumulative probability of fault slip is derived.
P = 1 N i = 1 N I P pore i P crit i .
where N is the total number of Monte Carlo simulations performed; i is the index of an individual simulation trial ( i   = 1, 2, …, N ); P pore i is the pore pressure value calculated in the i -th simulation; P crit i is the critical pore pressure value calculated in the i -th simulation; and I [ ] is the Indicator Function, which returns a value of 1 if the condition inside the brackets is true, and 0 otherwise.

3. Model Validation

The Luzhou Block is in an overall strike slip stress state. The in situ stress parameters of Well Lu 20X are as follows: maximum horizontal principal stress, 99.2–104.5 MPa; minimum horizontal principal stress, 87.8–92.8 MPa; vertical in situ stress, 93.9–97.3 MPa; Poisson’s ratio, 0.26–0.3; and Young’s modulus, 41.1–49.1 GPa. Ant-body interpretation shows that natural fracture development zones in this well are distributed at 4045–4072 m, 4328–4399 m, 4668–4714 m, 4893–4935 m, and 5447–5497 m. During hydraulic fracturing, the pumping rate ranges from 16 to 18 m3/min, and the construction pressure ranges from 76 to 93 MPa A hard obstruction occurred when pumping the bridge plug to 4967 m in the seventh stage, 236 m short of the target bridge plug position at 5203 m. This indicates that fault slip was induced during the fracturing of the sixth stage of this well, as shown in Figure 4.
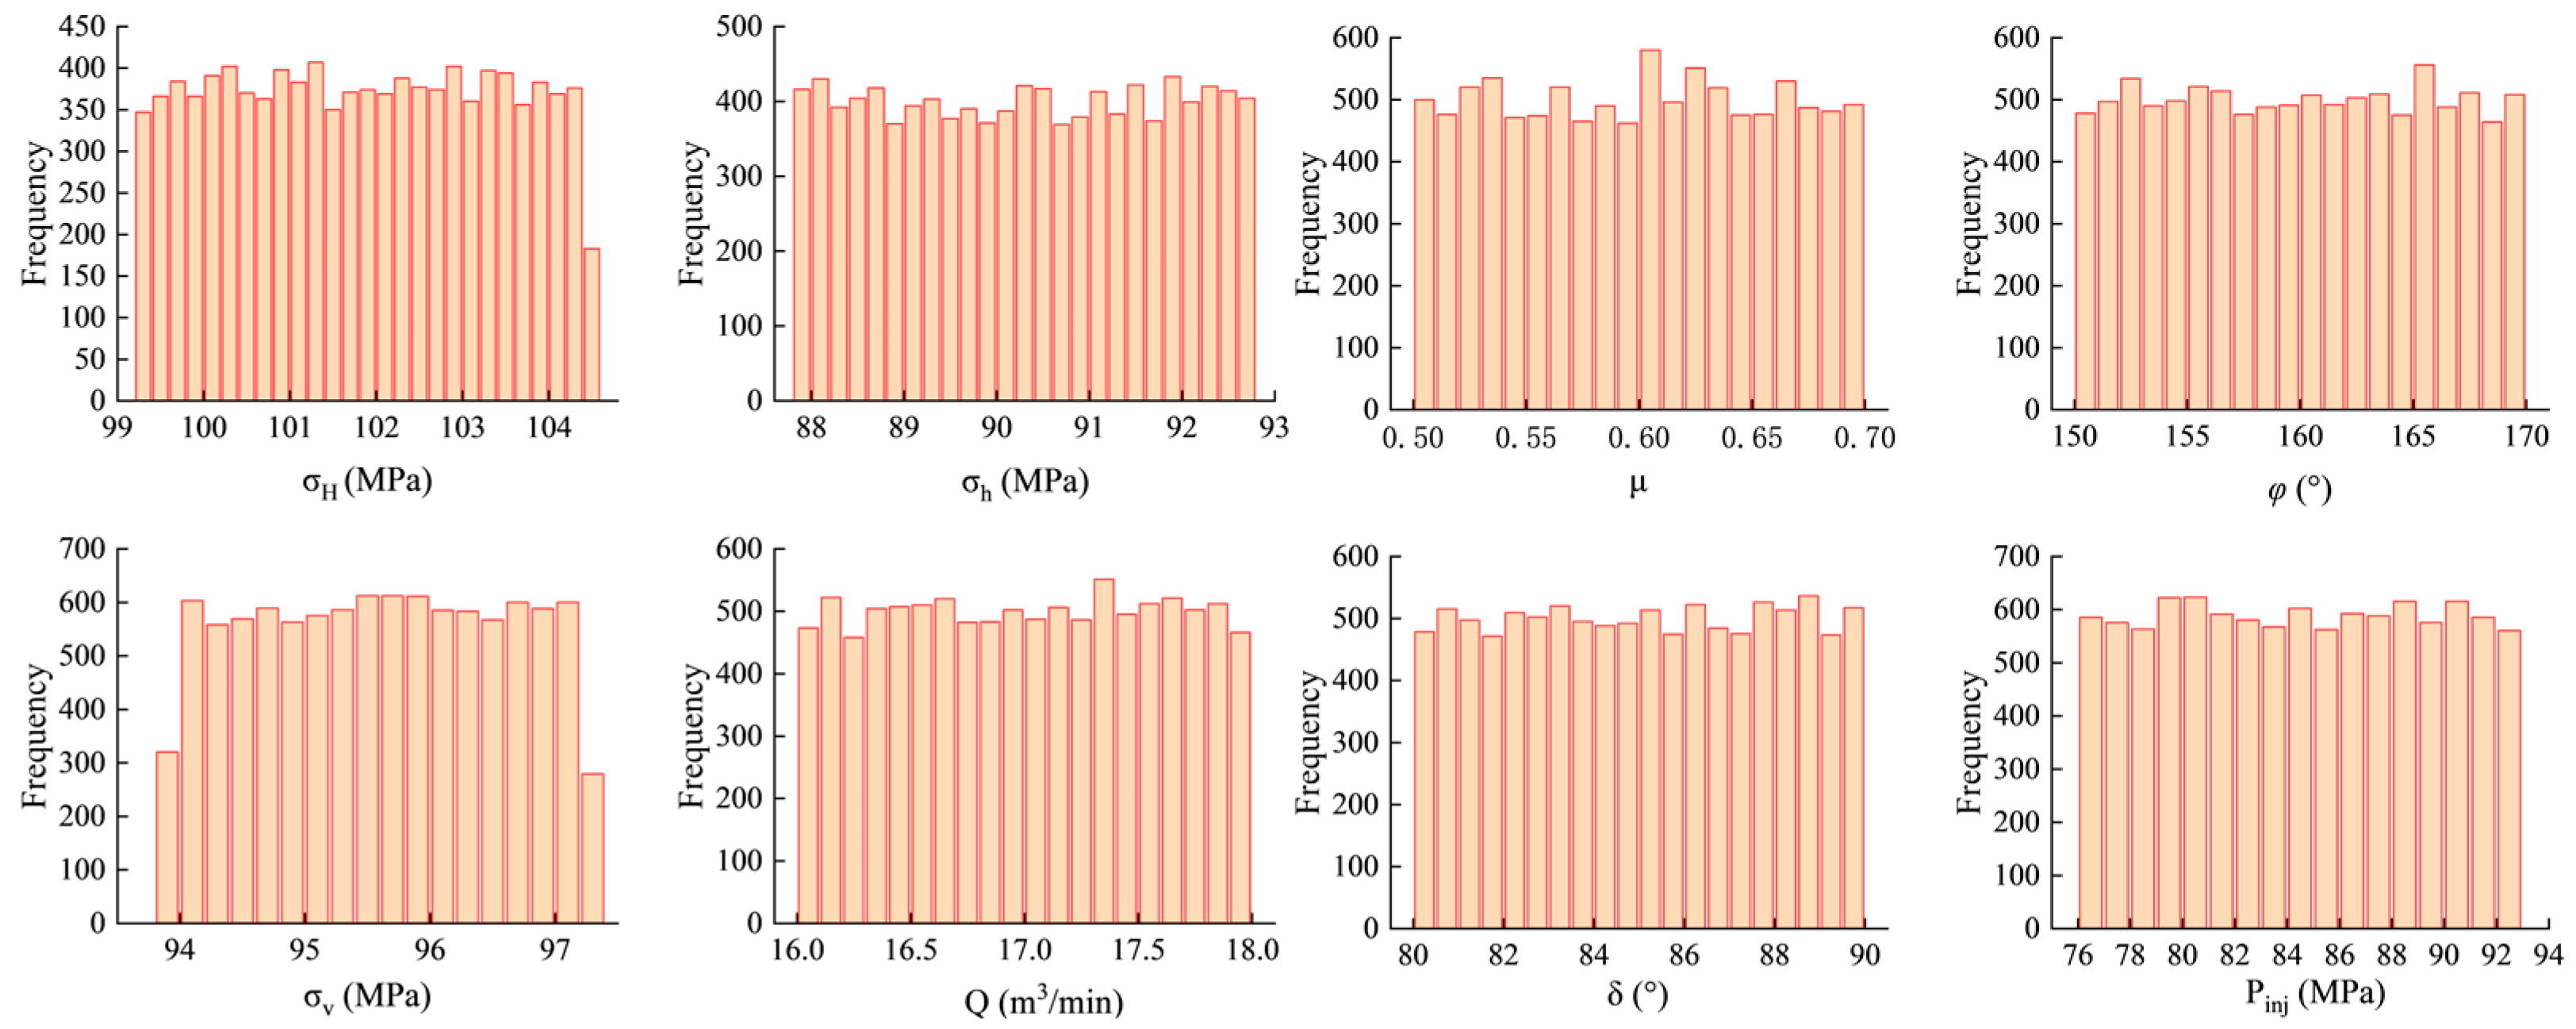
When calculating the fault slip probability using the aforementioned model, the applicability of probability distributions (e.g., normal distribution) is constrained by the difficulty of obtaining field-measured parameter means and variances. To address this, uncertain parameters (e.g., in situ stress, fault properties, operational parameters) were identified based on field data, and uniform distributions were adopted for sampling within their respective ranges, as depicted in Figure 5.
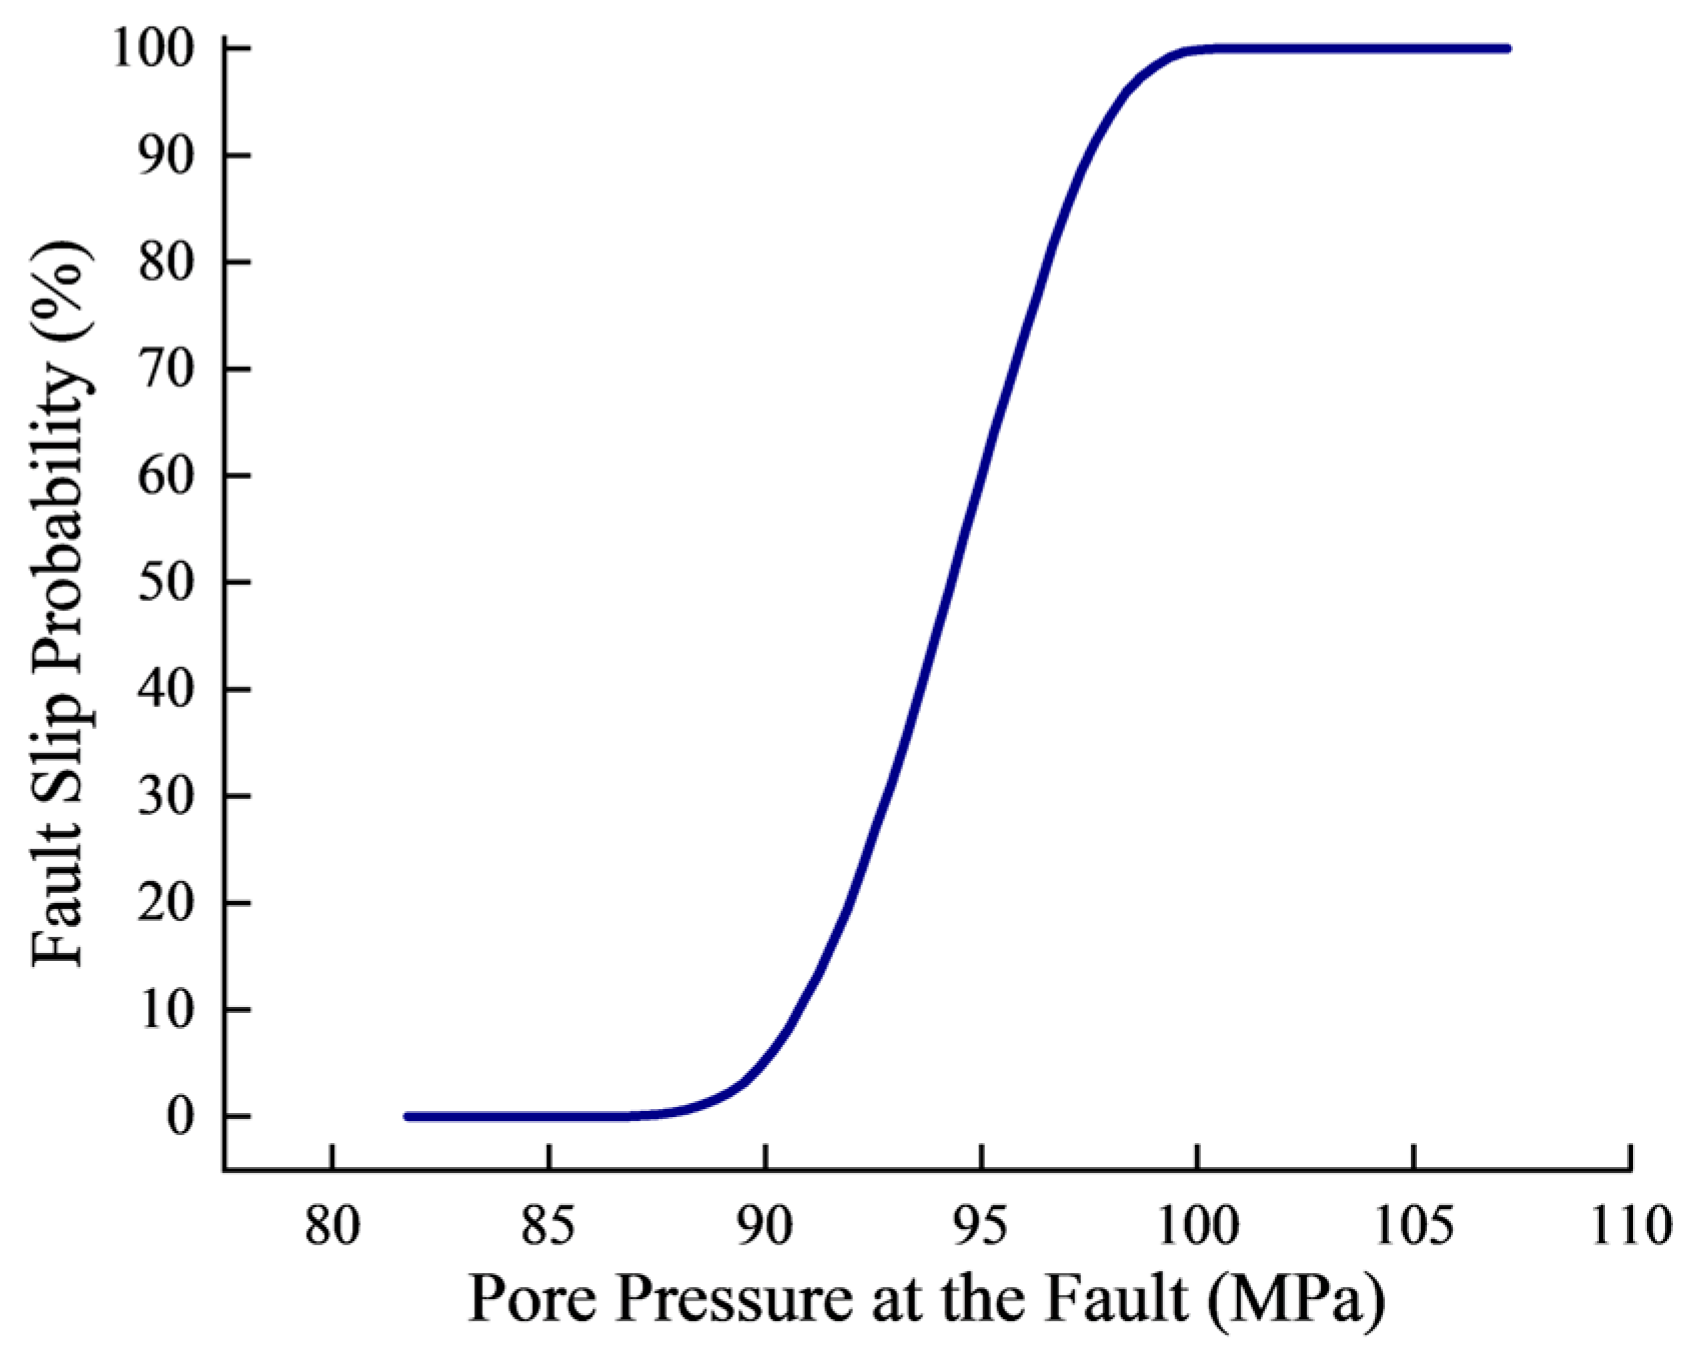
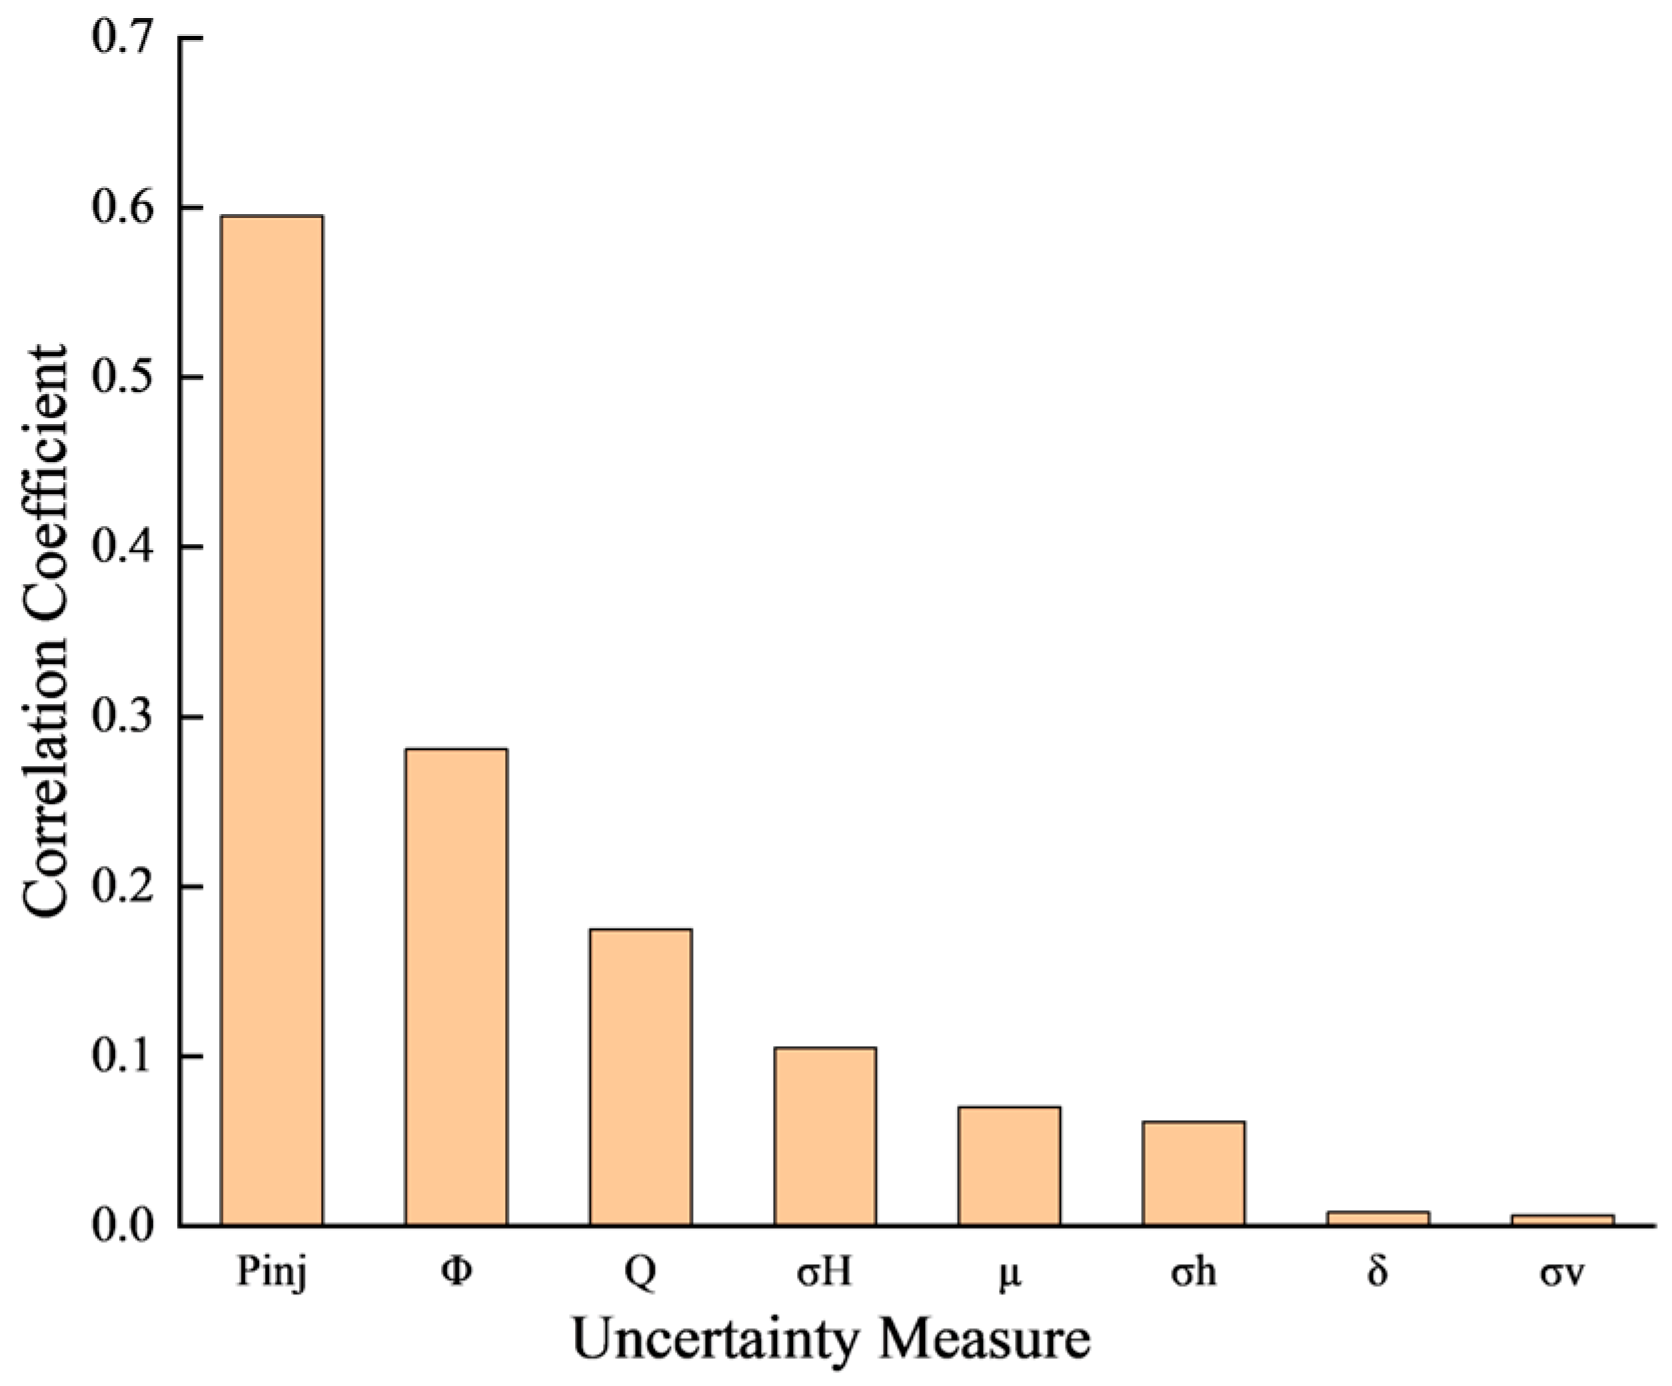
Based on the distribution of uncertain parameters, the parameters in Figure 4 were randomly selected for fault slip probability calculation. After 10,000 cumulative calculations, it was found that during the sixth stage of hydraulic fracturing, the fault slip probability reached 80.16%, indicating an extremely high probability of fault slip ai this stage. A cumulative curve of fault slip probability was formed by counting the proportion of fault slip occurrences under different pore pressures (as shown in Figure 6). It can be seen that as the pore pressure at the fault increases, the fault slip probability also gradually increases; when the pore pressure at the fault is greater than 96 MPa, the fault slip probability exceeds 80%. The Spearman rank correlation coefficient [36] was used to quantify the correlation between each parameter and the slip results, as shown in Figure 7. The results indicate that the pumping pressure, fault strike angle, pumping rate, horizontal principal stress, and fault friction coefficient have significant impacts on the fault slip probability. Among them, the correlation coefficient of pumping pressure is greater than 0.5, which is much higher than that of the other parameters. The dip angle of strike-slip faults varies slightly, and the vertical in situ stress and fault dip angle are far less influential than the above parameters.
To verify the accuracy of the model, the fault slip probabilities corresponding to 10 casing-deformed wells in this block were calculated, as shown in Table 1. Among them, the fault slip probabilities of six wells are ≥92%, and the slip probabilities of the other four wells range from 70.14% to 83.13%. These results are in good agreement with real-world data, verifying the accuracy of this model.

4. Analysis of Factors Influencing Fault Slip Probability

Drilling data indicate that the formation pressure coefficient in this block ranges from 2.1 to 2.3, reflecting that the fault is in a high pore pressure environment with a relatively high risk of slip. During fracturing operations, the pumping pressure, pumping rate, and fracturing time are key external factors affecting the fault slip probability. Model parameter analysis shows that the fault slip probability relates not only to the above operational parameters but also to geological parameters such as fault dip, strike, friction coefficient, and in situ stress. Therefore, further analysis of the factors influencing fault slip probability is required.

4.1. Engineering Factors

4.1.1. Pumping Pressure

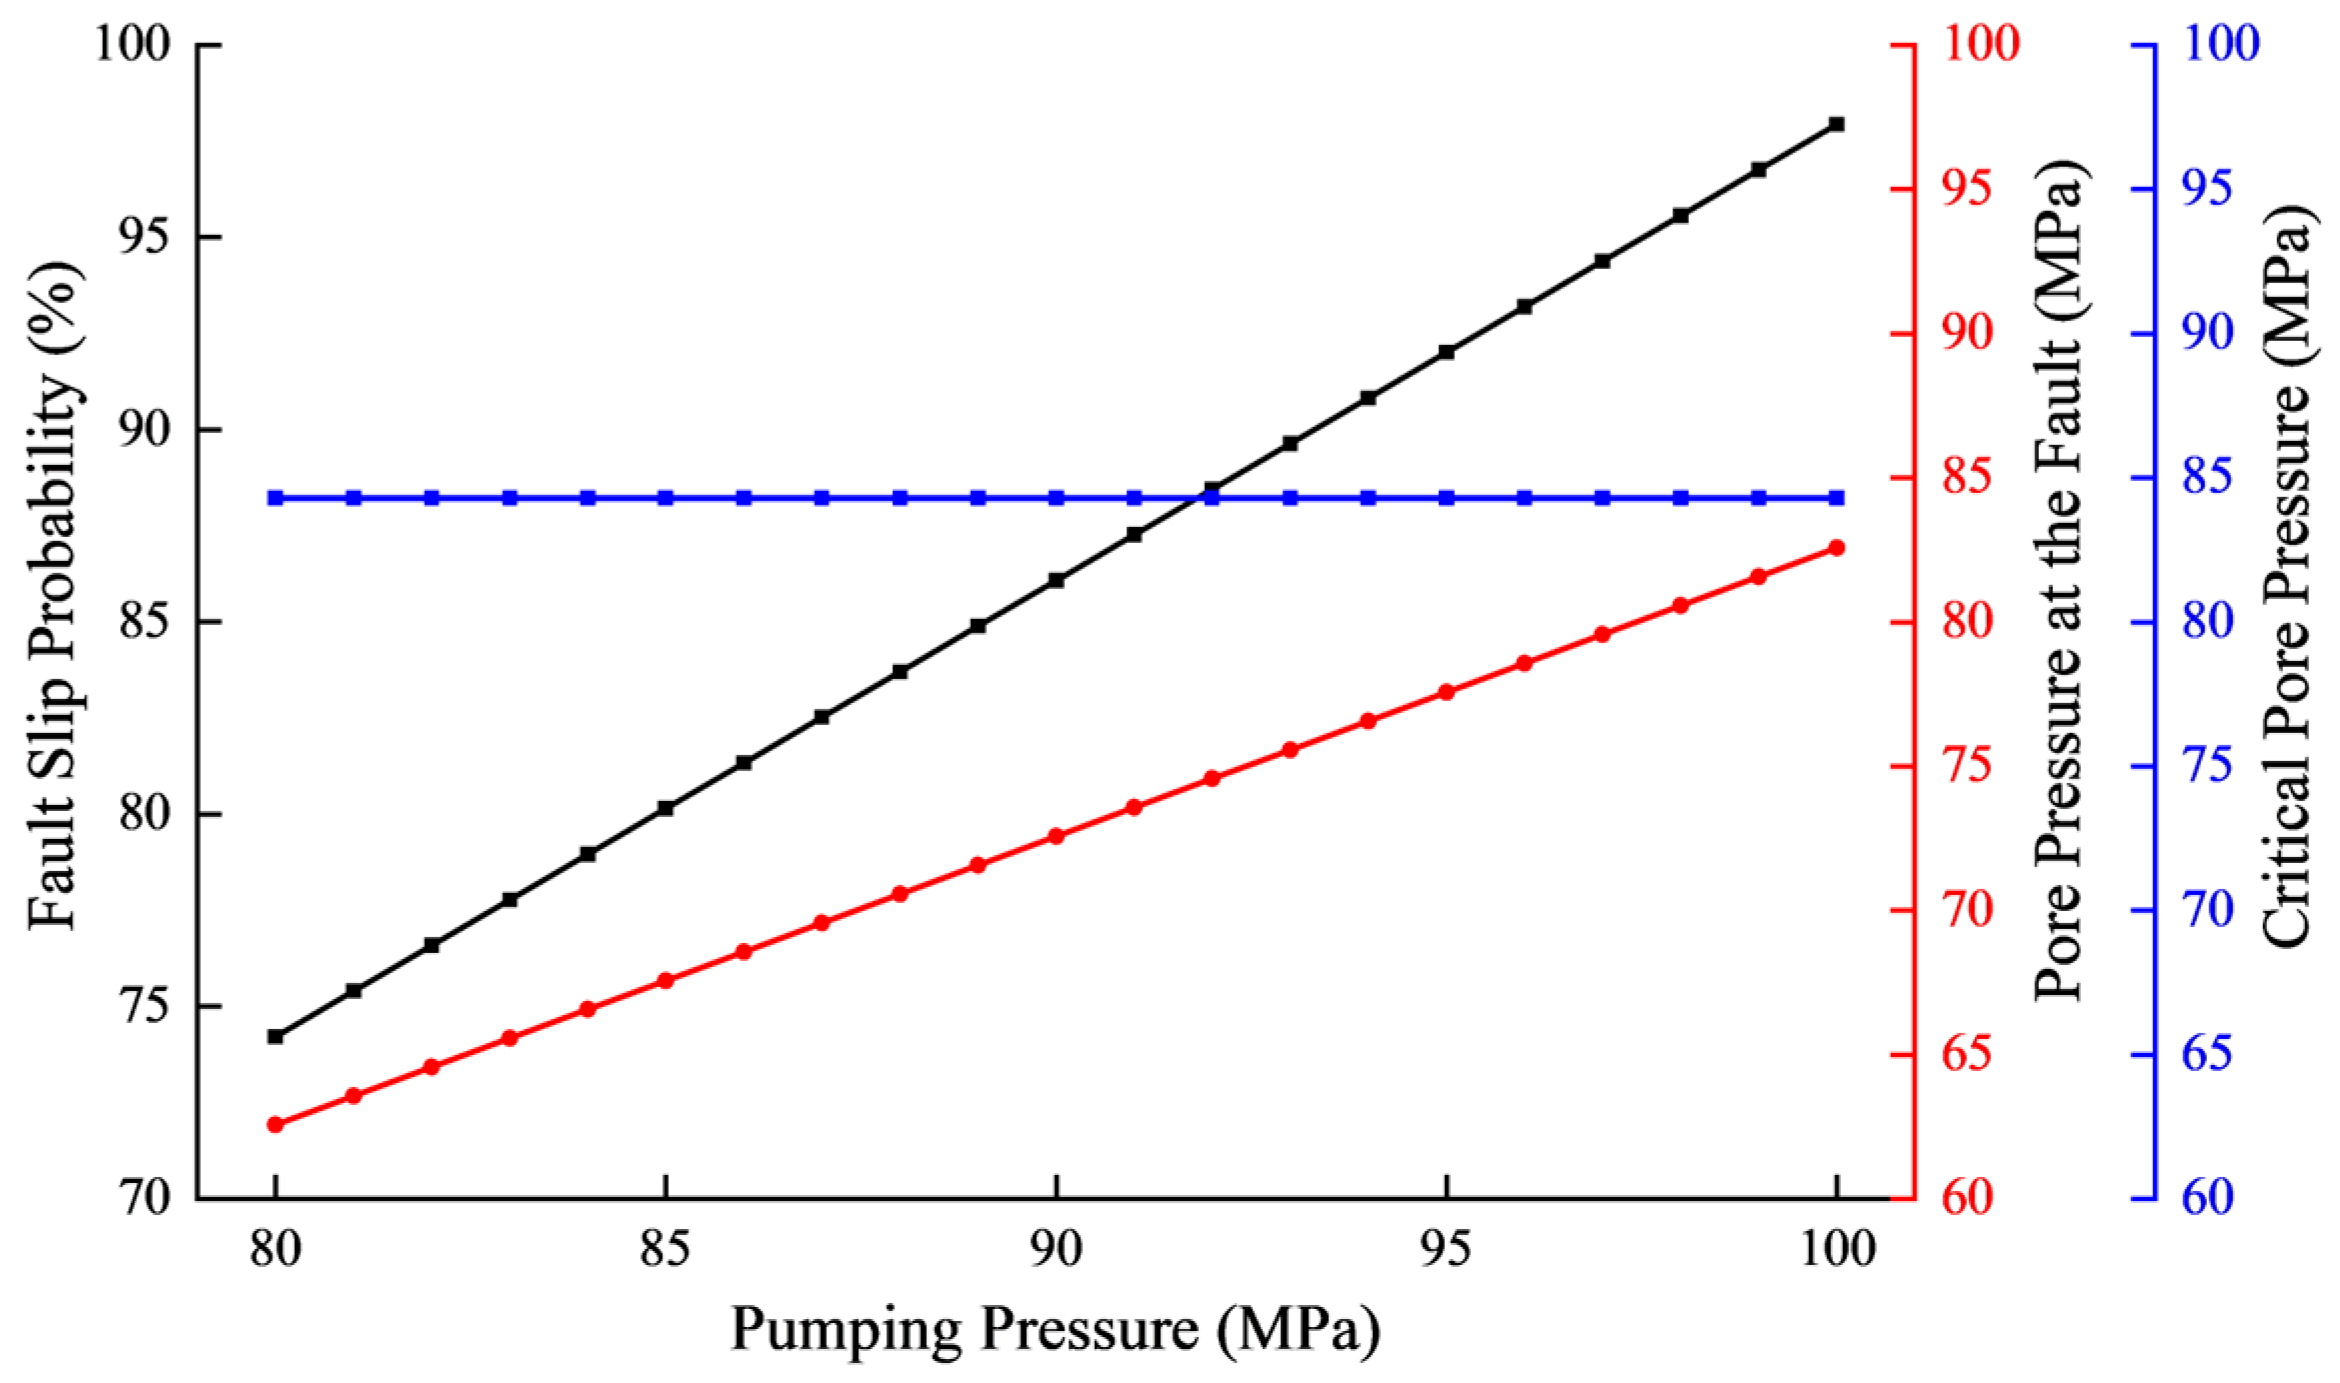
Pumping pressure is a core dynamic parameter that drives fracturing fluid into the formation and promotes fracture propagation, and its magnitude directly affects the pressure transmission efficiency in fractures and the accumulation degree of formation pore pressure. Therefore, it is necessary to analyze the changes in pore pressure, critical pore pressure, and fault slip probability under different pumping pressures, as shown in Figure 8.
As shown in Figure 8, when the pumping pressure increases from 80 MPa to 100 MPa, both the pore pressure at the fault and the slip probability show a monotonically increasing trend: the pore pressure increases from the initial 62 MPa to 82 MPa, and the slip probability rises from 74% to 98%, with an increase of 32%. Under a constant pumping rate, the fracturing friction remains basically unchanged, and the increase in pumping pressure directly leads to an increase in the net pressure within the fracture. When the fracture extends through the fault, the higher net pressure causes an increase in the pore pressure at the fault, which in turn reduces the effective normal stress on the fault plane; once the pore pressure exceeds the critical value, the fault will slip. Therefore, reasonable control of pumping pressure is an effective means to reduce the risk of fault slip.

4.1.2. Pumping Rate

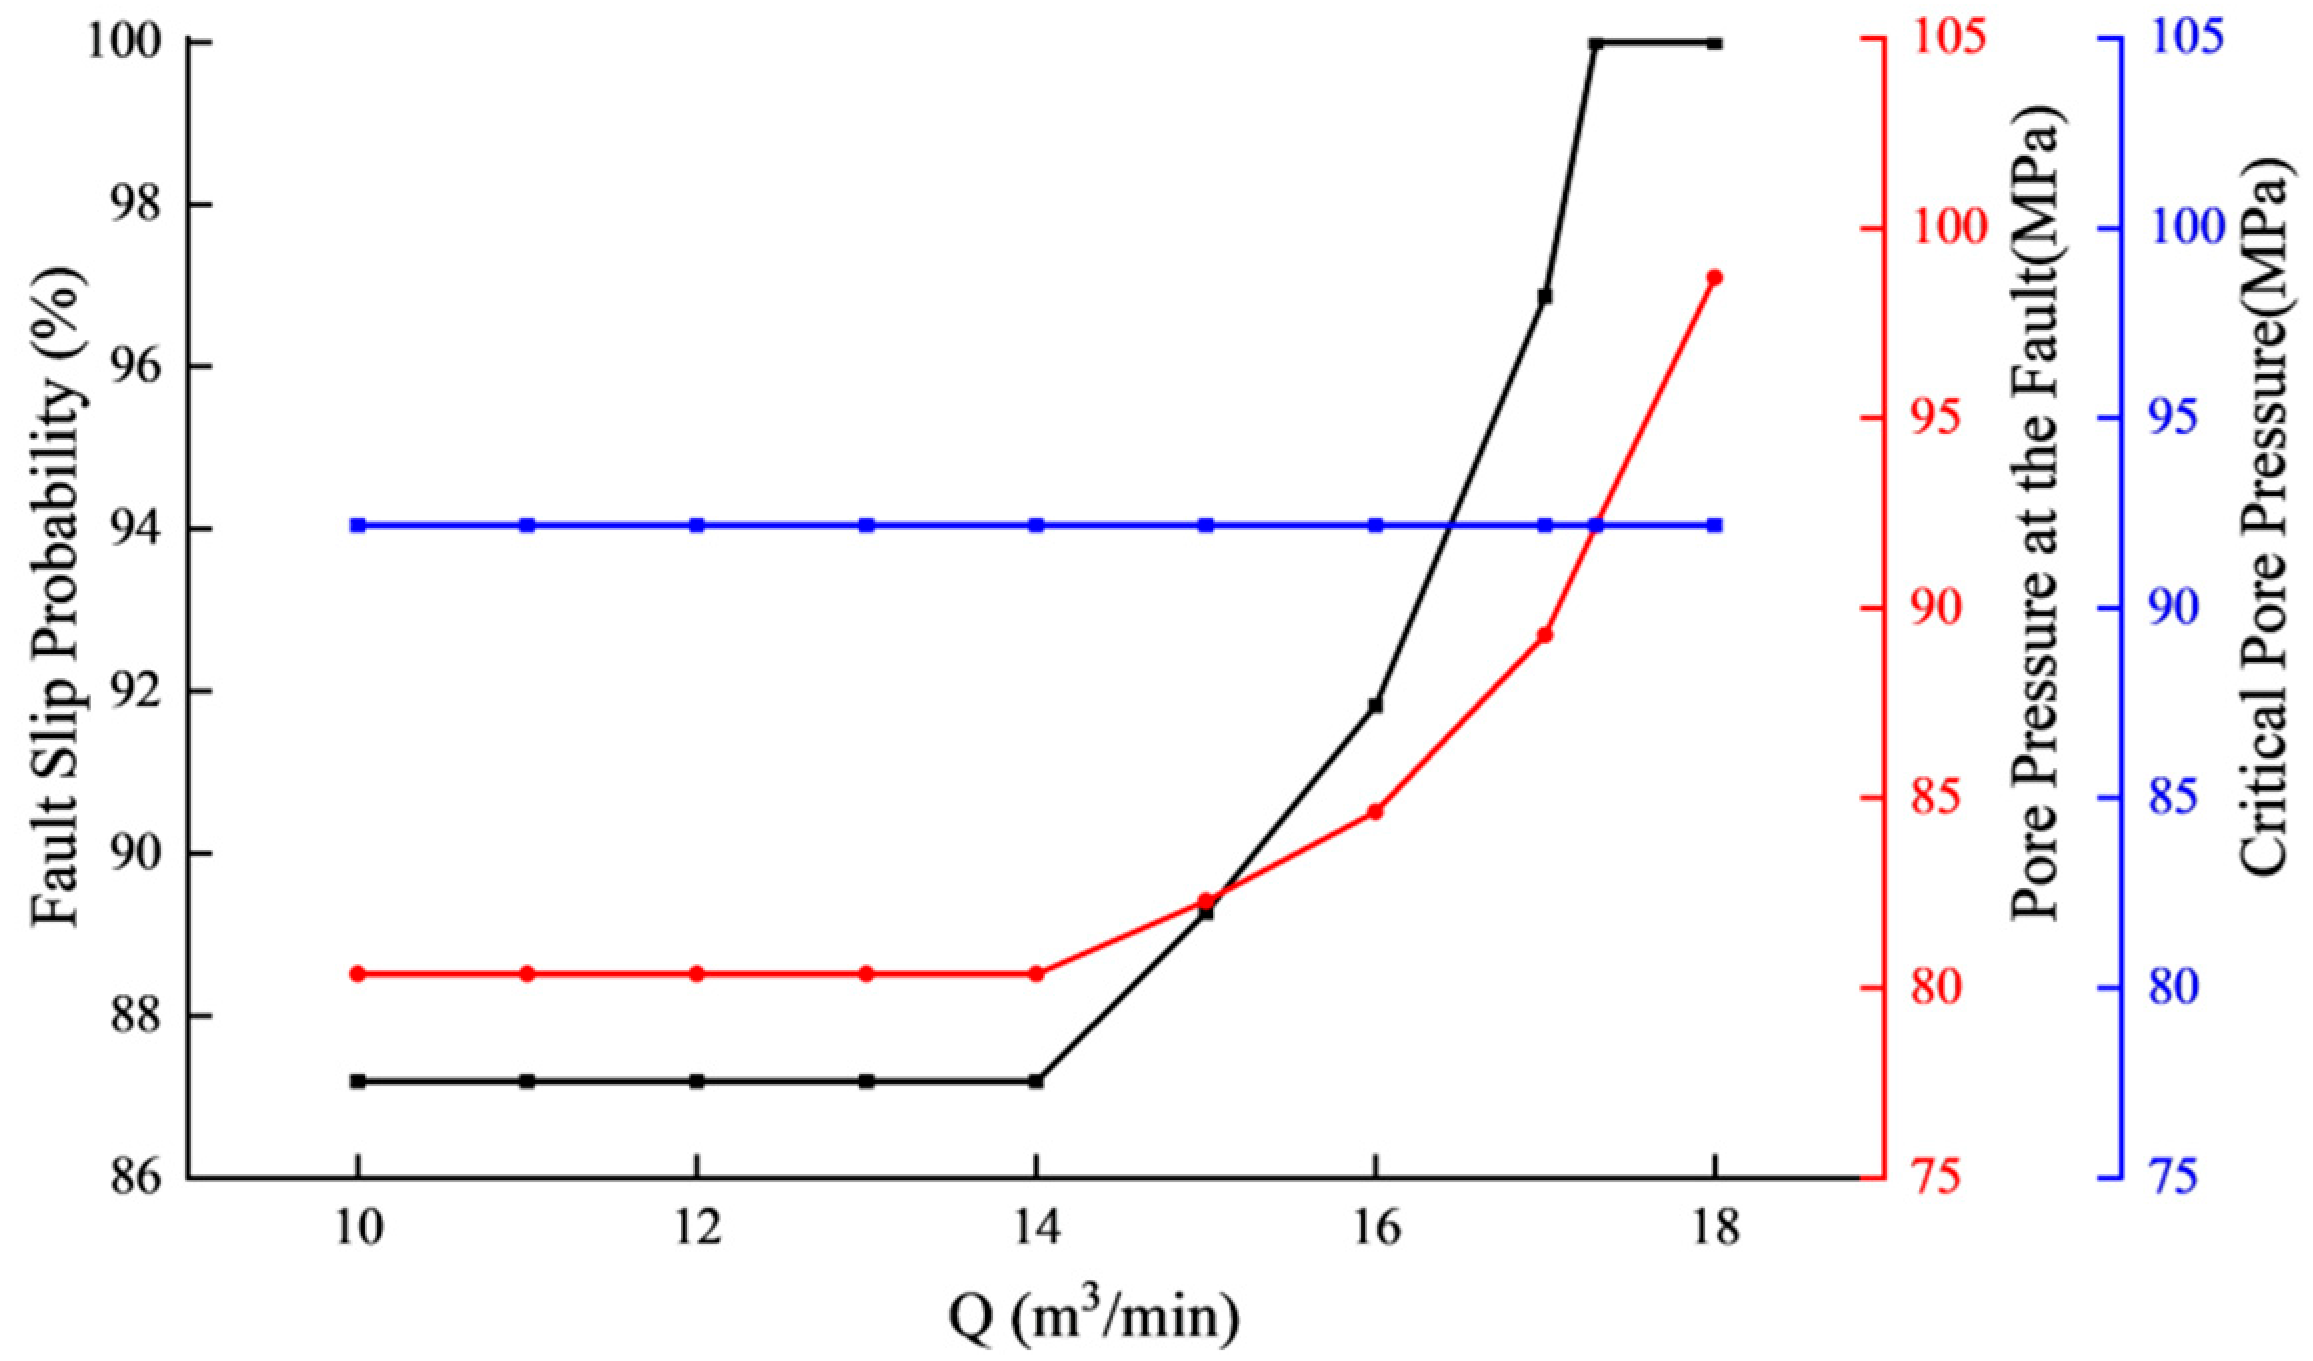
To investigate the impact of pumping rate on fault stability, we varied the pumping rate from 10 to 18 m3/min while keeping the other parameters constant. The resulting variations in pore pressure, critical pore pressure, and fault slip probability are presented in Figure 9.
As shown in Figure 9, when the pumping rate increases from 10 m3/min to 17.3 m3/min, both the pore pressure at the fault and slip probability exhibit an initial stabilization followed by an increasing trend. The pore pressure rises from 80 MPa to 98 MPa, while the corresponding slip probability increases from 87% to 100%. At low pumping rates, limited fracture propagation results in a significant distance between the fault and fracture tip, hindering pressure transfer to the fault zone. Consequently, the pore pressure and slip probability remain stable. At higher pumping rates, extended fracture propagation facilitates pressure accumulation near the fault, leading to elevated pore pressure and increased slip probability. These findings demonstrate that pumping rate control is a critical factor influencing fault slip risk.

4.1.3. Stage Duration

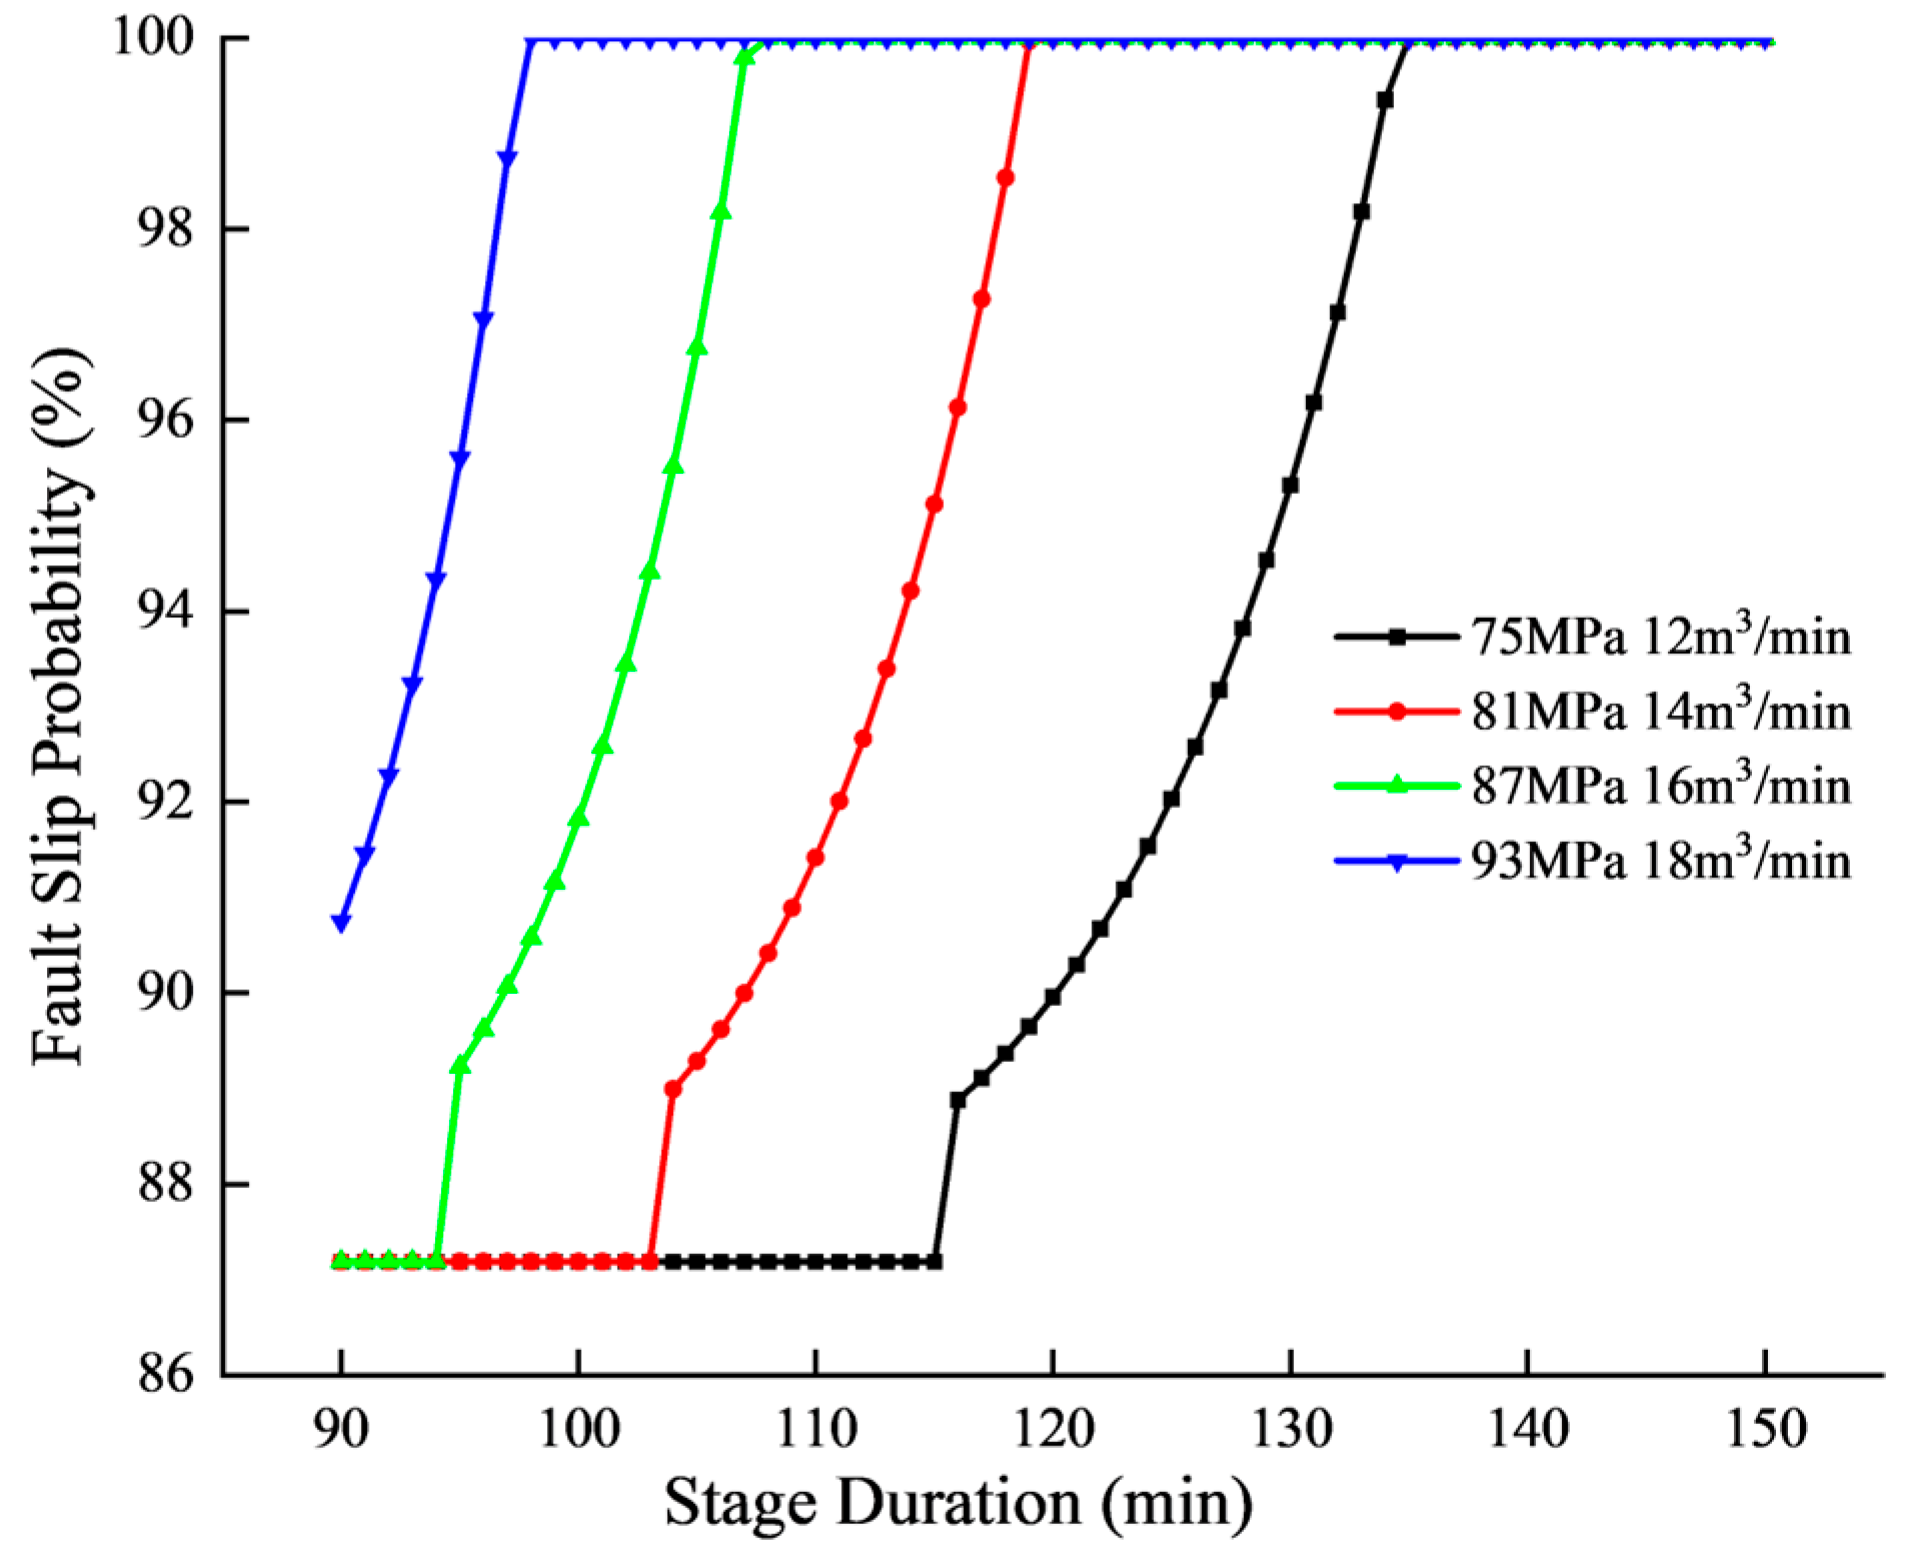
In practical operations, wellhead pressure and pumping rate are interdependent variables: adjustments in pumping rate directly affect pressure fluctuations, while pressure variations conversely impact rate stability. Therefore, we analyzed fault slip probability under four common pressure-rate combinations used in field operations, as illustrated in Figure 10.
Figure 10 reveals a triphasic evolution of fault slip probability during fracturing: initial stabilization, progressive growth, and eventual complete slip. During initial fracturing, the fault’s remote location from the wellbore limits fracture propagation to the fault zone. Pore pressure diffusion remains within subcritical radii, maintaining baseline slip probability. When fractures propagate to the fault, pore pressure accumulation elevates slip probability from 87% to 99%. Upon reaching critical pore pressure, sustained fracturing triggers irreversible 100% slip. Fracturing intensity governs response kinetics: higher intensities accelerate pressure diffusion to the fault, amplifying slip probability growth. At 75 MPa/12 m3/min, a time of 130 min is required to reach 100% slip probability. Conversely, at 93 MPa/18 m3/min, the threshold is achieved in 98 min—a 25% reduction in time-to-failure. This demonstrates that elevated fracturing intensity accelerates fault activation.

4.2. Geological Factors

4.2.1. Fault Dip and Strike

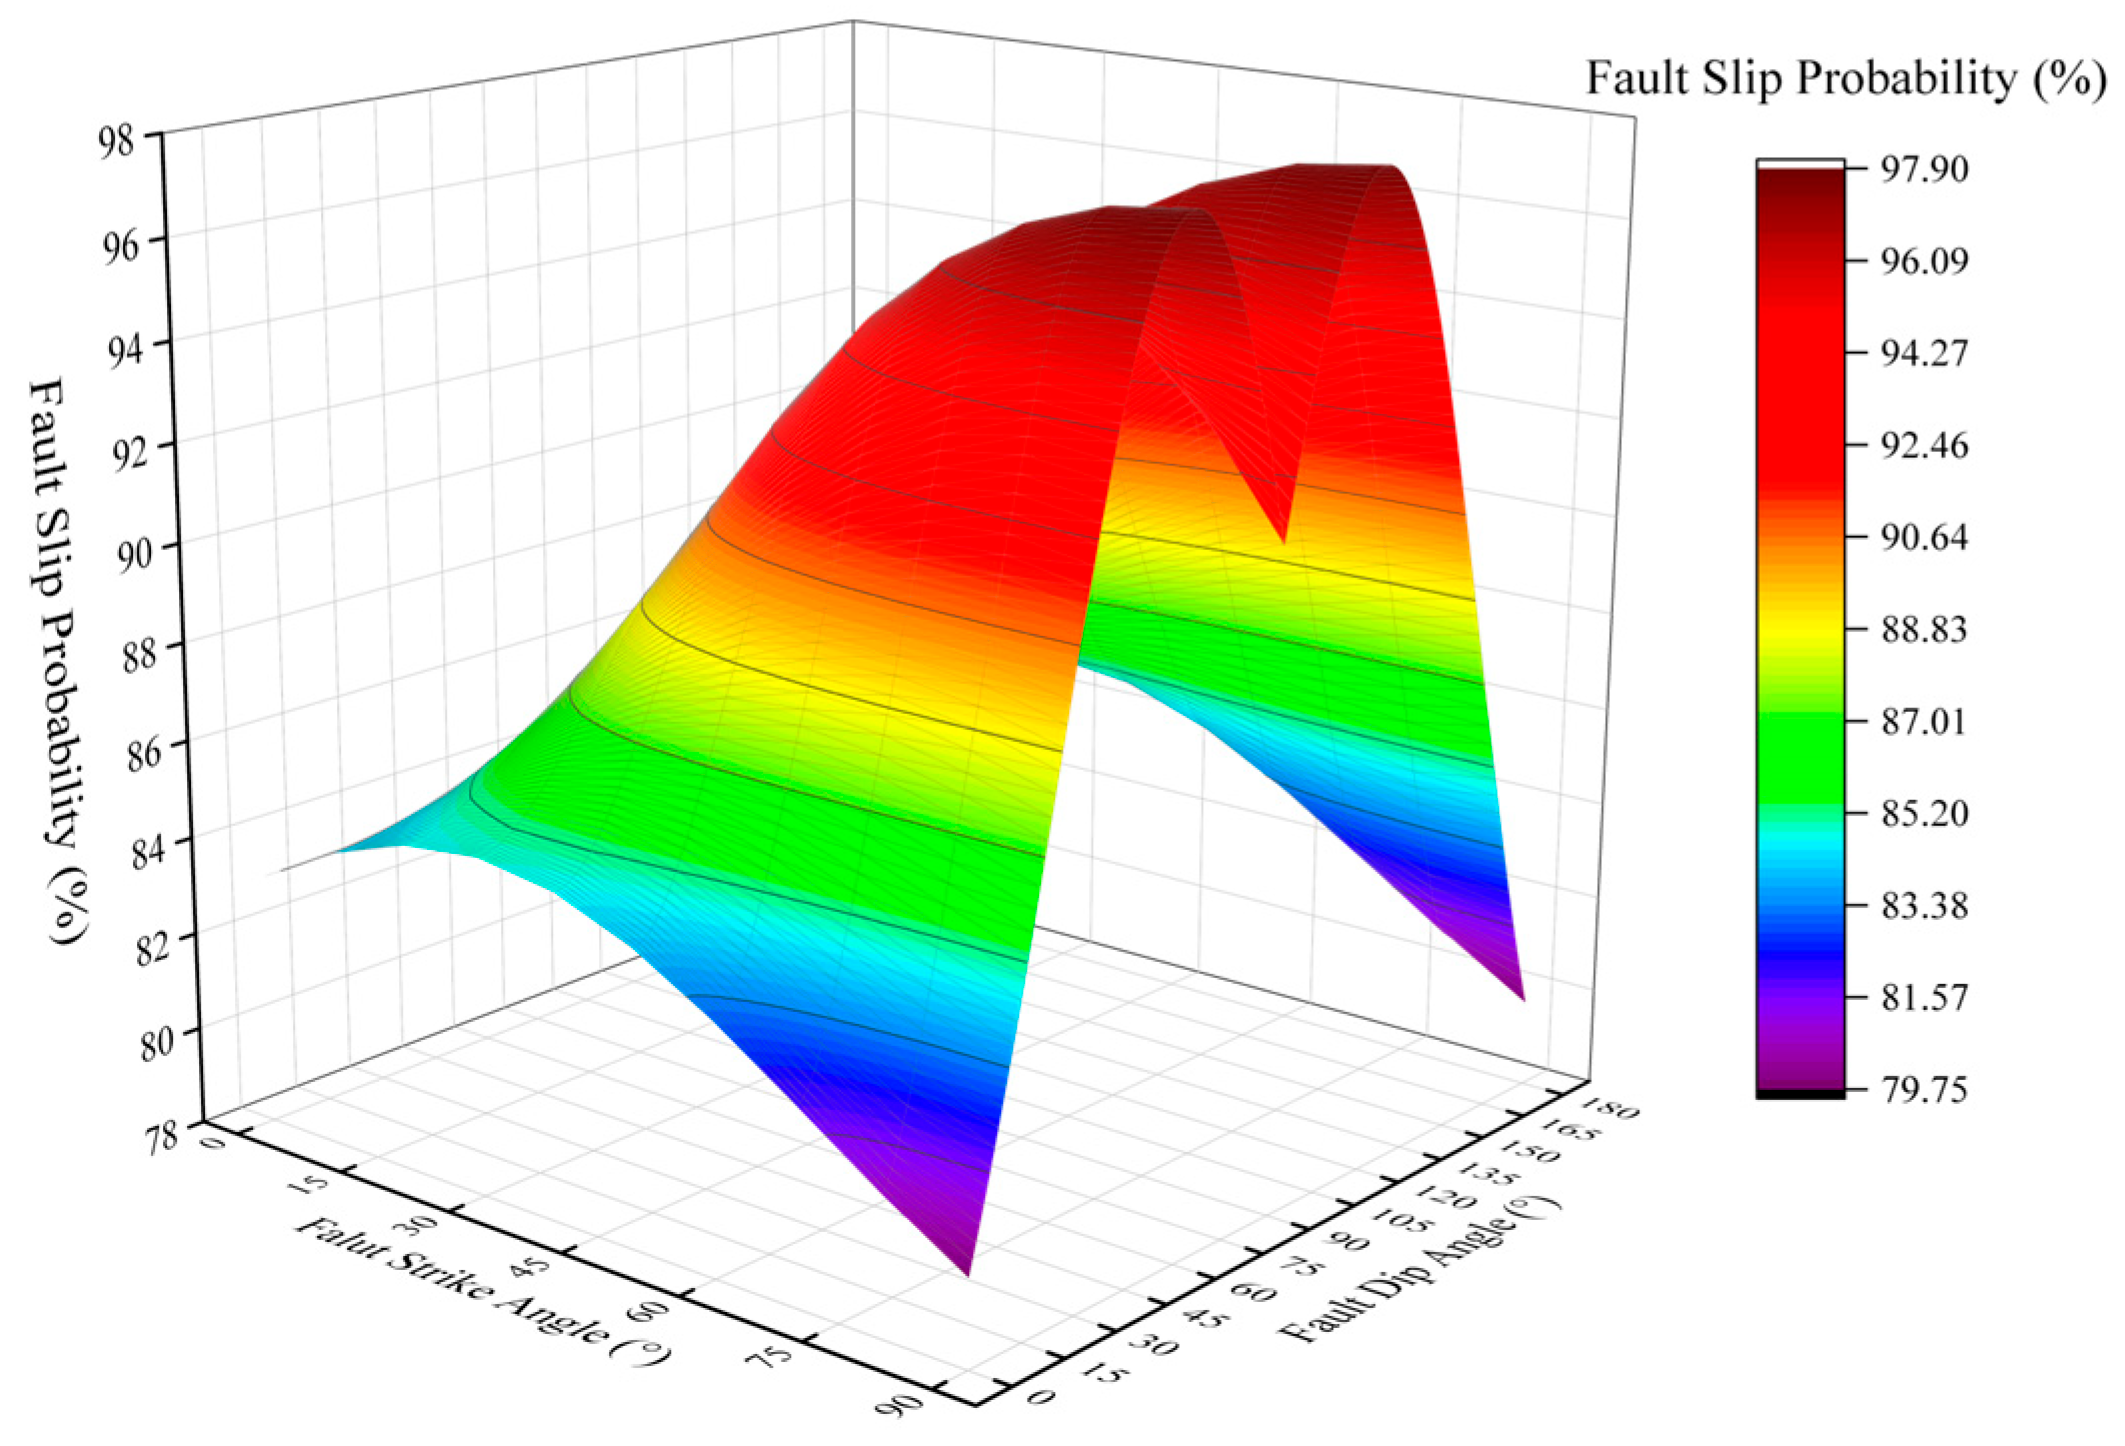
Fault dip and strike directly govern stress distribution and slip resistance on fault planes, significantly influencing slip risk. To clarify their effects on slip probability, Figure 11 illustrates variations under different dip-strike combinations.
Figure 11 demonstrates that at low dip angles (<30°), slip probability exhibits minimal variation with strike changes. The maximum probability (0.92) occurs at 90° strike (parallel to the maximum horizontal stress), primarily because gentle dips allow for direct shear action by horizontal stresses. At high dip angles (>60°), a bimodal distribution emerges, with risk peaks at 60° and 120° strikes and a minimum at 90°. This pattern arises from triaxial coupling between horizontal principal stresses and shear-enhanced vertical stresses at steep dips, intensifying stress concentrations. Moreover, dip-strike interactions exhibit a positive correlation: shallow dips diminish strike effects while steep dips amplify them, indicating that strike direction critically governs slip risk in strike-slip faults.

4.2.2. Fault Friction Coefficient

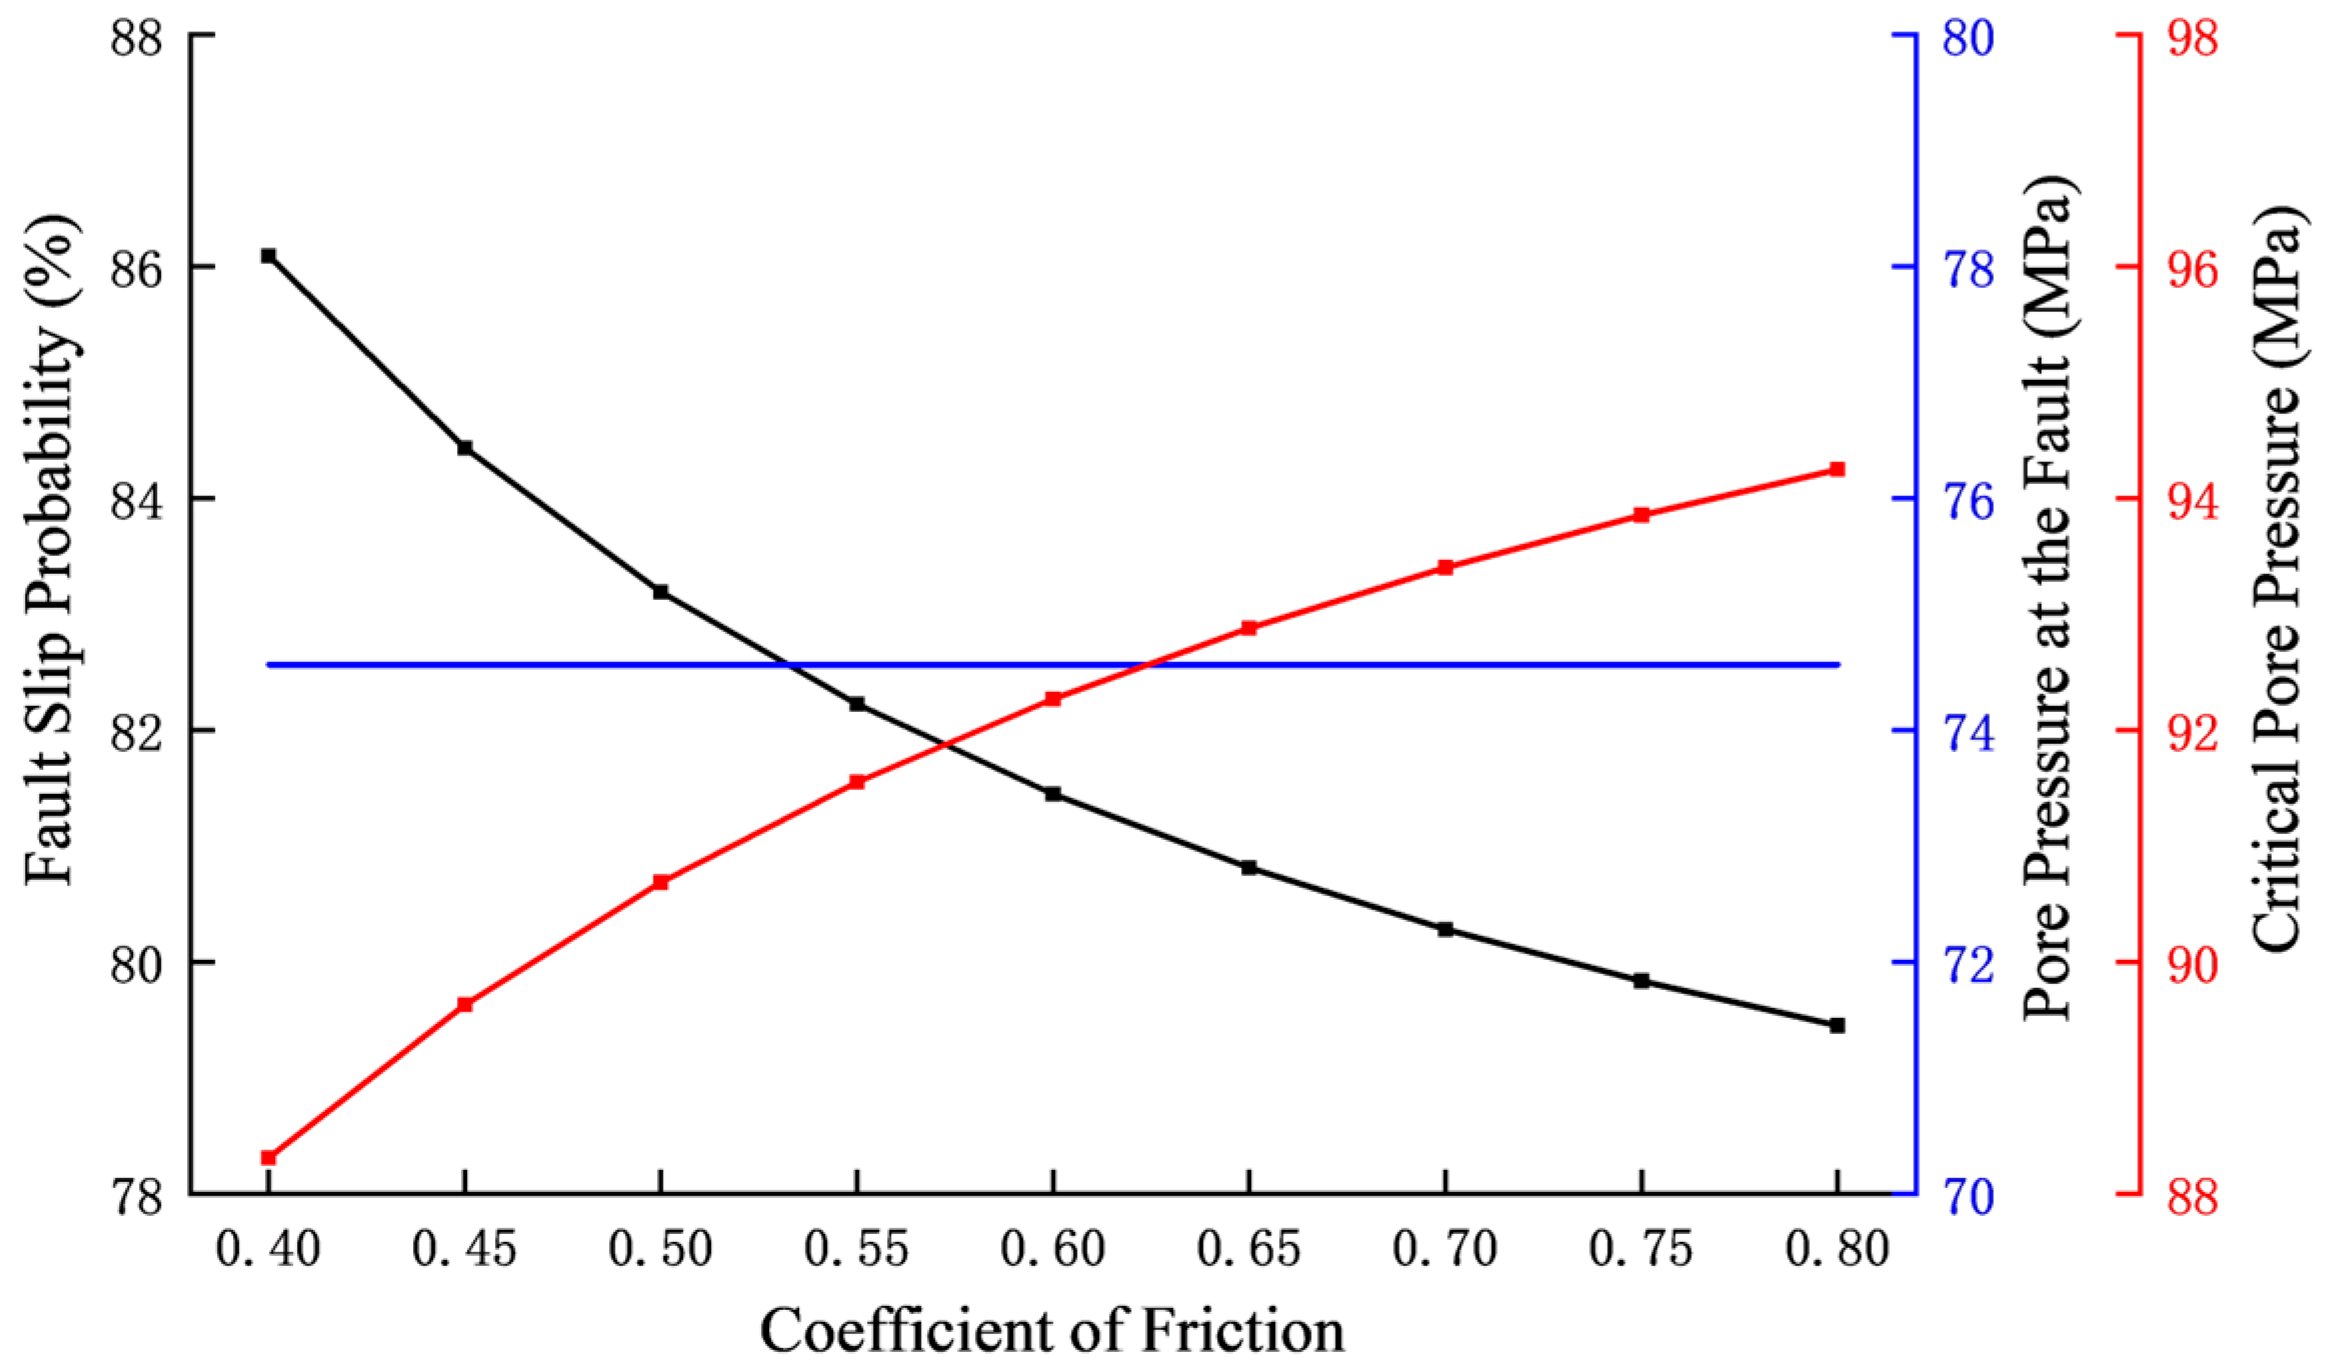
The friction coefficient governs shear resistance along fault planes, directly determining slip susceptibility and defining critical thresholds for pore pressure-induced slip. Figure 12 presents slip probability, pore pressure, and critical pore pressure variations with friction coefficients.
As the friction coefficient increases from 0.40 to 0.80 (Figure 12), the slip probability decreases substantially from 86.2% to 79.8%. Although the fault-zone pore pressure remains constant, the critical pore pressure rises from 89 MPa to 95 MPa with an increasing friction coefficient—the primary driver of reduced slip probability. These results confirm that low friction coefficients promote slip vulnerability, while higher values enhance fault stability.

4.2.3. Horizontal Stress Anisotropy

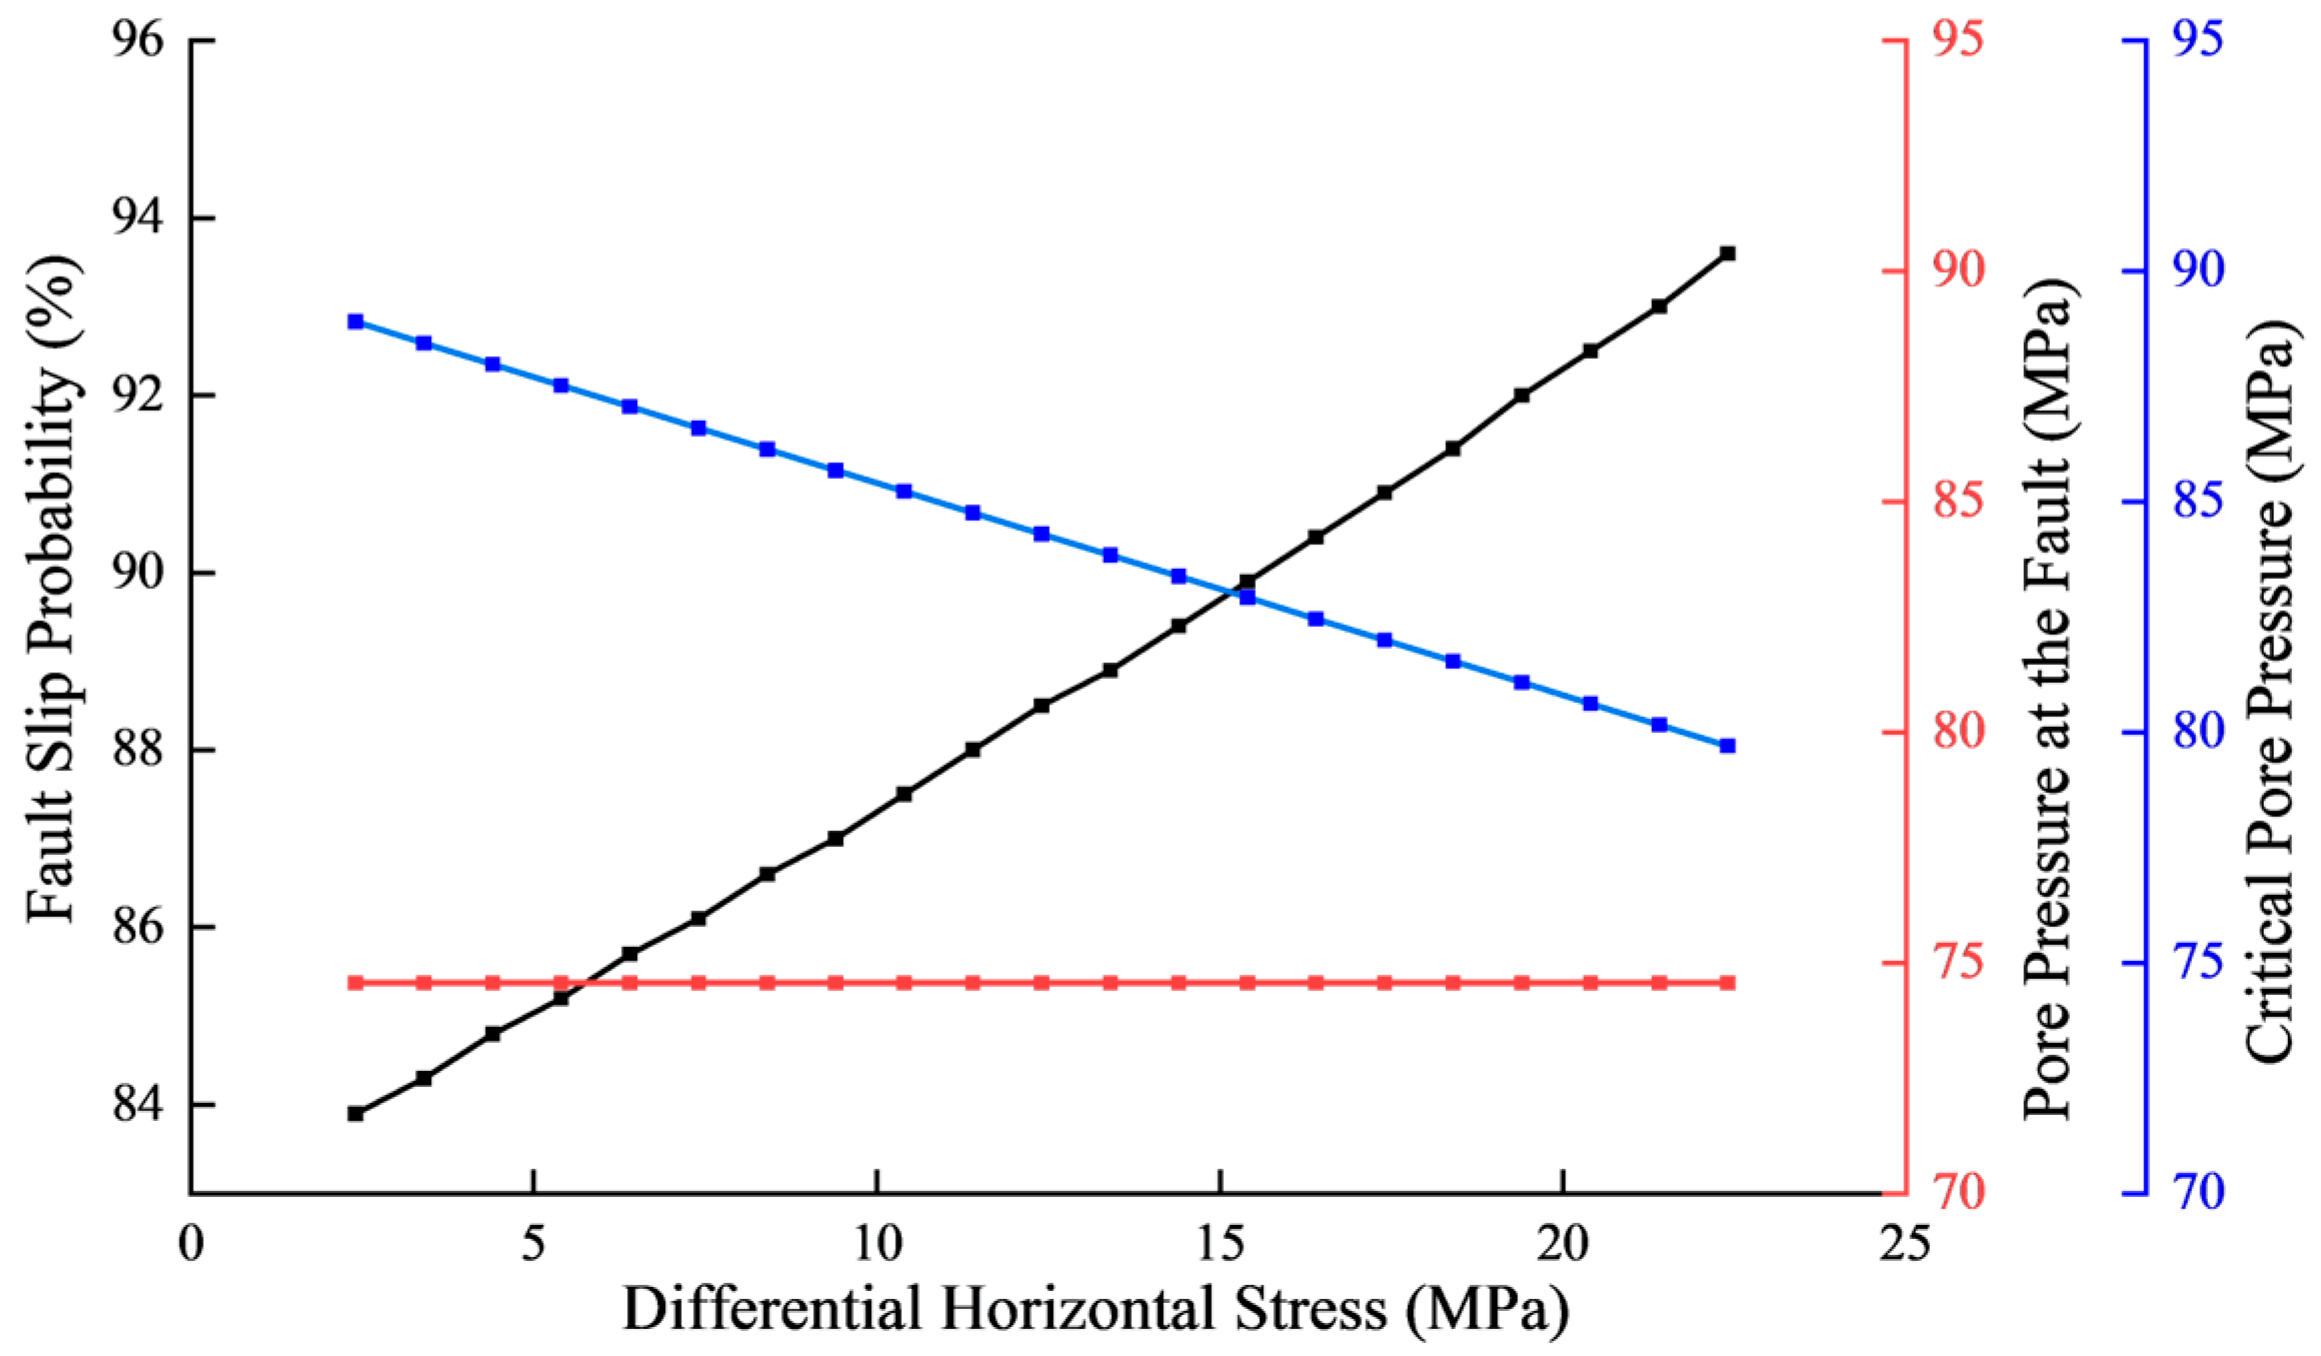
Horizontal stress anisotropy ( Δ σ = σ H σ h ) quantifies directional stress imbalances in subsurface formations. For strike-slip faults, slip initiation is primarily driven by shear stress (τ), which scales directly with Δ σ . Thus, we analyzed pore pressure, critical pore pressure, and slip probability under varying stress anisotropies (Figure 13).
An increase in horizontal stress anisotropy from 0 to 25 MPa reduces the critical pore pressure from 89 MPa to 80 MPa while elevating fault slip probability, as shown in Figure 13. The underlying mechanism relates to shear stress magnitude in strike-slip faults being directly controlled by stress anisotropy. A greater horizontal stress differential intensifies shear loading, thereby increasing slip susceptibility under the given pore pressure conditions.

5. Conclusions

(1)
This study establishes a fault slip probability model based on porosity-coupled pressure evolution, which is quantitatively validated using operational parameters from 10 casing deformation wells in the Luzhou Block. Six wells exhibited slip probabilities exceeding 92%, confirming model reliability for risk quantification. The key findings are outlined below.
(2)
Engineering parameters significantly influence slip risks. Wellhead pressures tween 80 and 100 MPa increase slip probability by 32%, while elevated pumping rates substantially accelerate slip potential. High-pressure/high-rate combinations and extended stage durations exhibit positive correlations with slip hazards.
(3)
Geological factors demonstrate critical control: higher friction coefficients reduce slip vulnerability. Low-dip faults exhibit maximum risk when strikes align with the maximum horizontal stress, whereas high-dip faults show a bimodal risk distribution at 60–120° strikes with amplified strike-direction sensitivity. Horizontal stress anisotropy directly correlates with slip probability elevation.
(4)
Optimizing fracturing parameters, controlling operational duration, and avoiding high-risk fault orientations can effectively mitigate slip risks. These insights inform technical strategies for controlling casing deformation during multistage hydraulic fracturing processes in shale gas reservoirs.

Author Contributions

K.W. implemented the probability model algorithms, conducted formal analysis of engineering factors, and created visualizations. W.L. conceptualized the technical framework, coordinated supervision and validation activities, and secured funding. J.L. performed geological factors analysis and contributed to manuscript review and editing. Y.W. curated validation case data and provided critical resources. All authors have read and agreed to the published version of the manuscript.

Funding

This research was funded by the Key R&D Program of Xinjiang Uygur Autonomous Region (Grant No. 2024B01012, 2024B01012-2) and the National Natural Science Foundation of China (NSFC) (Grant No. 52204018).

Institutional Review Board Statement

Not applicable.

Informed Consent Statement

Not applicable.

Data Availability Statement

Data are available upon request due to restrictions (e.g., privacy, legal or ethical reasons).

Conflicts of Interest

Author Yanxian Wu is employed by the Oil Extraction Technology Research Institute of Xinjiang Oilfield Company. The remaining authors declare that the research was conducted in the absence of any commercial or financial relationships that could be construed as a potential conflict of interest.

References

  1. Chen, G.; Shi, X.; Liu, Y.; Wu, W.; Yang, Y.; Zhu, Y.; Chen, L.; Xu, L.; Zhong, K.; Yin, Y. New Insights into Enrichment Controlling Factors of Deep Shale Gas in Wufeng-Longmaxi Formations, Southern Sichuan Basin. Nat. Gas Ind. 2024, 44, 58–71. [Google Scholar]
  2. Wang, H.; Zhou, S.; Zhao, Q.; Shi, Z.; Liu, D.; Jiao, P. Enrichment Characteristics, Exploration and Development Progress of Deep Shale Gas in Southern Sichuan Basin, China. Oil Gas Geol. 2023, 44, 1430–1441. [Google Scholar]
  3. Guo, T.; Xiong, L.; Lei, W.; Zhao, Y.; Pang, Q. Progress, Challenges and Countermeasures in Deep Shale Gas Exploration and Development in Weirong and Yongchuan Areas, Southern Sichuan Basin. Nat. Gas Ind. 2022, 42, 45–59. [Google Scholar]
  4. Deng, N.; Xu, H.; Deng, H.; He, J.; Liu, S.; Li, K.; Zheng, Z.; Sheng, L.; Song, W. Fault System Impacts on Present-Day In-Situ Stress Disturbances: Case Study of Deep Shale Gas in Northern Luzhou Block, Sichuan Basin. Geol. China 2025, 52, 95–110. [Google Scholar]
  5. Zheng, S.; Xie, X.; Luo, L.; Jing, Y.; Tang, M.; Yang, R.; Zhong, G.; Wang, J.; Chen, Z. Optimized Drilling Technology for Deep Shale Gas Horizontal Wells in Sichuan Basin: A Case Study of Well Lu 203. Nat. Gas Ind. 2019, 39, 88–93. [Google Scholar]
  6. Han, L.; Li, X.; Liu, Z.; Duan, G.; Wan, Y.; Guo, X.; Guo, W.; Cui, Y. Controlling Factors and Prevention Strategies for Casing Deformation in Deep Shale Gas Wells, Luzhou Area, Southern Sichuan Basin. Petrol. Explor. Dev. 2023, 50, 853–861. [Google Scholar] [CrossRef]
  7. Yan, J.; Lai, S.; Guo, W.; Shi, X.; Liao, M.; Tang, H.; Hu, Q.; Huang, Y. Research Progress on Geomechanical Casing Deformation Types and Influencing Factors in Shale Gas Wells. Lithol. Reserv. 2024, 36, 1–14. [Google Scholar]
  8. Meng, H.; Shen, Y.; Zhu, W.; Li, X.; Lei, D.; Ge, H. External Load Analysis of Casing During Hydraulic Fracturing in Zhaotong Shale Gas Hor-izontal Wells, Sichuan Basin. Spec. Oil Gas Reserv. 2023, 30, 166–174. [Google Scholar]
  9. Yin, A.; Li, J.; Lian, W.; Zhang, H. Research Advances in Casing Deformation Mechanisms and Control Methods for Shale Gas Hor-izontal Wells. Xinjiang Oil Gas 2025, 21, 50–60. [Google Scholar]
  10. Yong, R.; Wu, J.; Zeng, B.; Huang, H.; Cui, S.; Gou, Q.; Xu, E.; Zhao, S. Geological-Engineering Integration Technology for Casing Deformation Prevention in Luzhou Shale Gas Block. Drill. Prod. Technol. 2024, 47, 83–92. [Google Scholar]
  11. Kroll, K.A.; Cochran, E.S.; Murray, K.E. Poroelastic Properties of the Arbuckle Group in Oklahoma Derived from Well Fluid Level Response to the 3 September 2016 Mw 5.8 Pawnee and 7 November 2016 Mw 5.0 Cushing Earthquakes. Seismol. Res. Lett. 2017, 88, 963–970. [Google Scholar] [CrossRef]
  12. Skoumal, R.J.; Barbour, A.J.; Brudzinski, M.R.; Langenkamp, T.; Kaven, J.O. Induced Seismicity in the Delaware Basin, Texas. J. Geophys. Res. Solid Earth 2020, 125, e2019JB018558. [Google Scholar] [CrossRef]
  13. Kneafsey, T.; Dobson, P.; Blankenship, D.; Schwering, P.; White, M.; Morris, J.P.; Huang, L.; Johnson, T.; Burghardt, J.; Mattson, E.; et al. The EGS Collab Project: Outcomes and Lessons Learned from Hydraulic Fracture Stimulations in Crystalline Rock at 1.25 and 1.5 km Depth. Geothermics 2025, 126, 103178. [Google Scholar] [CrossRef]
  14. Chen, C.; Xiang, D.; Zhang, F.; Meng, A.; Yin, Z.; Jiang, Z. Fault Slip and Casing Deformation Mechanisms Induced by Hydraulic Fracturing in Changning-Weiyuan Blocks, Sichuan Basin: Prevention Strategies. Petrol. Sci. Bull. 2019, 4, 364–377. [Google Scholar]
  15. Wang, Z.; He, J.; Zheng, B.; Mao, T.; Li, S.; Li, X. Experimental Study on Friction Behavior During Fault Slip Under Fluid Injection. J. Eng. Geol. 2025, 33, 858–865. [Google Scholar]
  16. Zhang, Q.; Zhang, F.; Yi, X.; Liu, Y.; Wang, H.; Ma, J.; Chen, X. Analysis of Fault Activation Impacts on Casing During Fracturing Operations. China Petrol. Mach. 2023, 51, 74–79+89. [Google Scholar]
  17. Yan, W.; Wang, K.; Deng, J.; Tang, Q.; Bu, H.; Tan, C.; Yin, Q.; Qin, F. Characteristics of Fault-Slip Induced Casing Deformation: Case Study of Dagang Guandong Shale Oil. Petrol. Sci. Bull. 2022, 7, 543–554. [Google Scholar]
  18. Sun, R.; Huang, D.; Chen, D.; Zhao, J.H. Research on Casing Failure Mechanisms and Countermeasures in Hydraulic Fracture of Shale Reservoirs Considering Dynamic Evolution of Fault Slip. Eng. Fail. Anal. 2024, 161, 108301. [Google Scholar] [CrossRef]
  19. Xiong, T.S.; Wang, H.C.; Liu, H.; Yang, J.X.; Ma, B.; He, P.; Yang, Q.Y.; Guo, C.B.; Huang, X.N. Application of Key Factors Analysis and Measures Prevention of Casing Deformation—A Case Study from China. In Proceedings of the SPE Advances in Integrated Reservoir Modelling and Field Development Conference and Exhibition, Abu Dhabi, United Arab Emirates, 2–4 June 2025. [Google Scholar]
  20. Liu, H.; Fan, Z.; Liu, Y.; Lian, W.; Xi, Y.; Zhang, X. Calculation Method for Fault Slip Displacement Based on Focal Mechanisms. World Petrol. Ind. 2024, 31, 40–47. [Google Scholar]
  21. Wang, X.; Zhong, S.; Wu, Y.; Song, L.; Tuo, Y.; Lin, T. Shear Effects of Hydraulic Fracturing-Induced Fault Slip on Casing Integrity. Drill. Prod. Technol. 2023, 46, 7–14. [Google Scholar]
  22. Liu, P.; Li, J.; Xi, Y.; Lian, W.; Zhang, X.; Guo, X. Calculation Model and Influencing Factors of Shale Fault Slip Displacement. China Petrol. Mach. 2022, 50, 74–80. [Google Scholar]
  23. Liu, H.; Liu, H.; Liu, Y.; Cao, W.; Lian, W.; Li, J. Dynamic Slip Behaviors of Faults During Multistage Hydraulic Fracturing in Shale Gas Reservoirs. China Petrol. Mach. 2024, 52, 65–74. [Google Scholar]
  24. Zhang, W.; Li, J.; Zhang, H.; Wang, D.; Li, T.; Liu, H. Influence of Fault Slip on Casing Shear Deformation: Mitigation Strategies. Fault-Block Oil Gas Field 2023, 30, 734–742. [Google Scholar]
  25. Yan, X.; Yu, H.T.; Jing, H.W. Numerical Investigation of the Stress Regime Effect on Injection-Induced Fault Reactivation and Associated Seismicity. Comput. Geotech. 2024, 169, 106251. [Google Scholar] [CrossRef]
  26. He, Y.; Li, Y. FEM Simulation of Fault Reactivation Induced with Hydraulic Fracturing in the Shangluo Region of Sichuan Province. Energies 2024, 17, 1614. [Google Scholar] [CrossRef]
  27. Polun, S.G.; Bidgoli, T.S. Introducing PyFaultSlip: A Free and Open-Source Tool for the Assessment of Induced Fault Slip Hazards from Deep Fluid Injection. Comput. Geosci. 2024, 196, 105813. [Google Scholar] [CrossRef]
  28. Li, J.; Zhao, C.; Liu, G.; Zhang, H.; Zhang, X.; Ren, K. Fault Slip Behaviors and Influencing Factors Under Shale Gas Fracturing Conditions. J. China Univ. Petrol. (Nat. Sci. Ed.) 2021, 45, 63–70. [Google Scholar]
  29. Peterie, S.L.; Miller, R.D.; Intfen, J.; Bidgoli, T.; Buchanan, R. A Geologically-Based Approach to Mitigate Potentially Induced Seismicity in Kansas. In SEG Technical Program Expanded Abstracts 2015; Society of Exploration Geophysicists: Houston, TX, USA, 2015; pp. 4871–4876. [Google Scholar]
  30. Huang, H.Y.; Xu, E.S.; Zhong, G.H.; Zhang, Z.; Yang, X.; Liu, C.X.; Yu, W. Analysis of Casing Deformation in Horizontal Wells of Deep Shale Gas Reservoirs: Causes and Mitigation Strategies. In Proceedings of the SPE/AAPG/SEG Unconventional Resources Technology Conference, Houston, TX, USA, 2–4 June 2025. [Google Scholar]
  31. Ye, T.; Chen, Z.; Dai, C. Data-Driven Analysis and Template Construction for Casing Deformation in Deep Shale Gas Basin. SPE J. 2025, 30, 2256–2268. [Google Scholar] [CrossRef]
  32. Nermoen, A.; Shchipanov, A.; Porzer, M.M.; Šancer, J.; Berenblyum, R. Evaluation of Safe Operating Envelope for CO2 Injection under Uncertain Rock Mechanical Parameters and Earth Stresses. Int. J. Greenh. Gas Control 2024, 136, 104189. [Google Scholar] [CrossRef]
  33. Li, D.; Jia, J.; Teng, F.; Zhu, G.; Wu, M. Calculation of Bottom-Hole Pressure During Fracturing Operations. Fault-Block Oil Gas Field 2013, 20, 384–387. [Google Scholar]
  34. Xu, F. Computational Analysis and Comparative Assessment of KGD, PKN, and Modified P3D Hydraulic Fracturing Design Models. Energy Environ. Prot. 2017, 39, 220–225. [Google Scholar]
  35. Miller, C.; Dyes, A.B.; Hutchinson, C.A., Jr. The Estimation of Permeability and Reservoir Pressure from Bottom Hole Pressure Build-Up Characteristics. J. Petrol. Technol. 1950, 2, 91–104. [Google Scholar] [CrossRef]
  36. Yokoyama, R.; Wang, K.; Suzuki, S.; Miwa, S.; Okamoto, K. Determination of Spearman’s Rank Correlation for Melt Spreading-Solidification Dynamics Through the Combination of Integrated Experiments and Monte Carlo Method. Int. J. Heat Mass Transf. 2025, 242, 126831. [Google Scholar] [CrossRef]
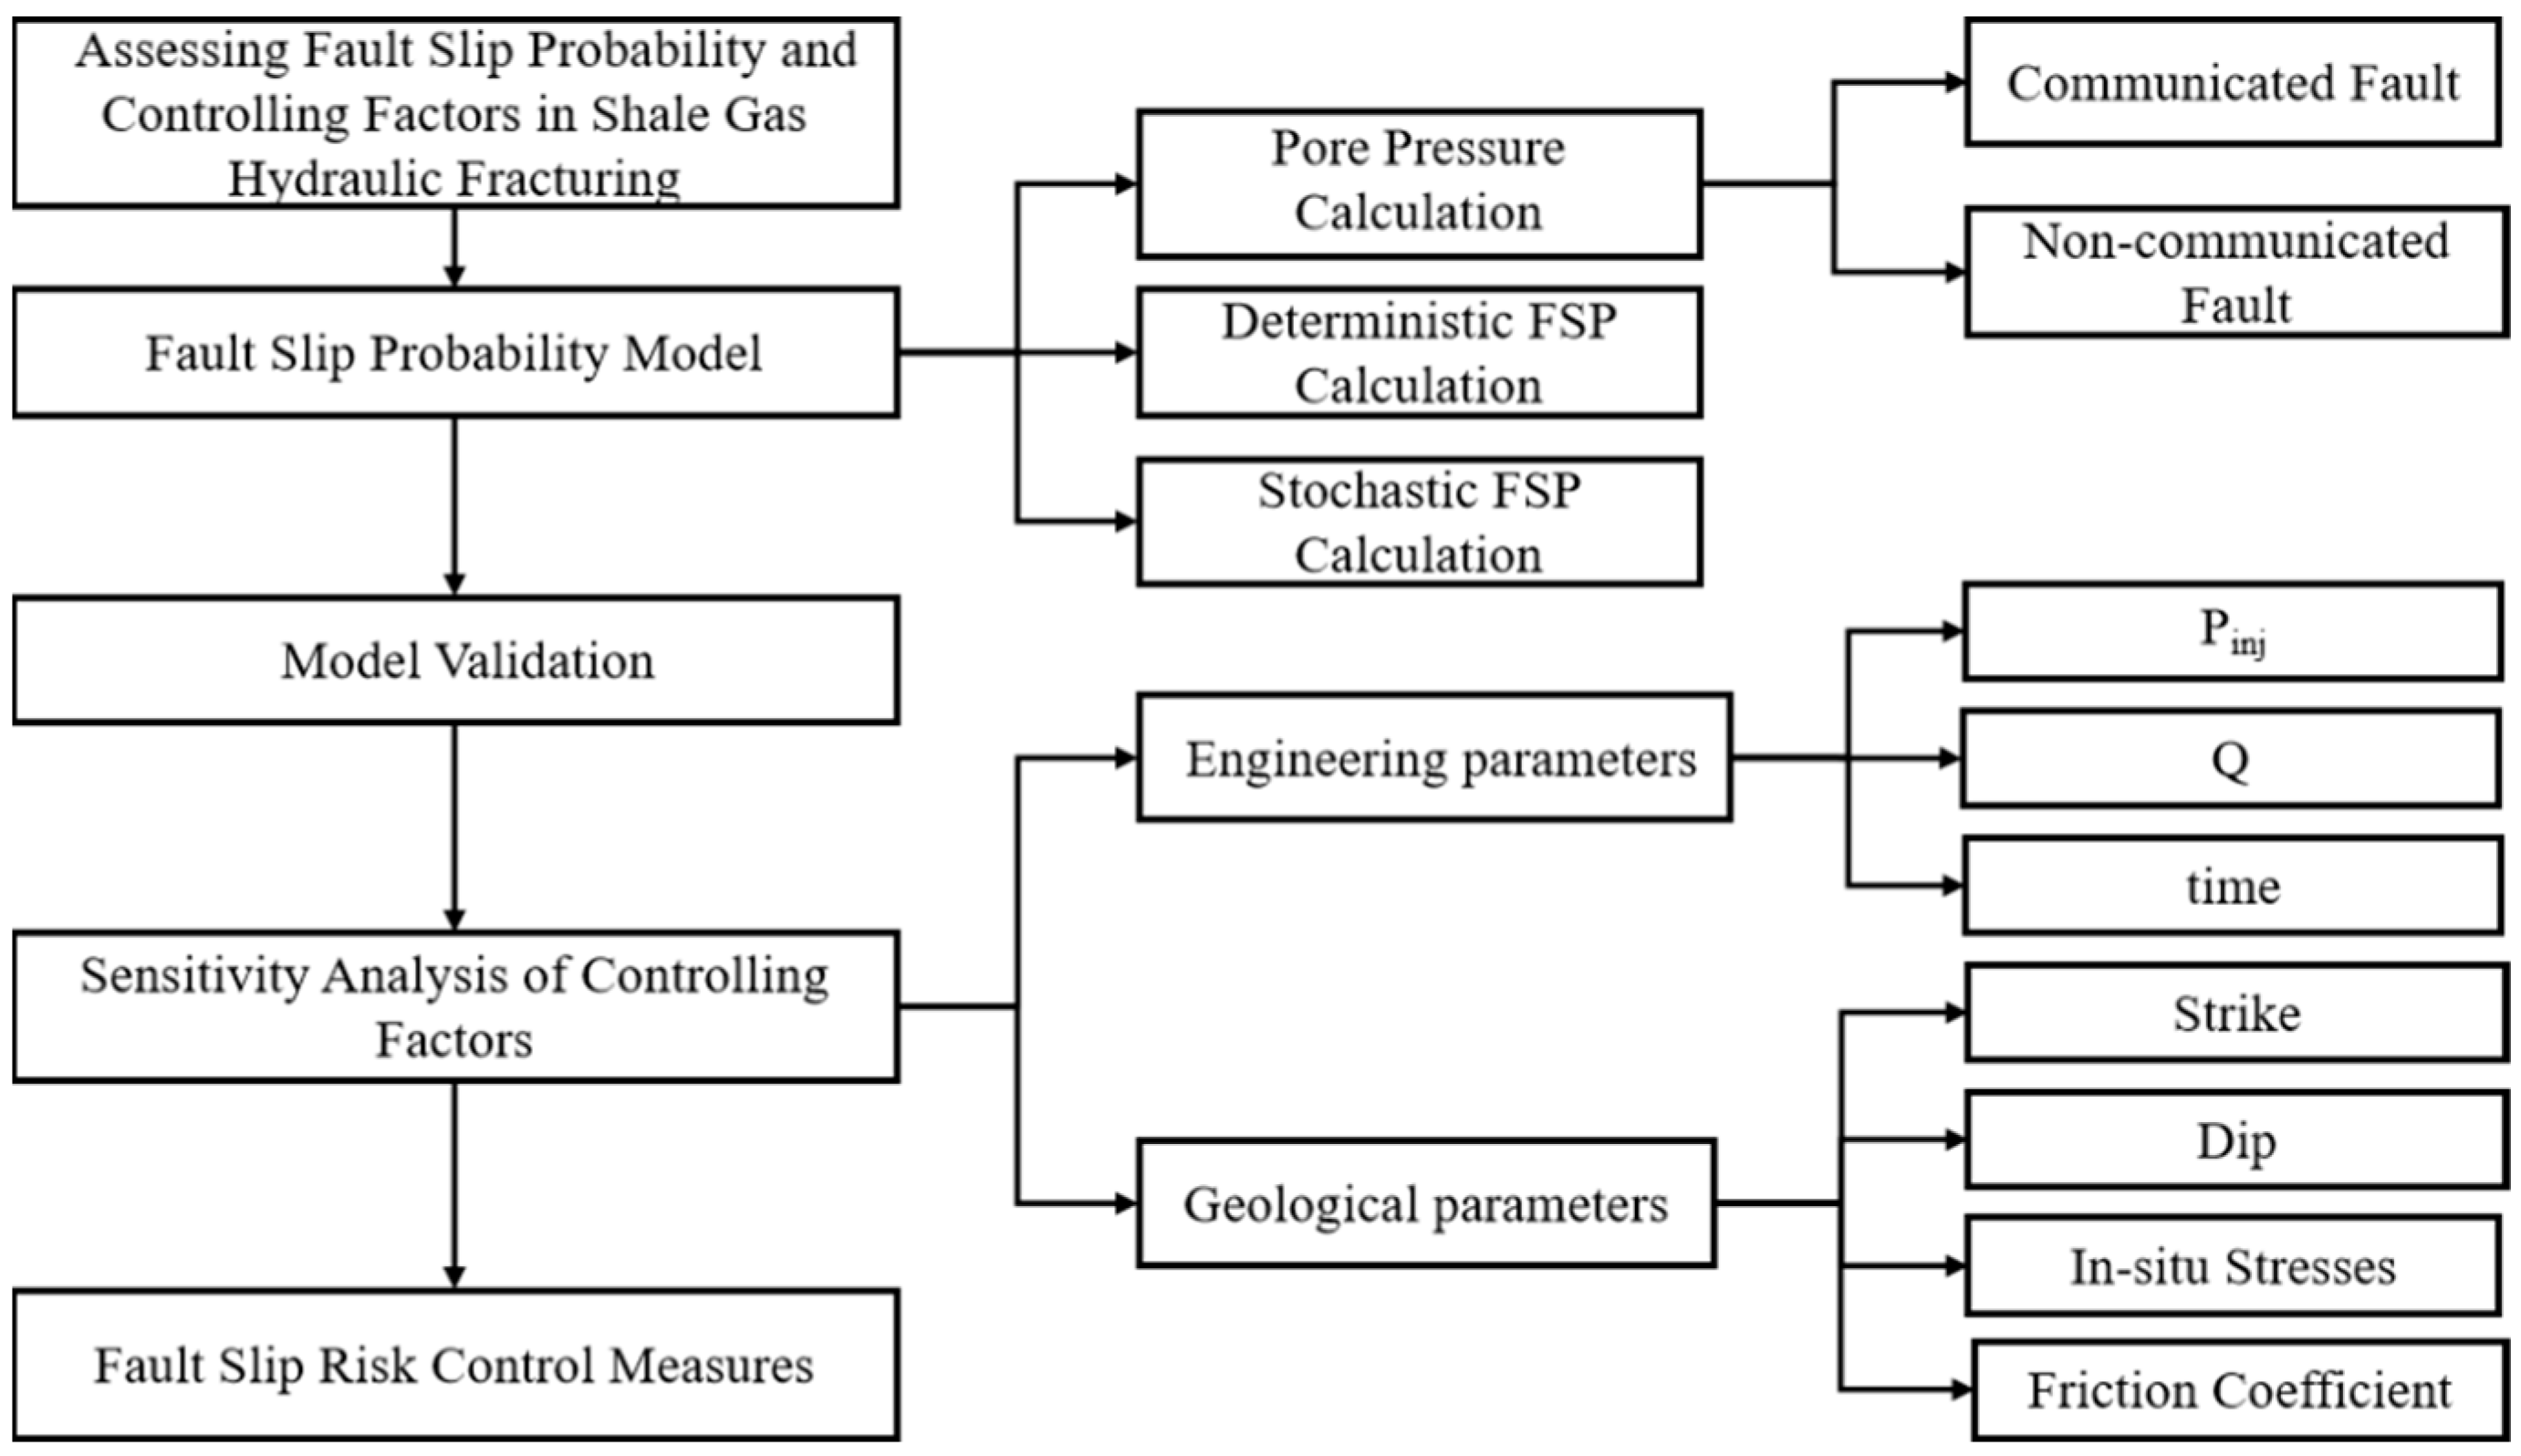
Figure 1. Methodology flowchart.
Eng 06 00272 g001
Figure 2. Pressure distribution and fracturing fluid flow during horizontal well stimulation.
Eng 06 00272 g002
Figure 3. Schematic diagram of fault and in situ stress orientation.
Eng 06 00272 g003
Figure 4. Schematic of fault slip induced by fracturing in Well Lu-20X.
Eng 06 00272 g004
Figure 5. Histogram of uncertainty parameter distributions.
Eng 06 00272 g005
Figure 6. Cumulative probability curve of fault slip likelihood.
Eng 06 00272 g006
Figure 7. Correlation coefficient plot for uncertainty parameters.
Eng 06 00272 g007
Figure 8. Variation in pore pressure, critical pore pressure, and fault slip probability with pumping pressure.
Eng 06 00272 g008
Figure 9. Variations in pore pressure, critical pore pressure, and fault slip probability with pumping rate.
Eng 06 00272 g009
Figure 10. Effect of Stage Duration on fault slip probability.
Eng 06 00272 g010
Figure 11. Impact of fault dip and strike on slip probability.
Eng 06 00272 g011
Figure 12. Variations in pore, critical pore pressure, and fault slip probability with friction coefficient.
Eng 06 00272 g012
Figure 13. Variations in pore pressure, critical pore pressure, and fault slip probability with horizontal stress anisotropy.
Eng 06 00272 g013
Table 1. Geological/operational parameters and fault slip probabilities for 10 wells.
Well No. p inj (MPa) Q
(m3/min)
t (h) σ v (MPa) σ H (MPa) σ h (MPa) ϕ (°) P s
Well 110218.22.2893.9102.890.21483.13%
Well 29217.22.7395.6102.49015580.81%
Well 395141.8499.610894.317792.99%
Well 48911.52.2593.999.287.8158100%
Well 57916.52.0294.199.888.5070.14%
Well 674151.8294.198.987.6076.38%
Well 774151.9194.197.78612092.66%
Well 889162.0388.893.883.190100%
Well 984141.488.893.883.112097.47%
Well 1083142.4898105.191110100%
Disclaimer/Publisher’s Note: The statements, opinions and data contained in all publications are solely those of the individual author(s) and contributor(s) and not of MDPI and/or the editor(s). MDPI and/or the editor(s) disclaim responsibility for any injury to people or property resulting from any ideas, methods, instructions or products referred to in the content.