Abstract
Frozen loess is extensively distributed across seasonally frozen regions, where its mechanical behavior plays a critical role in the stability of engineering structures such as foundations, tunnels, and slopes. While the temperature-dependent strength characteristics of frozen soils have been widely investigated under conventional triaxial conditions, their response to variations in principal stress direction and intermediate principal stress under complex loading paths remains poorly understood. This study addresses this gap through a series of directional shear tests on frozen loess, examining the effects of principal stress direction angle (α) and intermediate principal stress coefficient (b) at different temperatures. The results demonstrate that lower negative temperatures (−5 °C, −10 °C, and −15 °C) markedly enhance both axial and shear strength compared with normal temperature (20 °C). Increasing α leads to a progressive reduction in axial strength, highlighting the strong influence of stress orientation on deformation characteristics. Higher values of b also reduce axial strength, but their impact on shear strength is limited. Overall, the influence of α and temperature on the strength of frozen loess is considerably more pronounced than that of b. These findings provide new insights into the mechanical behavior of frozen loess under non-traditional stress paths, offering practical implications for the design, safety evaluation, and stability control of geotechnical structures in cold regions.
1. Introduction
Frozen soil exhibits distinctive physical and mechanical characteristics, particularly frost heave and thaw settlement [1]. Its strength is governed by multiple factors, including temperature, moisture content, and confining pressure [2,3]. For instance, higher confining pressure and temperature can transform the stress–strain response of frozen soil from strain softening to strain hardening [4]. At low moisture content, frozen soil becomes more susceptible to brittle failure [5]. Temperature exerts a pronounced effect on the cohesion of frozen loess while exerting only minor influence on its internal friction angle; nevertheless, both parameters, as key indicators of shear strength, increase as temperature decreases [6].
The complex deformation behavior of frozen soil has motivated continuous refinement of constitutive models that accurately capture its strength and failure mechanisms. Effective constitutive models not only reflect the stress–strain relationship but also reproduce the evolution of failure processes. Zhang et al. (2019) [7] developed a constitutive model for frozen silty clay based on the Duncan–Chang framework, which incorporates confining pressure effects in describing triaxial strength. Other studies have proposed uniaxial constitutive models for frozen loess that account for loading rate and temperature effects to reproduce stress–strain relationships under varying thermal–mechanical conditions [8]. More recently, a creep model has been advanced that considers the distinct roles of hardening and damage across different creep stages in frozen soil [9].
Seasonally frozen soils cover nearly half of China’s land area, including Northeast China, Inner Mongolia, Xinjiang, Tibet, and Qinghai. With the growing development of transportation infrastructure in these regions, highway construction increasingly encounters seasonally frozen ground. In highway subgrades, the initial stress state and stress history of soils are complex and diverse, resulting in intricate stress paths. In addition to tension, compression, and shear, one of the major phenomena is the rotation of the principal stress axis. Under the influence of earthquakes, waves, and traffic loads, the stress paths of foundation soils in permafrost regions become highly complex, as shown in Figure 1 [10,11,12]. This complexity is manifested not only in the continuous temporal and spatial rotation of the principal stress axis but also in the continuous variation of principal stress differences, both of which have significant effects on the deformation and strength of frozen soils. The strength and deformation of soils under such complex stress paths induced by principal stress axis rotation become more complicated, and experimental studies as well as engineering practices have demonstrated that this rotation can lead to significant plastic deformation, resulting in non-coaxial stress–strain behavior. In highway subgrade engineering in permafrost regions, the effects caused by the rotation of the principal stress axis cannot be neglected. These include problems such as pavement cracking due to frost heave, instability in subgrade layers, and differential settlement caused by thawing, all of which can compromise the safety and longevity of transportation infrastructure. These issues are particularly prominent in cold regions, where seasonal freezing and thawing cycles induce significant soil movement and degradation.
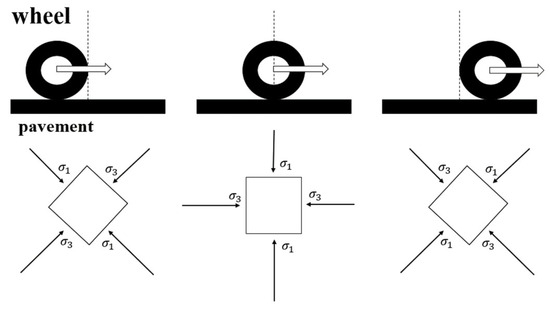
Figure 1.
Principal stress axes rotation.
Due to experimental constraints, prior studies on frozen soil mechanics have largely concentrated on uniaxial compression, direct shear, or conventional triaxial tests. For example, Xu et al. (2020) [13] investigated axial strain accumulation and stiffness evolution in frozen soil under cyclic triaxial loading. Christ and Park (2010) [14] demonstrated a linear increase in both shear and tensile strength with decreasing temperature. Zhou et al. (2022) [15] reported that the strength of modified silty clay initially increased after two freeze–thaw cycles but declined substantially after 5–10 cycles.
In contrast, investigations into principal stress axis rotation have primarily focused on unfrozen soils at room temperature. For instance, torsional shear tests on soft clay revealed that principal stress rotation amplified soil deformation and pore pressure buildup [16]. Farhang and Mirghasemi (2017) [17] examined coarse-grained soils and found that principal stress rotation altered volumetric strain and significantly influenced soil strength and deformation depending on stress orientation. Weng et al. (2018) [18] demonstrated that shear strength was jointly affected by the intermediate principal stress coefficient and the angle of principal stress rotation. Increasing initial stress accelerated the accumulation rate of plastic strain in frozen clay while also raising its final plastic strain [19]. Grabe and Clayton (2009) [20] showed that cyclic principal stress rotation caused permanent subgrade deformation in railway foundations, with deformation exacerbated by decreasing clay content.
With the advent of advanced testing technologies, it is now possible to investigate frozen soil mechanics under principal stress axis rotation with greater precision. Recent studies indicate that creep characteristics of frozen soils are strongly influenced by the intermediate principal stress coefficient and mean principal stress [21,22]. Zhang et al. (2021, 2022) [23 ,24] further showed that cumulative plastic strain increased with temperature, that low temperatures enhanced soil resistance to dynamic loads, and that principal stress rotation significantly undermined this resistance. However, the mechanical behavior of frozen loess under stress paths involving principal stress axis rotation remains insufficiently understood. A key gap in the current literature is the absence of experimental investigations into the mechanical behavior of frozen loess subjected to stress paths that involve principal stress axis rotation, especially under different temperatures and principal stress angles. Previous studies have largely concentrated on conventional stress paths or room-temperature conditions, offering only limited insights into how principal stress axis rotation affects the strength and deformation of frozen loess. In addition, existing theoretical models remain insufficient to accurately describe the response of frozen soils under such complex loading scenarios.
In order to provide new experimental data and a theoretical analysis of frozen loess behavior under non-traditional stress paths, directional shear tests were performed on frozen remolded loess to systematically evaluate its mechanical response under varying principal stress rotation angles, intermediate principal stress coefficients, and temperatures. The results from this study provide valuable insights into the mechanical behavior of frozen loess, which are critical for designing and constructing stable, durable infrastructure in cold regions. Specifically, the study highlights how factors such as principal stress direction, intermediate stress coefficient, and temperature impact the strength and deformation characteristics of frozen loess. These findings are essential for understanding how frozen soils behave under load, particularly during construction in seasonally frozen areas.
2. Experimental Design
2.1. Test Instruments
A frozen soil hollow cylinder apparatus (FHCA-300) was employed to investigate the mechanical properties of frozen soil under principal stress axis rotation (Figure 2). The device allows independent control of four loading parameters—axial force (), torque (), internal pressure (), and external pressure ()—as well as four corresponding stress variables: mean principal stress (), intermediate principal stress coefficient (), major principal stress direction angle (), and deviatoric stress ().
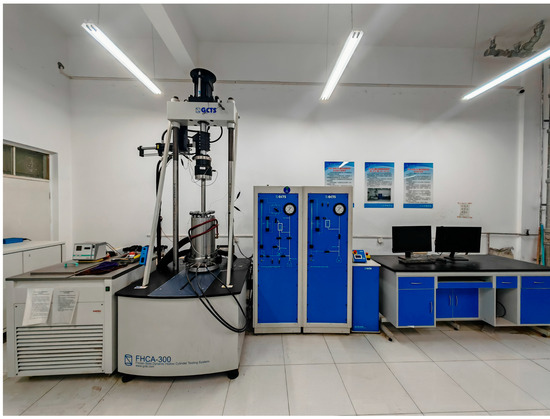
Figure 2.
Frozen soil hollow cylinder system.
2.2. Sample Preparation
Soil samples were collected from the subgrade filling of the Menyuan section of the Bianmen Expressway in Qinghai Province, a site representative of seasonally frozen soil conditions commonly encountered in regional transportation infrastructure. Samples were taken from a depth of approximately 1.5–2.0 m, corresponding to the zone typically affected by seasonal freeze–thaw cycles. In total, about 100 samples with a combined weight of 200 kg were obtained from multiple locations within the area to ensure representativeness. The region lies within the seasonally frozen soil zone, with an annual mean temperature of approximately −5 °C. The basic physical properties of the loess, determined from liquid limit, plastic limit, and standard compaction tests, are summarized in Table 1.

Table 1.
Physical properties of test soil samples.
Loess has a unique and fragile microstructure, which makes the preparation of undisturbed soil samples very difficult in practice. Since the effect of freeze–thaw cycles on PI remains controversial, using remolded soil in this study helps to reduce the uncertainty caused by structural disturbance of undisturbed loess and allows us to focus on the mechanical behavior under frozen conditions. The loess samples were oven-dried for at least 8 h, then crushed and sieved through a 2 mm mesh before being sealed and stored. The dry density of the soil, determined from standard compaction tests, was 1.89 g/cm3, and the saturated moisture content, measured through saturation tests, was 19%. For specimen preparation, the soil was conditioned at the saturated moisture content, as this condition facilitated testing and produced more pronounced deformation behavior. The wet soil, adjusted to the maximum dry density and saturated moisture content, was thoroughly mixed, sieved through a 5 mm mesh, and then sealed for 24 h to ensure uniform moisture distribution before molding.
The prepared mixture was divided into 10 equal portions and compacted sequentially into a cylindrical mold, with each layer compacted to a thickness of 2 cm (Figure 3a,b). The hollow specimen was subsequently extracted from the mold using a scraping cutter (core-taking device). The final specimen measured 200 mm in height, 100 mm in outer diameter, 60 mm in inner diameter, and 20 mm in wall thickness (Figure 3c–e). To ensure reliable contact between the specimen and the jaw vanes of the hollow cylinder apparatus, shallow grooves were cut on the top and bottom surfaces of the specimen (Figure 3f). The specimen was then carefully aligned within the apparatus so that the vanes were firmly positioned against the grooved surfaces. During compaction, special attention was given to achieving uniform contact and eliminating potential air gaps. The specimen was further monitored during loading to confirm that the vanes maintained a stable grip throughout the test. The complete specimen preparation procedure is illustrated in Figure 3.
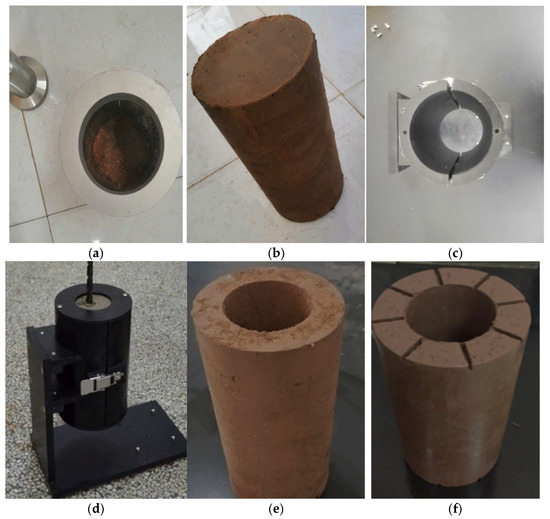
Figure 3.
Preparation of a hollow cylinder sample. (a) Sample container; (b) Solid specimen; (c) Core barrel; (d) Core drilling; (e) Hollow specimen; (f) Shallow grooves hollow specimen.
In the frozen tests, the specimens were placed in the pressure chamber of the hollow cylinder apparatus and cooled to the target temperatures for at least 24 h without applying consolidation pressure in order to simulate the natural freezing process of loess under existing in situ stresses without additional pressurization.
2.3. Test Principle
A schematic stress diagram of the soil specimen within the testing apparatus is shown in Figure 4. During loading, the intermediate principal stress remains constant along the radial direction, while the orientations of the major and minor principal stress axes rotate either clockwise or counterclockwise within the plane perpendicular to the radial direction.
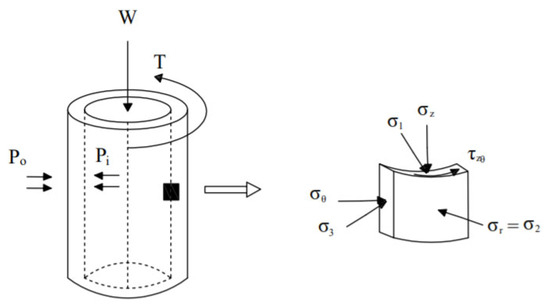
Figure 4.
Stress diagram of a hollow cylinder.
The relationship between the loading parameters and the stress parameters of the test instrument can be expressed as [25]:
where
is the inner diameter of the sample;
is the outer diameter of the sample; and
is the cross-sectional area of the axially loaded rod. α represents the angle of the major principal stress direction relative to a reference axis, which defines the orientation of the applied stress in the specimen. b refers to the intermediate principal stress coefficient, which is a parameter that characterizes the ratio of the intermediate principal stress to the mean principal stress in the stress state.
2.4. Test Scheme
During the directional shear tests on frozen soil, the specimens were maintained at low temperatures, and the cooling process prior to testing is shown in Figure 5. Once a target temperature was set, the sample temperature was allowed to decrease until equilibrium was reached. To provide a reference for comparison with the frozen state, only one room-temperature test was conducted under the conditions of mean principal stress p = 200 kPa, intermediate principal stress coefficient b = 0.5, principal stress axis angle = 40°, and a shear stress rate of 2 kPa/min. Three groups of experiments were conducted: (i) temperature variation tests (T = −5, −10, and −15 °C with reference condition at 20 °C); (ii) principal stress direction angle variation tests ( = 0°, 15°, 30°, 45°, 60°, and 75°); and (iii) intermediate principal stress coefficient variation tests ( = 0, 0.25, 0.5, and 0.75) (Table 2). In this study, volumetric strain during the cooling stage was not monitored due to limitations of the experimental apparatus, which does not allow real-time volume measurements during freezing.
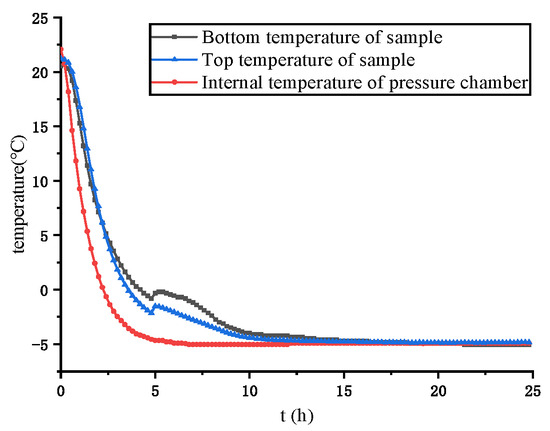
Figure 5.
Temperature decreasing.
Table 2.
Parameter table of stress path.
Figure 6 illustrates the schematic representation of the stress path loading process used in the experiments. This figure visually demonstrates the relationship between the applied mean principal stress (p), shear stress (q), and the loading trajectory during the experimental stages. The stress path is essential for understanding how frozen loess responds to different loading conditions, specifically how the principal stress direction and intermediate principal stress coefficient influence the material’s strength and deformation behavior. The loading path shown in Figure 6 was designed based on the experimental procedure, which consisted of two stages: the initial constant stage, where stress values were set to their target values, and the loading stage, where deviatoric stress was increased at a fixed rate. This design was chosen to simulate real-world conditions where soil experiences both axial and shear stress under controlled experimental conditions.
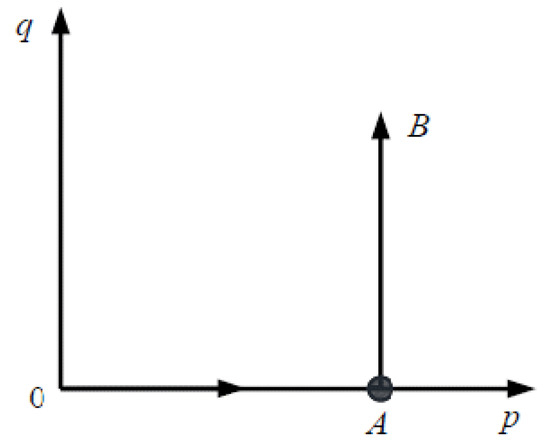
Figure 6.
Schematic diagram of stress path loading.
Loading rate is a critical factor influencing the strength of frozen soil, as it directly alters the duration of loading and thus the soil response [26,27]. In the directional shear stage, shear stress (q), as the loading parameter, was applied at a controlled rate. Previous studies have shown that a loading rate of 30 kPa/min ensures stable data acquisition in frozen soil tests [28]. Accordingly, in this study, a loading rate of 30 kPa/min was adopted for frozen soil specimens at −5, −10, and −15 °C. For normal temperature soil (20 °C), the loading rate was set to 2 kPa/min, consistent with both the triaxial test standards (Chinese GB/T 50123-2019 [29]) and the acquisition results from room-temperature hollow cylinder tests.
For the normal temperature test condition (Test No. 1-1), both the consolidation pressure and the mean principal stress (p) were set to 200 kPa. This value was chosen based on typical field conditions in the region, specifically the in situ soil depth and the engineering environment. In this area (Qinghai Province), the typical soil depth is approximately 1.5 to 2 m, where the overburden pressure (i.e., the natural compaction pressure) is around 200 kPa. This stress value was selected to closely replicate real-world conditions and ensure the accuracy of the test results. Using excessively low stress values could lead to inaccurate representations of the soil’s behavior under realistic loading conditions, whereas 200 kPa provides a more representative value that aligns well with field conditions. This ensures consistency between the test conditions and the in situ stress environment, making the experimental results more applicable to actual engineering projects in similar regions.
Under freezing conditions, the deviatoric stress threshold was determined with reference to Chen et al. (2018, 2020) [21,28]. Their results indicate that the failure stress of frozen loess typically lies between 3500 and 5500 kPa, with 4500 kPa potentially representing the critical stress level. Considering the risk of excessive particle rearrangement under very high pressures, and to facilitate subsequent analysis combining macro-scale failure behavior with microstructural observations, a p value of 3500 kPa was selected in this study.
3. Analysis of Test Results
Due to limitations in sample preparation and equipment conditions, the stress–strain distribution within the hollow cylindrical specimen is inherently non-uniform. In this study, average stress and strain values were therefore adopted. A thin-walled hollow cylinder element is simultaneously subjected to axial, circumferential, radial, and tangential stresses, which in turn induce corresponding strains in each direction. Since deformation in a single direction cannot adequately represent the overall behavior of the specimen, generalized shear stress () and generalized shear strain () were introduced to characterize the deformation process. This approach provides a more comprehensive description of the mechanical response under varying conditions.
where
is the original height of the soil sample; θ is the dynamic torsional angle during the sample test; and
is the deformation of the sample in the vertical direction.
In the temperature-controlled tests, four conditions were considered: normal temperature (20 °C), −5 °C, −10 °C, and −15 °C. For the normal temperature test (20 °C), the specimens were first consolidated in the pressure chamber. Consolidation was deemed complete following the Chinese Standard for Soil Test Methods (GB/T 50123-2019 [29]), i.e., when the axial displacement rate was less than 0.01 mm per hour. Subsequently, the stress-path loading stage was performed until test termination. In contrast, for the freezing tests (−5 °C, −10 °C, and −15 °C), the specimens were not subjected to consolidation. Instead, they were cooled directly to the designated temperature for at least 24 h prior to the stress-path loading stage, which was carried out under constant temperature conditions.
In the principal stress direction angle tests, six loading conditions were applied, with major principal stress direction angles of 0°, 15°, 30°, 45°, 60°, and 75°.
In the intermediate principal stress coefficient tests, four loading conditions were considered, corresponding to values of 0, 0.25, 0.5, and 0.75.
4. Results and Discussion
4.1. Effect of Temperature
Figure 7 illustrates the relationship between axial strength and shear strength under different temperature conditions. The stress–strain curves indicate clear strain hardening with decreasing temperature, particularly under frozen states, where the torsional shear strain curves exhibit pronounced hardening. A distinct contrast in strength was observed between the unfrozen condition (20 °C) and the frozen states (−5 °C, −10 °C, and −15 °C) (Figure 7a,b).
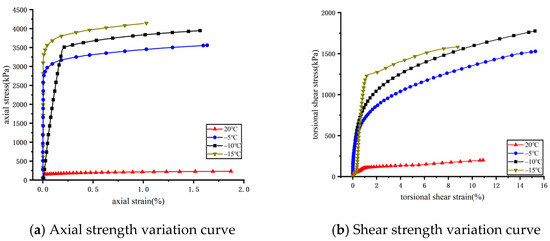
Figure 7.
Stress–strain curves at different temperatures.
The strength variation at −5 °C, −10 °C, and −15 °C followed a similar upward trend, suggesting that temperature reduction does not alter the curve pattern but significantly enhances soil strength. Both axial and shear strength increased progressively with decreasing temperature. This behavior can be attributed to the reduction in unfrozen water content at lower temperatures, which enhances the bonding between soil particles and ice, thereby strengthening the frozen soil matrix.
During strain development, the ultimate torsional shear strain in the linear elastic stage was approximately 0.5%. Beyond this threshold, plastic deformation became evident, with the shear stress–strain curve exhibiting stronger hardening compared to the axial response. The frozen soil specimens predominantly failed in shear (Figure 7b). The shear strength of the unstructured frozen soil comprised both the intrinsic bonding capacity and the shear resistance of ice. While bonding strength forms the primary load-bearing mechanism, it is weaker than the shear strength of ice particles. Thus, the measured shear strength at failure mainly reflected the bonding capacity within the frozen soil rather than the ice strength itself [28].
Overall, temperature exerted a significant influence on soil strength. Under frozen conditions, decreasing temperature not only increased axial and shear strength but also accelerated the rate of strength development.
4.2. Change in Direction Angle of Major Principal Stress
Figure 8 presents the variations of torsional shear strain and axial strain under different angles of the major principal stress. Figure 8a,b illustrate the relationships between torsional shear stress and torsional shear strain, while Figure 8c,d depict axial stress and shear stress versus axial strain. The stress–strain responses exhibited strain hardening across different θ values. At θ = 0°, the major principal stress was aligned with the axial direction, resulting in no torsional shear strain since torsional loading was absent.
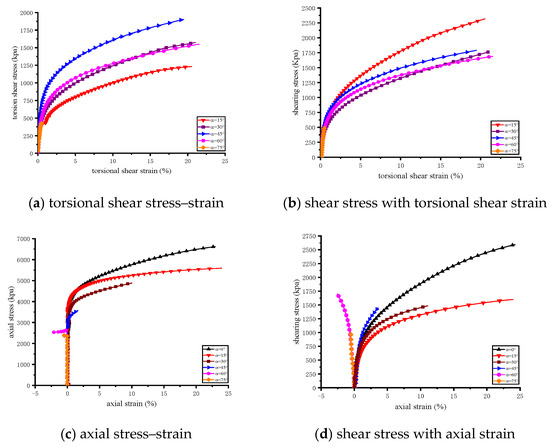
Figure 8.
Angular stress–strain curves of different principal stresses.
For torsional shear, distinct trends were observed across the tested angles. The maximum torsional shear strength occurred at
= 45° (Figure 8a), while comparable behaviors were found at
= 30° and 60°. At
= 15°, the torsional shear strength was relatively low, and at
= 75°, torsional shear strain showed almost no development, indicating weak torsional resistance and predominant axial stretching that caused premature failure. In the initial loading stage (0–0.5% strain), the torsional stress–strain curve was nearly vertical, reflecting a constant elastic modulus. Beyond 0.5% strain, plastic deformation became evident.
In the axial direction,
strongly influenced the deformation mode. At
= 0°, 15°, 30°, and 45°, axial strain was positive, indicating compression (Figure 8c,d). Conversely, at
= 60° and 75°, axial strain was negative, corresponding to tensile deformation. Axial strength decreased progressively with increasing
. When
= 0–30°, axial stress–strain curves exhibited extended development, while at
= 45°, strain development was weaker due to the imbalance of lateral pressures. Under
= 60° and 75°, tensile loading dominated, leading to earlier failure and limited strain evolution.
A clear contrast emerged between compression and tension states: compression induced strain-hardening behavior, whereas tension caused strain softening.
Overall, torsional shear and axial strengths were highly sensitive to θ. Increasing
reduced axial strength and shifted the deformation mode from compression-dominated to tension-dominated, with
= 75° producing the weakest torsional shear resistance and premature tensile failure.
4.3. Change in Intermediate Principal Stress Coefficient
Figure 9 illustrates the stress–strain responses of frozen soil under different intermediate principal stress coefficients (b = 0, 0.25, 0.5, and 0.75). Figure 9a,b show the relationships of torsional shear stress and shear stress with torsional shear strain, while Figure 9c,d depict axial stress and shear stress versus axial strain. Overall, strain hardening was observed with increasing b values.
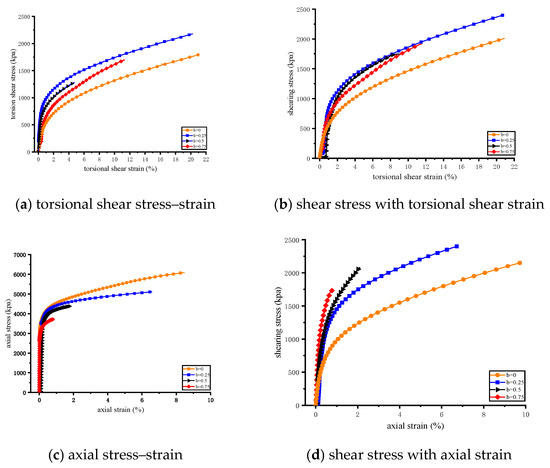
Figure 9.
Stress–strain curves of different intermediate principal stress coefficients.
For torsional shear behavior, the strength ranking was 0.25 > 0.5 > 0.75 > 0 (Figure 9a,b). When
≠ 0, the stress–strain curves were more compact, and the strength growth rates were consistent, suggesting that differences among
= 0.25, 0.5, and 0.75 had limited impact on torsional shear response. In contrast, when
= 0, both torsional shear and shear strengths were markedly lower, highlighting the importance of the intermediate principal stress coefficient in controlling soil strength. The critical torsional strain in the linear elastic stage remained 0–0.5% across all b values, after which plastic hardening developed.
In the axial direction, strength decreased progressively with increasing
(Figure 9c). At
= 0.75, axial strain development was minimal because the relatively faster increase in internal pressure compared to external pressure induced soil expansion damage and early loss of bearing capacity. For shear stress, a slow but steady increase was observed across all cases (Figure 9d), with the lowest shear strength occurring when
= 0. Within the elastic range (0–0.5% axial strain), axial stress increased more rapidly than shear stress. In the plastic stage, axial stress hardened at a slower rate than shear stress.
In summary, torsional shear and shear strengths exhibited similar trends for
= 0.25, 0.5, and 0.75, while both strengths were notably reduced when
= 0. Axial behavior, however, was more sensitive to
, with higher coefficients reducing axial strength but enhancing shear stress development.
4.4. The Characteristics of Generalized Shear Stress and Generalized Shear Strain
Figure 10 presents the generalized shear stress–strain relationships of frozen soil under varying temperatures
, principal stress direction angles
, and intermediate principal stress coefficients (). In general, strain hardening was observed with decreasing temperature, increasing stress angle effects, and rising b values.
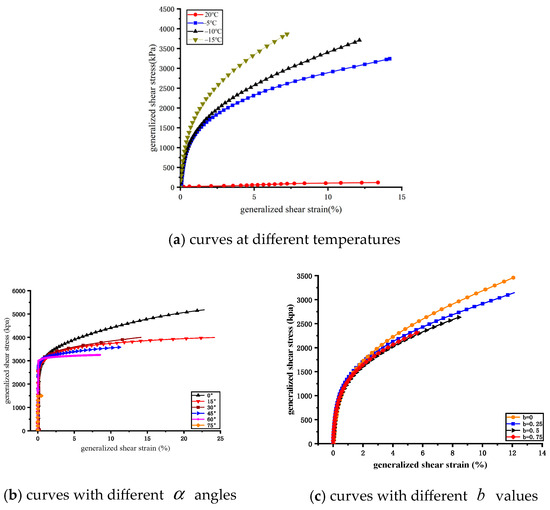
Figure 10.
The curves of generalized shear stress and generalized shear strain.
Soil strength increased substantially after freezing. At room temperature (20 °C), thawed soil exhibited weak strain hardening, while frozen soil displayed a pronounced hardening response. During the elastic stage under freezing conditions, the growth rate of generalized shear stress remained nearly constant with decreasing temperature, indicating limited temperature influence in this range. However, in the plastic deformation stage, strength enhancement became evident, with stronger hardening at lower temperatures. This effect can be attributed to the transformation of pore water into ice crystals, which reinforces cementation between soil particles and ice, thereby improving load-bearing capacity.
The generalized stress–strain curves under different stress angles could be divided into a linear elastic stage followed by plastic deformation. In the elastic stage, generalized shear stress increased linearly with minimal divergence across angles, owing to stable cementation among soil particles, ice, and unfrozen water. Upon reaching the ultimate strain, plastic deformation developed, and the trends diverged due to bond breakage and structural rearrangements. Strength was highest at 0° and lowest at 75°, while the curves at 15°, 30°, 45°, and 60° showed little variation in shape.
The strength curves exhibited a consistent positive trend with increasing b. Under the same generalized shear strain, stress magnitudes were similar across b values, indicating only minor differences. The critical strain for transition from elastic to plastic behavior was approximately 0.5%, after which all samples exhibited strain hardening.
These results indicate that the principal stress direction angle exerted a stronger influence on the generalized shear stress–strain response of frozen loess compared with the intermediate principal stress coefficient. Meanwhile, temperature reduction significantly enhanced strength, particularly during plastic deformation, confirming the critical role of ice bonding in frozen soil mechanics.
As shown in Figure 11, the frozen soil specimens subjected to directional shear tests under different principal stress axis angles exhibited varying degrees of deformation, most of which manifested as shear deformation with visible shear bands. The shear bands in the figures are highlighted with solid red lines. It can be observed that when the principal stress axis angle was 0°, the specimen was subjected to a vertically downward axial force without shear deformation, leading instead to peripheral expansion and splitting. When the principal stress axis angle was not 0°, the specimens all developed shear deformation to different extents. The deformation was concentrated in narrow localized zones, forming inclined shear bands on the specimen surface, which affected the soil strength and reduced its bearing capacity. At principal stress axis angles of 30° and 45°, the shear bands were more pronounced, and the specimens exhibited greater deformation in the torsional shear direction. At 60° and 75°, slight surface extrusion occurred, and the shear band development was relatively moderate.
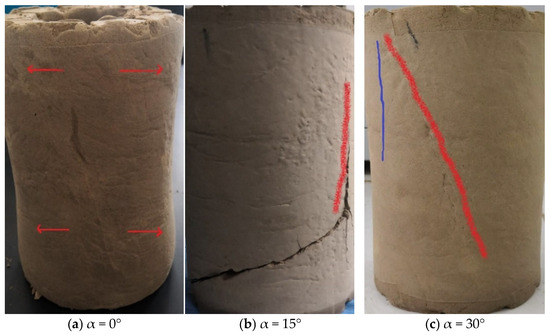
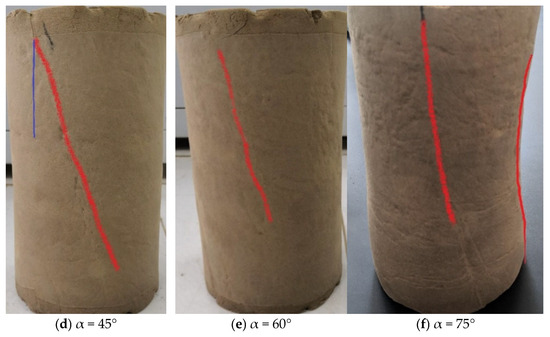
Figure 11.
Deformation of specimens after testing.
4.5. Study on Strength Model of Frozen Loess
To further analyze the strength model of loess under freezing conditions, the generalized shear stress–strain curves obtained from the directional shear stress path were plotted under different parameters, as shown in Figure 12.
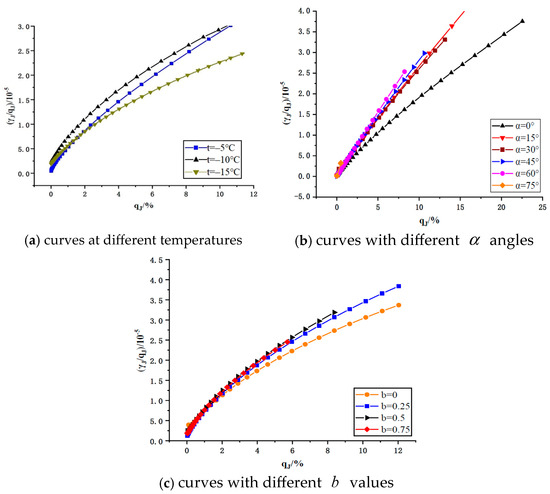
Figure 12.
curves in different stress paths.
As shown in Figure 12, the relationship between the horizontal and vertical coordinate variables exhibits an approximately linear trend, which can be described and fitted using the following linear equation:
where
and
are constants for soil quality and stress path. The
and
values corresponding to different stress paths were obtained according to the fitting of the test data, and the fitting effect was favorable, as shown in Table 3.
Table 3.
The calculated m and n values in different stress paths.
From the fitted linear equation, the
relationship and generalized shear modulus
were obtained as follows:
It can be seen from the above equations that when
, the initial generalized shear modulus is
, and when
, the limit generalized shear stress is
. Therefore, the physical meaning of
is the reciprocal of the initial shear modulus, and the physical meaning of
is the reciprocal of the generalized shear stress corresponding to the asymptotic line of the
curve, which are consistent with the parameter physical meanings of the Duncan–Chang hyperbolic model.
The graph of the obtained generalized shear modulus versus generalized shear strain is presented in Figure 13. It can be observed that with the gradual increase in strain, the generalized shear modulus generally exhibited a decreasing trend. The influence of stress parameter variations on the initial generalized shear modulus () was more pronounced. Specifically,
first decreased, then increased, and decreased again with increasing major principal stress direction angle α\alphaα, with two distinct inflection points occurring at
= 15° and
= 30°, respectively. In contrast,
gradually increased with rising values of the intermediate principal stress coefficient b\,bb, and the values of
were relatively close when
value was not 0. Furthermore, as the temperature decreased,
initially declined and then increased.
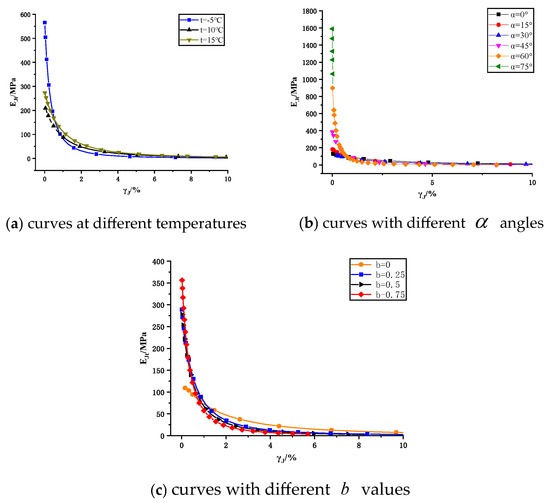
Figure 13.
curves in different stress paths.
Obtained from the result, the principal stress direction significantly influences the deformation and strength of frozen loess. The intermediate principal stress coefficient affects strength and deformation. And given that soil strength increases at lower temperatures, design parameters for foundations and geotechnical structures should account for seasonal temperature variations, capitalizing on winter strength gains while considering potential weakening during thaw periods. Engineers should incorporate stress orientation in the design of structures on frozen soils, especially in seasonally frozen areas, to minimize risks of cracking and instability.
5. Conclusions
A series of tests were conducted to test the stress–strain characteristics of frozen loess under differing temperature, direction angle
of major principal stress, and intermediate principal stress coefficient
value conditions. The following conclusions were obtained:
(1) Compared with the room-temperature condition, the axial strength of loess increased by approximately 16–19.2 times and the shear strength by about 7.84–10.15 times under frozen conditions at −5 °C, −10 °C, and −15 °C. When the soil was frozen, there was higher cementation between the constituent soil particles, unfrozen water, and ice crystals, increasing the overall axial strength and shear strength of the soil as well as the rate as these values grew. As a result, frozen soil gradually developed into the strain-hardening type.
(2) The frozen soil was stretched with increasing angles at which principal stress was applied. Under these conditions, the axial strength of the frozen soil decreased gradually. The gradual increase of
angle reduced the strength of the curve of generalized shear stress and generalized shear strain. Frozen soil under increasing
angles exhibited strain hardening.
(3) The
value did not affect the strength of the soil’s generalized shear stress–strain curve. Increased
value weakened the axial strength of frozen soil. The shear strength was the lowest when the b value was 0. Except when the b value was 0, increasing the b value decreased the shear strength. The shear strain, axial strain, and general shear strain decreased gradually with the increase in the b value, which significantly affected the deformation of frozen soil.
(4) The frozen soil was subjected to the coupling effect of axial force and torque. Under the directional shear path, the stress–strain curves exhibited strain-hardening, and the curves developed from the linear elastic deformation stage to the plastic deformation stage under different
angles,
values, and temperatures.
(5) The
curves under different stress paths were linear, and the Duncan-Chang hyperbolic model could be used as the strength equation of frozen loess under directional shear conditions. The constants
and
and the initial generalized shear modulus
were significantly affected by
angle,
value, and temperature.
Author Contributions
Conceptualization, J.F. and C.W.; methodology, J.F. and C.W.; software, J.F. and C.W.; validation, J.F., B.Z., and Q.W.; formal analysis, J.F. and C.W.; investigation, J.F. and C.W.; resources, B.Z. and Q.W.; data curation, B.Z. and Q.W.; writing—original draft preparation, J.F. and C.W.; writing—review and editing, B.Z. and Q.W.; visualization, B.Z. and Q.W.; supervision, B.Z. and Q.W.; project administration, B.Z. and Q.W.; funding acquisition, Q.W. All authors have read and agreed to the published version of the manuscript.
Funding
This research was funded by the National Natural Science Foundation of China, grant numbers 42161026 and 41801046, and the Natural Science Foundation of Qinghai Province, grant number 2023-ZJ-934M. The APC was funded by 2023-ZJ-934M.
Data Availability Statement
The authors will supply the relevant data in response to requests.
Conflicts of Interest
The authors declare no conflicts of interest.
References
- Qi, J.; Ma, W. Mechanical properties and research status of frozen soil. Rock Soil Mech. 2010, 31, 133–143. [Google Scholar] [CrossRef]
- Li, M.; Ma, Q.; Luo, X.; Jiang, H.; Li, Y. The coupled moisture-heat process of a water-conveyance tunnel constructed by artificial ground freezing method. Cold Reg. Sci. Technol. 2021, 182, 103197. [Google Scholar] [CrossRef]
- Jessberger, H.L. A state-of-the-art report. Ground freezing: Mechanical properties, processes and design. Eng. Geol. 1981, 18, 5–30. [Google Scholar] [CrossRef]
- Xu, X.; Wang, Y.; Bai, R.; Fan, C.; Hua, S. Strength and deformation characteristics of silty clay under frozen and unfrozen states. Cold Reg. Sci. Technol. 2020, 172, 102982. [Google Scholar] [CrossRef]
- Du, H.; Ma, W.; Zhang, S.; Zhou, Z. Influence of confining pressure and moisture content on failure strain energy density of frozen sand. Rock Soil Mech. 2017, 38, 1943–1950. [Google Scholar] [CrossRef]
- Guo, Y.; Wang, D.; Ma, W.; Mu, Y. Development and application of frozen hollow cylinder apparatus. J. Harbin Inst. Technol. 2016, 48, 114–120. [Google Scholar] [CrossRef]
- Zhang, Y.; Yang, P.; Jiang, W.; Zhang, T. Study on triaxial strength and constitutive model of silty clay frozen soil. J. Civ. Eng. 2019, 52, 8–15. (In Chinese) [Google Scholar] [CrossRef]
- Cai, C.; Ma, W.; Zhao, S.; Zhou, Z.; Mu, Y. Uniaxial test and constitutive model of frozen loess. Chin. J. Geotech. Eng. 2017, 39, 879–887. (In Chinese) [Google Scholar] [CrossRef]
- Shi, S.; Zhang, F.; Feng, D.; Tang, K. Creep constitutive model for frozen soils based on hardening and damage effects. KSCE J. Civ. Eng. 2020, 24, 1146–1158. [Google Scholar] [CrossRef]
- Ishihara, K. Soil response in cyclic loading induced by earthquakes, traffic and waves. In Proceedings of the 7th Asian Regional Conference on Soil Mechanics and Foundation Engineering, Haifa, Israel, 14–19 August 1983; Volume 2, pp. 42–66. [Google Scholar]
- Hejazi, M.; Fakharian, K.; Kaviani-Hamedani, F. Permanent deformation and particle crushability of calcareous sands under cyclic traffic-induced loadings through simple shear apparatus. Transportation. Geotechnics 2024, 49, 29–34. [Google Scholar] [CrossRef]
- Kaviani-Hamedani, F.; Fakharian, K.; Shabani, F.; Khoshghalb, A.; Shirkavand, D.; Baghbani, A. On the effects of multi-directional initial anisotropy on the monotonic constant volume response of a silica sand. Can. Geotech. J. 2025, 62, 1–23. [Google Scholar] [CrossRef]
- Xu, X.; Li, Q.; Xu, G. Investigation on the behavior of frozen silty clay subjected to monotonic and cyclic triaxial loading. Acta Geotech. 2020, 15, 1289–1302. [Google Scholar] [CrossRef]
- Christ, M.; Park, J.-B. Laboratory determination of strength properties of frozen rubber–sand mixtures. Cold Reg. Sci. Technol. 2010, 60, 169–175. [Google Scholar] [CrossRef]
- Wenjun, Z.; Qingzhi, W.; Jianhong, F.; Kejin, W.; Xiangqing, Z. Study of the Mechanical and Microscopic Properties of Modified Silty Clay under Freeze-Thaw Cycles. Geofluids 2022, 2022, 9613176. [Google Scholar] [CrossRef]
- Fu, Z.; Wang, G.; Song, W.; Yu, Y.; Wei, P.; Wu, T. Deformation Behavior of Saturated Soft Clay under Cyclic Loading with Principal Stress Rotation. Appl. Sci. 2021, 11, 8987. [Google Scholar] [CrossRef]
- Farhang, B.; Mirghasemi, A.A. A study of principle stress rotation on granular soils using DEM simulation of hollow cylinder test. Adv. Powder Technol. 2017, 28, 2052–2064. [Google Scholar] [CrossRef]
- Weng, X.; Zhao, Y.; Zhang, Y.; Li, H.; Liu, J. Test on deformation characteristics of loess under principal stress axis rotation. China J. Highw. Transp. 2018, 31, 9–16. (In Chinese) [Google Scholar] [CrossRef]
- Zhang, B.; Liu, Q.; Wang, D.; Zhang, W.; Zhou, Z.; Guo, W. Experimental study on the influence of initial stress state on the dynamic characteristics of frozen clay under principal stress rotation. J. Glaciol. Geocryol. 2024, 46, 1603–1611. [Google Scholar] [CrossRef]
- Gräbe, P.J.; Clayton, C.R. Effects of principal stress rotation on permanent deformation in rail track foundations. J. Geotech. Geoenviron. Eng. 2009, 135, 555–565. [Google Scholar] [CrossRef]
- Chen, D.; Ma, W.; Li, G.; Zhou, Z.; Mu, Y. A long-term strength criterion for frozen clay under complex stress states. Cold Reg. Sci. Technol. 2020, 176, 103089. [Google Scholar] [CrossRef]
- Zhao, Y.; Lai, Y.; Zhang, J.; Bai, R. A bounding surface model for frozen sulfate saline silty clay considering rotation of principal stress axes. Int. J. Mech. Sci. 2020, 177, 105570. [Google Scholar] [CrossRef]
- Zhang, B.-L.; Wang, D.-Y.; Zhou, Z.-W.; Ma, W.; Lei, L.-L. The Effect of Temperature on Dynamic Characteristics of Frozen Clay under Principal Stress Rotation. Adv. Mater. Sci. Eng. 2021, 2021, 16. [Google Scholar] [CrossRef]
- Zhang, B.; Wang, D.; Lei, L. Dynamic deformation characteristics of frozen clay under pure principal stress rotation. Arab. J. Geosci. 2022, 15, 281. [Google Scholar] [CrossRef]
- Hight, D.W.; Gens, A.; Symes, M.J.; Symes, M.J.P.R. Discussion: The development of a new hollow cylinder apparatus for investigating the effects of principal stress rotation in soils Un-drained anisotropy and principal stress rotation in saturated sand. Géotechnique 1985, 35, 78–85. [Google Scholar] [CrossRef]
- Bragg, R.A.; Andersland, O. Strain rate, temperature, and sample size effects on compression and tensile properties of frozen sand. Eng. Geol. 1981, 18, 35–46. [Google Scholar] [CrossRef]
- Seo, Y.-K.; Choi, H.-W. Experimental Study on Unconfined Compression Strength and Split Tensile Strength Properties in relation to Freezing Temperature and Loading Rate of Frozen Soil. J. Ocean. Eng. Technol. 2012, 26, 19–26. [Google Scholar] [CrossRef][Green Version]
- Chen, D.; Ma, W.; Wang, D.; Mu, Y.; Lei, L.; Wang, Y.; Zhou, Z.; Cai, C. Deformation test of frozen clay under directional shear stress path. Rock Soil Mech. 2018, 39, 2483–2490. [Google Scholar] [CrossRef]
- GB/T 50123-2019; Standard for Soil Test Methods. China Architecture & Building Press: Beijing, China, 2019.
Disclaimer/Publisher’s Note: The statements, opinions and data contained in all publications are solely those of the individual author(s) and contributor(s) and not of MDPI and/or the editor(s). MDPI and/or the editor(s) disclaim responsibility for any injury to people or property resulting from any ideas, methods, instructions or products referred to in the content. |
© 2025 by the authors. Licensee MDPI, Basel, Switzerland. This article is an open access article distributed under the terms and conditions of the Creative Commons Attribution (CC BY) license (https://creativecommons.org/licenses/by/4.0/).