Article

Modeling of Oil–Water Two-Phase Flow in Horizontal Pipes Using CFD for the Prediction of Flow Patterns

by
Octavio Andrés González-Estrada
1,*,
Santiago Hernández
2 and
Germán González-Silva
3
1
School of Mechanical Engineering, Universidad Industrial de Santander, Bucaramanga 680002, Colombia
2
School of Chemical Engineering, Universidad Industrial de Santander, Bucaramanga 6800002, Colombia
3
School of Petroleum Engineering, Universidad Industrial de Santander, Bucaramanga 6800002, Colombia
*
Author to whom correspondence should be addressed.
Eng 2024, 5(4), 3316-3334; https://doi.org/10.3390/eng5040173
Submission received: 21 November 2024 / Revised: 6 December 2024 / Accepted: 9 December 2024 / Published: 11 December 2024
(This article belongs to the Special Issue GeoEnergy Science and Engineering 2024)

Abstract

:
A computational fluid dynamics study of the horizontal oil–water flow was performed using the Eulerian–Eulerian and mixture multiphase models in conjunction with the realizable kε turbulence model for the characterization of flow patterns. The experimental tests were carried out using water and mineral oil with a density of 880 kg/m3 and a viscosity of 180 cP, varying the superficial velocities of both fluids in ranges of 0.1–1.2 m/s and 0.1–0.5 m/s, respectively. The numerical model was defined under the same initial and boundary conditions as in the experiment. Moreover, the model is defined such that entering the fluids in a mixed state, the stratified pattern could form adequately with the two multiphase models. Although the Eulerian–Eulerian model, together with the geometric reconstruction scheme, allowed us to visualize the three-dimensional dispersed patterns in a very similar way to the experimental results, the mixture model did not exhibit such similarity, especially in the oil-in-water dispersions. Additionally, the Eulerian–Eulerian model was able to predict the experimental holdup values with an average error of 15.2%.

1. Introduction

Oil–water multiphase flows are critical to numerous industries, including petrochemical, oil and gas, and wastewater management. These flows occur frequently in pipelines, separators, and reactors, where an accurate understanding of flow behavior is crucial for optimizing transportation efficiency, minimizing energy losses, and ensuring operational safety [1]. For instance, flow pattern transitions, such as from stratified to dispersed regimes, can significantly alter pressure drop, mixing efficiency, and heat transfer. In the oil and gas sector, these transitions directly impact pipeline design, pumping power requirements, and the risk of corrosion or erosion caused by improper flow conditions [2]. Studies such as [3,4] have highlighted the challenges in predicting flow patterns under varying operational conditions, such as changes in inclination, roughness, and fluid properties.
Beyond traditional applications, the accurate modeling of multiphase flows is becoming increasingly relevant for advanced energy systems, such as enhanced oil recovery (EOR) techniques and hydrogen transportation, where multiphase interactions play a key role [5]. Moreover, in the wastewater treatment industry, understanding oil–water flows is essential for the design of efficient separation systems that improve water quality while reducing environmental impact [6]. As operational conditions in pipelines and separation systems become more complex, the ability to predict and manage multiphase flows with high accuracy becomes indispensable for both economic and environmental reasons.
Many studies have been conducted on multiphase flows, but most of them have concerned the interaction between liquid and gas through experimental analysis of water–air flows. Lately, the characterization of oil–water two-phase flow has gained increased interest due to the search for improved transportation of off-shore oils. Unlike single-phase flow, when two or more phases flow simultaneously in a pipe or duct, the phases distribute in a particular way following certain flow patterns [7], which influence the pressure drop [8] and the heat transfer properties [9,10] of the bulk flow.
There have been several attempts to identify oil–water flow patterns, but there is not yet a single set of patterns that have been universally obtained. Trallero et al. [11] and Flores et al. [12] carried out significant attempts to standardize the regimes of oil–water flow through horizontal and inclined pipes, respectively, including flow-pattern maps with superficial velocity coordinates that nowadays are still used as references. The oil–water flow through horizontal pipes was classified into six patterns [11]: stratified flow (ST), stratified with mixing in the interface (ST & MI), dispersion of oil in water and water (Do/w & w), dispersion of water in oil and oil in water (Dw/o & Do/w), emulsion of oil in water (o/w), and emulsion of water in oil (w/o). Moreover, Flores et al. [12] observed that stratified flow was not present in experiments with inclination above 33° and classified the vertical flow patterns into two important types, water-dominated and oil-dominated patterns; whatever the dominating phase, there were observed three possible configurations of the discontinuous phase: very fine dispersion, dispersion in the shape of drops, and churn flow. Despite the acceptance of these flow pattern categorizations, many other flow patterns are observed in the literature, as Brauner [13] mentioned, who reported eighteen possible flow patterns in horizontal systems. Also, a more comprehensive range of flow patterns could be developed depending on the oil viscosity and specific properties of the pipe’s inner surface, like hydrophobic or hydrophilic behavior. Some studies have stated that the Eötvös number, the dimensionless number that quantifies the relationship between the gravitational forces and the surface tension forces, influences the development of certain flow patterns like slug/annular flow [13] or bubbly flow [14].
One of the most interesting flow patterns is the core annular flow (CAF) because of its potential use in oil extraction, reducing the pressure drop. When the oil flows through a core in the inner pipe surrounded totally by the water flow, the minor viscosity of the water minimizes the resistance due to the contact with the pipe. Annular pattern formation is commonly aided by special injectors [15], but it has also been observed in studies performed with conventional tee mixers using high-viscosity oils [16].
Currently, to reduce processing times, flow pattern prediction through flow pattern maps tends to be unused, as it is not easy to integrate the viscosity and interfacial tension dependence in the pattern transitions. Recent studies have focused on the development of artificial neural networks (ANN) to predict diverse parameters of oil–water flow, such as the holdup [17,18], the pressure drop [19,20], and even the heat exchange [10], through the input of parameters such as the superficial velocities of oil and water and relevant properties of the oil and the pipe. Wu et al. [21] implemented a back-propagation neural network and a fuzzy inference system (FIS) to predict the flow pattern given the inclination, the total flow rate, and the water cut, and concluded that the predictions made by FIS were more accurate. Recent advancements in machine learning, such as the use of long short-term memory (LSTM) [22,23] or transformer [24] neural networks, have demonstrated significant potential in predicting key parameters of liquid–liquid two-phase flows, including volume fraction, as seen in models trained on extensive experimental datasets with high accuracy and minimal errors.
As the characterization of oil–water flow behavior tends to be predicted using ANN, the construction of a large reliable database that feeds the neural networks becomes more important, and, despite the numerous experiments made in this area, they may still be insufficient to describe the influence of certain oil properties over a wide range [25]. The numerical modeling of oil–water flow through CFD appears as an alternative to physical experimentation, allowing a more extensive dataset to be used as training samples for more accurate predictions of neural networks.
The greater flexibility in flow conditions that CFD allows is limited by the mathematical model used in the simulation [26]. The Eulerian analysis of multiphase flows allows better capture of the interface between fluids, and thus, models of this type are especially recommended for oil–water flows. Al-Yaari and Abu-Sharkh [27] compared the prediction of the stratified pattern from three Eulerian multiphase models using the RNG kε turbulence model. They concluded that VOF (volume of fluid) is the one that most efficiently obtains an adequate interface between water and oil. Likewise, more recent studies [28,29] have tested the VOF mathematical model in conjunction with different turbulence models to evaluate smooth (ST) and wavy (SW) stratified flow, and determined that acceptable interface profiles can be obtained in addition to accurate pressure drop values and velocity profiles. However, the stratified pattern in oil–water flows is not the only one that can be observed from the VOF model. Desamala et al. [30] also used this VOF model in a 2D simulation of mixing and development of the two-phase flow in horizontal pipes and were able to predict, under certain conditions, not only stratified flow but also other patterns such as annular, slug, and even early signs of dispersion at the interface. In the attempt to model the core–annular flow in 3D, Shi et al. [31,32] showed that the wall contact angle affected its formation by conventional mixing of the fluids. They concluded that, although the VOF model, in conjunction with the SST kω scheme, captures the annular interface well, it fails to accurately determine pressure drops, especially with highly viscous fluids.
Even when the VOF scheme is shown as the most suitable approach to model oil–water flow patterns, it is not capable of satisfactorily simulating two-phase flow in a dispersed regime, because it tends to require more refined grids to compensate for the smaller interface scales [31]. Also, as it considers the mixture as a single fluid with variable composition, it ignores the interfacial forces originating from the interaction of a discrete phase with a continuous one. The Eulerian–Eulerian scheme, in which the balance equations are carried out for each phase separately, is the most used for flow simulations with a continuous and a dispersed phase, because it has already been shown that, when integrating the different interfacial forces in their model, the distribution of the phases in the pipe resembles that observed experimentally [33]. A constantly studied topic regarding dispersion in water–oil flows is the influence of interfacial forces, such as drag force, shear-lift force, virtual mass force, and turbulent dispersion force, on the accuracy of the model. Rashmi [34] observed that in horizontal flow, the inclusion of the lift force and the turbulent dispersion force in the computational model did not significantly influence the radial distribution of the phases in the pipe, since drag was the determining force in the droplet distribution. On the other hand, Parvini et al. [35] established that both lift and turbulent dispersion forces affected the vertical-flow droplet distribution of dispersion in water–oil systems. In a similar work, Burlutskiy and Turangan [36] used an Eulerian–Lagrangian model in vertical flow configuration and obtained accurate pressure drop values by appropriately modeling the shear-lift force.
Despite significant advancements in modeling oil–water multiphase flows, several research gaps remain. Many studies focus on specific flow regimes, such as stratified or core–annular flows, but struggle to provide accurate predictions across a wide range of flow patterns, particularly in dispersed regimes where interfacial dynamics and droplet behavior are critical. Additionally, while volume of fluid (VOF) and mixture models have been extensively used, their limitations in handling complex phase interactions in dispersed flows necessitate further exploration of alternative approaches, such as the Eulerian–Eulerian model, to improve prediction accuracy. Studies carried out with the Eulerian–Eulerian model have shown that it is capable of accurately characterizing the stratified flow in terms of phase distribution [37], pressure drop, and holdup [38], such that this multiphase model could be used to predict a great variety of existing patterns in the water–oil flow.
Another gap lies in the limited availability of comprehensive experimental datasets to validate numerical models, particularly for flow regimes with high turbulence or significant phase mixing. While recent advancements in artificial neural networks (ANN) have demonstrated promise in predicting flow characteristics such as holdup and pressure drop, the integration of CFD-generated data to enhance ANN training remains underexplored. Leveraging high-fidelity CFD simulations as training datasets could significantly improve the predictive capability of machine learning models, particularly in scenarios with limited experimental data.
This study aims to address these gaps by developing and validating CFD models to accurately predict a broad spectrum of oil–water flow patterns in horizontal pipes. The research emphasizes the use of the Eulerian–Eulerian and mixture multiphase models to evaluate their performance across diverse flow regimes, generating datasets that can support future ANN-based predictions. By integrating experimental validation with comprehensive numerical simulations, this work enhances the understanding of oil–water flow dynamics while advancing the potential synergy between CFD and machine learning techniques. The horizontal oil–water flow simulations employ the Eulerian–Eulerian and mixture models coupled with the realizable kε turbulence model across a wide range of superficial velocities, enabling the identification of not only segregated flow patterns but also dispersed flows under specific conditions.

2. Methods and Materials

The development of the model consists of three fundamental parts. The first part involves the experimental setup, which is used to capture oil–water flow patterns and obtain data for model validation. The second part focuses on the evaluation and choice of the most suitable mathematical models to predict different flow patterns. Finally, the preprocessing, definition, and implementation of the numerical simulation are performed. The validation of the model is carried out by comparing the numerical results with experimental observations of oil–water flow patterns. Figure 1 presents the flowchart describing the methodology used.

2.1. Experimental Setup

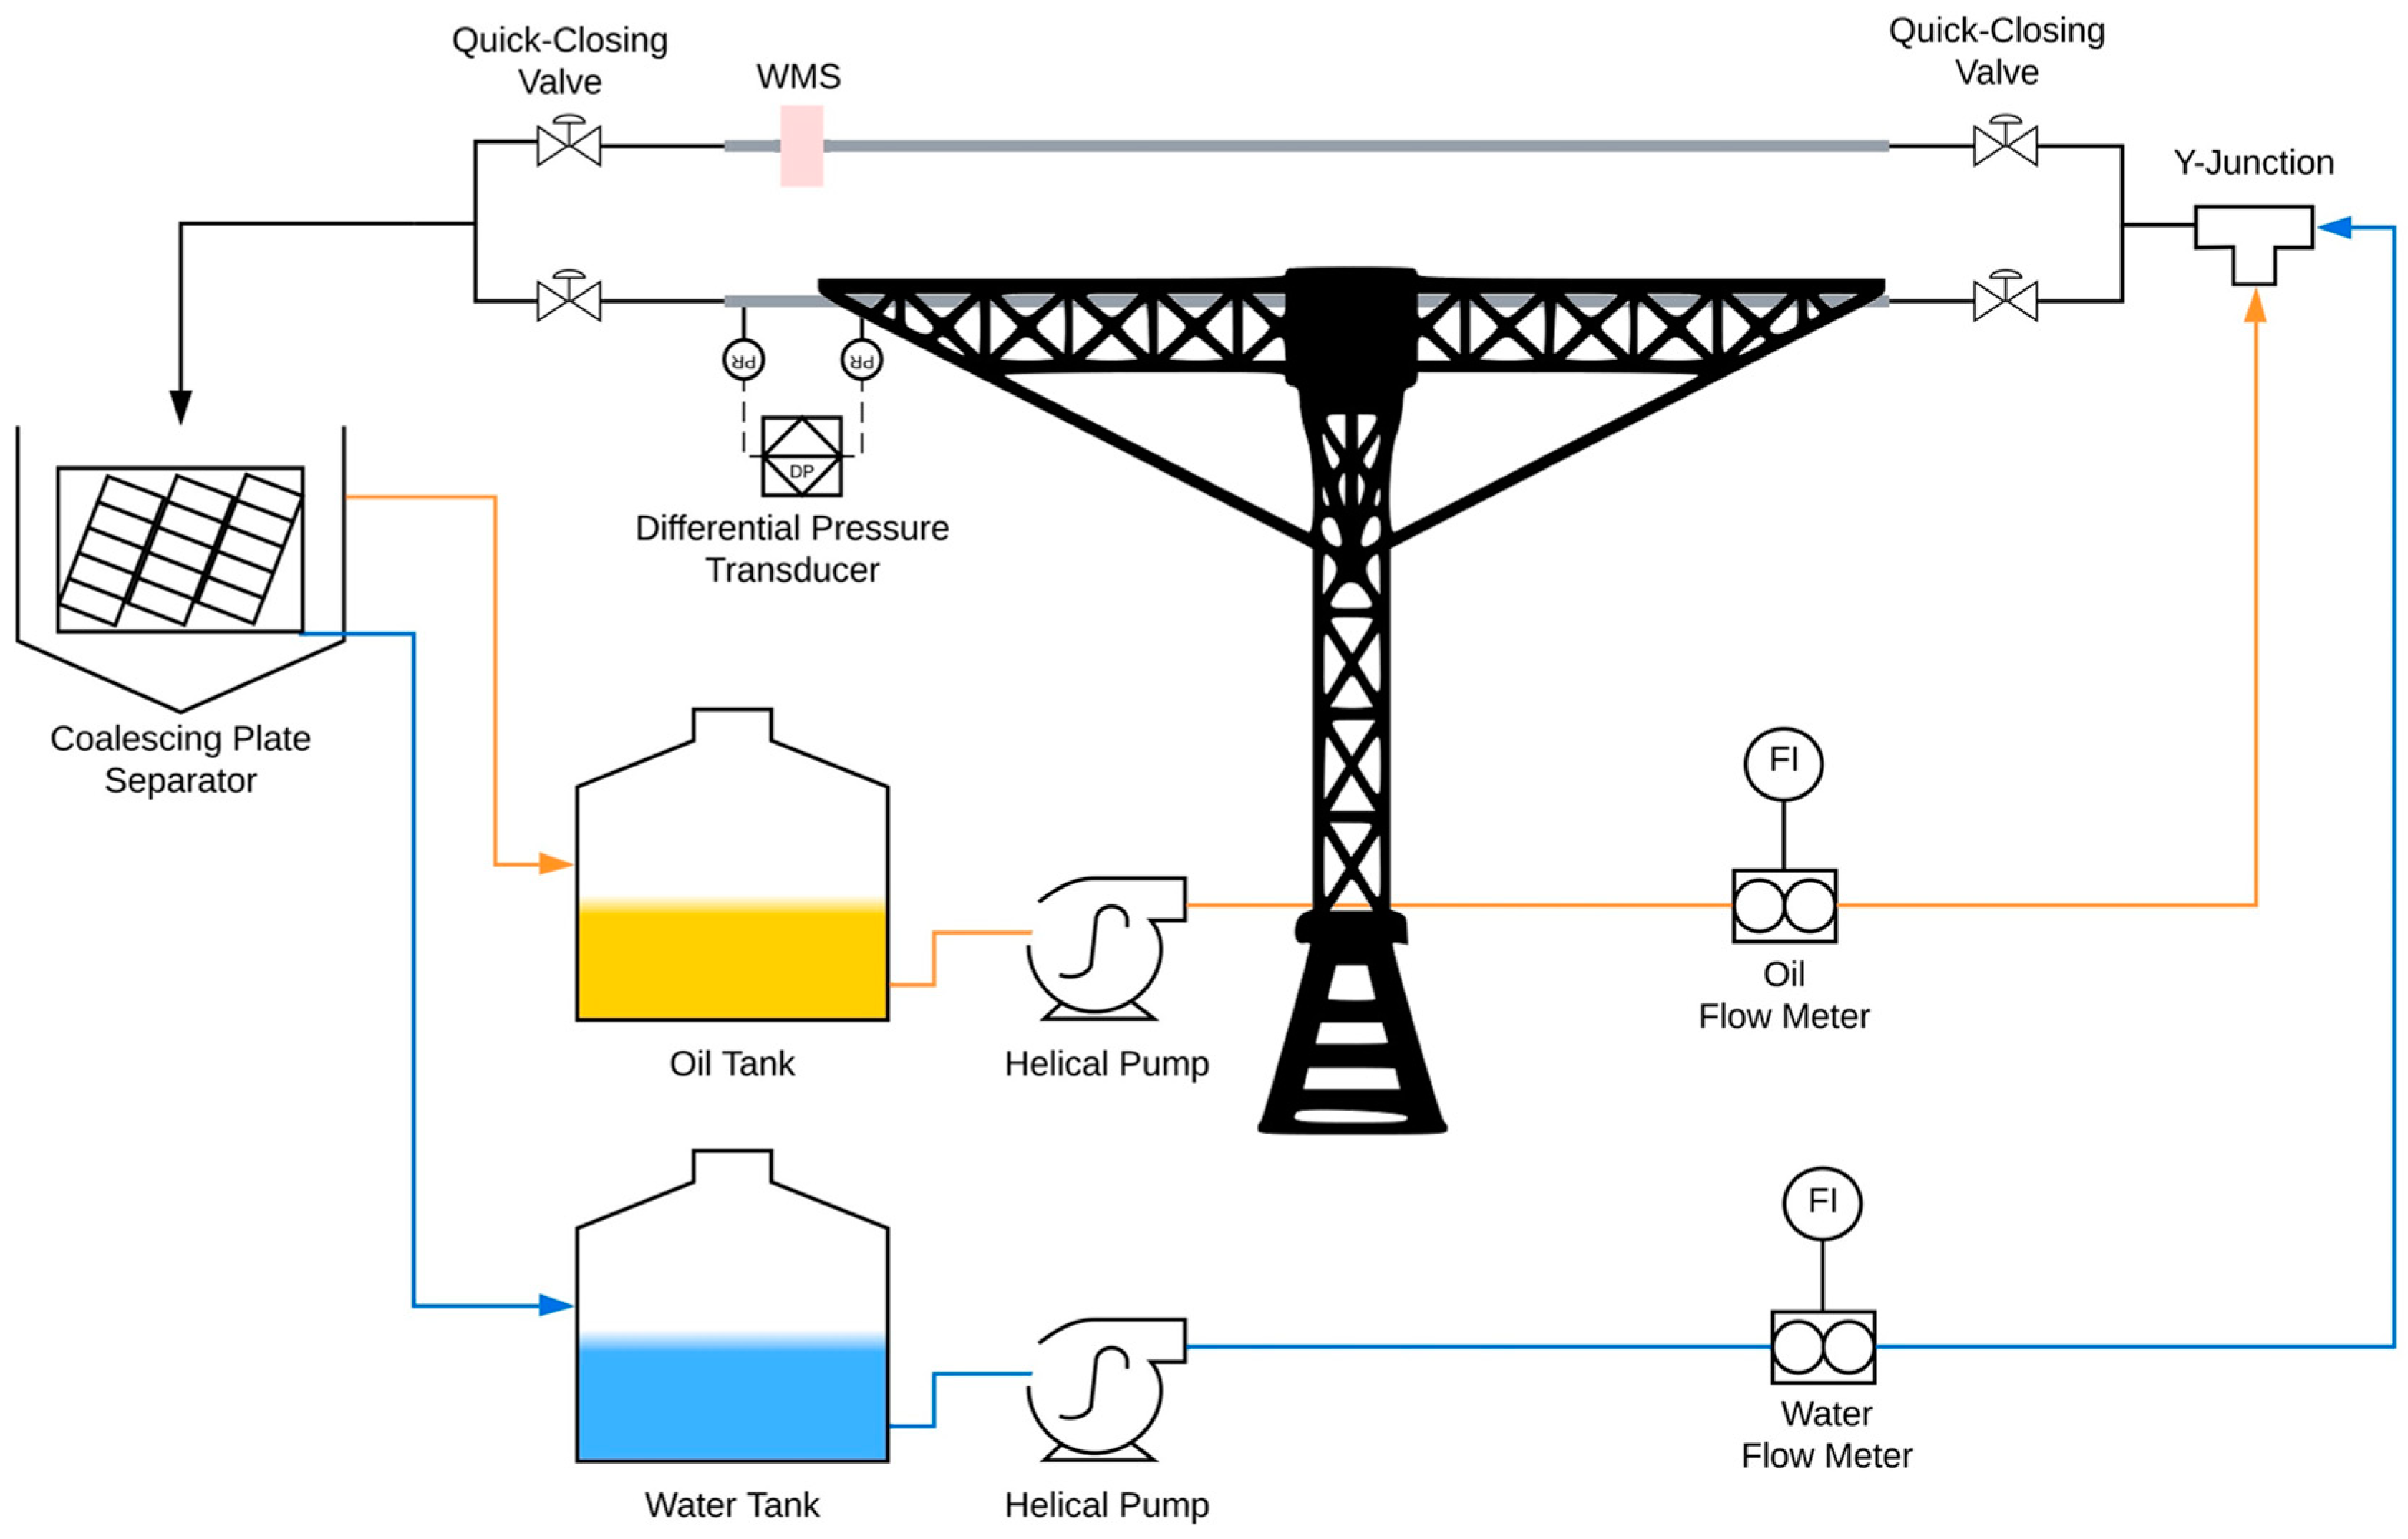
The experimental flow patterns used for the validation of the model were obtained in the experimental bench of the Industrial Multiphase Flow Laboratory (LEMI) [17,39]. The assembly of the equipment on this bench, schematized in Figure 2, besides achieving the mixing of water and oil flows through a Y joint, allows accurate measurements of average holdups and the capture of phase distribution in the cross-section employing a wire mesh sensor (WMS).
In the experiments, water with a viscosity of 1 cP and a density of 997 kg/m3 and LUBRAX Turbine 100 mineral oil with a viscosity of 180 cP and a density of 880 kg/m3 were used. The borosilicate pipe to visualize the patterns was kept horizontal in all the experiments and had dimensions of 12 m length and 25.4 mm internal diameter.
Regarding the flows to handle, experiments were carried out by varying the superficial velocities of both fluids, water in a range of 0.1 to 1.2 m/s and oil in a range of 0.1 to 0.5 m/s, selecting the conditions in which the different patterns are most clearly identified.

2.2. Mathematical Model

2.2.1. Eulerian Approach to Multiphase Flow

Multiphase models analyze the secondary phases either through an Eulerian or a Lagrangian approach. While the Lagrangian approach analyzes each discrete volume individually in such a way that the distribution of the involved phases is obtained by resolving the flow interaction with all the respective elements, the Eulerian models consider the entire medium as a continuous system, allowing the different phases to occupy the same position in space by making use of the concept of volume fraction [40]. An Eulerian approach is used to formulate the present CFD model, beginning with the comparison of two multiphase models that have shown to be capable of modeling the behavior of the flow in stratified and dispersed regimes, the mixture model and the Eulerian–Eulerian.
The main difference between the Eulerian models is presented in the way the velocity in each phase is calculated. Just as the VOF model is the simplest computationally since it considers that all the phases share the same velocity field, it also prevents widely studied effects in multiphase flow, such as slip ratio and interfacial forces, from showing up. On the other hand, the mixture model has the peculiarity that, although it solves a single Navier–Stokes equation in the momentum balance, it does not handle a single velocity profile for all phases. The continuity and momentum equations are applied to the entire mixture and are solved simultaneously to track the weight-averaged velocity v m , from which is obtained the specific velocity profile for each phase:
t ρ + ρ v m = 0
t ρ v m + ρ v m v m = P + μ v m + v m T + τ D m + ρ g + S M
v m = α i ρ i v i ρ
ρ = α i ρ i ;           μ = α i μ i
where α i , ρ i , and μ i are the volume fraction, density, and viscosity of a singular phase i , and ρ and μ are the mixture properties, obtained as a volume-fraction average of individual phases properties, as shown in Equation (4). The vector S M , in Equation (2), represents the sum of all possible external sources of momentum per unit volume, while the stress tensor τ D m contains the diffusion stresses due to phase slip and depends on the drift velocities v d r , i that relate the individual velocities v i to the average velocity, as expressed below:
v d r , i = v i v m
τ D m = α i ρ i v d r , i v d r , i
Physically, the drift velocities are not as decisive in the interaction between phases as the relative (slip) velocities. Therefore, through simplifications of the momentum equation for each secondary phase j , the respective slip velocities relative to the primary phase k can be determined. The drift velocities can be calculated by knowing the slip velocities of all the secondary phases, as shown in Equation (7). The expression to obtain the relative velocities v i k , shown in Equation (8), includes some interfacial flow phenomena to the model, as the first term of this expression represents the relationship between the relative velocity and drag, and the second term includes the effect of diffusion due to turbulent fluctuations.
v d r , j = v j k i j n α i ρ i v i k ρ
v i k = v i v k = 4 d i 3 C D v m ρ i ρ ρ k g v m v m v m t η t σ t α i α i α k α k
To track the composition through the flow, the mixture model requires as many continuity equations as the number of phases, and, in addition to the mixture continuity equation, a volume fraction equation is used for each secondary phase, deduced from the differential mass balance of these phases individually:
t α i ρ i + α i ρ i v m = S α , i α i ρ i v d r , i
where S α , i accounts for any volumetric source of the phase mass. Finally, the Eulerian–Eulerian model is more complex since it performs the mass and momentum balance for each component separately, which requires the discretization of additional momentum equations and, in addition to keeping track of the volume fractions, tracks a specific velocity profile for each phase ( v i ). In this way, for each phase in a multiphase flow without mass transfer, the conservation equations yield:
t α i ρ i + α i ρ i v i = S α , i
t α i ρ i v i + α i ρ i v i v i = α i P + τ i + α i ρ i g + F i n t , i + S M , i
F i n t , i = F d r a g , i + F l i f t , i + F w l , i + F v m , i + F t d , i
where F i n t , i is the sum of all interfacial forces, including drag force, shear-lift force, wall lubrication force, virtual mass force, and turbulent dispersion force. S M , i represents any phase fraction source of the moment due to the action of external forces, and τ i is the viscous stress tensor produced in each phase, which is determined as follows for incompressible fluids:
τ i = α i μ i v i + v i T
As for the interfacial forces, each one has a respective mathematical model. The drag force F d r a g , i is the most determinant in horizontal liquid–liquid flow, not only in the distribution of drops in the dispersed pattern but also in the formation of drops in the pattern transition [41]. Expressions to calculate the drag force in droplets are shown in Equation (14), where C D is the drag coefficient, d i is the droplet diameter, a i n t is the interfacial area concentration, and the density is evaluated in the continuous phase k .
F d r a g , i = 3 4 C D ρ k α i d i v k v i v k v i = C D ρ k a i n t 8 v k v i v k v i
Research in recent decades has focused on developing adequate correlations of the drag coefficient. However, most works have opted to generalize the drag of fluid-dispersed elements based on the interaction of air bubbles in the water. Although not many works focused on the dispersion of droplets in a liquid matrix have succeeded in obtaining the drag coefficient for a wide variety of flow conditions, the use of specific correlations of liquid–liquid flow allows the attainment of better results in CFD modeling of oil–water dispersion [34]. The work of Rusche and Issa [42] is the latest attempt to correlate the drag coefficient for a wide variety of fluids and flow conditions, obtaining the expression in Equation (15) for droplet dispersion drag in a liquid medium.
C D = C D 0 exp 2.1 α i + α i   0.249
C D 0 = 24 R e 1 + 0.15 R e 0.687                   R e ρ k d i v k v i μ k 1000 0.44                                                                                 R e ρ k d i v k v i μ k > 1000
The other interfacial forces must be interpreted carefully, as their influence may vary depending on the case studied. For instance, the virtual mass force F v m is presented by the effect of inertia that the particulate elements perceive when trying to accelerate with respect to the continuous phase, as represented in Equation (17). However, when evaluating a continuous flow through a pipe, this force is not significant and is not worth including in the model unless the dispersed phase is much less dense.
F v m , i = 0.5 ρ k α i D D t v k D D t v i
Another case is that of lift, wall-lubrication, and turbulent dispersion forces, since these are mainly radial forces. The lift force F l i f t is produced by the net effect of the stresses generated on the surface of the particle due to the variation of the speed in the medium, as expressed in Equation (18). However, as none of the numerical models for the C L coefficient value is fully reliable for bubbles or droplets, the value of 0.5, valid for inviscid flow, tends to be used in the CFD models. The wall-lubrication force ( F w l ) tends to push the dispersed material inside the pipe, being responsible for generating a thin layer of fluid free of particles in the vicinity of the walls, while the turbulent dispersion force ( F t d ) tends to homogenize the distribution of dispersed material. The effect of these forces has been studied mostly in bubble column flow because, in dispersed horizontal flow, the net force in the radial direction is also affected by buoyancy. In this way, it has been observed in the oil–water flow that the action of lift and turbulent dispersion has minimum effect on the distribution of drops in horizontal flow [34], while wall lubrication tends to be effective for a layer of thickness comparable to a drop diameter [43], so they become irrelevant in the present model, whose objective is to identify the different patterns in flows of this nature.
F l i f t , i = C L ρ k α i v k v i × × v k
F w l , i = C w l ρ k α i d i v k v i n ^ z 2 n ^ r
F t d , i = C T D C D A i n t v k v i η t σ i k α i α i α k α k

2.2.2. Interfacial Area Concentration

The multiphase models studied can handle dispersed phases as long as the particle diameter, a determining property in the calculation of interfacial forces, is known. When analyzing the dispersed regimes in liquid–liquid flow, the dispersed fluid is divided into drops due to the high energy present in the medium, mainly due to turbulence. Brauner [44] applied the critical Weber number to deduce the maximum diameter to maintain a dispersed droplet in the flow without breaking and established a critical diameter over which the dispersed phase is not maintained naturally, managing to precisely predict the pattern transition from stratified to dispersed.
d m a x D = 7.61 W e c 0.6 R e c   0.08 ϵ d ϵ c 0.6 1 + ρ d ϵ d ρ c ϵ c 0.4
d m a x 7.61 D ρ c D μ c σ 0.52 σ 0.08 μ c   0.6 J d J c J d + J c 1.12 1 + ρ d J d ρ c J c 0.4
where W e is the Weber number, ϵ is the holdup, J is the superficial velocity, and the subscripts c and d represent the continuous and dispersed phase, respectively. Although the particle diameter is ideal for characterizing a completely dispersed material, since there is the possibility that the secondary phase flows as a continuum, it is more convenient to work with the interfacial area concentration, which can be modified in such a way that it identifies the dispersion-free zones. Equation (23) shows the conventional expression for the interfacial area concentration in flows strictly composed of a continuous phase and a spherical-shaped dispersed phase.
a i n t = A i n t V   α i α i = α i   π d i   2 π d i   3 / 6 = 6 α i d i
The assumption of spherical shape is also applicable to droplet dispersion, but due to liquid phases’ ability to present as continuous media, the symmetry model tends to be used for the calculation of interfacial area concentration in liquid–liquid flow, because it modifies the original expression so that the concentration can take the value of zero in case any of the two phases present a volume fraction equal to 1.
a i n t = 6 α i 1 α i d i

2.2.3. Turbulence Model

The realizable kε turbulence model, applied to this work, is a variation of the conventional kε model that applies corrections to the former one, aiming to ensure that it is realizable even in regions of high mean strain rate. Models of this type, like the also widely known kω model and its variations, are known as Reynolds averaged methods because, to consider the fluctuations generated by turbulence, the flow velocity is separated into two components, an average velocity field v ¯ and the fluctuating velocity v , which, when replaced in the momentum balance equation, result in an equation known as Reynolds-averaged Navier–Stokes (RANS), shown in Equation (25), very similar to the conventional Navier–Stokes equation but with the appearance of an additional variable known as the Reynolds stress tensor ( τ R ). At the physical level, the existence of this tensor is due to the presence of turbulent fluctuations, unlike the other terms, expressed as functions of the average velocity, so for the full development of the equation, it is necessary to approximate this tensor in terms of the average velocity through expressions known as closure relations.
t ρ v ¯ + ρ v ¯ v ¯ = P + μ v ¯ + v ¯ T + τ R + ρ g + S M
τ i j R = ρ v i v j ¯ μ t v i ¯ x j + v j ¯ x i 2 3 ρ δ i j k
The simplest complete turbulence models work with closure relations using an eddy-viscosity (µt) approximation, as seen in Equation (26), and their research is based on finding the most suitable way to model this turbulent viscosity from the turbulent kinetic energy ( k ) and its dissipation into thermal energy. While the kω turbulence models handle a specific variable for dissipation rate ( ω ), the kε equations keep track of the total turbulence dissipation rate ( ε ), determining the eddy viscosity as shown below.
μ t = ρ C μ k 2 ε
where C μ is a constant equal to 0.09 in the conventional kε model. However, the main modification that Shih et al. [45] implemented to make the model realizable was to convert this constant into a variable whose value depends on the mean strain rate ( S ) and mean rotation rate ( Ω ) tensors. The variable C μ ends up being determined as follows.
C μ = 1 4.04 + 6 cos φ U * k ε
U * = S i j S i j + Ω i j Ω i j   ,     φ = 1 3 arccos 6 W   ,     W = S i j S j k S k i S ~ 3
S i j = 1 2 v i ¯ x j + v j ¯ x i   ,     Ω i j = 1 2 v i ¯ x j v j ¯ x i
To finish determining the effect of turbulence along the flow, the two characteristic model variables ( k and ε ) are tracked following their balance equations and are solved simultaneously with the mass and momentum conservation equations. These turbulence-governing equations are expressed in Equations (31) and (32).
D ρ k D t ρ k t + ρ k v = μ + μ t σ k k + τ R : S ρ ε
D ρ ε D t ρ ε t + ρ ε v = μ + μ t σ ε ε + ρ C 1 S ¯ ε ρ C 2 ε 2 k + ν ε
C 1 = max 0.43   ,   η η + 5   ,     η = S ¯ k ε
where C 2 = 1.9 , σ k = 1 , and σ ε = 1.2 , while the variables S ¯ and S ~ represent the mean and the RMS strain rate, respectively, calculated as shown in Equation (34):
S ¯ = 2 S i j S i j   ,     S ~ = S i j S i j

2.3. Numerical Model and Mesh Generation

The geometry used in the model consists of a horizontal pipe with a 0.025 m internal diameter and a length of 1.5 m, sufficient to allow the flow pattern to develop. The flow is assumed to enter as a fully mixed emulsion with no initial phase sliding, allowing the inlet volume fraction and velocity of each fluid to be determined using the superficial velocities:
V w = V o = J w + J o ,
ϵ w = A w A = J w J w + J o   ;               ϵ o = A o A = J o J w + J o ,
where J w and J o are the superficial velocities of water and oil, respectively, and ϵ w and ϵ o are the holdups at the inlet, equivalent to the respective volume fractions. Boundary conditions include a no-slip wall condition for the lateral face of the pipe and a zero-gauge pressure outlet condition.
For the mesh, an O–H structured mesh is used in the input section and extended along the pipe length. The mesh consists entirely of hexahedral elements, with a slight refinement near the wall to capture boundary layer effects, as shown in Figure 3.
The transient flow was solved using both the mixture and Eulerian–Eulerian multiphase models, with drag included as the only interfacial force. The Rusche–Issa drag correlation was employed in Ansys Fluent [46], selected for its proven accuracy in simulating dispersed flows. The realizable kε turbulence model was used, with the initial turbulence intensity calculated from Equation (37):
I t = 0.16 R e 1 / 8   ;                     k 0 = 3 2 I t v 0 2
For time discretization, a transient solver was employed with a time step size of 10−4 s, determined to satisfy the Courant–Friedrichs–Lewy (CFL) condition. The total simulation time was set to 3.5 s to allow stabilization of the flow pattern. QUICK second-order schemes were used for spatial discretization of field variables, ensuring numerical accuracy while reducing diffusion errors. The SIMPLE and PC-SIMPLE algorithms were applied for pressure–velocity coupling in the mixture and Eulerian–Eulerian models, respectively. Convergence was monitored by residuals, with a threshold of 10−4 for continuity, momentum, and turbulence equations. The simulations were performed on an Intel Core i9 processor with 128 GB RAM.

Mesh Independence Test

For the mesh independence test, six different meshes are generated through uniform refinements in the entire volume, increasing the number of elements between 1.5 and 3 times. Table 1 shows the number of elements in each mesh, using the axial velocity at the center of the outlet section as the analysis variable. The error is calculated as the relative error between the velocities obtained in each distribution and the immediate coarser mesh. The numerical models are performed using the Eulerian–Eulerian model with superficial velocities of 0.915 m/s and 0.309 m/s for water and oil, respectively, for a flow time of 3.5 s.
As noted in Table 1, a consistently low relative error is maintained across all meshes. Notably, when comparing axial velocities, finer meshes result in velocity stabilization at approximately 1.6 m/s. Mesh E (475,200 cells) is chosen for detailed observation due to its representative behavior, as subsequent refinements show limited improvement in accuracy relative to the considerable increase in computational cost associated with the model.

3. Results

Model Validation

For validation of the model, experimental data obtained by Hernández and Ruiz-Diaz [39] are used, with a set of seven cases having six different flow patterns, to evaluate the robustness of the model when predicting the patterns. The operational conditions in which the reference patterns were developed are found in Table 2.
The inlet condition forces the flow to enter as a uniform dispersion, for which the phase with the lowest surface velocity is considered as the dispersed fluid, modeled from the symmetric interfacial area concentration model with the droplet size based on the maximum diameter estimated by Brauner [44], but limited to a maximum value of 0.1 D .
The flow patterns listed in Table 2 represent distinct regimes of oil–water flow observed in horizontal pipes. Each pattern is characterized by specific phase distributions and interfacial behaviors. In stratified flow (ST), the two phases (oil and water) are fully separated, with the denser water phase occupying the lower portion of the pipe and the lighter oil phase settling above it. There is minimal interaction between the phases, and the interface remains relatively stable. Stratified with mixing (ST & MI) is similar to stratified flow but exhibits mild mixing at the interface due to increased turbulence or higher superficial velocities. The interface may become wavy, and small droplets of one phase can occasionally appear in the other phase near the boundary. Dispersed oil-in-water (Do/w) is a regime where oil droplets are dispersed within the continuous water phase. The degree of dispersion increases with higher turbulence, resulting in smaller droplets. The flow appears more homogenous, with limited phase separation. Dispersed oil-in-water with water (Do/w & w) represents a transitional pattern where the oil phase is primarily dispersed in water, but a continuous water phase coexists alongside dispersed oil droplets. This pattern often forms under moderate turbulence conditions. Similarly, dispersed water-in-oil with oil (Dw/o & o) has a water phase that is primarily dispersed in oil. Finally, in dispersed water-in-oil (Dw/o), the continuous phase is oil, with water droplets dispersed throughout. This pattern occurs when the water fraction is lower, and the system is dominated by the oil phase.
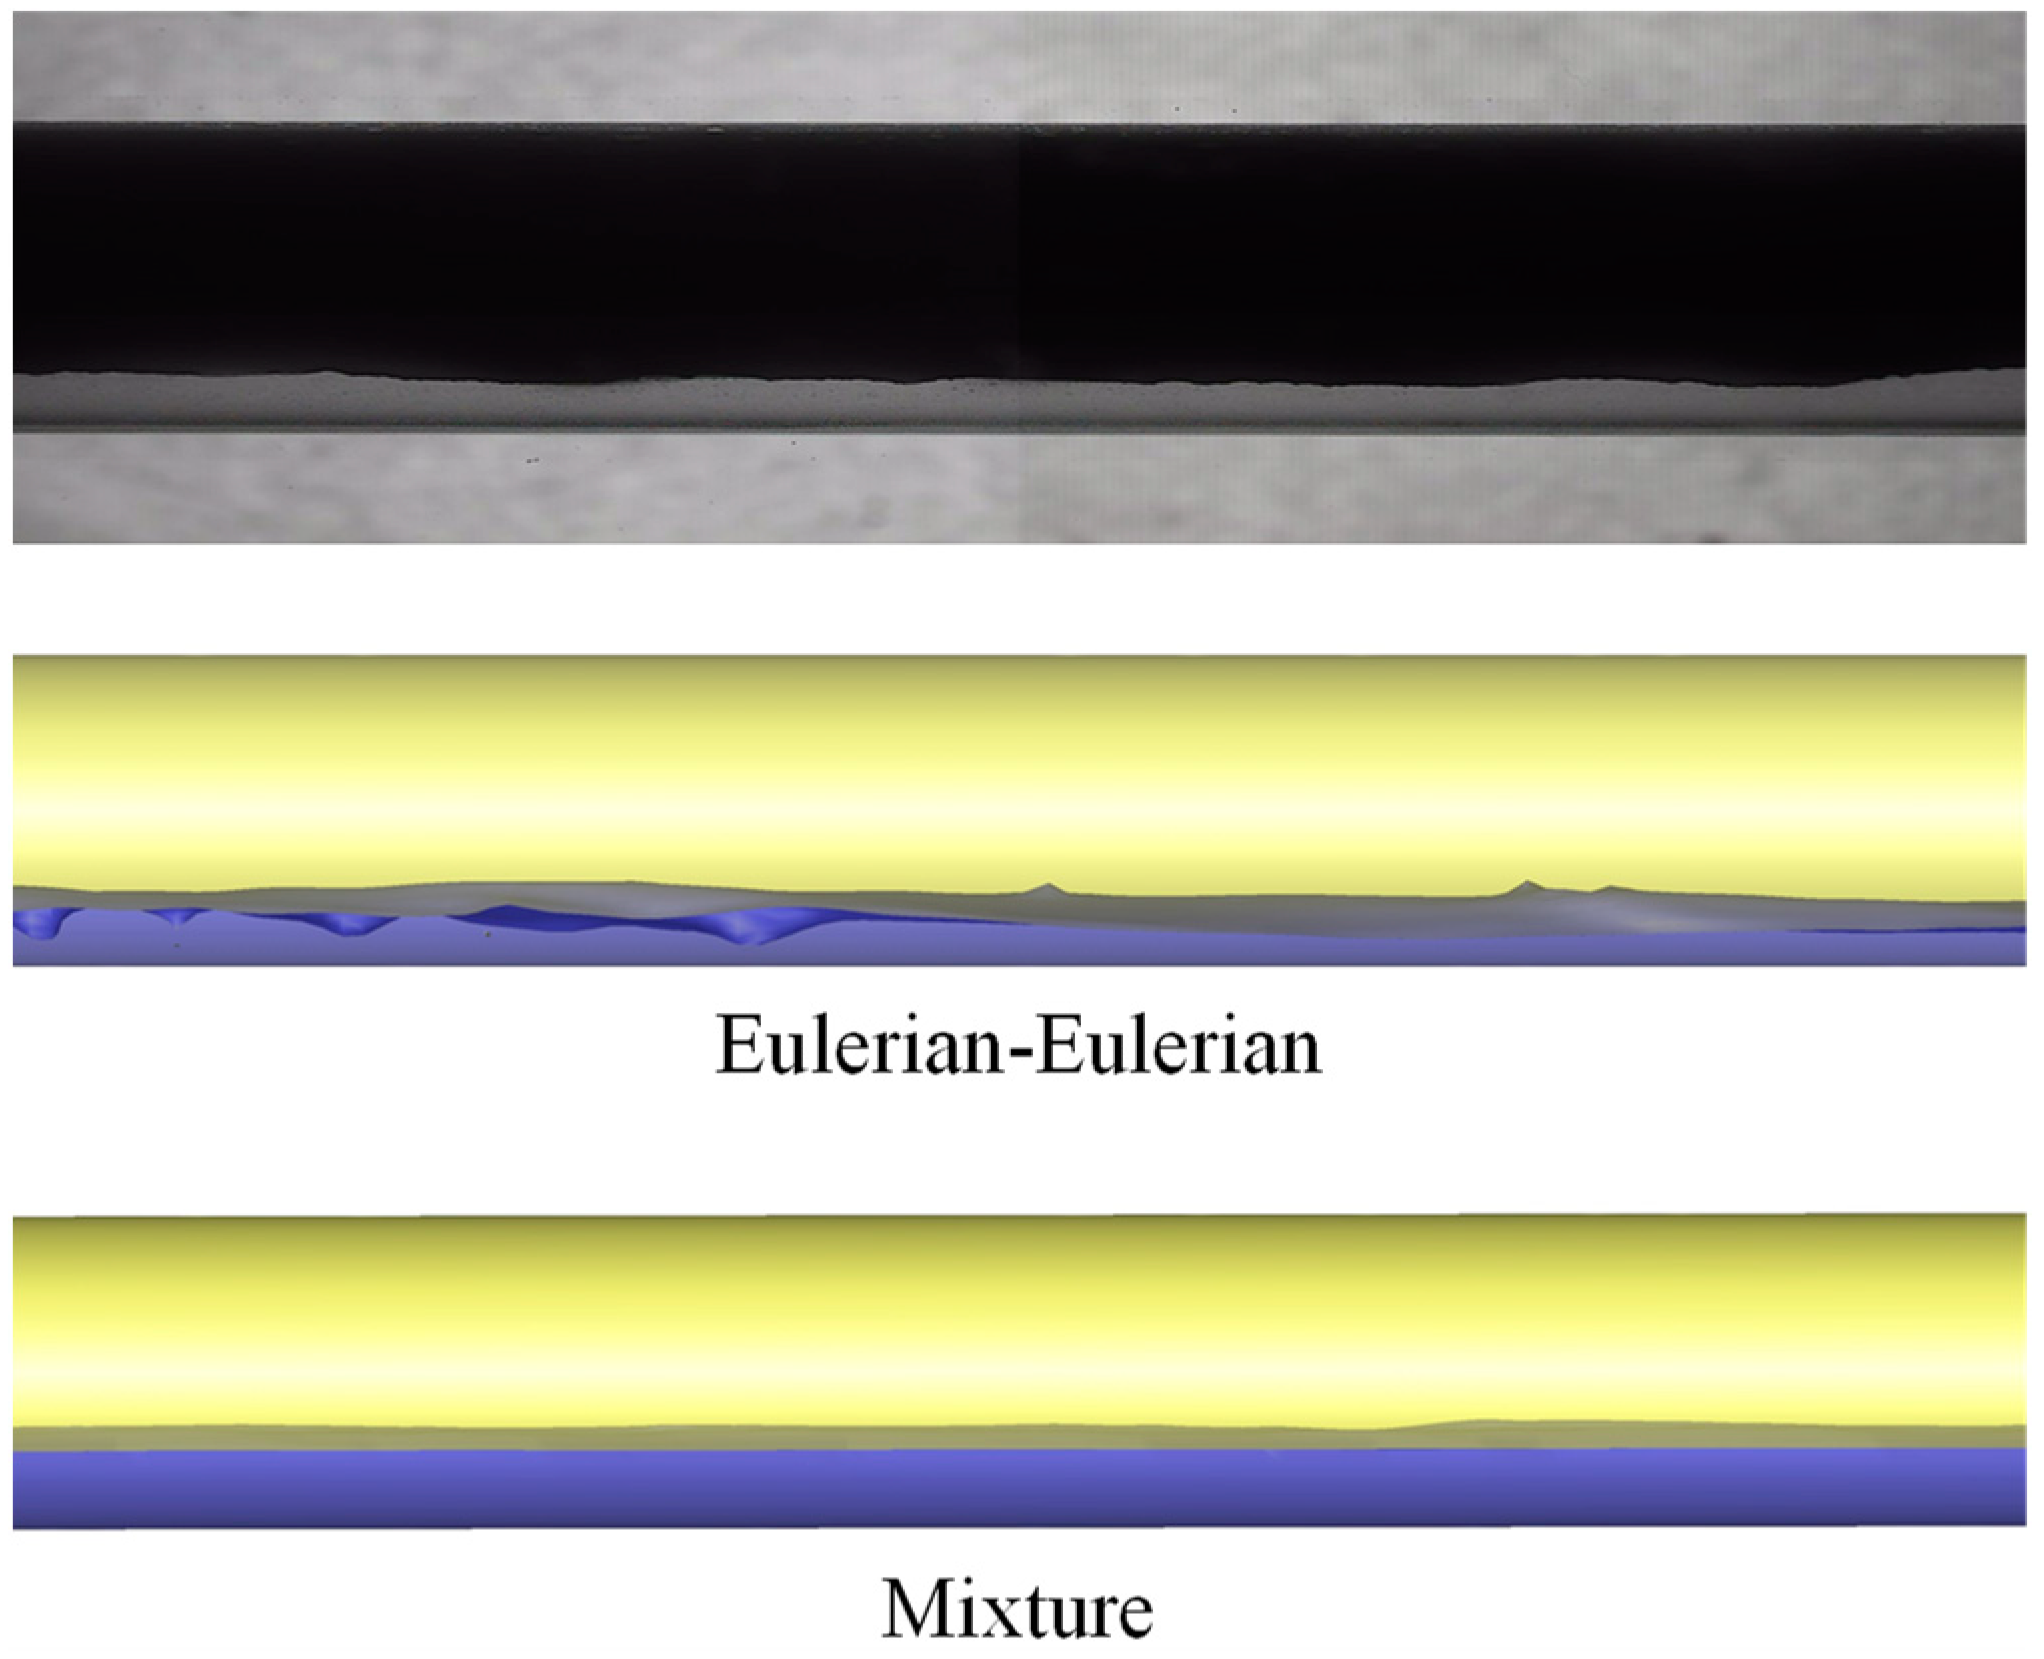
The three-dimensional visualization of simulated patterns is performed in the final section of the model pipe, capturing the interface through volume fraction iso-surfaces. According to the numerical model of the flow conditions implemented in experiment 1, shown in Figure 4, in both the mixture model and the Eulerian–Eulerian model, a stratified flow development similar to that developed experimentally is observed, with the difference that the Eulerian–Eulerian model generates more disturbances on the surface of the interface, more closely resembling the small waves observed experimentally. Something important to highlight from this experiment is that, despite the volumetric flows of both fluids being very similar, the oil shows some stagnation due to its high viscosity compared to water. Therefore, an increase in the area occupied by oil is observed, which could also be observed in the respective models.
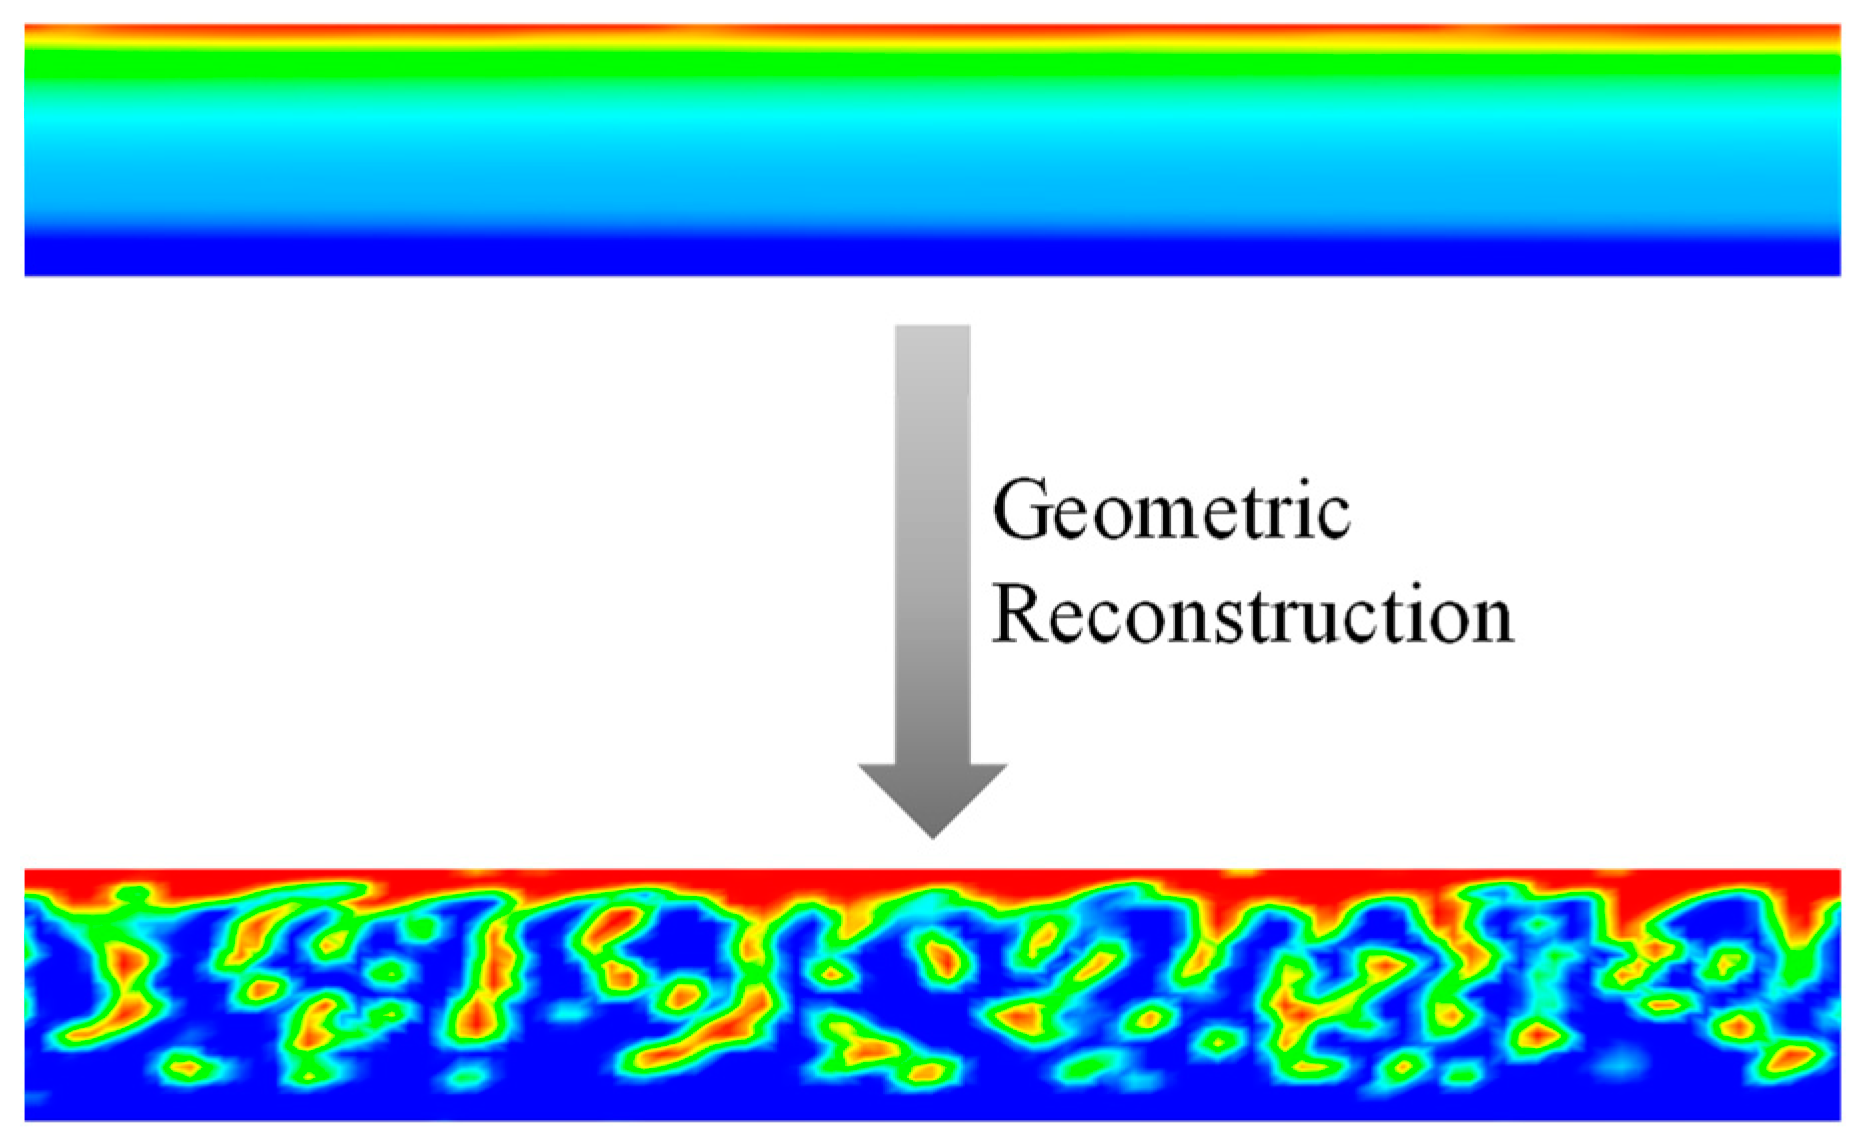
Although capturing the interface in separated flow is quite simple, in the case of dispersed flow, multiphase models relate the number of droplets present in any control volume to the respective volume fraction, making the formation of closed boundaries for particulate elements unnecessary since these are implicit in the volume fraction calculation. As seen in the longitudinal sections shown in Figure 5, the dispersed flow differs from the separated one due to the slight transition between phases, since the wide zone of intermediate volume fraction implies the presence of dispersed elements in that area.
Youngs’ geometric reconstruction scheme is a useful method to achieve more accurate interface tracking, forcing an explicit separation of the phases within the control volumes according to the cell volume fraction and the fluxes to neighboring cells [47]. In this way, using this scheme as a final treatment in dispersed flows facilitates the visualization of the droplets as they are distinguished in the experimental captures. Figure 6 shows the difference in phase separation when using the geometric reconstruction scheme in the simulated dispersed pattern under the conditions of experiment 4.
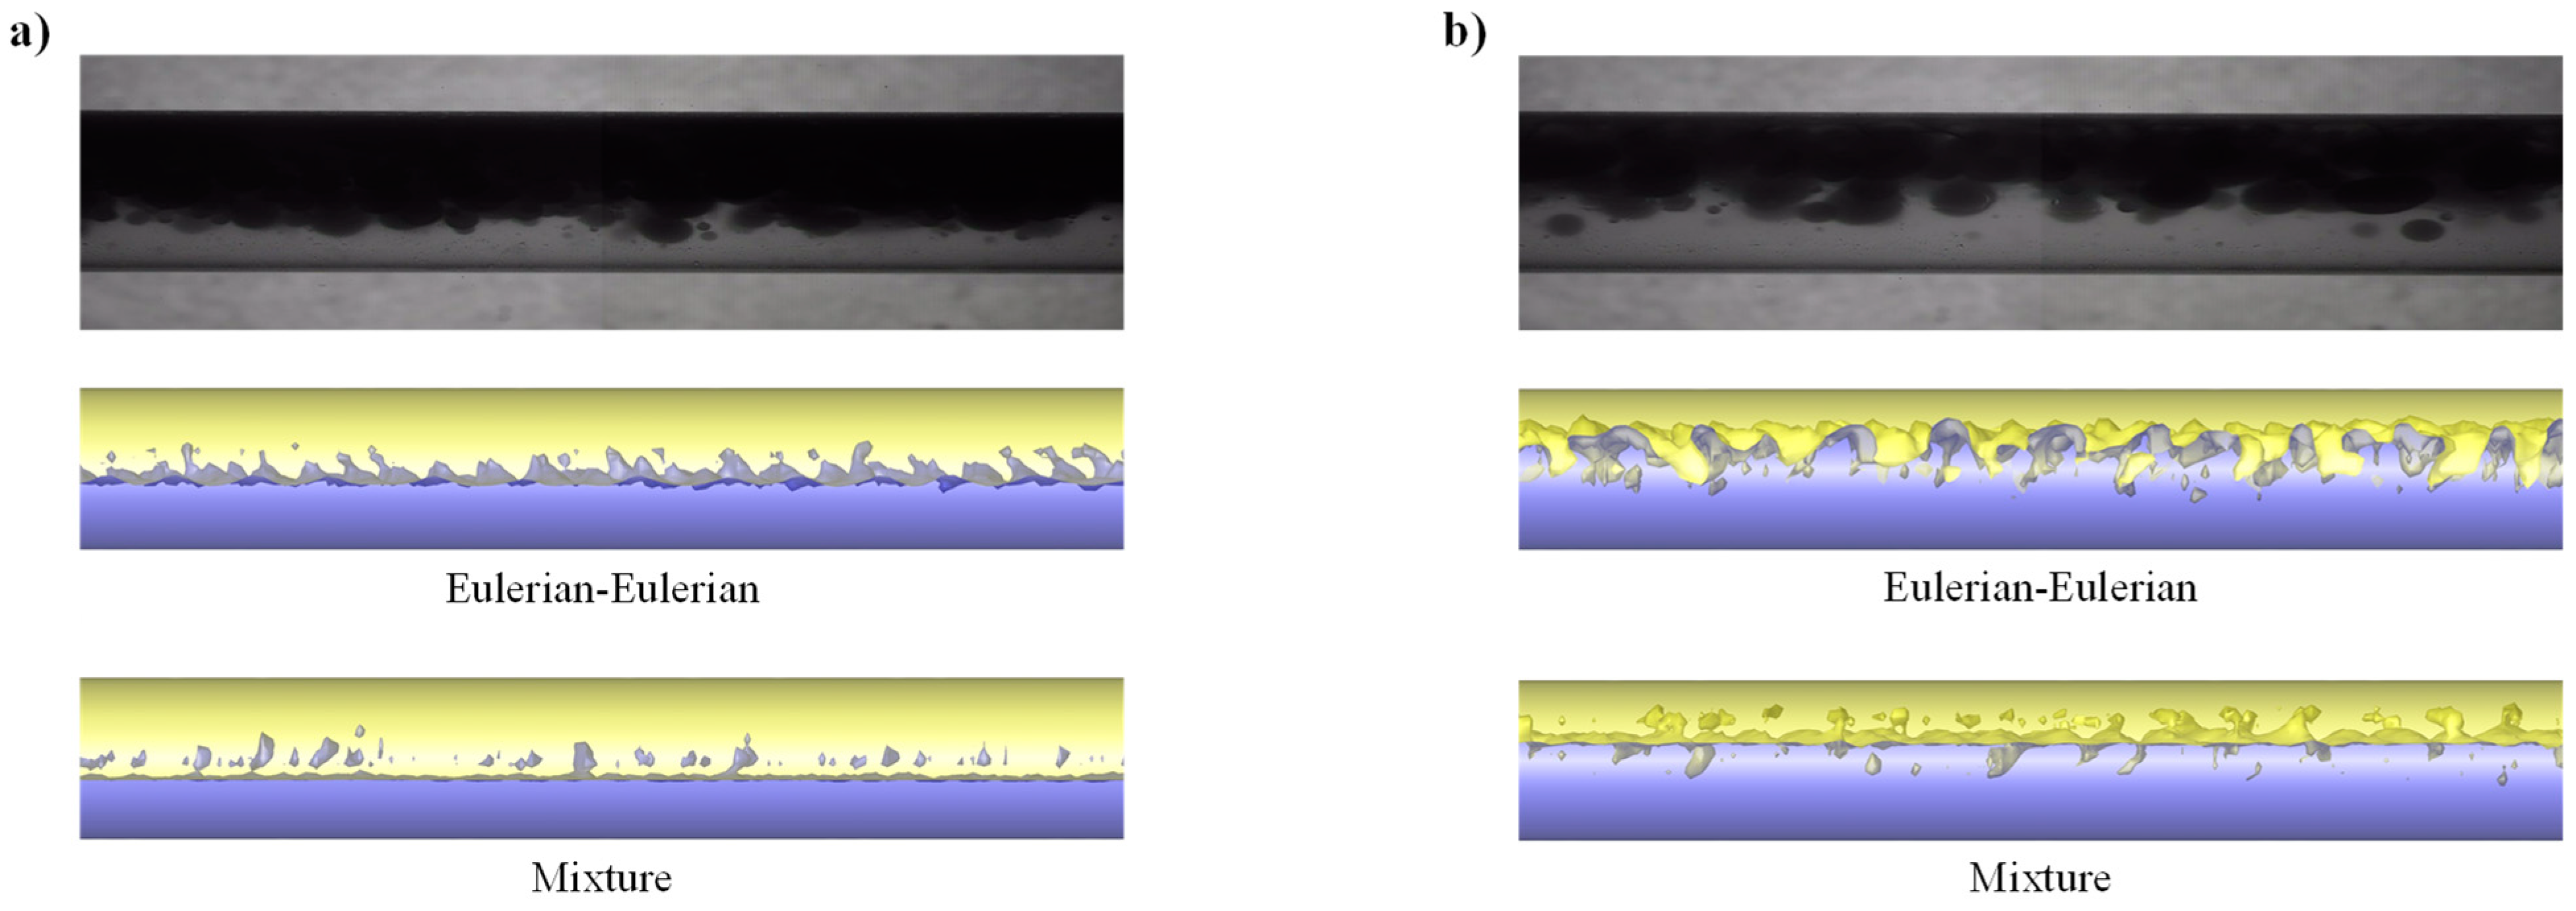
Using the geometric reconstruction scheme in the subsequent analyses contributes to achieving an adequate visualization of the dispersed patterns in 3D. In experiments 2 and 3, shown in Figure 7, it is possible to differentiate the greater separation of drops from the oil continuum by increasing the flow of water, which is replicated similarly in the computational models. However, in both cases, the mixture model tends to show less dispersion compared to experimental patterns and those obtained with the Eulerian–Eulerian model.
Figure 8 shows the experimental and numerical results of the cases of dispersion of oil in water, observed in experiments 4 and 5, in which some differences can be noted when using the mixture model, especially in experiment 4, since the flow pattern obtained using this model seems to be stratified with mixing in the interface (ST & MI) with little oil dispersion, contrary to the experimental pattern. On the other hand, the Eulerian–Eulerian model seems to accurately represent the patterns in both cases, noting the dispersion of oil droplets in the aqueous medium and emulating their tendency to concentrate in the upper part of the pipe.
The numerical flow configurations of water-in-oil dispersions are shown in Figure 9, where it is observed that the model effectively shows the total dispersion of water in the oil in both cases. However, the comparison between the images is limited by the fact that the experimental shots only highlight the oil, which means that the drops of water dispersed inside the oil are not observable.
Although all the water is dispersed in the computational results of experiment 7, a dispersion-free oil layer is observed in the two multiphase models, which we did not expect to obtain according to the flow pattern reported when we performed the experimental tests (Dw/o).
The numerical results using the Eulerian–Eulerian model are compared to the experimental holdup data. The results, summarized in Table 3, are similar to the results presented by Shi et al. [31,32] for core–annular flow. The CFD model tends to underpredict this variable, with relative error values between 2.08% and 33.51%. The numerical model of the stratified flow pattern shows the largest difference between experimental and predicted holdup, with an error of 33.51%, which could be associated with the wettability angle that affects the in situ distribution of the fluids and, as a consequence, the outlet holdup. The computational run times for the experiments, performed on an Intel Core i9 with 128 GB RAM, increase with turbulence intensity and complexity of the flow patterns. Stratified flows required approximately 24 h, while dispersed patterns ranged from 33.6 to 39.2 h.

4. Discussion

The numerical simulations conducted in this study, validated against experimental observations of oil–water flow in horizontal pipes, provide valuable insights into the strengths and limitations of the Eulerian–Eulerian and mixture models. The Eulerian–Eulerian model demonstrated strong agreement with experimental results for most flow patterns, particularly stratified and dispersed oil-in-water regimes. The ability of this model to capture phase separation and predict holdup with an average relative error of 15.2% highlights its robustness. However, for stratified flows, the model occasionally overestimated the holdup for the oil phase, with errors reaching up to 33.51%. These discrepancies could be attributed to assumptions in the interfacial force models, such as the simplified treatment of drag forces, which may not fully account for interfacial dynamics in these flows.
The mixture model, while computationally less demanding, exhibited limitations in accurately predicting flow patterns with high levels of dispersion. This is likely due to the model’s inability to resolve interfacial dynamics as effectively as the Eulerian–Eulerian approach. In dispersed flow regimes, the droplet sizes inferred from the simulations were constrained by the critical Weber number assumption and the mesh resolution. These findings suggest that incorporating more advanced interfacial force models and adaptive mesh refinement techniques could improve the prediction of droplet behavior and phase interactions.
The mesh sensitivity study revealed that finer meshes improve the accuracy of axial velocity and phase distribution predictions, with stabilization achieved at around 475,200 cells. This mesh was selected for the detailed simulations as it offered a balance between computational cost and accuracy. However, the significant increase in run time for finer meshes underscores the need to optimize mesh design for practical applications, particularly in industrial-scale simulations.
While the overall agreement between numerical and experimental results was good, discrepancies were observed for transitional flow patterns, such as stratified with mixing. These discrepancies may stem from uncertainties in the experimental setup, such as limitations in visualizing flow interfaces, or assumptions in the numerical model, including turbulence intensity and boundary condition approximations. Additionally, the inability to experimentally measure interfacial surface areas limits the scope of direct comparisons, which is an area that requires further experimental development.
These findings have significant implications for industries like oil and gas, where accurate prediction of flow patterns can enhance pipeline design and operational efficiency. Future research should focus on improving interfacial force models, incorporating adaptive mesh refinement techniques, and exploring the use of machine learning for better flow pattern prediction. Furthermore, experimental efforts should aim to capture more detailed data, such as droplet sizes and interfacial surface areas, to enhance validation and advance the understanding of multiphase flow dynamics.

5. Conclusions

The results obtained with the Eulerian–Eulerian multiphase model and the realizable kε turbulence model showed that the proposed numerical model allows representing with great accuracy the experimental patterns generated in horizontal oil–water flow, having exhibited a good agreement in the three-dimensional visualization of the phase arrangement in five of the six flow patterns studied. On the other hand, despite having included the same interfacial forces, the mixture model proved not to be as reliable in emulating the grade of dispersion in oil-in-water dispersed patterns.
The geometric reconstruction scheme allowed the tracking of interfaces in dispersed elements, facilitating the visualization of flow patterns similar to the captures in the experimental bench. However, the interface of the drops captured by this method depends on the volume fractions and the internal fluxes of cell clusters, and thus, it cannot be ensured that the actual droplet size is outlined in the resulting pattern. Likewise, when modeling the dispersion of water in oil (Dw/o) flow pattern, it was not possible to observe water droplets covering the entire volume with any of the multiphase models, showing a considerable film of free oil. Thus, new captures that allow identifying the experimental distribution of dispersed water droplets can be obtained and compared with the model’s results to achieve a better validation of its characterization in those flow conditions. An adequate fit between the numerical and the experimental holdups was achieved, with an average relative error of 15.2% and a median of 12.3%.

Author Contributions

All authors contributed to the study conception and design. Material preparation, data collection, and analysis were performed by S.H., O.A.G.-E. and G.G.-S. The first draft of the manuscript was written by S.H., and all authors commented on previous versions of the manuscript. All authors have read and agreed to the published version of the manuscript.

Funding

This work was supported by grants VIE-3716 and VIE-3913, Universidad Industrial de Santander.

Institutional Review Board Statement

Review and/or approval by an ethics committee was not needed for this study because it does not involve the use of animals, human participants, or any other ethical considerations.

Informed Consent Statement

Not applicable.

Data Availability Statement

Data will be made available on request due to (specify the reason for the restriction).

Conflicts of Interest

The authors declare that they have no known competing financial interests or personal relationships that could have appeared to influence the work reported in this paper.

References

  1. de Almeida Coelho, N.M.; Taqueda, M.E.S.; Souza, N.M.O.; de Paiva, J.L.; Santos, A.R.; Lia, L.R.B.; de Moraes, M.S.; de Moraes Júnior, D. Energy savings on heavy oil transportation through core annular flow pattern: An experimental approach. Int. J. Multiph. Flow 2020, 122, 103127. [Google Scholar] [CrossRef]
  2. AL-Dogail, A.S.; Gajbhiye, R.N. Effects of density, viscosity and surface tension on flow regimes and pressure drop of two-phase flow in horizontal pipes. J. Pet. Sci. Eng. 2021, 205, 108719. [Google Scholar] [CrossRef]
  3. Barnea, D. A unified model for predicting flow-pattern transitions for the whole range of pipe inclinations. Int. J. Multiph. Flow 1987, 13, 1–12. [Google Scholar] [CrossRef]
  4. Volino, R.J.; Devenport, W.J.; Piomelli, U. Questions on the effects of roughness and its analysis in non-equilibrium flows. J. Turbul. 2022, 23, 454–466. [Google Scholar] [CrossRef]
  5. Wang, S.; Di, Y.; Winterfeld, P.H.; Li, J.; Zhou, X.; Wu, Y.-S.; Yao, B. Understanding the Multiphysical Processes in Carbon Dioxide Enhanced-Oil-Recovery Operations: A Numerical Study Using a General Simulation Framework. SPE J. 2021, 26, 918–939. [Google Scholar] [CrossRef]
  6. Matko, T.; Chew, J.; Wenk, J.; Chang, J.; Hofman, J. Computational fluid dynamics simulation of two-phase flow and dissolved oxygen in a wastewater treatment oxidation ditch. Process Saf. Environ. Prot. 2021, 145, 340–353. [Google Scholar] [CrossRef]
  7. Yadigaroglu, G.; Hewitt, G.F. Introduction to Multiphase Flow, 1st ed.; Springer: Cham, Switzerland, 2018. [Google Scholar]
  8. Abduvayt, P.; Manabe, R.; Watanabe, T.; Arihara, N. Analysis of oil/water-flow tests in horizontal, hilly terrain, and vertical pipes. SPE Proj. Facil. Constr. 2006, 21, 123–133. [Google Scholar] [CrossRef]
  9. Hamidi, M.J.; Karimi, H.; Boostani, M. Flow patterns and heat transfer of oil-water two-phase upward flow in vertical pipe. Int. J. Therm. Sci. 2018, 127, 173–180. [Google Scholar] [CrossRef]
  10. Boostani, M.; Karimi, H.; Azizi, S. Heat transfer to oil-water flow in horizontal and inclined pipes: Experimental investigation and ANN modeling. Int. J. Therm. Sci. 2017, 111, 340–350. [Google Scholar] [CrossRef]
  11. Trallero, J.L.; Sarica, C.; Brill, J.P. A study of oil/water flow patterns in horizontal pipes. SPE Prod. Facil. 1997, 12, 165–172. [Google Scholar] [CrossRef]
  12. Flores, J.G.; Chen, X.T.; Sarica, C.; Brill, J.P. Characterization of oil-water flow patterns in vertical and deviated wells. SPE Prod. Facil. 1999, 14, 102–109. [Google Scholar] [CrossRef]
  13. Brauner, N. Liquid-Liquid Two-Phase Flow Systems. In Modelling and Experimentation in Two-Phase Flow; Bertola, V., Ed.; Springer: Vienna, Austria, 2003; pp. 221–279. [Google Scholar]
  14. Al-Wahaibi, T.; Yusuf, N.; Al-Wahaibi, Y.; Al-Ajmi, A. Experimental study on the transition between stratified and non-stratified horizontal oil-water flow. Int. J. Multiph. Flow 2012, 38, 126–135. [Google Scholar] [CrossRef]
  15. Grassi, B.; Strazza, D.; Poesio, P. Experimental validation of theoretical models in two-phase high-viscosity ratio liquid–liquid flows in horizontal and slightly inclined pipes. Int. J. Multiph. Flow 2008, 34, 950–965. [Google Scholar] [CrossRef]
  16. Sridhar, S.; Zhang, H.Q.; Sarica, C.; Pereyra, E. Experiments and model assessment on high-viscosity oil/water inclined pipe flows. Proc.—SPE Annu. Tech. Conf. Exhib. 2011, 2, 1554–1563. [Google Scholar] [CrossRef]
  17. Ruiz-Diaz, C.M.; Hernández-Cely, M.M.; González-Estrada, O.A. Modelo predictivo para la identificación de la fracción volumétrica en flujo bifásico. Cienc. Desarro. 2021, 12, 49–55. [Google Scholar] [CrossRef]
  18. Ruiz-Diaz, C.M.; Gómez-Camperos, J.A.; Hernández-Cely, M.M. Flow pattern identification of liquid-liquid (oil and water) in vertical pipelines using machine learning techniques. J. Phys. Conf. Ser. 2022, 2163, 12001. [Google Scholar] [CrossRef]
  19. Amooey, A.A. Prediction of pressure drop for oil-water flow in horizontal pipes using an artificial neural network system. J. Appl. Fluid Mech. 2016, 9, 2469–2474. [Google Scholar] [CrossRef]
  20. Azizi, S.; Awad, M.M.; Ahmadloo, E. Prediction of water holdup in vertical and inclined oil-water two-phase flow using artificial neural network. Int. J. Multiph. Flow 2016, 80, 181–187. [Google Scholar] [CrossRef]
  21. Wu, Y.; Guo, H.; Song, H.; Deng, R. Fuzzy inference system application for oil-water flow patterns identification. Energy 2022, 239, 122359. [Google Scholar] [CrossRef]
  22. Hernández-Salazar, C.A.; Carreño-Verdugo, A.; González-Estrada, O.A. Prediction of the volume fraction of liquid- liquid two-phase flow in horizontal pipes using Long-Short Term Memory Networks. Rev. UIS Ing. 2024, 23, 19–32. [Google Scholar] [CrossRef]
  23. Ruiz-Díaz, C.M.; Quispe-Suarez, B.; González-Estrada, O.A. Two-phase oil and water flow pattern identification in vertical pipes applying long short-term memory networks. Emergent Mater. 2024, 7, 1983–1995. [Google Scholar] [CrossRef]
  24. Ruiz-Díaz, C.M.; Perilla-Plata, E.E.; González-Estrada, O.A. Two-Phase Flow Pattern Identification in Vertical Pipes Using Transformer Neural Networks. Inventions 2024, 9, 15. [Google Scholar] [CrossRef]
  25. Ruiz-Diaz, C.M.; Hernández-Cely, M.M.; González-Estrada, O.A. Analysis of liquid-liquid (water and oil) two-phase flow in vertical pipes, applying artificial intelligence techniques. J. Phys. Conf. Ser. 2021, 2046, 012016. [Google Scholar] [CrossRef]
  26. Cornejo Caceres, J.S.; Prieto, N.; Gonzalez, G.; Chaves-Guerrero, A. Numerical Simulation of a Natural Gas Cylindrical Cyclone Separator Using Computational Fluid Dynamics. Ind. Eng. Chem. Res. 2019, 58, 14323–14332. [Google Scholar] [CrossRef]
  27. Al-yaari, M.A.; Abu-sharkh, B.F. CFD Prediction of Stratified Oil-Water Flow in a Horizontal Pipe. Asian Trans. Eng. 2011, 1, 68–75. [Google Scholar]
  28. Kang, Q.; Gu, J.; Qi, X.; Wu, T.; Wang, S.; Chen, S.; Wang, W.; Gong, J. Hydrodynamic modeling of oil–water stratified smooth two-phase turbulent flow in horizontal circular pipes. Energies 2021, 14, 5201. [Google Scholar] [CrossRef]
  29. Bochio, G.; Cely, M.M.H.; Teixeira, A.F.A.; Rodriguez, O.M.H. Experimental and numerical study of stratified viscous oil–water flow. AIChE J. 2021, 67, e17239. [Google Scholar] [CrossRef]
  30. Desamala, A.B.; Dasmahapatra, A.K.; Mandal, T.K. Oil-Water Two-Phase Flow Characteristics in Horizontal Pipeline—A Comprehensive CFD Study. Int. J. Chem. Mol. Nucl. Mater. Metall. Eng. 2014, 8, 371–375. [Google Scholar]
  31. Shi, J.; Gourma, M.; Yeung, H. CFD simulation of horizontal oil-water flow with matched density and medium viscosity ratio in different flow regimes. J. Pet. Sci. Eng. 2017, 151, 373–383. [Google Scholar] [CrossRef]
  32. Shi, J.; Gourma, M.; Yeung, H. A CFD study on horizontal oil-water flow with high viscosity ratio. Chem. Eng. Sci. 2021, 229, 116097. [Google Scholar] [CrossRef]
  33. Walvekar, R.G.; Choong, T.S.Y.; Hussain, S.A.; Khalid, M.; Chuah, T.G. Numerical study of dispersed oil–water turbulent flow in horizontal tube. J. Pet. Sci. Eng. 2009, 65, 123–128. [Google Scholar] [CrossRef]
  34. Rashimi, W.; Choong, T.S.Y.; Chuah, T.G.; Hussain, S.A.; Khalid, M. Effect of Interphase Forces on Two-Phase Liquid-Liquid Flow in Horizontal Pipe. Inst. Eng. Malays. 2010, 71, 35–40. [Google Scholar]
  35. Parvini, M.; Dabir, B.; Mohtashami, S.A. Numerical Simulation of Oil Dispersions in Vertical Pipe Flow. J. Jpn. Pet. Inst. 2010, 53, 42–54. [Google Scholar] [CrossRef]
  36. Burlutskiy, E.; Turangan, C.K. A computational fluid dynamics study on oil-in-water dispersion in vertical pipe flows. Chem. Eng. Res. Des. 2015, 93, 48–54. [Google Scholar] [CrossRef]
  37. Pouraria, H.; Kwan, J.; Kee, J. Numerical modelling of two-phase oil—Water flow patterns in a subsea pipeline. Ocean Eng. 2016, 115, 135–148. [Google Scholar] [CrossRef]
  38. Rodriguez, O.M.H.; Baldani, L.S. Journal of Petroleum Science and Engineering Prediction of pressure gradient and holdup in wavy stratified liquid—Liquid inclined pipe flow. J. Pet. Sci. Eng. 2012, 96–97, 140–151. [Google Scholar] [CrossRef]
  39. Hernández-Cely, M.M.; Ruiz-Díaz, C. Estudio de los fluidos aceite-agua a través del sensor basado en la permitividad eléctrica del patrón de fluido. Rev. UIS Ing. 2020, 19, 177–186. [Google Scholar] [CrossRef]
  40. González, G.; Prieto, N.; Mercado, I. Large Eddy Simulation (LES) Aplicado a un lecho fluidizado gas—Sólido. Parte I: Reactor a escala de laboratorio. Rev. UIS Ing. 2018, 17, 93–104. [Google Scholar] [CrossRef]
  41. Al-Wahaibi, T.; Smith, M.; Angeli, P. Transition between stratified and non-stratified horizontal oil–water flows. Part II: Mechanism of drop formation. Chem. Eng. Sci. 2007, 62, 2929–2940. [Google Scholar] [CrossRef]
  42. Rusche, H.; Issa, R.I. The effect of voidage on the drag force on particles, droplets and bubbles in dispersed two-phase flow. In Proceedings of the Japanese European Two-Phase Flow Meeting, Tshkuba, Japan, 25–29 September 2000. [Google Scholar]
  43. Rodriguez, O.M.H.; Rodriguez, I.H.; Ansoni, J.L. An experimental and numerical study on the wall lubrication force in dispersed liquid-liquid flow. Int. J. Multiph. Flow 2019, 120, 103094. [Google Scholar] [CrossRef]
  44. Brauner, N. The prediction of dispersed flows boundaries in liquid-liquid and gas-liquid systems. Int. J. Multiph. Flow 2001, 27, 885–910. [Google Scholar] [CrossRef]
  45. Shih, T.-H.; Liou, W.W.; Shabbir, A.; Yang, Z.; Zhu, J. A new k-ϵ eddy viscosity model for high reynolds number turbulent flows. Comput. Fluids 1995, 24, 227–238. [Google Scholar] [CrossRef]
  46. ANSYS Inc. ANSYS®Academic Research Mechanical, Release 21.1, Help System; ANSYS, Inc.: Canonsburg, PA, USA, 2021. [Google Scholar]
  47. Rudman, M. Volume-tracking methods for interfacial flow calculations. Int. J. Numer. Methods Fluids 1997, 24, 671–691. [Google Scholar] [CrossRef]
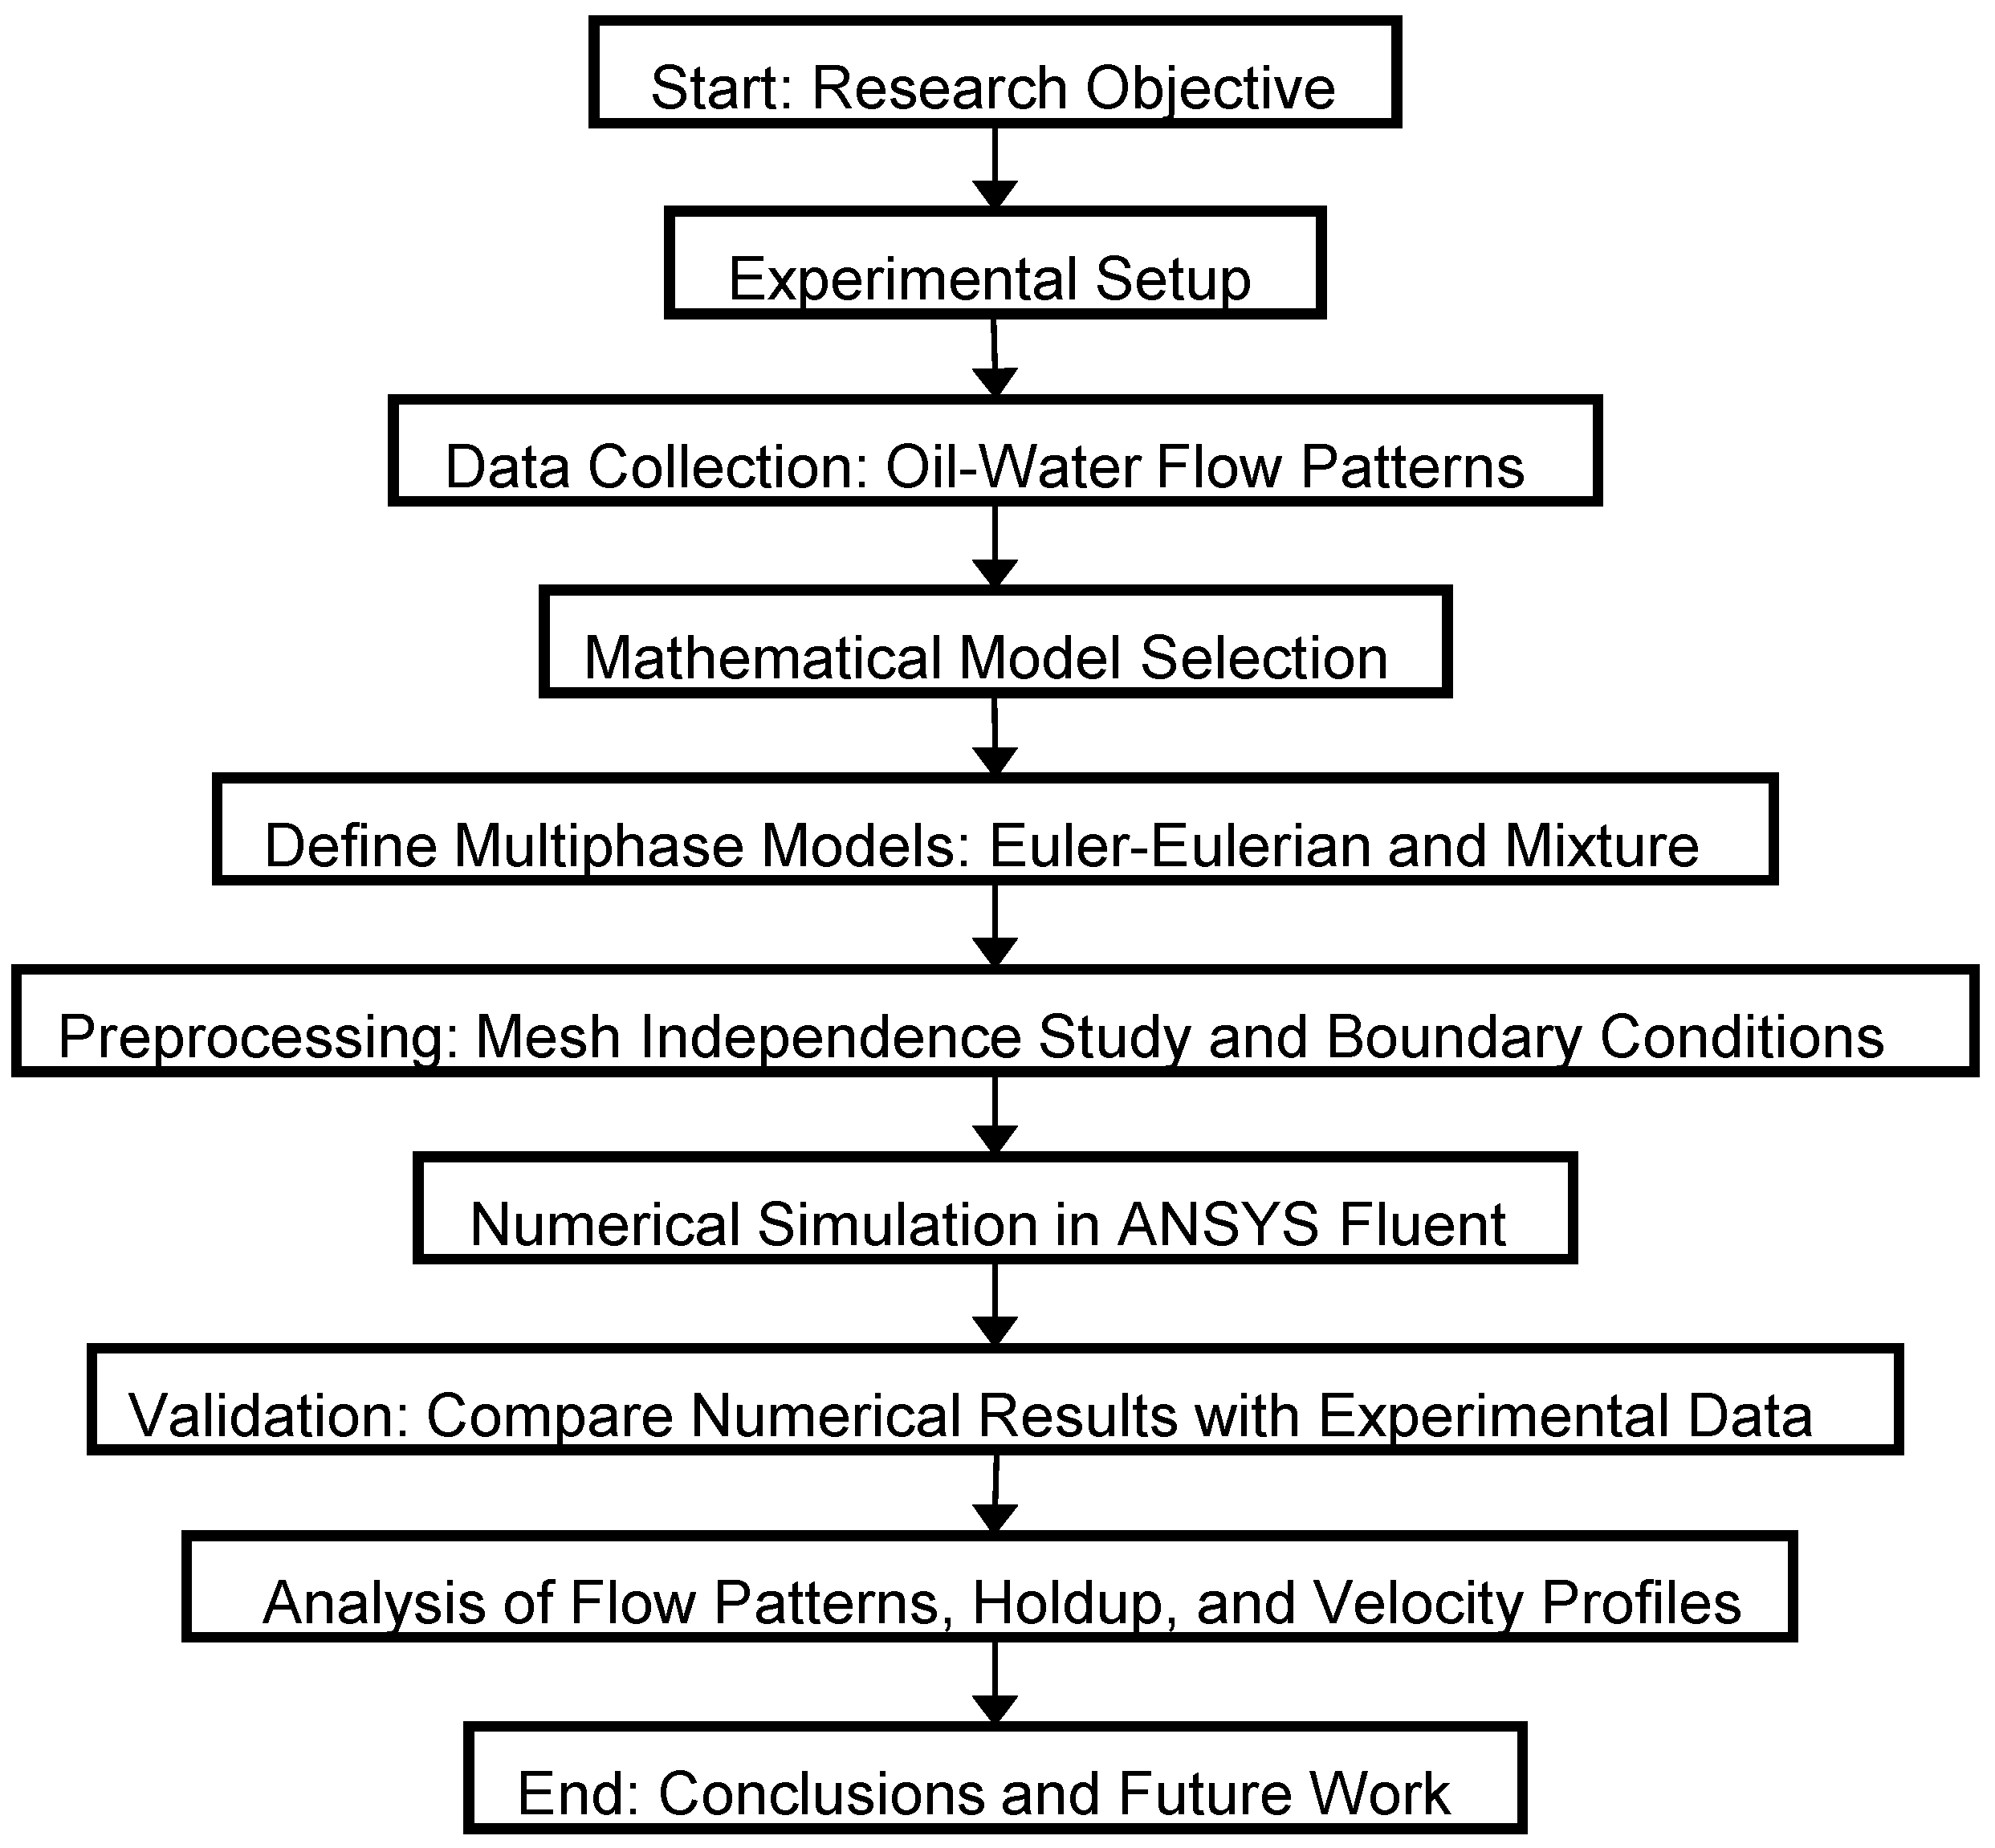
Figure 1. Methodology flowchart showing experimental setup, model selection, preprocessing, numerical simulation, validation, and analysis. Source: authors’ elaboration.
Eng 05 00173 g001
Figure 2. Schematic representation of the equipment used in the experimental bench. Source: authors’ elaboration.
Eng 05 00173 g002
Figure 3. Generated mesh for the model geometry.
Eng 05 00173 g003
Figure 4. Comparison between experimental and numerical flow configurations obtained at Experiment 1 conditions.
Eng 05 00173 g004
Figure 5. Difference in the phase distribution of separated and dispersed flows.
Eng 05 00173 g005
Figure 6. Variation in interface tracking using the geometric reconstruction scheme.
Eng 05 00173 g006
Figure 7. Comparison between experimental and numerical flow configurations: (a) experiment 2, (b) experiment 3.
Eng 05 00173 g007
Figure 8. Comparison between experimental and numerical flow configurations for oil-in-water dispersions: (a) experiment 4, (b) experiment 5.
Eng 05 00173 g008
Figure 9. Comparison between experimental and numerical flow configurations for water-in-oil dispersions: (a) experiment 6, (b) experiment 7.
Eng 05 00173 g009
Table 1. Meshes in the mesh sensitivity analysis.
MeshNumber of CellsAxial Vel. (m/s)Error (%)
A24,0001.509
B70,2001.5321.53
C153,6001.5041.82
D285,0001.5724.51
E475,2001.5891.11
F735,0001.5980.56
Table 2. Selected experimental tests for model validation.
ExperimentJw (m/s)Jo (m/s)Observed Pattern
10.1040.1ST
20.3040.215ST & MI
30.7240.223Do/w & w
40.9150.309Do/w & w
51.1060.115Do/w
60.3130.411Dw/o & o
70.1070.404Dw/o
Table 3. Comparison of experimental and computational pressure gradients and holdups.
ExperimentFlow PatternRun Time (h)Water Holdup
Exp.CFDError (%)
1ST~24.50.3850.25633.51
2ST & MI~30.80.4620.40512.34
3Do/w & w~33.60.7380.65411.38
4Do/w & w~34.50.8180.67717.24
5Do/w~34.20.9390.84210.33
6Dw/o & o~38.20.3850.3772.08
7Dw/o~35.10.1540.18419.48
Disclaimer/Publisher’s Note: The statements, opinions and data contained in all publications are solely those of the individual author(s) and contributor(s) and not of MDPI and/or the editor(s). MDPI and/or the editor(s) disclaim responsibility for any injury to people or property resulting from any ideas, methods, instructions or products referred to in the content.