1. Introduction
Currently, the use of fossil fuels for electricity generation has made the energy sector one of the main emitters of greenhouse gases (GHGs) worldwide [
1,
2]. It is estimated that the energy sector, which encompasses the production of fuels, natural gas, and electricity generation for industrial and domestic use, is responsible for approximately 40% of global CO
2 emissions [
3].
In this context, the energy sector needs to develop new alternatives that can mitigate climate change [
4], increase sustainability [
5], and improve the energy efficiency of industrial processes [
6]. Therefore, the use of renewable energy is becoming established as an energy, economic, and environmental option for electricity generation worldwide [
7].
One of the ways to harness the potential of renewable energy is through the technological improvement of supercritical carbon dioxide (sCO
2) Brayton cycles [
8], which are variants of conventional gas turbines. They primarily differ from these in that the working fluid (CO
2) operates above its critical point (T = 304.1 K, P = 7.37 MPa) [
9]. These technologies offer significant advantages in terms of infrastructure capacity, thermal performance, economic viability, and environmental sustainability, establishing them as a promising alternative today [
10].
Additionally, to improve the overall efficiency of these systems, the use of waste heat recovery technologies, such as organic Rankine cycles (ORCs), is proposed [
11]. Unlike traditional steam boilers used in thermal power plants, ORC systems utilize organic fluids with significantly lower boiling points than water, allowing them to adapt to lower temperature profiles and thus recover waste heat [
12]. This waste heat often has useful potential for generating work and increasing the overall efficiency of the system by approximately 3%–7% [
13].
Thus, many studies have addressed the analysis of these power generation systems based on the use of renewable energies, such as solar energy and biomass, and the recovery of waste heat through ORC systems. In this regard, Padilla et al. [
14] studied the thermal and exergy behavior of four supercritical CO
2 Brayton configurations using concentrated solar power (CSP) as the thermal source. The results show that the thermal efficiency of the supercritical CO
2 Brayton cycle increases with temperature, reaching a thermal efficiency of 55.2% at 850 °C in the configuration with recompression and intercooling.
A similar study was conducted by Al-Sulaiman et al. [
9], who compared the thermal performance of five supercritical CO
2 Brayton cycles integrated with a concentrated solar power (CSP) tower. They found that the supercritical CO
2 Brayton cycle with recompression achieved the best results, with thermal efficiencies of up to 52%. Habibi et al. [
15] performed an energy and exergy analysis of a system composed of a regenerative supercritical Brayton cycle, a bottoming ORC cycle, and a CSP tower. They reported that using a bottoming ORC improved the exergy efficiency (by 2.16%) and the net power of the system (by 2.75%).
Liang et al. [
16] optimized the thermodynamic performance of a Brayton sCO2 cycle combined with an organic Rankine cycle integrated with a molten salt tower solar power plant. They found an increase in thermal efficiency of 3.6% compared to that reported in the literature. Additionally, adding the ORC to the main Brayton cycle achieved an increase in net power output from 3.6 to 4.4%.
The studies mentioned previously propose the use of concentrated solar energy to operate supercritical CO2 Brayton cycles. However, this approach has some limitations, such as the intrinsic intermittency of solar energy, which restricts its operation to only hours of sunlight. Therefore, some authors suggest using biomass as a backup thermal source to mitigate these limitations.
Based on this, Meriño et al. [
17] proposed comparing two renewable energy sources (solar and coconut shell biomass) as thermal sources to drive an sCO
2 Brayton cycle coupled with an ORC. They found that the configuration using biomass as a thermal source achieved exergetic efficiencies of 40.6% and a 79% increase compared to the sCO
2–ORC system that used solar energy alone. Ishaq et al. [
18] analyzed the possibility of improving efficiency and energy use with lower carbon emissions in a multi-generation system based on biomass gasification integrated with thermoelectric generators. Compared to conventional thermoelectric generation systems, the results obtained were superior, showing energy and exergetic efficiencies of 58.03% and 32.78%, respectively.
Wang et al. [
19] proposed a supercritical Brayton cycle in cascade, powered by a solar–biomass system. The results indicate that hybrid systems (solar–biomass) in power cycles enable stable operation, improve energy efficiency, and reduce greenhouse gas emissions. Mouaky et al. [
20] investigated a hybrid solar and biomass polygeneration system. They concluded that this system can satisfy the energy requirements of the community under study. Anaya-Reyes et al. [
8] optimized an energy production system using a CO2 Brayton cycle, a double flash geothermal Rankine cycle, an internal combustion engine, a solar concentrating tower, and a polygeneration system. They obtained a thermal and exergy efficiency of 38.8% and 30.9%, respectively.
Morais et al. [
21] conducted a thermoeconomic study of a hybrid system composed of solar and biomass to drive ORC and supply the energy demand of an industrial plant in Brazil. From the economic point of view, it was found that the cost of the solar collector and biomass had the greatest influence on the internal rate of return. Similarly, this study, along with others by Pantaleo et al. [
22] and Bet Sarkis et al. [
23], provides a broader view of the application of biomass-based generation systems and hybrid systems in power cycles, highlighting improvements in energy availability and thermal efficiency of the processes.
Currently, environmental sustainability is presented as an essential indicator for evaluating the viability of energy generation processes. Although the literature emphasizes studies on energy, exergy, and economic performance in power production cycles, environmental sustainability has been scarcely explored in the state of the art. It is essential to determine whether Brayton sCO
2–ORC systems have the potential to reduce the amount of pollutants and positively impact the reduction in the carbon footprint [
24]. In this sense, life cycle assessment (LCA) emerges as a key tool for assessing the environmental impact and carbon footprint of energy generation systems throughout their construction, operation, and decommissioning stages [
25].
Based on the above, some authors have focused their efforts on the environmental analysis of these systems, such as Tovar et al. [
26], who performed a comparative analysis of the environmental impact of two waste heat recovery technologies: dual loop ORC (DORC) and Kalina cycle (KC), both coupled to a sCO
2 Brayton cycle using concentrated solar energy as a thermal source. The results show that the concentrated solar power plant (CSP) is the largest source of emissions, representing approximately 90% of the total generated by both studied systems. Furthermore, they found that the construction phase is the life cycle stage with the greatest environmental impact, contributing about 95.4% of total emissions, while the decommissioning and operation phases contribute 4.5% and 0.05%, respectively.
Similarly, Alarcón et al. [
27] reported quite similar results when evaluating the carbon footprint of two sCO
2–ORC Brayton systems, both powered by concentrated solar thermal energy. In this study, the CSP represented 87% of the total environmental impact of the devices in both systems, and the construction phase contributed 95.38% of the total carbon footprint by phases, while the decommissioning and operation phases together constituted the remaining 4.52%.
Barton [
28] evaluated the life cycle analysis in the manufacturing stage of a parabolic trough solar thermal plant with thermal storage, using a Brayton cycle for power production. They established that the Brayton cycle, wet condenser parabolic trough collector, and dry condenser parabolic trough collector emit 13.2, 12, and 13 g CO
2 /kWh, respectively, in the GHG category in the construction phase.
Aghahosseini et al. [
29] studied the environmental impact of the choice of working fluid for an ORC. For this purpose, they studied parameters such as toxicity, flammability, ODP, and GWP. They found that the working fluids with the highest potential are R123, R245fa, R600a, R134a, R407c, and R404a, providing valuable information for power generation applications in different operating conditions with minimal environmental impact.
Blanco et al. [
30] performed an energy and environmental evaluation of a Brayton cycle coupled to ORC for waste heat recovery. They found that the turbine was the device of the system that threw more amounts of pollutants into the environment, with a value of 4416 Pts, when proposing to use copper as the construction material of the equipment.
Finally, Xiao et al. [
24] evaluated the global warming potential (GWP), acidification potential (AP), and respiratory effects potential (REP) of a solar thermal power plant integrated with two air-cooled Brayton sCO
2 cycles. They found that these indicators are higher in the simple Brayton cycle with regeneration compared to the supercritical Brayton cycle with recompression, with differences of 7%, 5%, and 6% for GWP, AP, and REP, respectively.
The previously mentioned research mainly proposes studies focused on the analysis of the energy and exergetic performance of supercritical CO2 Brayton cycles, using renewable energy sources (solar and biomass) as thermal supply. However, the lack of environmental assessment studies in this field, especially in biomass generation systems, highlights the need to conduct research that ensures thermo-sustainable options in power production. In this regard, the objective of the present investigation is to perform a comparative energy, exergetic, and life cycle analysis of two systems modeled from renewable energy sources: a concentrated solar power (CSP) system and a coconut shell biomass system. Both systems are used to operate a supercritical CO2 Brayton cycle with recompression, intercooling, and reheating coupled to an organic Rankine cycle (ORC) as a bottoming cycle.
2. Methodology
This research proposes a supercritical carbon dioxide (sCO2) Brayton cycle coupled with an organic Rankine cycle (ORC), using renewable energies (solar and biomass) as thermal sources. Two case studies are presented. In the first scenario, concentrated solar power (CSP) is considered as the energy source, meeting 100% of the energy demand of the sCO2 Brayton cycle. In the second scenario, the system operates using coconut shell biomass, which also satisfies 100% of the energy requirement.
2.1. System Description
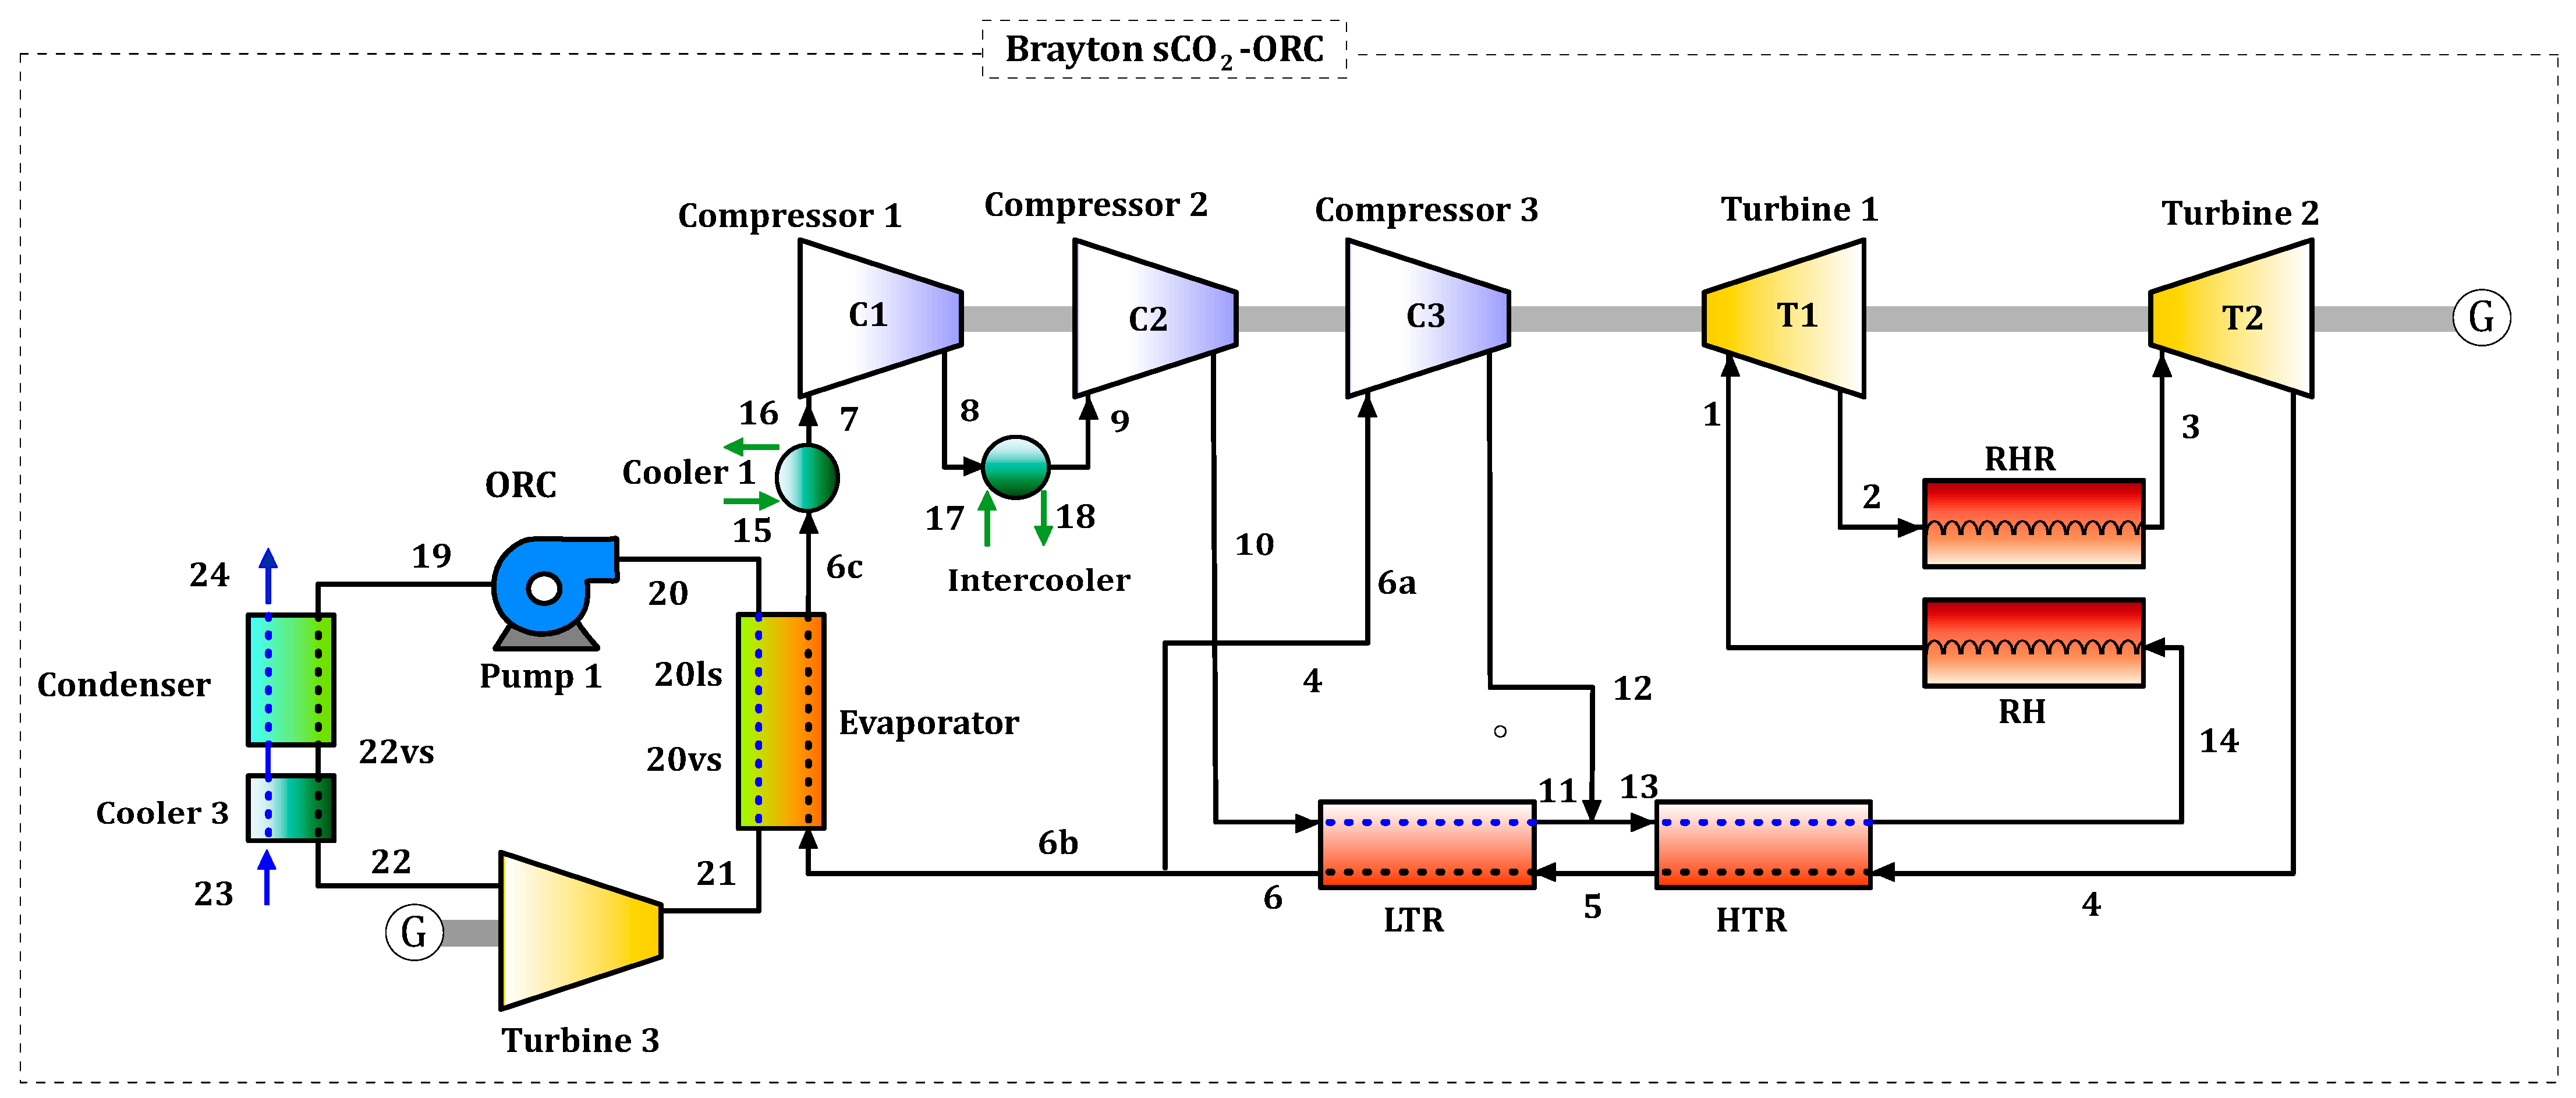
Figure 1 illustrates a supercritical carbon dioxide (sCO
2) Brayton cycle with recompression, intercooling, and reheating, using an organic Rankine cycle (ORC) as the waste heat recovery technology. Additionally,
Table 1 describes the parameters used for the energy simulation, such as turbine inlet pressure and temperature, compressor and turbine isentropic efficiency, among others. Most of the values in the reference parameters were taken from the work presented by Padilla et al. [
14] and Fontalvo [
31].
Throughout this text, the term “high cycle pressure” will be used. This refers to the pressure at the inlet of turbines 1 and 2, which is a fundamental parameter in the analysis of the thermodynamic cycle. This pressure directly affects turbine performance, as it influences the generation of useful work and other system variables, such as thermal and exergetic efficiency [
32].
Similarly, the turbine inlet temperature is another key parameter, as it represents the amount of thermal energy available, supplied by the heaters and reheaters of the thermal source. A high inlet temperature can improve cycle efficiency but is limited by material properties and operating conditions [
22].
On the other hand, the isentropic efficiency of the compressor and turbines measures the actual performance of these components compared to an ideal isentropic process. These efficiencies reflect energy losses due to irreversibilities, such as friction and unwanted heat transfer. A compressor with high isentropic efficiency consumes less energy to compress the fluid, while a more efficient turbine converts a larger proportion of thermal energy into useful work [
14].
In the system, carbon dioxide (CO2) enters Turbine 1 (T1) at high pressure and temperature (State 1), achieved thanks to the heat from the heater (HR). The gas expands, generating work (State 2). Then, the reheater (RHR) raises the temperature again (State 3) before the CO2 passes to Turbine 2 (T2), where it produces more work. The output from Turbine 2 (T2) (State 4) transfers heat to the HTR recuperator, preheating stream 13 from the LTR. In the LTR, the flow releases heat and splits into two streams: 6a and 6b. The first stream goes to Compressor 3 (C3), reaching the system’s high pressure (State 12), while stream 6b enters the ORC evaporator to improve thermal efficiency. The output of this process passes to the cooler, where it is cooled with air to the initial conditions (55 °C and 101.3 kPa) (State 7).
Stream 7 enters Compressor 1 (C1), reaching an intermediate pressure (State 8). To reduce the compression work, a multi-stage compression process is implemented. An intercooler is used to cool the stream (State 9) before entering Compressor 2 (C2), where the CO2 is compressed to the system’s high pressure (State 10). The output mixes with that of Compressor 3 (stream 13), which is heated in the HTR (State 14) and then in the heater, completing the thermodynamic cycle.
On the other hand, in the ORC, the output stream from the evaporator enters Turbine 3 (T3), where the working fluid (toluene) expands and generates work. Subsequently, the toluene enters the cooler and the condenser, where it is cooled with water at 25 °C. Finally, it enters the pump (P1) as a saturated liquid, raising its pressure to the high pressure of the ORC and entering the evaporator to complete this thermodynamic cycle.
Additionally,
Figure 2 illustrates the temperature–entropy (TS) diagrams that describe the aforementioned thermodynamic process. These diagrams show the supercritical regions in which carbon dioxide operates in the supercritical Brayton cycle (
Figure 2a) and detail the behavior of toluene as the working fluid in the ORC (
Figure 2b).
2.2. Thermodynamic Modeling
This section describes the thermodynamic model developed in Matlab 2018b. For this purpose, the transport properties and thermodynamic states were determined using Refprop 9.0.
The energy and exergy balances were applied considering the following assumptions:
- •
Operating conditions at ambient temperature and pressure are considered (T = 298.15 K and P = 101.3 kPa).
- •
All devices are assumed to operate in a steady state.
- •
Pressure drops, kinetic energy changes, and potential energy changes in each stream are neglected.
- •
All devices are modeled as open systems.
- •
Turbines, compressors, and pumps have isentropic efficiencies.
- •
The effectiveness of the heat exchangers is assumed.
In this context, Equation (1) represents the mass balance for an open system, where ṁ
in and ṁ
out are the mass flow rates at the inlet and outlet of each device [
33].
Equation (2) illustrates the energy balance, where Q is the heat; Ẇ is the work; and h
in and h
out are the flow energies of each stream [
33].
The exergy balance of each device is determined in Equation (3), where Ė
in and Ė
out are the inlet and outlet exergies, respectively; Q(1 − T
0/T) is the exergy lost due to heat transfer; and Ė
D is the exergy destroyed by each component [
34].
Additionally, the physical exergy is indicated in Equation (4) [
34]:
In this formula, h and s are the enthalpies and entropies of the stream, and h
0 and s
0 are the enthalpies and entropies under reference conditions. On the other hand, the overall thermal efficiency of the configuration is determined using Equation (5) [
35].
Ẇ
T1, Ẇ
T2, and Ẇ
T3 are the power produced by turbines T1, T2, and T3, respectively; Ẇ
C1, Ẇ
C2, Ẇ
C3, and Ẇ
P1 are the power consumed by compressors C1, C2, and C3 and pump P1, respectively; and Q
HR and Q
RHR are the heat supplied by the heater and reheater. Equation (6) indicates the thermal efficiency of the ORC, where Q
Eva is the heat supplied by the evaporator [
33,
36].
Finally, the overall exergy efficiency and the flue depletion ratio of the sCO
2–ORC system are determined using Equations (7) and (8) [
37,
38].
Ėin-source is the exergy provided by the thermal source (solar or biomass).
2.3. Thermal Source Modeling
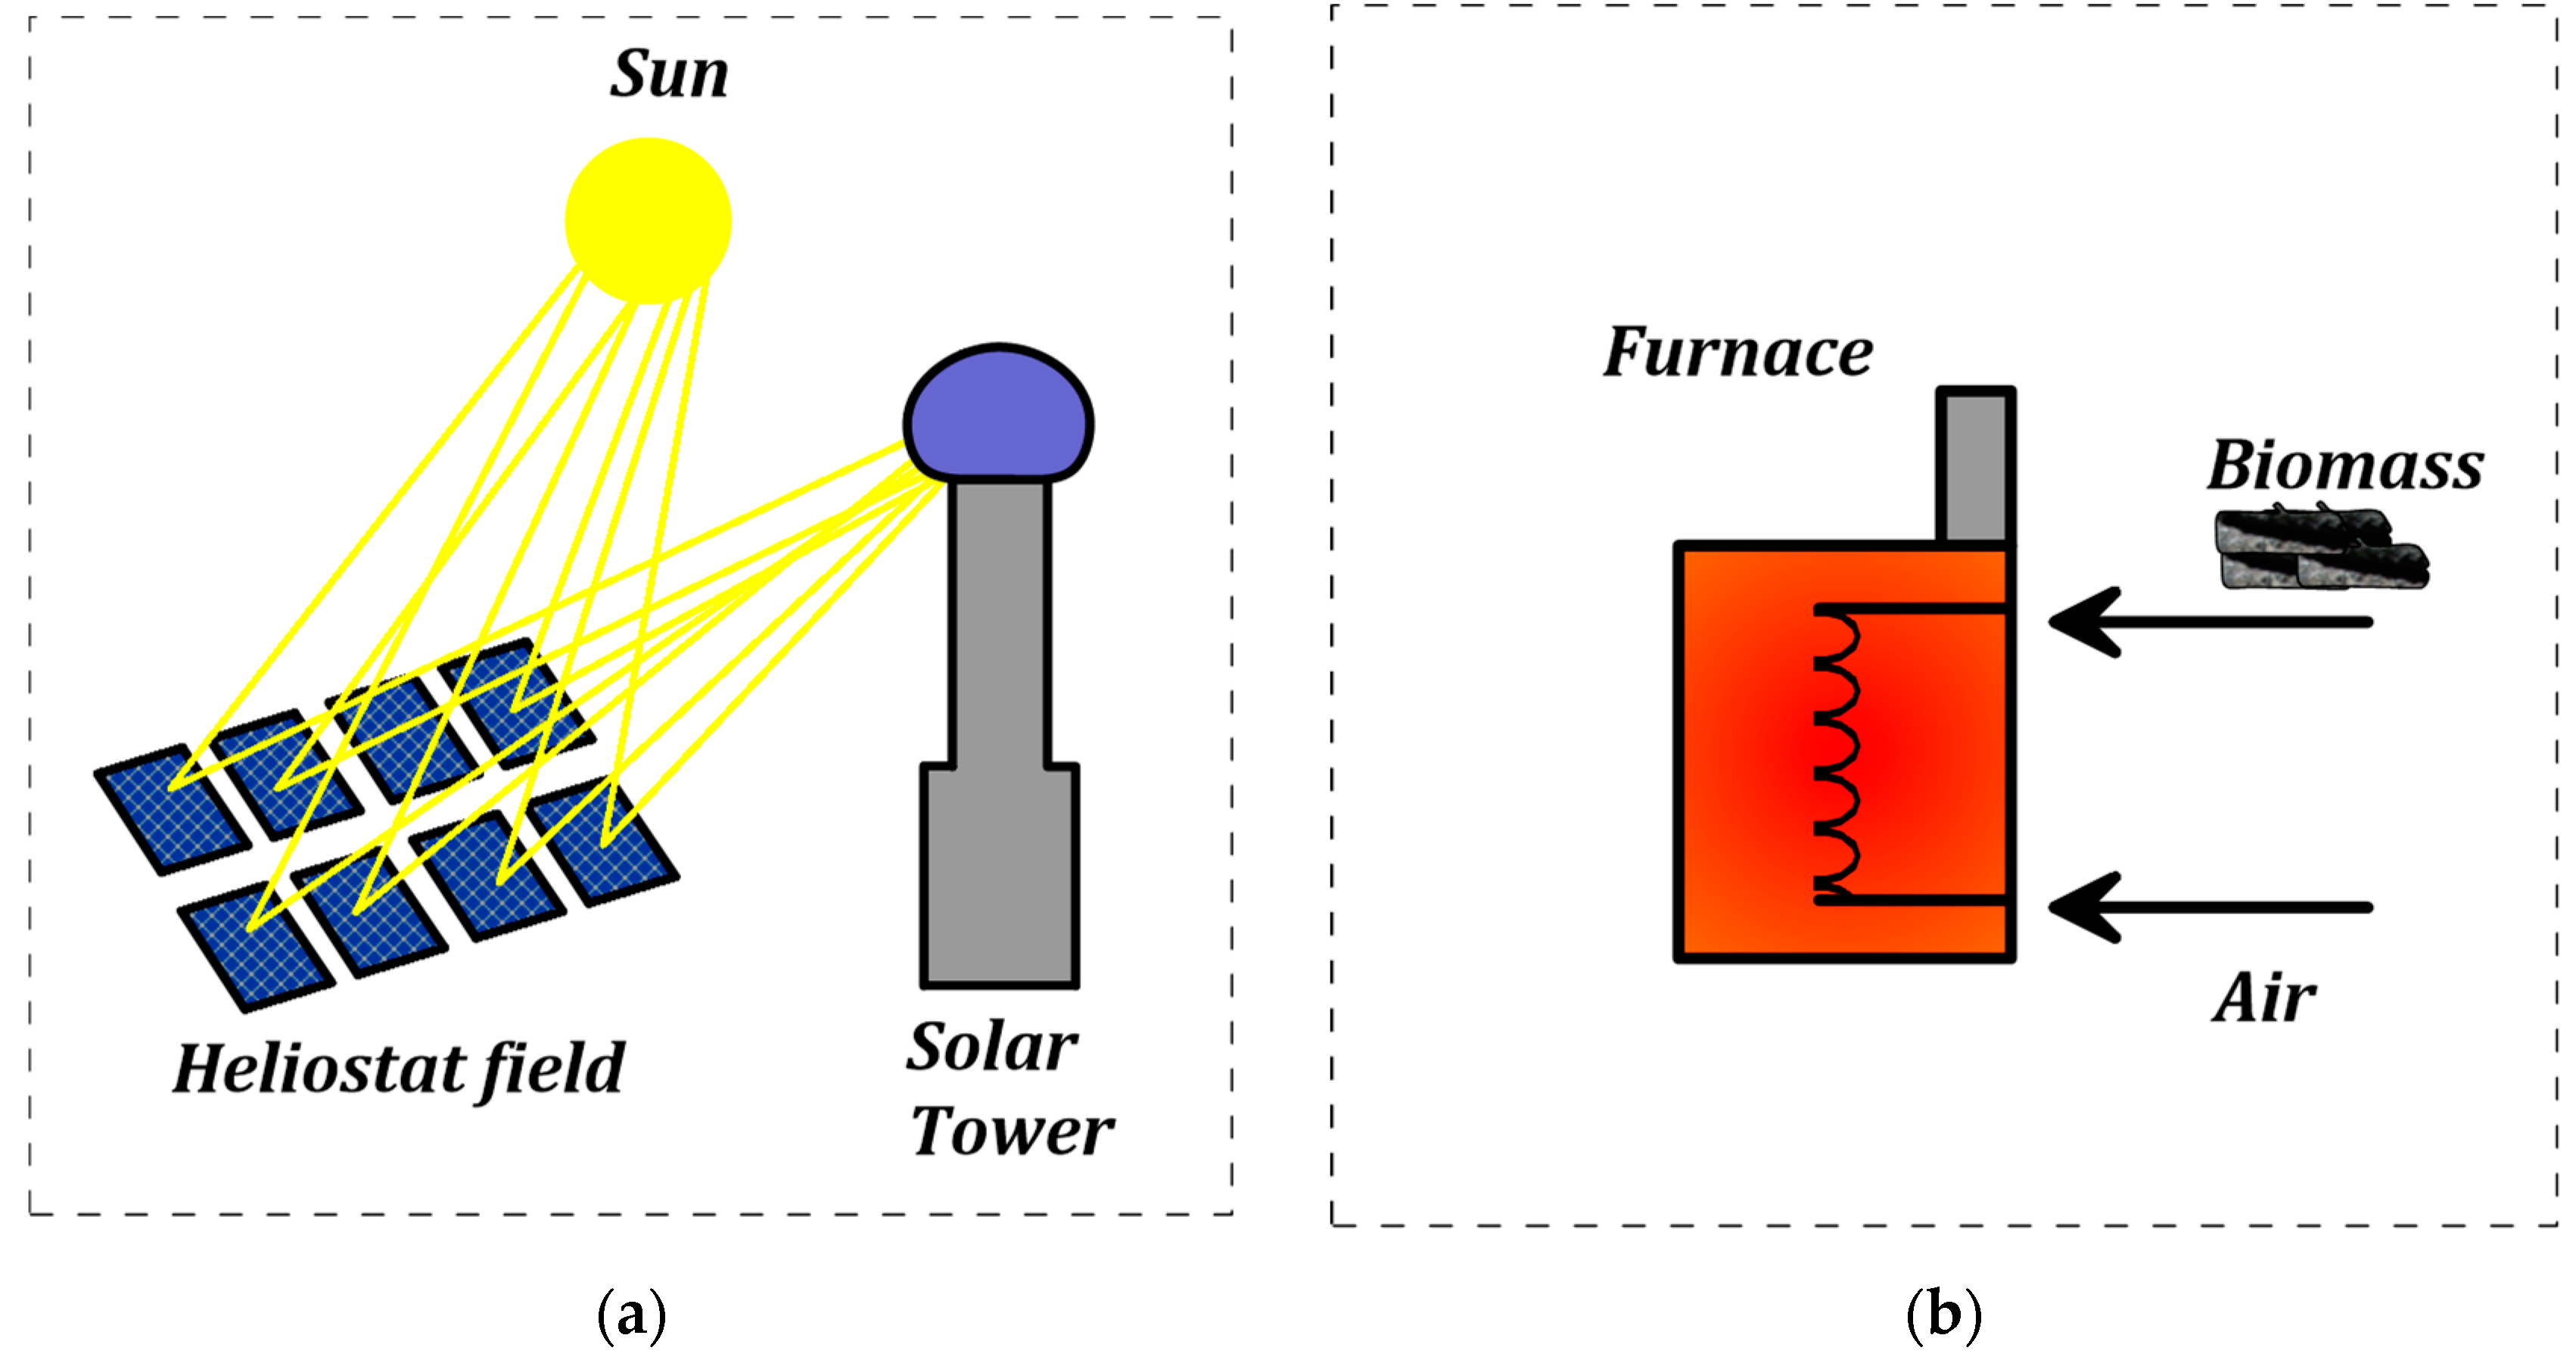
In
Figure 3, the previously proposed scenarios are illustrated. In this first scenario, a solar concentration tower (CSP) without thermal storage directly heats the sCO
2, making it easier to evaluate irreversibility based on the temperature entering the turbine. The heater and reheater of the sCO
2 Brayton cycle are integrated into the solar receiver, thus covering all heat requirements (
Figure 3a).
In this context, the exergy entering the system is determined using Equation (9) [
14,
39].
The terms θ, T
se, η
sf, and η
sr correspond to the angle of the sun, the equivalent temperature of the sun, and the efficiency of the solar receiver, which is determined using Equation (10) [
40]. Additionally, the city of Barranquilla, Colombia, was assumed as the study location, using radiation and cloudiness data as reference (see
Table 2).
The terms of this equation are described in
Table 2. Finally, Equations (11)–(13) represent the exergy lost, exergy destroyed in the solar receiver, and exergy loss from the solar field, respectively [
22].
On the other hand,
Figure 3b illustrates the generation system using biomass. Both the heater and the reheater utilize the heat generated in the biomass furnace, thus ensuring that the thermal requirements demanded by the Brayton sCO
2 system are met. The biomass selected for the study is coconut shell, which is an agro-industrial byproduct with high availability in the Atlántico department of Colombia [
41].
Table 3 presents the chemical composition of coconut shell [
17].
Equations (14) and (15) determine the calculation of the required amount of biomass based on the heat of the heaters (Q
HR + Q
RHR) and the chemical exergy as a function of the calorific value (LHV) [
42].
The term β was determined based on Equation (16), taken from the study conducted by Wang et al. [
42].
The terms H, C, and O correspond to the dry-basis mass percentages of hydrogen, carbon, and oxygen, detailed in
Table 3. Finally, the exergy supplied by the biomass to the heaters and the exergy destroyed in them are determined by Equations (17) and (18) [
17].
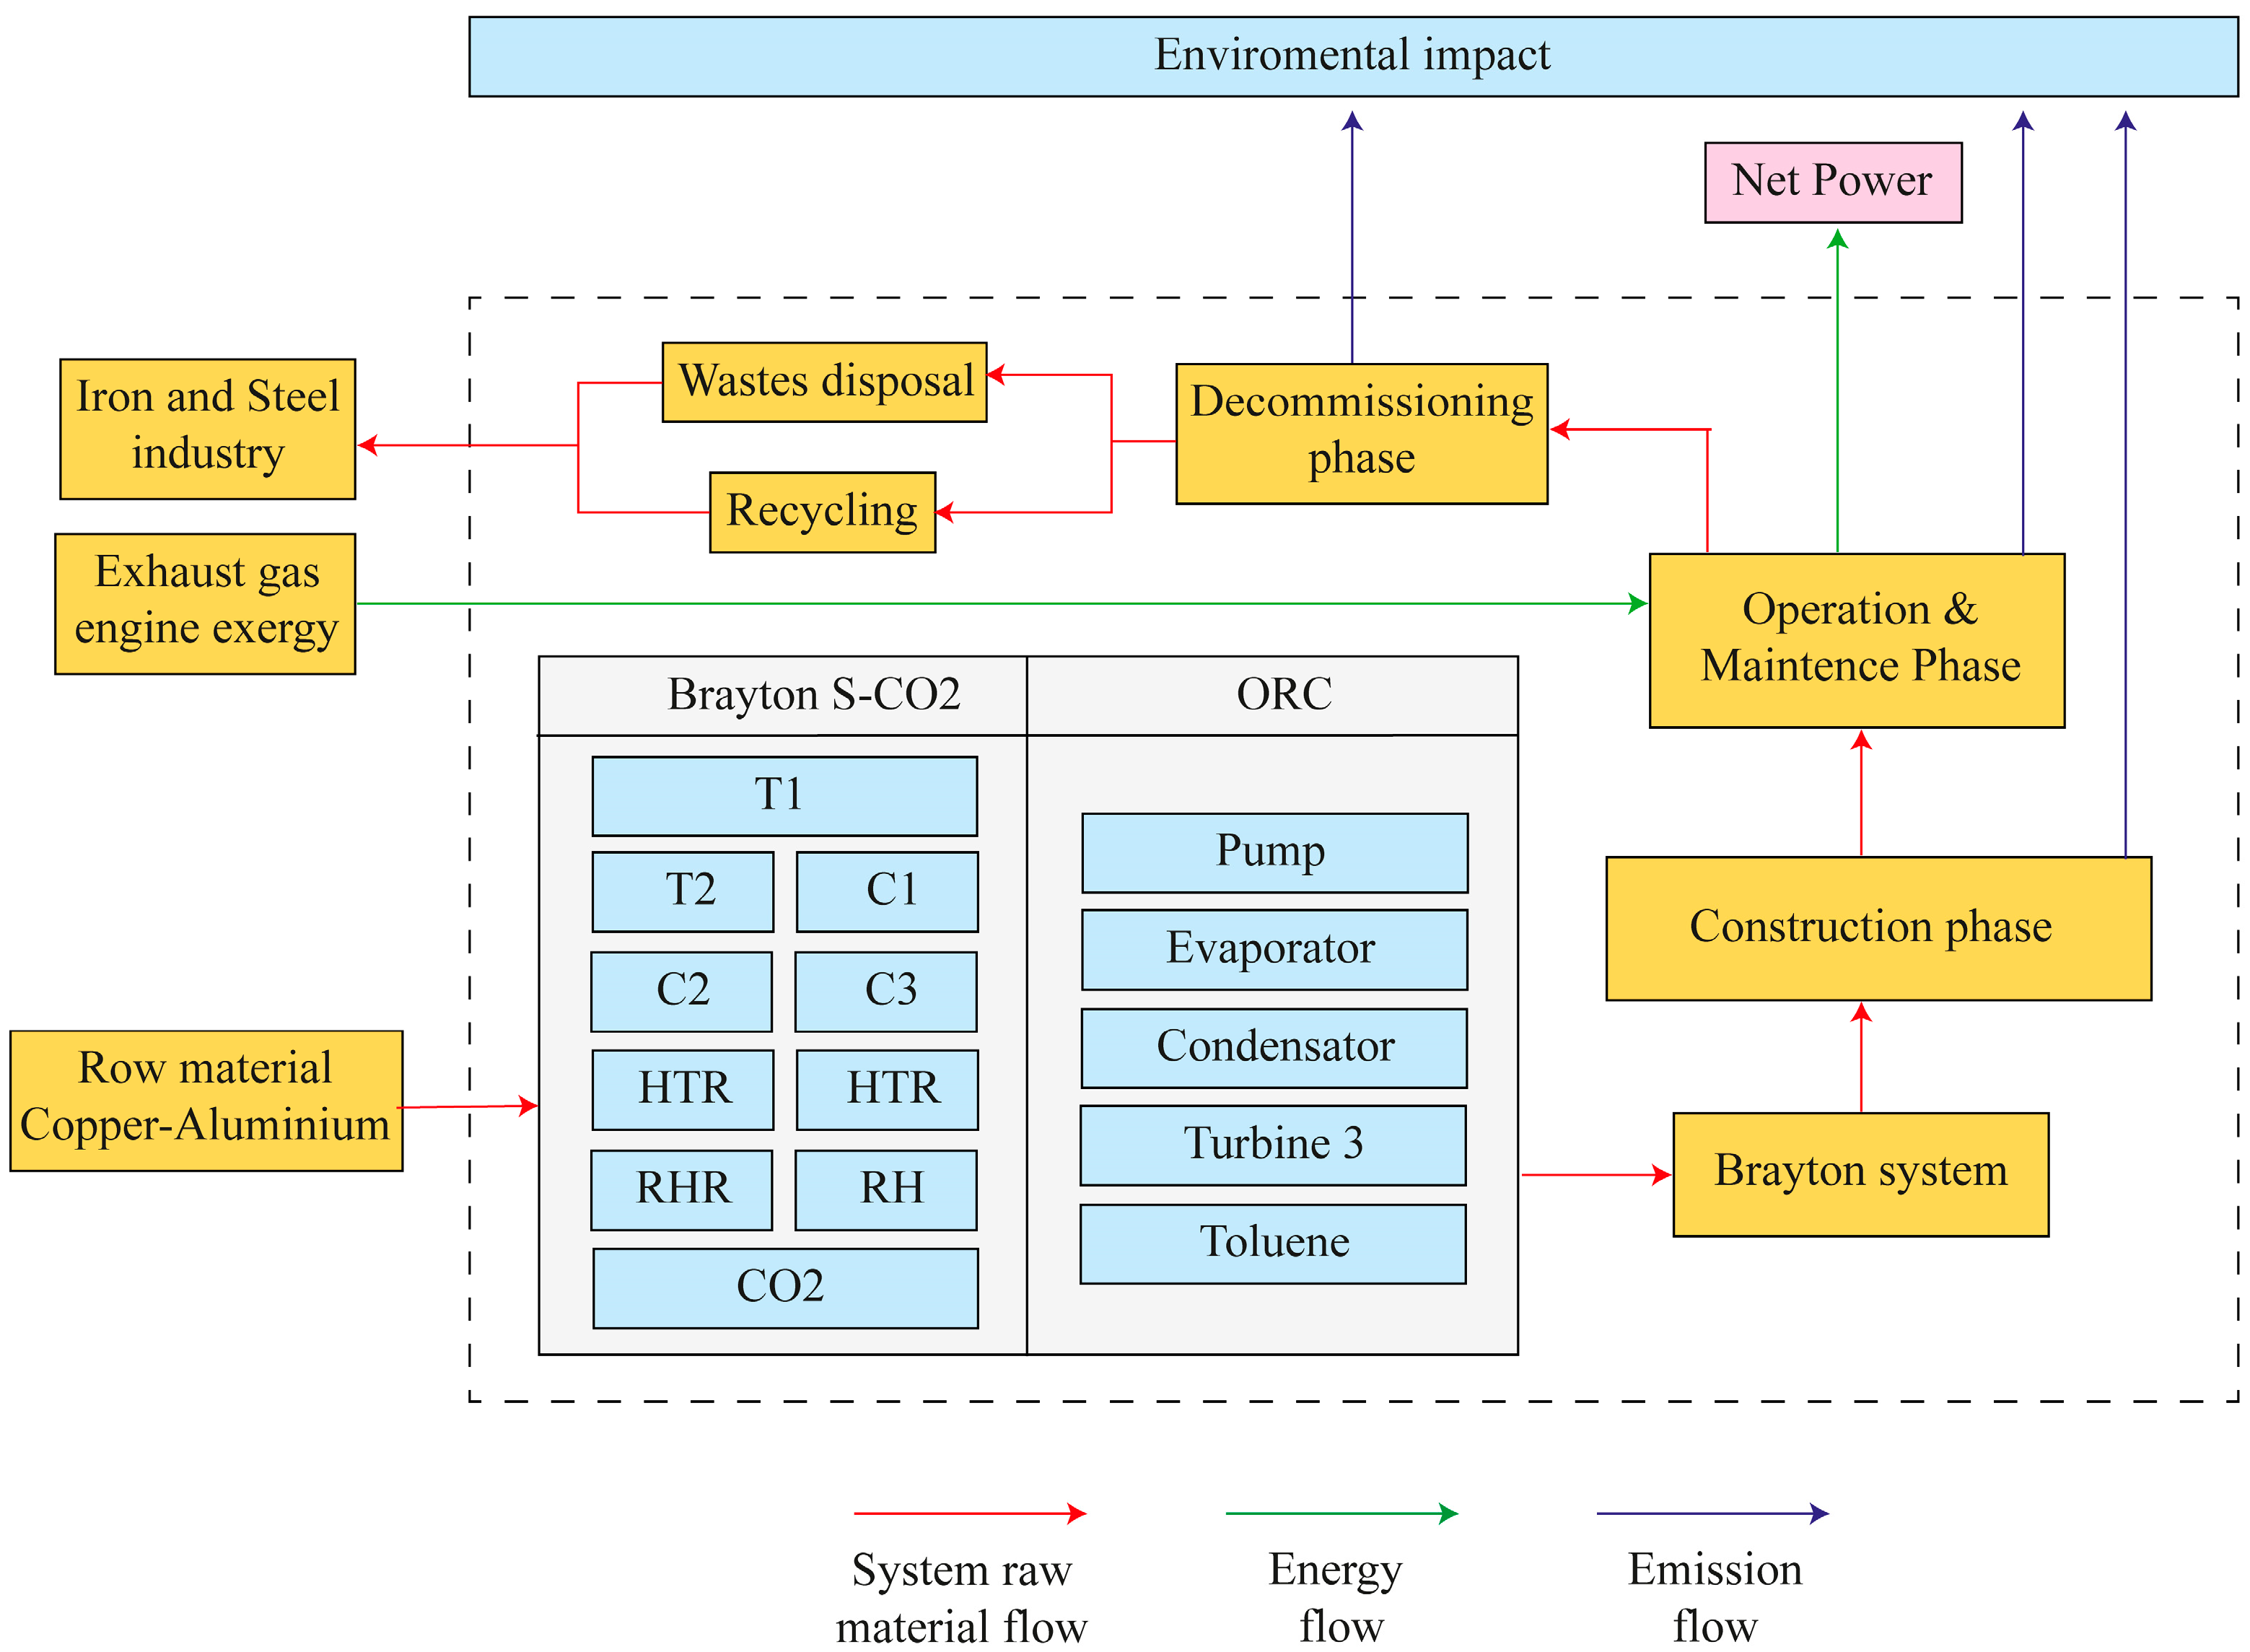
2.4. Life Cycle Assessment
To quantify the carbon footprint of the sCO
2–ORC–solar and sCO
2–ORC–biomass Brayton systems proposed in this study, a life cycle analysis (LCA) methodology was proposed, which allows for estimating the environmental impact of a product or system throughout its life cycle. This methodology is included within the ISO 140009 standards for environmental management [
25].
In this analysis, the following considerations are proposed:
- •
Three life cycle stages are considered: construction, operation, and decommissioning of equipment (
Figure 4) [
43].
- •
In the construction phase, the processes of assembling materials and equipment, as well as the planning of the resources and time required to complete the installation, are addressed.
- •
During the operation phase, the environmental impacts generated during the operation and maintenance of the equipment are evaluated, along with monitoring their performance throughout their life cycle.
- •
The decommissioning phase quantifies the environmental impact generated during the decommissioning process of the equipment and the LCA of the thermal system, considering the environmental effects and the proper management of waste.
- •
It is estimated that, over 20 years, the loss of the working fluid in an ORC is 0.5%, with an operational loss of 10% and an organic loss of 3% during the decommissioning phase [
44].
- •
The construction phase excludes the impact generated by pipes and valves.
- •
The decommissioning phase considers the impacts related to the transportation and disposal of components.
Figure 4.
Life cycle assessment.
Figure 4.
Life cycle assessment.
Additionally, Eco-indicator 99 is used, an environmental impact assessment method that translates environmental repercussions into a single index, facilitating the comparison between different equipment and systems [
25]. Therefore, it is necessary to determine the mass in kg of the equipment that constitutes the proposed systems.
Based on this, the power produced and consumed by the turbines and compressors and the heat transfer area of the heat exchangers are needed. The latter is determined from Equation (19) [
36].
U and Δt represent the heat transfer coefficient and the actual temperature difference, respectively. The mass of the heat exchangers and the turbines, compressors, and pumps is estimated using Equations (20) and (21) [
44].
In Equation (20), the density ρ takes values of 2698.4 kg/m
3 and 8900 kg/m
3 for aluminum and copper, respectively. For the material thickness δ, a value of 0.002 m is assumed. On the other hand, in Equation (21), the material quality α has values of 33.23 kg/kW and 35.03 kg/kW for turbines constructed from aluminum and copper, respectively. For compressors and pumps, α takes values of 14.9 kg/kW and 15.71 kg/kW for aluminum and copper, respectively. Finally, W
j represents the work produced or consumed by the turbines and pumps/compressors, according to the energy balances [
44,
45].
In this regard, Equations (22) and (23) represent the total environmental impact of components and the impact of the working fluid on them, respectively. Equation (24) represents the total carbon footprint across the three LCA phases considered [
43,
44].
The terms ωj, γjωf, γjco, γjom, and γjde correspond to the Eco-indicator 99, the carbon footprint of the working fluid, and the environmental impact generated during the construction, operation, and decommissioning stages, respectively.
To determine the carbon footprint of the solar system, the salts and working fluids circulating within the central concentration tower (CSP) are not considered; only the carbon footprint of the solar field and receiver is considered, modeled by Telsnig et al. [
46] in the global warming potential (GWP) category.
On the other hand, to estimate the mass of the biomass boiler and thereby evaluate the environmental impact of this thermal source, the methodology used by Guillén-Lambea et al. [
47] was considered, which allows for the determination of the total mass of this component.
2.5. Model Validation
This section details the validation of the thermodynamic model proposed in this research. Since there are no studies that directly relate the sCO
2 Brayton cycle with recompression, reheating, and intercooling coupled to an organic Rankine cycle (ORC), that is, an sCO
2–ORC configuration, it is necessary to validate each thermodynamic model separately. Therefore, to validate the proposed model in this work, it is simulated under the same study conditions used in another research. In this regard,
Table 4 presents the input parameters for the two proposed thermodynamic cycles.
Figure 5 presents the results of the thermodynamic comparison conducted for each model, with
Figure 5a,b corresponding to the sCO
2 Brayton cycle and the organic Rankine cycle (ORC), respectively. For turbine inlet temperatures ranging from 500 to 850 °C, the thermal efficiency of the sCO
2 Brayton cycle exhibits a similar trend and a maximum relative error of 2% compared to the model presented by Padilla et al. [
14], indicating consistency in the obtained results.
On the other hand,
Figure 5b illustrates the behavior of the ORC cycle thermal efficiency as a function of the heat source temperature. For temperatures above 120 °C, the proposed model exhibits a very similar trend to Fontalvo’s model [
31], with relative errors of up to 2.8%, which supports the validity of the results obtained in this research.
3. Discussion and Results
This section presents and discusses the results obtained from the energy simulation of the thermodynamic models proposed in this research. The input parameters are described in
Table 1, presented in the System Description section.
3.1. Energy and Exergy Analysis
For the two scenarios proposed in this study (solar and biomass), it was decided to study the influence of the inlet temperature on the turbine in some key variables in the study of the thermal and exergetic performance of sCO
2 Brayton cycles for power production, such as thermal and exergetic efficiency, input and destroyed exergy, and the flue depletion ratio. In this regard, a sensitivity analysis was conducted by varying the temperatures in T1 and T3 from 500 to 850 °C, as shown in
Figure 6,
Figure 7 and
Figure 8.
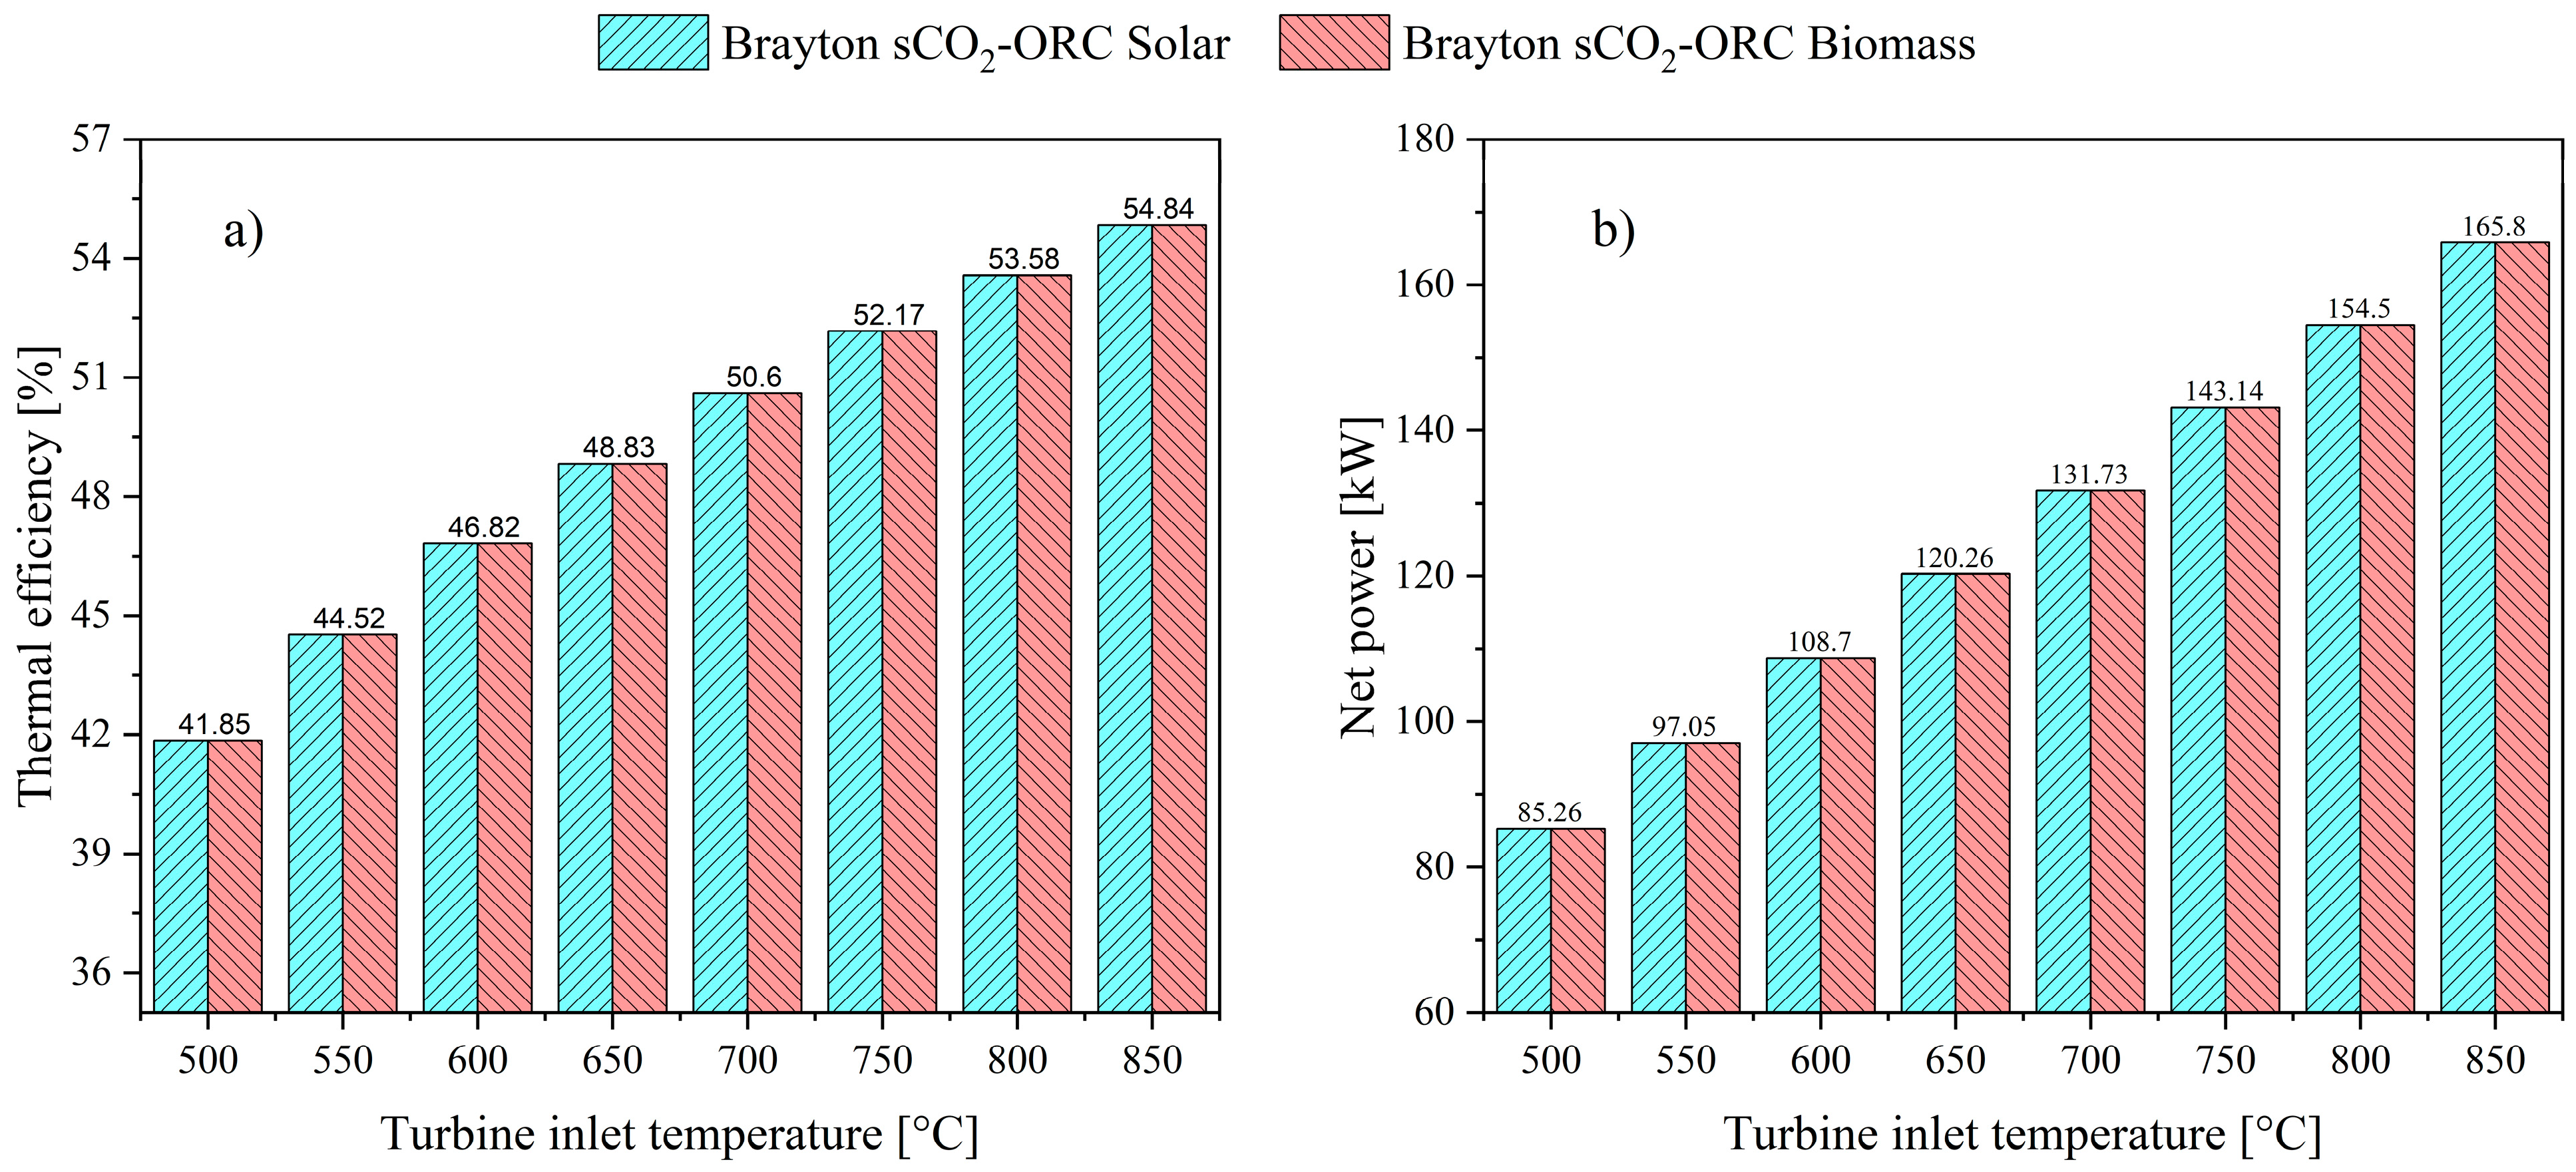
Figure 6 illustrates the behavior of thermal efficiency (
Figure 6a) and net power output (
Figure 6b) of the studied sCO
2 Brayton system. It is observed that increasing the turbine inlet temperature from 500 °C to 850 °C causes the thermal efficiency and total power output to increase by 30% and 94.5%, respectively, considering both study scenarios, with 50.6% and 131.73 kW being the efficiency and work obtained in the base operating condition (
Table 5).
This behavior is primarily associated with the increase in energy in the working fluid. At higher temperatures, CO
2 (or any other working fluid) possesses greater thermal energy, which translates into higher energy content that can be converted into mechanical work through the turbine. Additionally, thermal efficiency increases with an increase in the average temperature at which heat is supplied to the system or with a decrease in the average temperature at which heat is rejected from the system [
48]. Another important factor is related to the working fluid’s density. As temperature increases, the CO
2 density changes, which can affect the flow dynamics in the system. In this regard, a denser fluid improves flow efficiency through the turbine [
10].
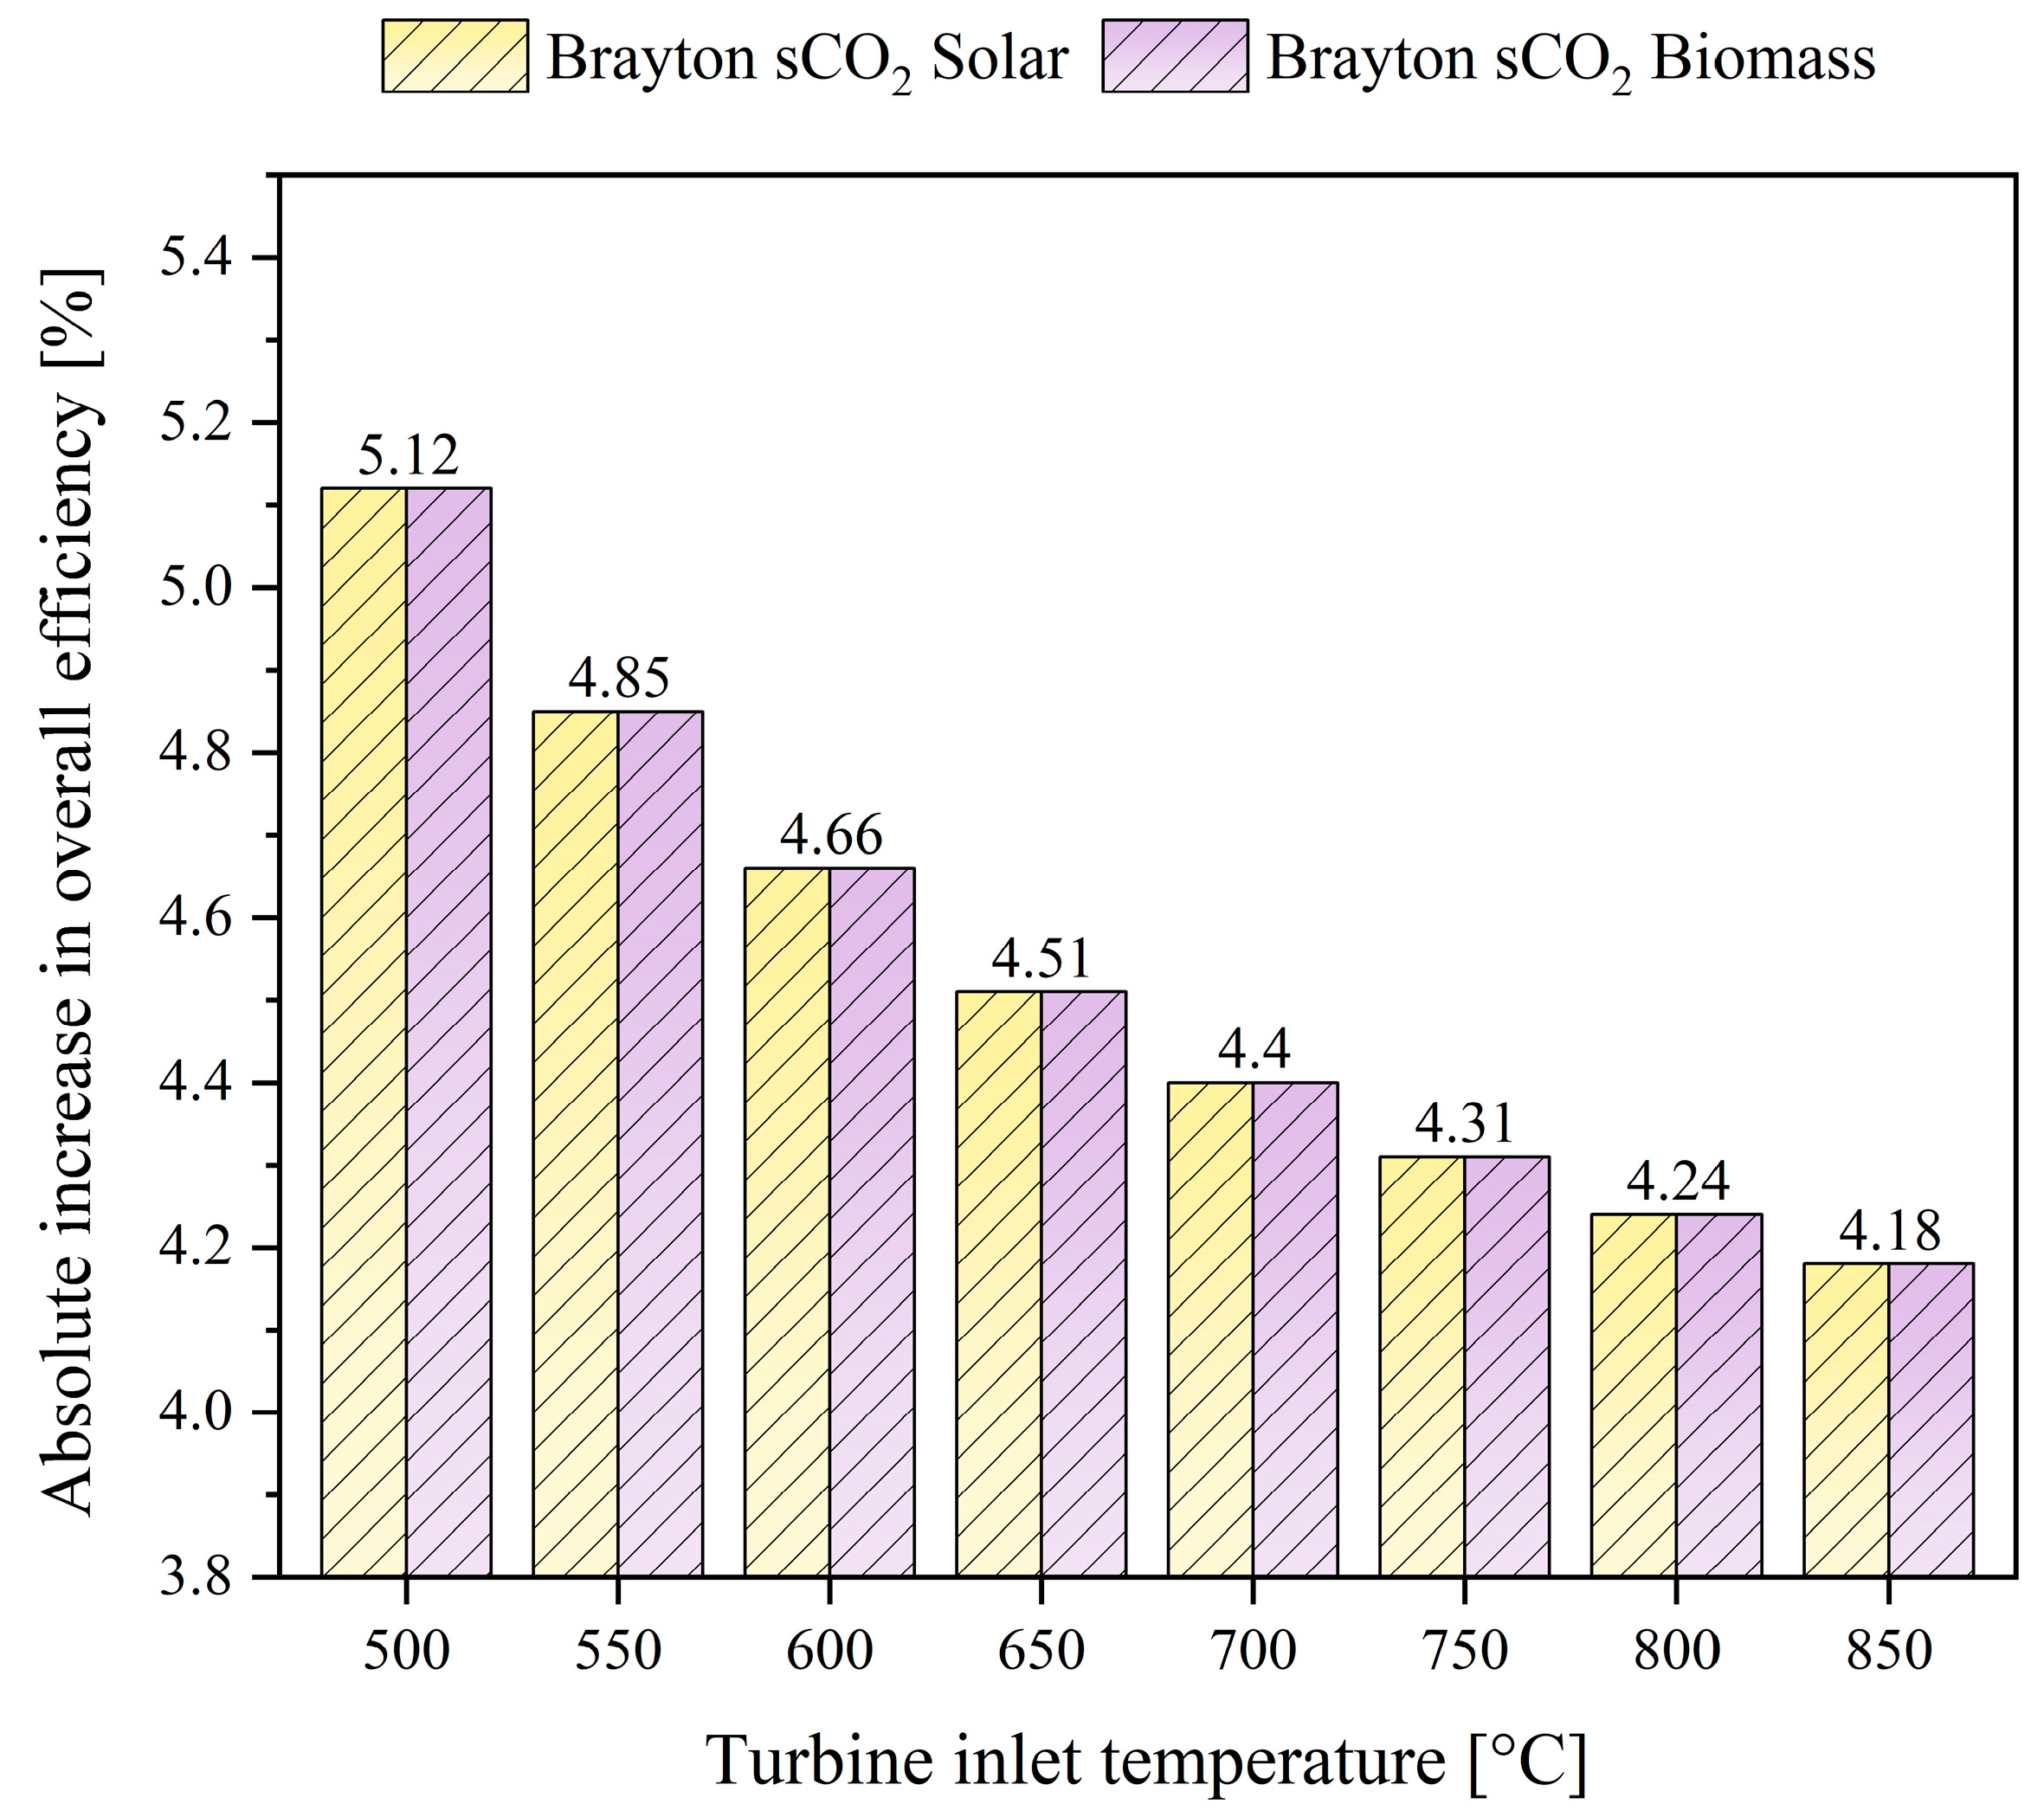
In this study, the influence of the organic Rankine cycle (ORC) on the overall thermal efficiency of the systems is examined. As reported in
Table 5, there was a 4.4% increase in the global efficiency for the two evaluated systems. However, the inlet temperature affects the behavior of this percentage. It was found that within the proposed temperature range (500° C–850 °C), there is an 18% decrease in the absolute increase in global efficiency, with 500 °C being the condition that presents the highest increase.
This is because the ORC working fluid, toluene, exhibits properties characteristic of a dry fluid, such as a positive slope in the saturation region of the TS diagram. These properties allow toluene to utilize waste heat more efficiently when the temperature of the heat input source to the evaporator is lower. Under lower temperature conditions, toluene can absorb more thermal energy due to its high heat transfer capacity and thermal stability, maximizing the recovery of useful heat for conversion to work [
49].
Conversely, at higher temperatures, although more thermal energy is available, the properties of the fluid limit the ability of the ORC to efficiently extract waste heat, which explains the decrease in the absolute increase in overall efficiency. This behavior underscores the importance of properly selecting the working fluid and operating conditions, improving system performance as a function of the thermal source temperature range.
In this regard, it is concluded from
Figure 6a,b and
Figure 7 that the thermal efficiency, net power produced, and the increase in global efficiency of the system are study variables that are independent of the type of thermal source; that is, they do not depend on these sources, as the heat requirement remains the same.
On the other hand,
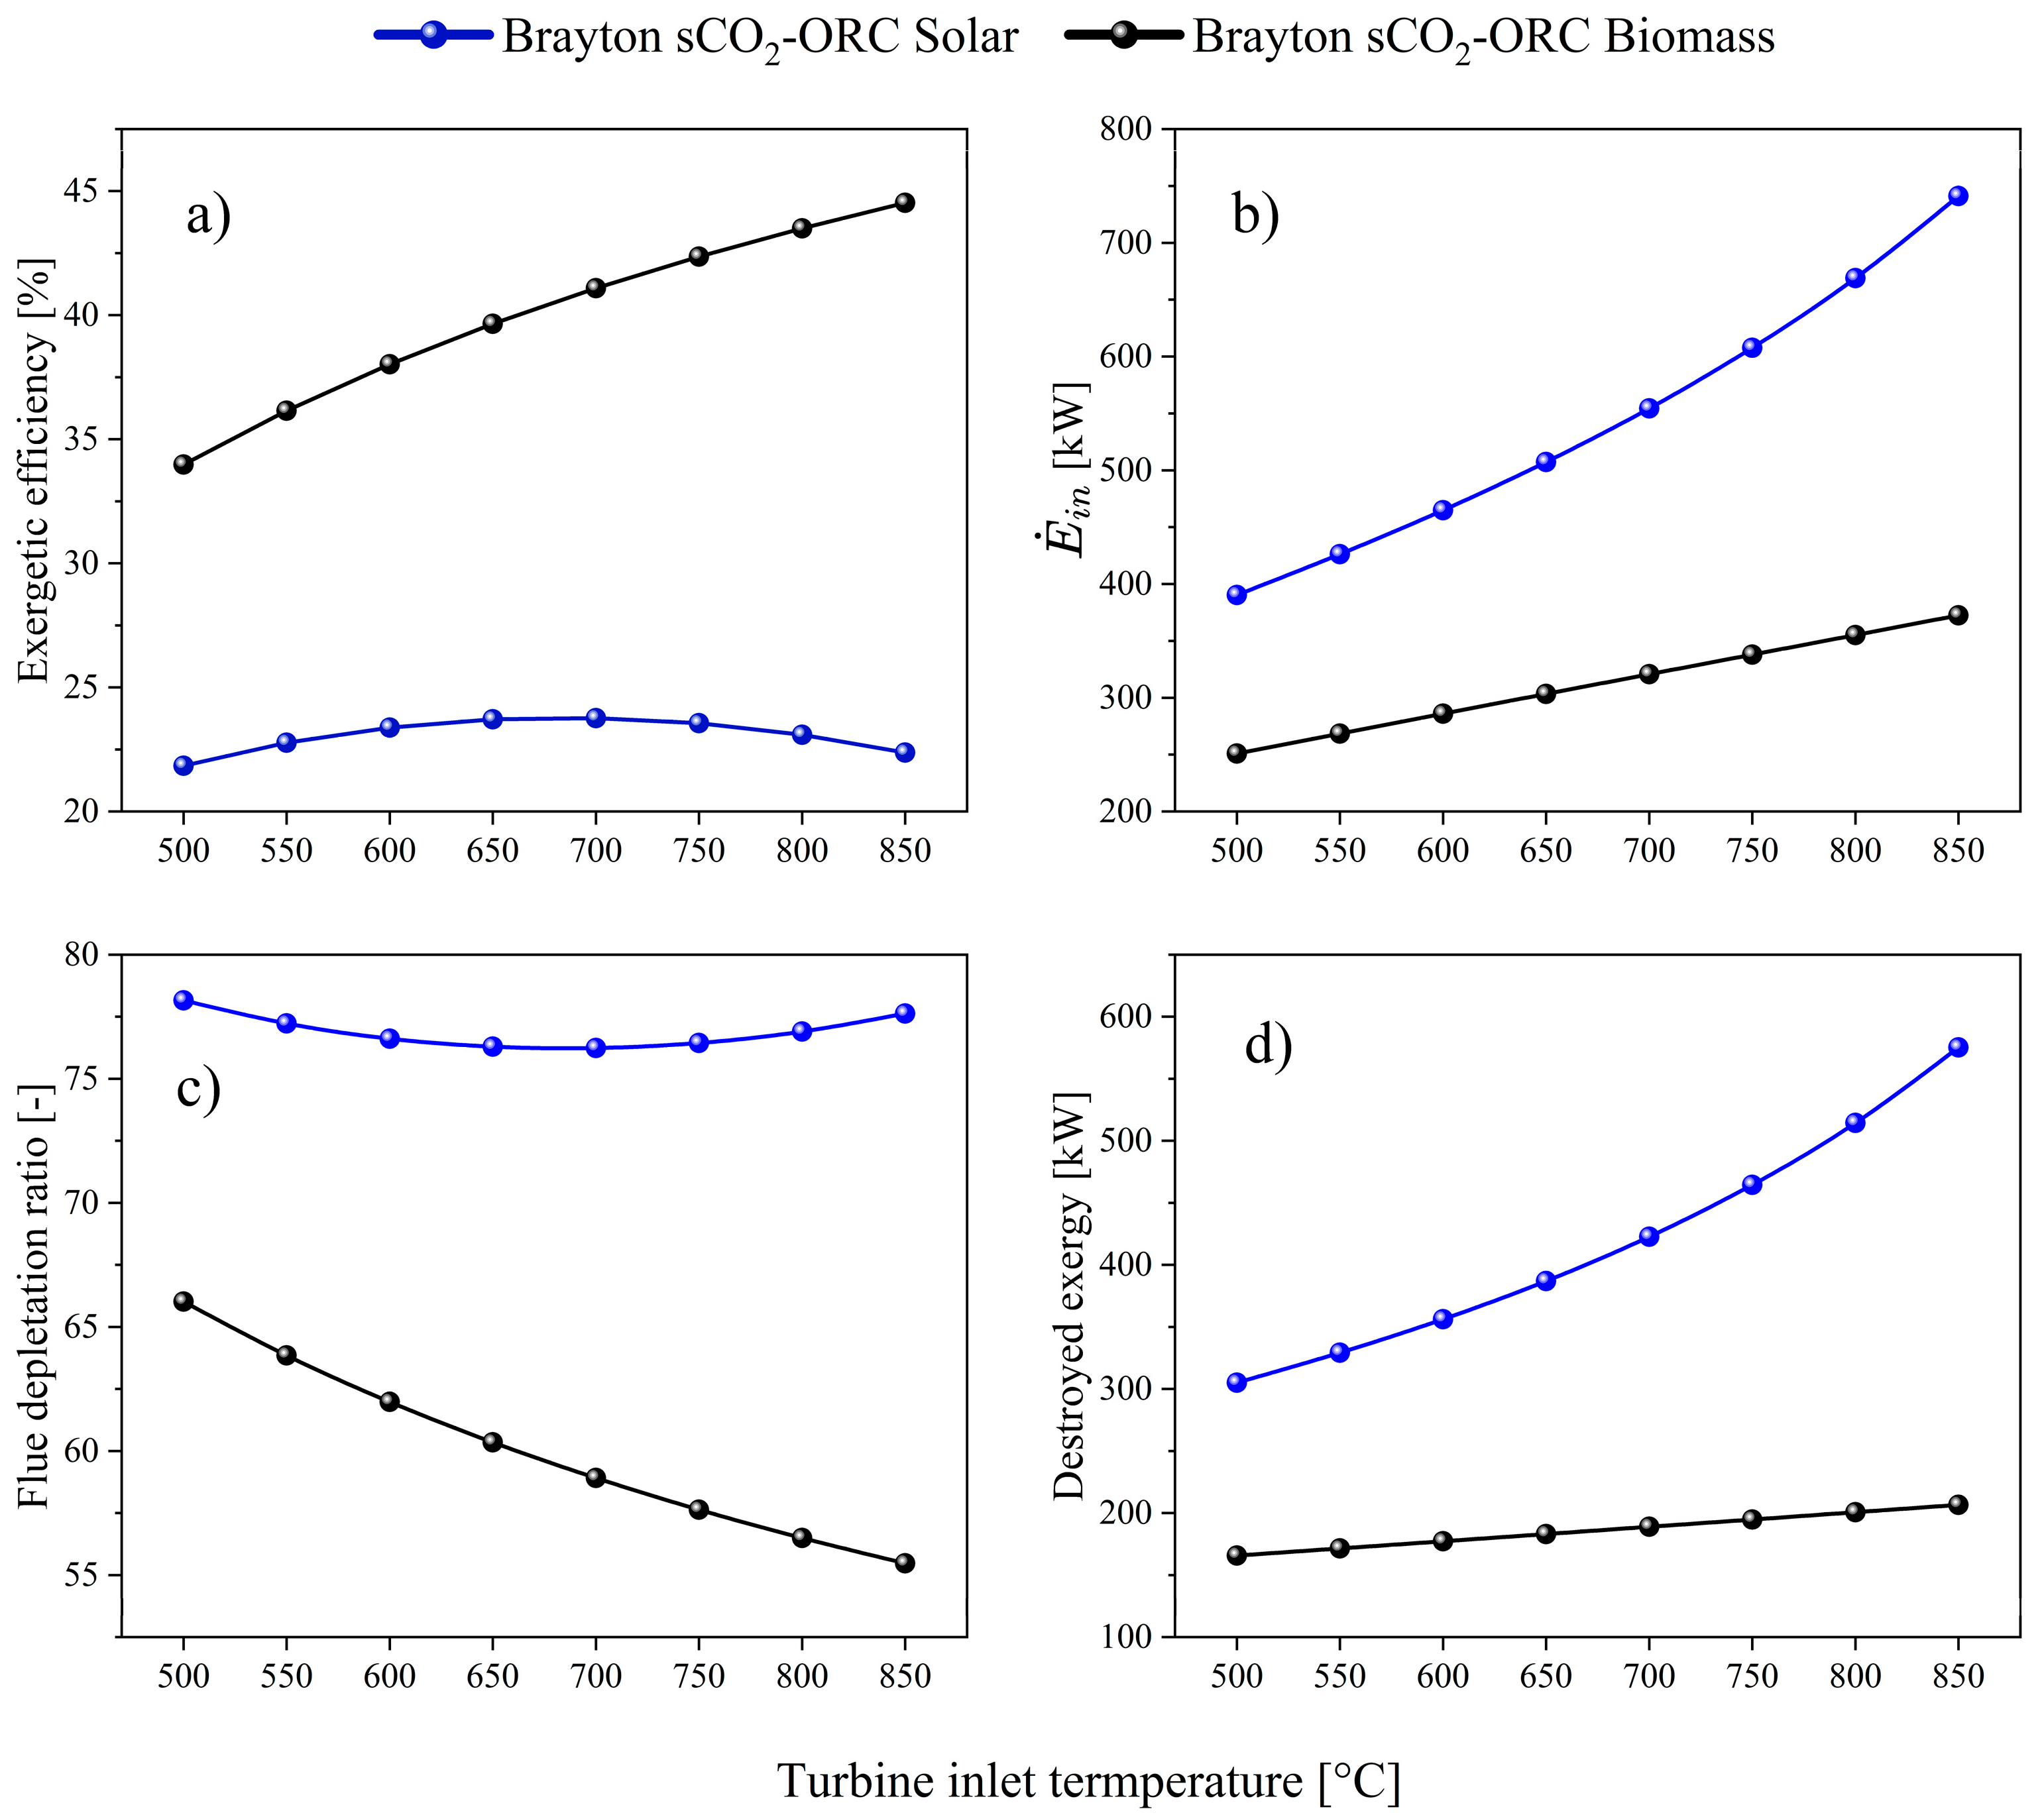
Figure 8 shows the behavior of exergetic efficiency (
Figure 8a), input exergy (
Figure 8b), flue depletion ratio (
Figure 8c), and destroyed exergy (
Figure 8d) as a function of the input temperature to the turbine. The Brayton sCO
2–ORC configuration using biomass as a thermal source (41.1%) exhibited superior exergetic performance compared to the solar-powered system (23.71%), with a percentage difference of approximately 73.3% (see
Table 5).
In this regard, in
Figure 8a, it is observed that when varying the temperatures T1 and T3 from 500 to 850 °C in the sCO
2–ORC–biomass configuration, the exergetic efficiency shows an upward trend, achieving an increase of 31%. The temperature of 850 °C at the turbine inlet represents the operating condition with the best exergetic efficiency results (44.53%). However, this behavior is not replicated in the sCO
2–ORC–solar configuration.
In this case, for temperatures below 650 °C, the exergetic efficiency tends to increase, as the input exergy is higher, and the radiation losses in the solar receiver are lower [
14]. However, starting at 700 °C, the exergetic efficiency begins to decrease due to the increased solar radiation losses to the environment. Thus, the simulation of exergy efficiency in the system operating with solar energy shows a bell-shaped behavior, where the highest exergy efficiencies are achieved in the range of 600–700 °C.
The higher exergetic efficiency of the biomass-operated system, compared to the solar energy system, is explained by the behavior observed in
Figure 8b. This figure shows that the sCO
2–ORC–solar configuration has a greater amount of input exergy than the sCO
2–ORC–biomass system, with a difference of around 73%, which reduces the exergy efficiency as established in Equation (7). This equation relates the net power produced to the input exergy of the system. Since the net power produced is equal in both sCO
2–ORC Brayton systems, and the input exergy is greater in the solar system than in the biomass system, the exergy efficiency of the solar system is lower compared to that of the biomass system.
The trends observed in
Figure 8b are similarly repeated in
Figure 8d. In the latter, the exergy destroyed in both systems increases as the inlet temperatures of the turbines rise. For example, when raising the temperature from 500 to 850 °C, the sCO
2–ORC–solar configuration shows a higher rate of destroyed exergy compared to the biomass-operated system, with increases of 85% in the former and 24.71% in the latter.
The greater loss of exergy in the solar system comes from the energy destroyed and dissipated in the receiver and solar field. As the inlet temperature to the turbine increases, the rate of internally destroyed exergy also rises due to the higher temperature gradient, which intensifies the irreversibilities in the process and, consequently, the heat losses. In other words, the conversion of solar radiation into thermal energy is inefficient, resulting in significant losses in the system.
Finally, in
Figure 8c, the flue depletion ratio (FDR) is studied, which is a measure indicating the amount of exergy (or useful work capacity) that is lost or degraded in the heat generation processes as it exits a thermal system [
38]. In this case, the results presented in
Figure 8c indicate that in the sCO
2–ORC–solar Brayton system, a large portion of the available solar energy was not utilized in the process of converting solar energy to thermal energy, resulting in low exergy efficiency and high indicators of destroyed exergy (see
Table 5). At the industrial level, an excessively high FDR leads to a non-profitable system, as it generates significant operational costs to maintain constant energy production.
The opposite is observed for the FDR obtained in the sCO2–ORC–biomass system, where the curve tends to decrease as the inlet temperature to the turbine increases, with a reduction of 16% when varying the temperature from 500 to 850 °C. In this regard, it can be concluded that operating the system with coconut shell biomass yields better exergy results than operating it with solar energy.
These results reflect the thermodynamic differences between solar and biomass configurations and can be explained by the available literature [
42]. The higher combustion efficiency in biomass systems (95% in this case) generates lower irreversibilities compared to solar systems, where losses are more significant due to the intrinsic characteristics of the solar subsystems.
In particular, the intermittency of solar energy limits its operability to hours of radiation, which can compromise its performance. In contrast, biomass allows a continuous supply of thermal energy, which reduces fluctuations in overall efficiency. This study demonstrates that, by setting the turbine inlet temperature at 700 °C, it is possible to maintain stable power output by determining the amount of heat that must be supplied by the solar receiver or biomass to meet system demands.
Irreversibilities in solar systems are largely due to exergy losses in the solar field and the receiver. For example, the efficiency of the solar field, close to 60% (see
Table 2), implies a loss of about 45% of the available exergy [
14]. In addition, the solar receiver has internal losses associated with entropy change and external losses related to heat transfer by conduction and convection to the environment. As the turbine inlet temperature increases, these losses also increase, highlighting a notable difference in efficiency between the two configurations evaluated.
3.2. Environmental Impact of the Systems
This section presents the carbon footprint results obtained in the life cycle assessment (LCA) of the two sCO
2–ORC configurations studied. However, as described in
Section 2.4, it is necessary to determine the power of the turbines, compressors, and pumps, as well as the heat and transfer area of the heat exchangers. In this regard,
Table 6 presents the calculation of the heat, power, and transfer area of the devices in the sCO
2–ORC configuration, which are independent of the type of thermal source used (solar and biomass).
On the other hand,
Table 7 presents the carbon footprint of the working fluids circulating in the sCO
2–ORC Brayton system, with carbon dioxide and toluene as the fluids circulating through the supercritical Brayton and ORC systems, respectively, during the construction, operation, and decommissioning stages. A comparative analysis of the carbon footprint generated by working fluids in each of its LCA phases allows for highlighting the main opportunities for improving environmental performance, in addition to recommending the most suitable working fluid from an environmental perspective.
It is observed that CO
2 is the working fluid that emits the most kg CO
2-equi to the environment, representing approximately 97.2% (1282.34 kg CO
2-equi) of the total environmental impact from working fluids, while toluene accounts for 2.7% (36.41 kg CO
2-equi). This is because CO
2 is used in larger volumes, which results in a higher global warming potential [
50]. Compared to other systems, such as organic Rankine cycles, the required volumes of fluid are usually smaller due to the thermophysical properties of these, such as higher density or heat capacity. In contrast, CO
2 in the supercritical state, although highly efficient in terms of heat transfer and component compaction, requires larger volumes due to its lower relative density under these conditions [
10].
Additionally, in both substances, the construction stage was the LCA phase with the highest pollution (1170.14 kg CO
2-equi), followed by the operation phase (117.01 kg CO
2-equi) and decommissioning (31.59 kg CO
2-equi). The environmental impact generated during the construction stage in the working fluids is directly related to the power supplied by the turbomachinery. This stage depends on the processes required to manufacture the components to achieve and maintain the operating conditions, including the procurement and handling of the fluid in a supercritical state [
30].
Regarding the impact generated by thermal sources, it was found that the solar concentration tower (CSP) had an impact 85.62% greater than that of the biomass furnace, indicating a difference of 94,121.94 kg CO
2-equi, as shown in
Figure 9. This result is associated with the high amount of carbon footprint emissions from the solar concentration tower (CSP) due to the extensive surface area required for constructing the solar field, the large number of heliostats needed, and other processes involved in building the facilities [
24].
The manufacture of heliostats involves complex processes that require special materials, such as glass, metal structures, and high-precision coatings, all of which are energy-intensive. In addition, the large size of solar fields requires significant terrain modifications, which affects ecosystems and requires complex logistics for installation. These factors contribute significantly to the increase in carbon emissions during the construction phase of the system.
As with the total carbon footprint generated by the working fluids, in both thermal sources, the construction stage was the one that emitted the most kg CO
2-equi, representing approximately 95.45% of the environmental impact from thermal sources (see
Table 8).
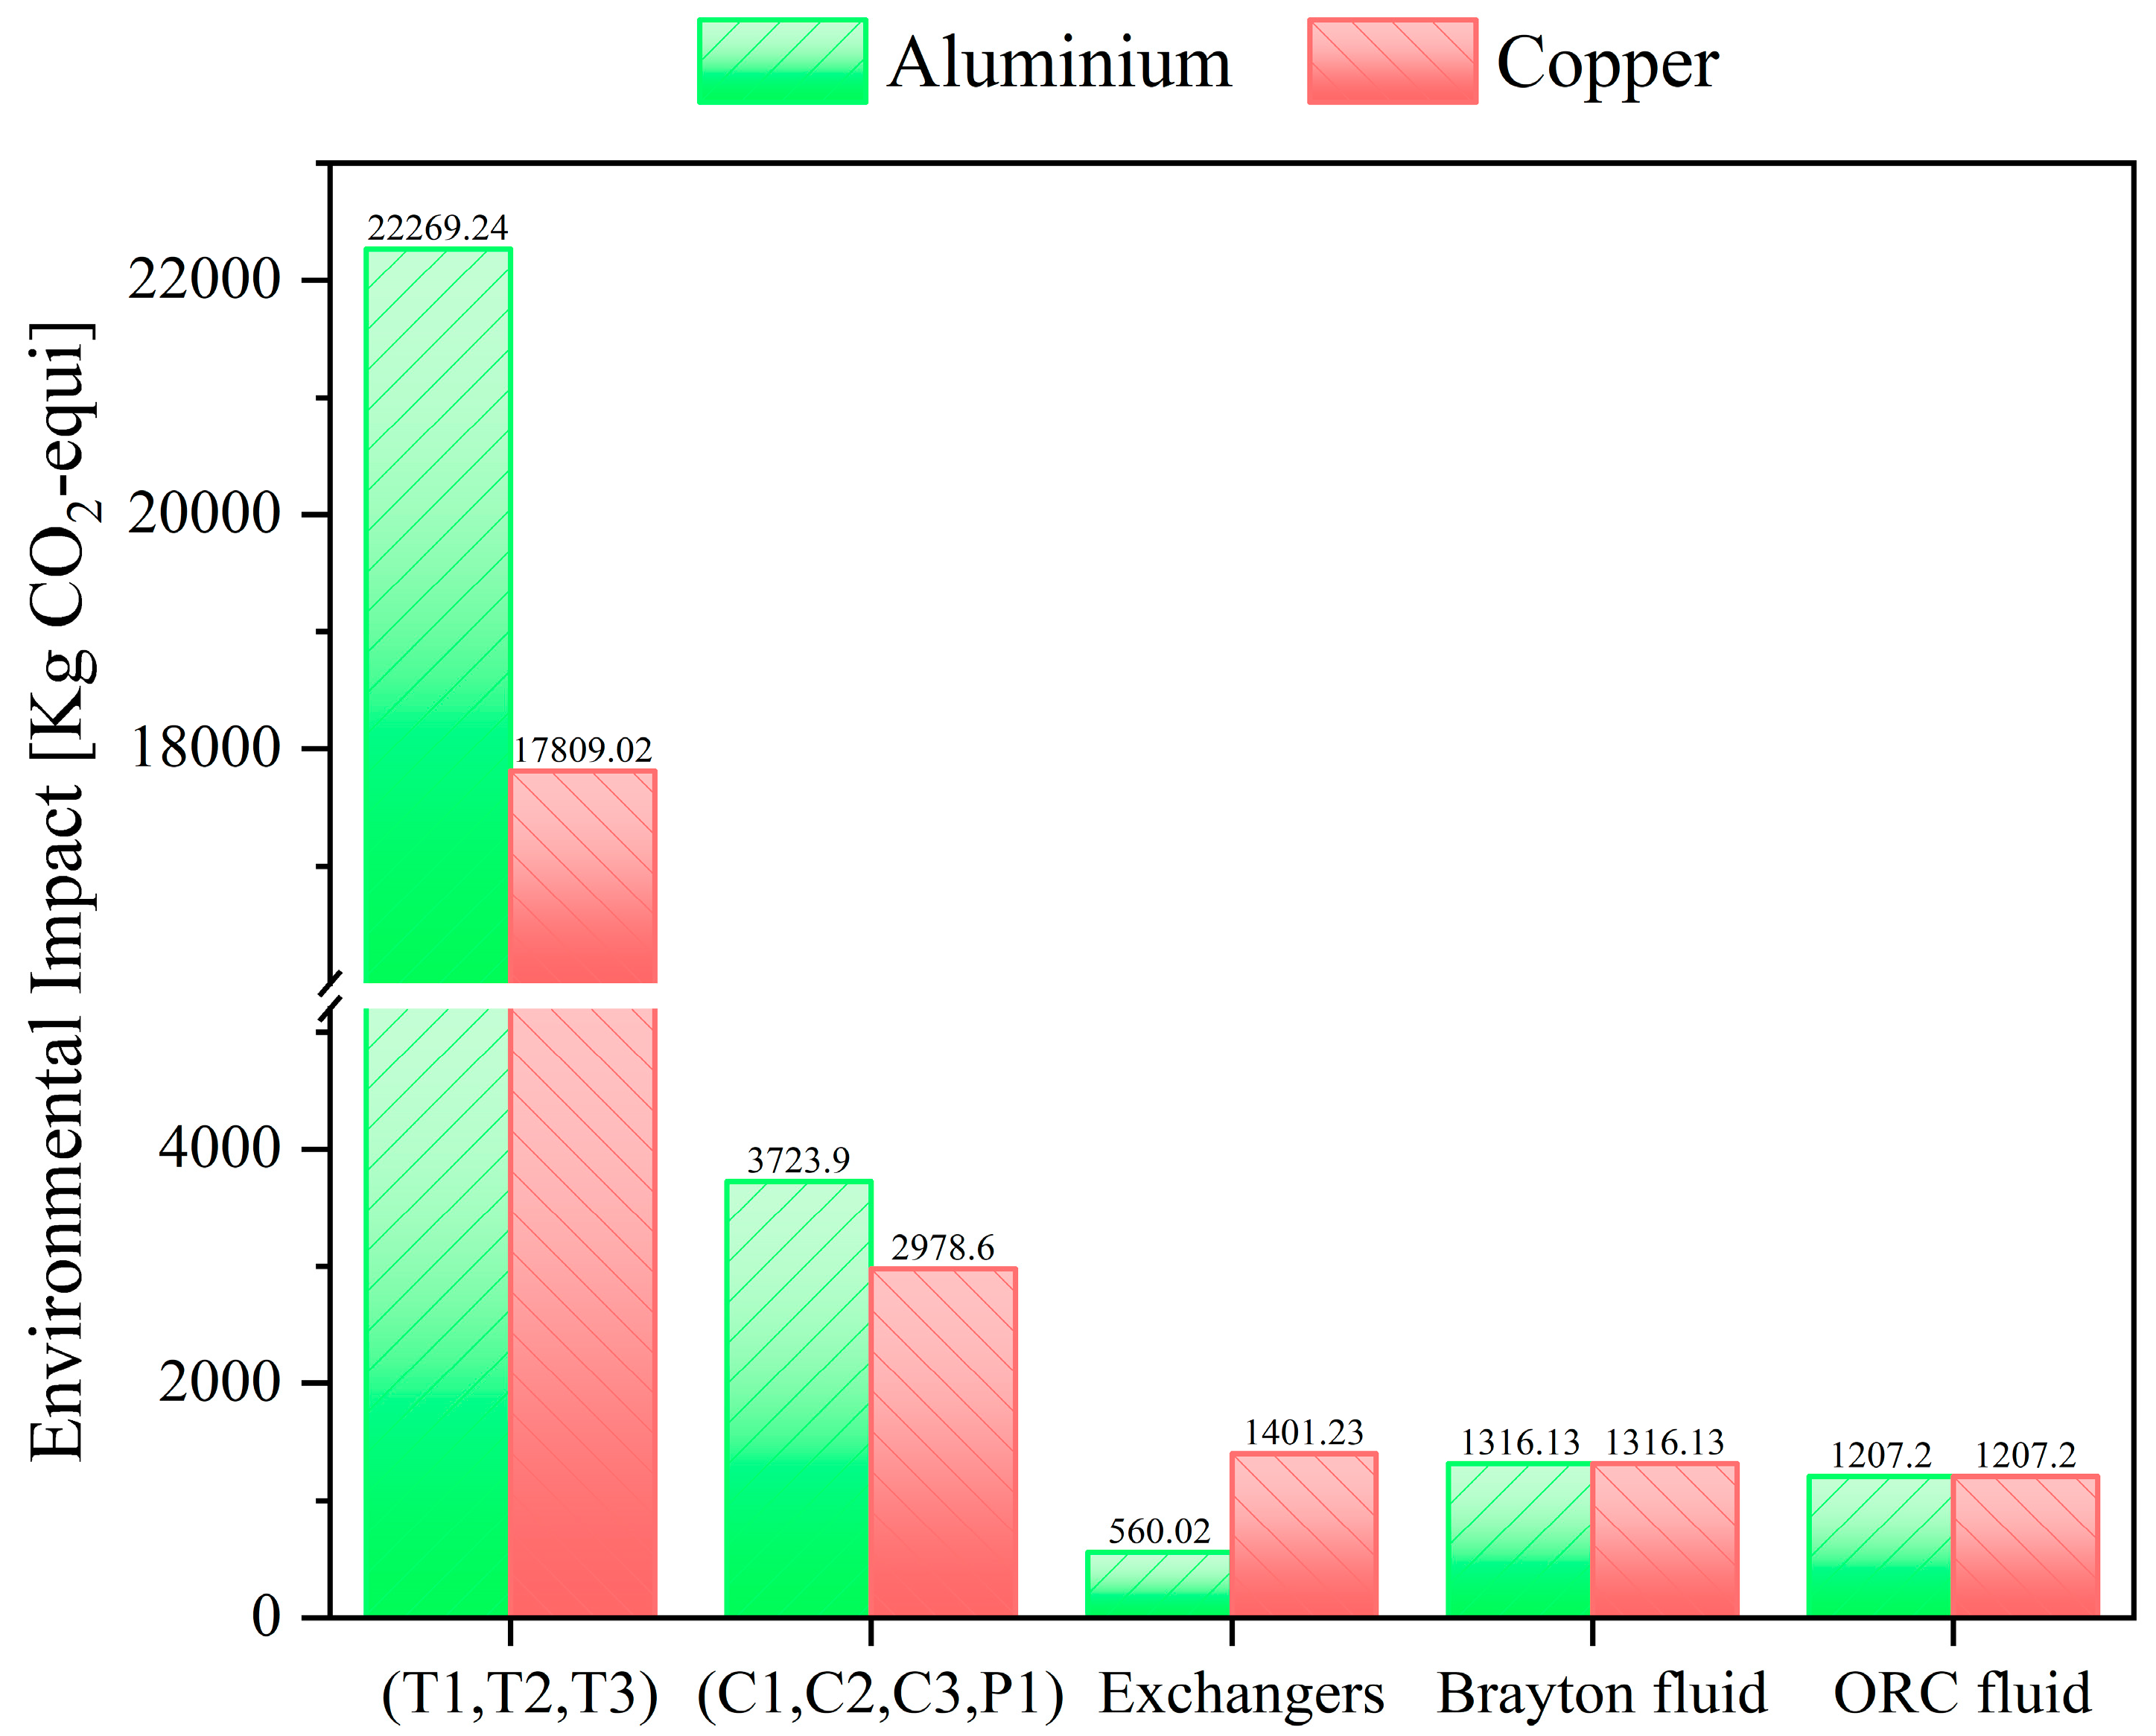
Another important carbon footprint to evaluate is that generated by the devices. The environmental impact generated by the components of the sCO
2 configuration is independent of the thermal source because they provide the same energy demand required by the power production cycle. Therefore, a single analysis can be performed without the need to include the previously obtained carbon footprint of the thermal sources. Additionally, to assess the effect of two construction materials on the environmental impact of each device, two case studies are proposed: in the first, it is assumed that all components are made of aluminum, and in the second, of copper. Based on this,
Table 9 and
Figure 10 present the results obtained for the carbon footprint of each device for the two materials mentioned.
In
Table 9, it can be observed that the environmental impact of the devices in the two proposed materials is proportional to the estimated mass in kg using the LCA methodology. Thus, the turbines and compressors have higher kg CO
2-equi compared to the heat exchangers. In this sense,
Figure 10 shows that the group of turbines (T1, T2, T3), compressors/pumps (C1, C2, C3, P1), and heat exchangers represent 76.6%, 12.8%, 2%, and 72.1%, 12.1%, and 5.7% of the total environmental impact generated by the sCO
2–ORC devices constructed from aluminum and copper, respectively. Additionally, the percentage fraction of the carbon footprint of the two working fluids in these materials represents 8.7% (aluminum) and 10.2% (copper) concerning the total estimated impact in the sCO
2–ORC configuration. Turbines pollute more because their design and construction are directly linked to the amount of power they produce, which demands a greater amount of material and energy for their manufacture, generating a proportionally greater environmental impact.
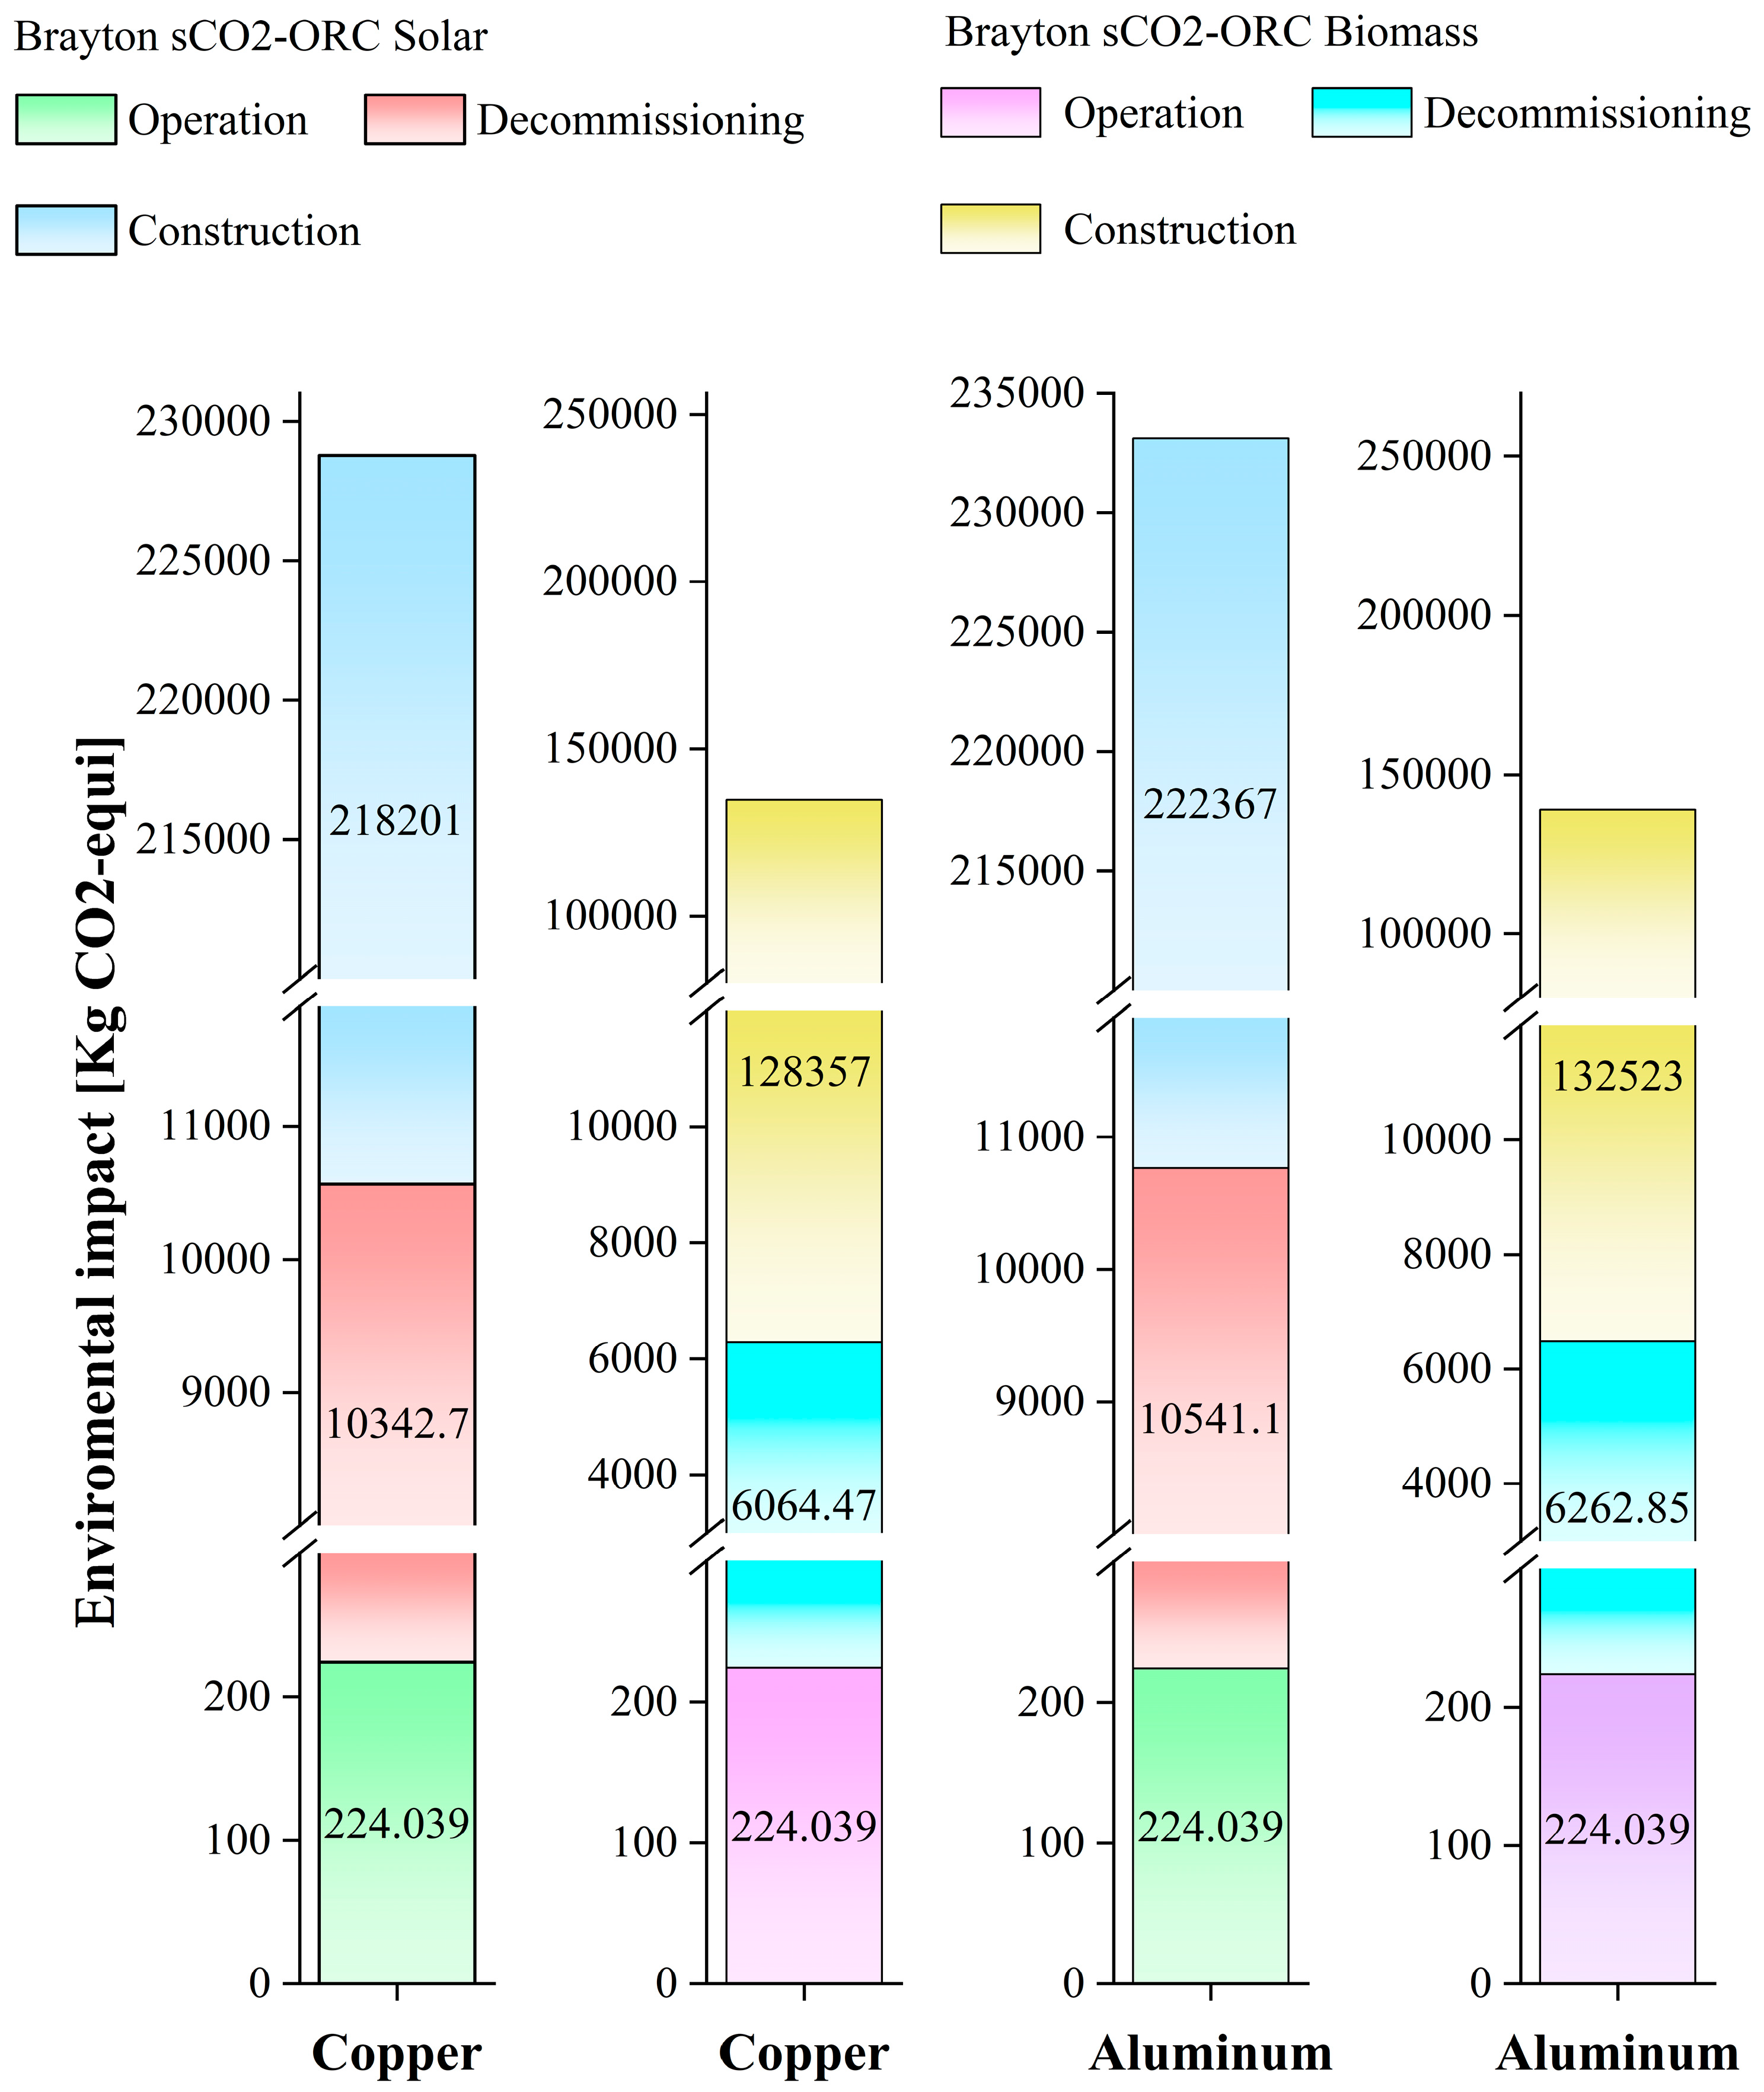
Finally,
Figure 11 presents the total carbon footprint in kg CO
2-equi for each of the three phases evaluated for the two initially proposed scenarios: sCO
2–ORC–solar and sCO
2–ORC–biomass. In this sense, it takes into account the total environmental impact generated by the thermal source, the devices, and the working fluids.
It can be observed that the sCO
2–ORC–biomass configuration has lower total emissions to the environment compared to the configuration operating with solar energy, with a difference of approximately 41.14% and 40.37% for the construction materials copper and aluminum, which is consistent with what is presented in
Figure 9. On the other hand, the construction phase in both configurations represented about 95% of the total carbon footprint, followed by the decommissioning stage (~4.5%) and operation stage (~0.1%) for the two evaluated materials.
In addition, it was also found that aluminum emits higher amounts of carbon footprint than copper, with percentage differences of 2% for the sCO
2–ORC–solar system and 3.2% for the sCO
2–ORC–biomass system. This behavior is associated with the indicator in
Table 9, measured in kg CO
2-equi/kg, which varies depending on the type of material. In this case, this indicator for aluminum is higher than for copper, which affects changes in the carbon footprint.
This is mainly because aluminum production requires more energy-intensive processes, such as electrolysis in the Hall–Héroult process, which requires significantly more electricity, often from fossil fuel sources [
51]. Furthermore, bauxite extraction and refining are more complex and energy-intensive compared to the steps required for copper production.
It is important to note that this study focused on analyzing the carbon emissions associated primarily with the construction and initial operation phases of the systems evaluated. While these stages provide a solid basis for understanding the environmental impact of the proposed configurations, the long-term maintenance and operation phases were not included in this analysis.
Incorporating a full life cycle analysis, which considers these phases, is critical to obtaining a more comprehensive assessment of environmental impact. Therefore, it is proposed that future research expands this approach, considering aspects such as periodic maintenance, operational efficiency over time, and the final disposition of system components. This approach could provide a more complete perspective of the environmental implications associated with the implementation of these energy systems.
4. Conclusions
This research conducted a comparative analysis of energy, exergy, and life cycle assessment (LCA) for two renewable energy sources (solar and coconut shell biomass), integrated into a supercritical Brayton cycle with recompression, reheating, and intercooling, which incorporated an organic Rankine cycle (ORC) for waste heat recovery. The energy indicators showed thermal efficiencies and net power outputs of 50.6% and 131.73 kW in both proposed systems, verifying that these two study variables are indifferent to the type of thermal source used, as they provide the necessary input heat to meet the same energy demand. Additionally, it was confirmed that increasing the turbine inlet temperature from 500 °C to 850 °C affects the behavior of these variables. In this regard, it was found that energy efficiency and net power output increased by 30% and 94.5%, respectively.
On the other hand, when evaluating the exergy performance of the proposed systems, it is observed that the thermal source influences exergy efficiency, input exergy, flue depletion ratio, and total exergy destruction. The sCO2–ORC–biomass system reported better exergy efficiency (41.1%), lower input exergy (320.61 kW), lower flue depletion ratio (58.9), and lower exergy destruction (188.88 kW) compared to the sCO2–ORC–solar configuration (23.76%, 554.37 kW, 76.24, and 422.63 kW, respectively) for the proposed operating condition. As with energy indicators, temperature affects the exergy performance. For example, increasing the turbine inlet temperature from 500 °C to 850 °C raises exergy efficiency in the sCO2–ORC–biomass system by 31%. However, the same does not apply to the solar energy system. In this system, exergy efficiency increases for values below 650 °C but decreases for values above 700 °C.
Finally, when evaluating the carbon footprint of these configurations, it is found that CO2 is the working fluid that contributes most significantly to the environmental impact in the sCO2–ORC Brayton system, accounting for approximately 97.2% of total carbon emissions from fluids, primarily due to its high volume of use. Regarding the thermal sources, the solar concentration tower generates 85.62% more carbon emissions than the biomass furnace, attributable to the intensive construction materials and processes, such as the extensive surface area and the number of heliostats required.
When evaluating the devices in the sCO2–ORC system, it was found that the environmental impact depends on the mass and construction material. Turbines and compressors generate the largest carbon footprint, with aluminum having a slightly higher impact than copper due to its greater emission factor in kg CO2-equi/kg. Overall, the sCO2–ORC–biomass configuration has lower total emissions than the solar-powered system, with differences of 41.14% and 40.37% for copper and aluminum components, respectively. The construction phase accounts for about 95% of the total emissions in both systems, with a smaller contribution from the decommissioning and operation phases.
This type of study ensures the energy, exergy, and environmental viability of implementing these systems on a real scale. However, currently, these systems face serious limitations regarding thermal storage in solar concentration towers (CSP) and the constant supply of waste to the biomass burner. In addition, factors such as geographic location, seasonal variations, and challenges associated with operational scaling could significantly impact system performance in real-world scenarios.
For this reason, it is recommended that future studies evaluate the performance of hybrid generation systems that integrate solar energy and biomass into a single system. Additionally, incorporating economic analysis and multi-objective optimization will not only ensure the technical and environmental feasibility of these systems but also identify the optimal conditions for their implementation in different geographical and operational contexts. This will help overcome the current limitations and encourage wider adoption of these systems in practical applications.


