Abstract
This paper presents the development of an Artificial Intelligence (AI)-based integrated dynamic hybrid PV-H2 energy system model together with a reflective comparative analysis of its performance versus that of the commercially available HOMER software. In this paper, a novel Particle Swarm Optimization (PSO) dynamic system model is developed by integrating a PSO algorithm with a precise dynamic hybrid PV-H2 energy system model that is developed to accurately simulate the hybrid system by considering the dynamic behaviour of its individual system components. The developed novel model allows consideration of the dynamic behaviour of the hybrid PV-H2 energy system while optimizing its sizing within grid-connected buildings to minimize the levelized cost of energy and maintain energy management across the hybrid system components and the grid in feeding the building load demands. The developed model was applied on a case-study grid-connected building to allow benchmarking of its results versus those from HOMER. Benchmarking showed that the developed model’s optimal sizing results as well as the corresponding levelized cost of energy closely match those from HOMER. In terms of energy management, the benchmarking results showed that the strategy implemented within the developed model allows maximization of the green energy supply to the building, thus aligning with the net-zero energy transition target, while the one implemented in HOMER is based on minimizing the levelized cost of energy regardless of the green energy supply to the building. Another privilege revealed by benchmarking is that the developed model allows a more realistic quantification of the hydrogen output from the electrolyser because it considers the dynamic behaviour of the electrolyser in response to the varying PV input, and also allows a more realistic quantification of the electricity output from the fuel cell because it considers the dynamic behaviour of the fuel cell in response to the varying hydrogen levels stored in the tank.
1. Introduction
The optimal design of hybrid renewable–hydrogen energy systems is of paramount importance for ensuring the efficient use of intermittent renewable sources with hydrogen energy storage prior to embarking into their high investment costs. A well-designed hybrid renewable–hydrogen energy system not only could enhance the efficiency and sustainability of energy generation but also, on the broader context, could indirectly support future energy trading opportunities by monetizing surplus renewable energy in wholesale electricity markets, or among peer-to-peer energy trading platforms and multi-energy microgrids [1]. While the optimal design of hybrid renewable–hydrogen energy systems opens potential endeavours for energy efficiency, sustainability and future energy trading, the ability to reduce the levelized cost of energy (LCOE) of such systems represents an immediate and major concern. Within this context, project managers and decision makers need accurate, effective and reliable computational modelling tools that enable them to assess the costs of the optimal design options of hybrid renewable–hydrogen energy systems suited for integration within their buildings while visualising the simulation of their associated dynamic energy management prior investment. Access to such tools will enable the comparison of different hybrid system configurations and to further assess their feasibility in terms of their technical, economic or environmental metrics. Numerous software tools have been reported in the literature [2,3] for modelling hybrid renewable–hydrogen energy systems. Among these, Hybrid Optimization of Multiple Energy Resources (HOMER) represents the most predominantly used software in academia and industry for optimizing the sizing of stand-alone or grid-connected hybrid renewable–hydrogen energy systems from an economic prospect [4,5,6,7,8]. HOMER, which is developed by the National Renewable Energy Laboratory (NREL) [9], enables the simulation of modern technologies such as PV panels, wind turbines, battery banks, electrolysers, hydrogen storage systems and fuel cells, and it is possible to assess the feasibility of different hybrid system sizing configurations [2]. Despite its explicit optimal sizing capabilities, HOMER disregards the electrochemical dynamic behaviour of electrolysers and fuel cell stacks when operating at variable power levels. In HOMER, the models used for simulating electrolysers and fuel cell stacks rely on an average assumed efficiency [9], without investigating the impact of transient load variations on their output. This, therefore, introduces a shortcoming in quantifying the exact rate of hydrogen production by electrolysers together with the hydrogen fuel consumption by the fuel cell and its output power generation. In common with HOMER, there exist few software tools that can be used for sizing hybrid renewable–hydrogen energy systems. These include Improved Hybrid Optimization by Genetic Algorithms (iHOGA), Transient System Simulation (TRNSYS) and Renewable Energy and Energy Efficiency Technology Screen (RETScreen). iHOGA allows mono or multi-objective optimization of stand-alone or grid-connected hybrid renewable–hydrogen energy systems [10]; however, the professional version (Pro+) has an upper load limit of 5 MW, and the educational free version (EDU) is limited to a daily load of 7 kWh [11]. Thus the software is more suitable for small to medium-sized hybrid renewable energy systems. TRNSYS is a simulation software that was initially designed for simulating thermal hybrid energy systems [12]. While the software is primarily used for transient system simulations, it can help with the sizing of hybrid systems using deterministic approaches as studied in [12], although without optimization [10]. RETScreen is an excel-based decision-support tool that enables assessment of the financial feasibility of renewable energy and co-generation projects. RETScreen is an effective tool for pre-feasibility studies, although it has rarely been used in literature research and only a few literature insights [13] have investigated its usage for the optimal sizing of renewable energy resources within buildings. Moreover, it has limited support for hydrogen technologies as it does not offer specific built-in models for electrolysers, hydrogen storage and fuel cells. Instead, users can indirectly simulate hydrogen-related projects through the combined heat and power model; however, this is not as detailed as those models available for the renewable energy technologies.
On the other hand, Artificial Intelligence (AI) algorithms can be seen evolving in this field and have demonstrated promising abilities in optimizing the sizing of hybrid renewable–hydrogen energy systems. To this end, several researchers have developed mathematical models for addressing the optimal sizing of hybrid renewable–hydrogen energy systems using AI algorithms including Genetic Algorithm (GA) [14,15], Particle Swarm Optimization (PSO) [16], Crow Search Algorithm (CSA) [17] and hybrid techniques [18,19,20,21]. While a considerable research effort has been conducted in terms of optimizing the sizing of hybrid renewable–hydrogen energy systems using AI algorithms, it is worth stating that research in this direction has often relied on simplistic system modelling that lacks consideration of the electrochemical dynamic behaviour of electrolysers and fuel cell systems in response to the intermittent renewables’ output and the dynamic load changes. A research gap exists in integrating AI optimization algorithms within accurate hybrid renewable–hydrogen energy system models to enable optimization of the hybrid system sizing while considering the real-world dynamic behaviour of the individual hybrid system components. Moreover, none of the aforementioned studies have conducted a benchmarking comparison between their developed AI-based hybrid system optimal sizing models and the commercially available software tools to allow a means of validation of the performance of such stand-alone AI-based models. Discrepancies could also lead to valuable insights into the strengths and weaknesses of each approach in several contexts, including scalability, flexibility and adaptability to more complex energy systems.
This paper aims to address these gaps by firstly developing a novel AI-based dynamic system model, in which a PSO optimization algorithm is integrated with a precise dynamic model that is developed for simulating the real-world dynamic behaviour of hybrid PV-H2 energy systems to allow optimization of the hybrid system sizing while considering its dynamic behaviour. The selection of PSO as the AI algorithm to be implemented in the developed model is based on a comparative analysis as shown in Table 1. PSO offers several outstanding features including simplicity, faster convergence and less computational burden. Unlike GA, which requires complex evolutionary operations including selection, crossover and mutation per iteration [22], PSO requires fewer parameters to tune and employs a straightforward updating mechanism per iteration resulting in faster convergence with less computational burden [23]. Compared to other widely used swarm intelligence algorithms such as the Artificial Bee Colony (ABC), PSO simultaneously updates all the dimensions of the search space, whereas ABC only updates one dimension value at a time [24], making it slower and less efficient for high-dimensional optimization tasks. Additionally, PSO directly optimizes solutions with no larger datasets unlike learning-based approaches such as the Artificial Neural Networks (ANNs), which require extensive datasets for training and predictive tasks [25]. These advantages have positioned PSO as a well-suited choice for integration within the developed model. The developed model brings major advantages over the ones existing in the literature by accounting for the variations in the electrolyser’s parasitic current losses in response to fluctuations in PV input generation, thus quantifying the real amount of hydrogen produced by the electrolyser. In addition, it accounts for the variations in the fuel cell’s electrochemical losses in response to the variations in the level of hydrogen stored in the tank, thus quantifying the real amount of hydrogen consumed by the fuel cell. This real-world identification of hydrogen production and consumption levels ensures the exact sizing of the hydrogen storage tank, which contributes to cost savings and less space requirement [26]. This paper then benchmarks the developed AI-based precise dynamic system model versus the commercially available HOMER Pro 3.16 software to identify correlation and discrepancies between both approaches, thus contributing to the conclusion of the best practices in the design and optimal sizing of a hybrid PV-H2 energy system for decarbonising grid-connected buildings. HOMER, given its optimization capabilities and suitability for this scale of implementation, best suits this benchmarking and allows fair comparison with the developed novel PSO-based dynamic system sizing model. For benchmarking, the developed novel PSO dynamic system sizing model was applied on a case-study grid-connected building in Aberdeen, Scotland. The yearly energy consumption of the case-study building and its location atmospheric data were used in both the developed novel model and in HOMER. The results from the developed model were then benchmarked with those obtained from the commercially available HOMER software, revealing the potential of the developed model.
Table 1.
Comparison of PSO versus other AI algorithms.
2. The Proposed Hybrid PV-H2 Energy System
The proposed hybrid PV-H2 energy system is comprised of a solar PV system, water electrolyser, pressurized hydrogen storage tank and a fuel cell. The proposed energy management strategy is set to feed the building demands mainly by green energy; thus, the solar PV system acts as the primary energy source to the load demand. During the hours of sun availability, the building’s load demand is primarily fed from the PV source through an inverter, and the PV surplus power is used to generate green hydrogen through the electrolyser. The generated hydrogen is then stored in the form of pressurized hydrogen gas in a storage tank to be used when needed by the fuel cell. During the hours of low or no sun availability, the stored hydrogen gas is then utilized by the fuel cell to meet any unmet load demand. Any remaining demand that is not met by the green energy supply (from the PV system and/or the fuel cell) will be met by the utility grid to maintain a balanced state of operation. Any non-utilized PV energy excess will be sold to the utility grid to increase earned revenue. The schematic diagram of the proposed hybrid PV-H2 energy system is shown in Figure 1.
Figure 1.
Schematic diagram of the proposed hybrid PV-H2 energy system.
3. The Developed Precise Dynamic Hybrid PV-H2 System Model
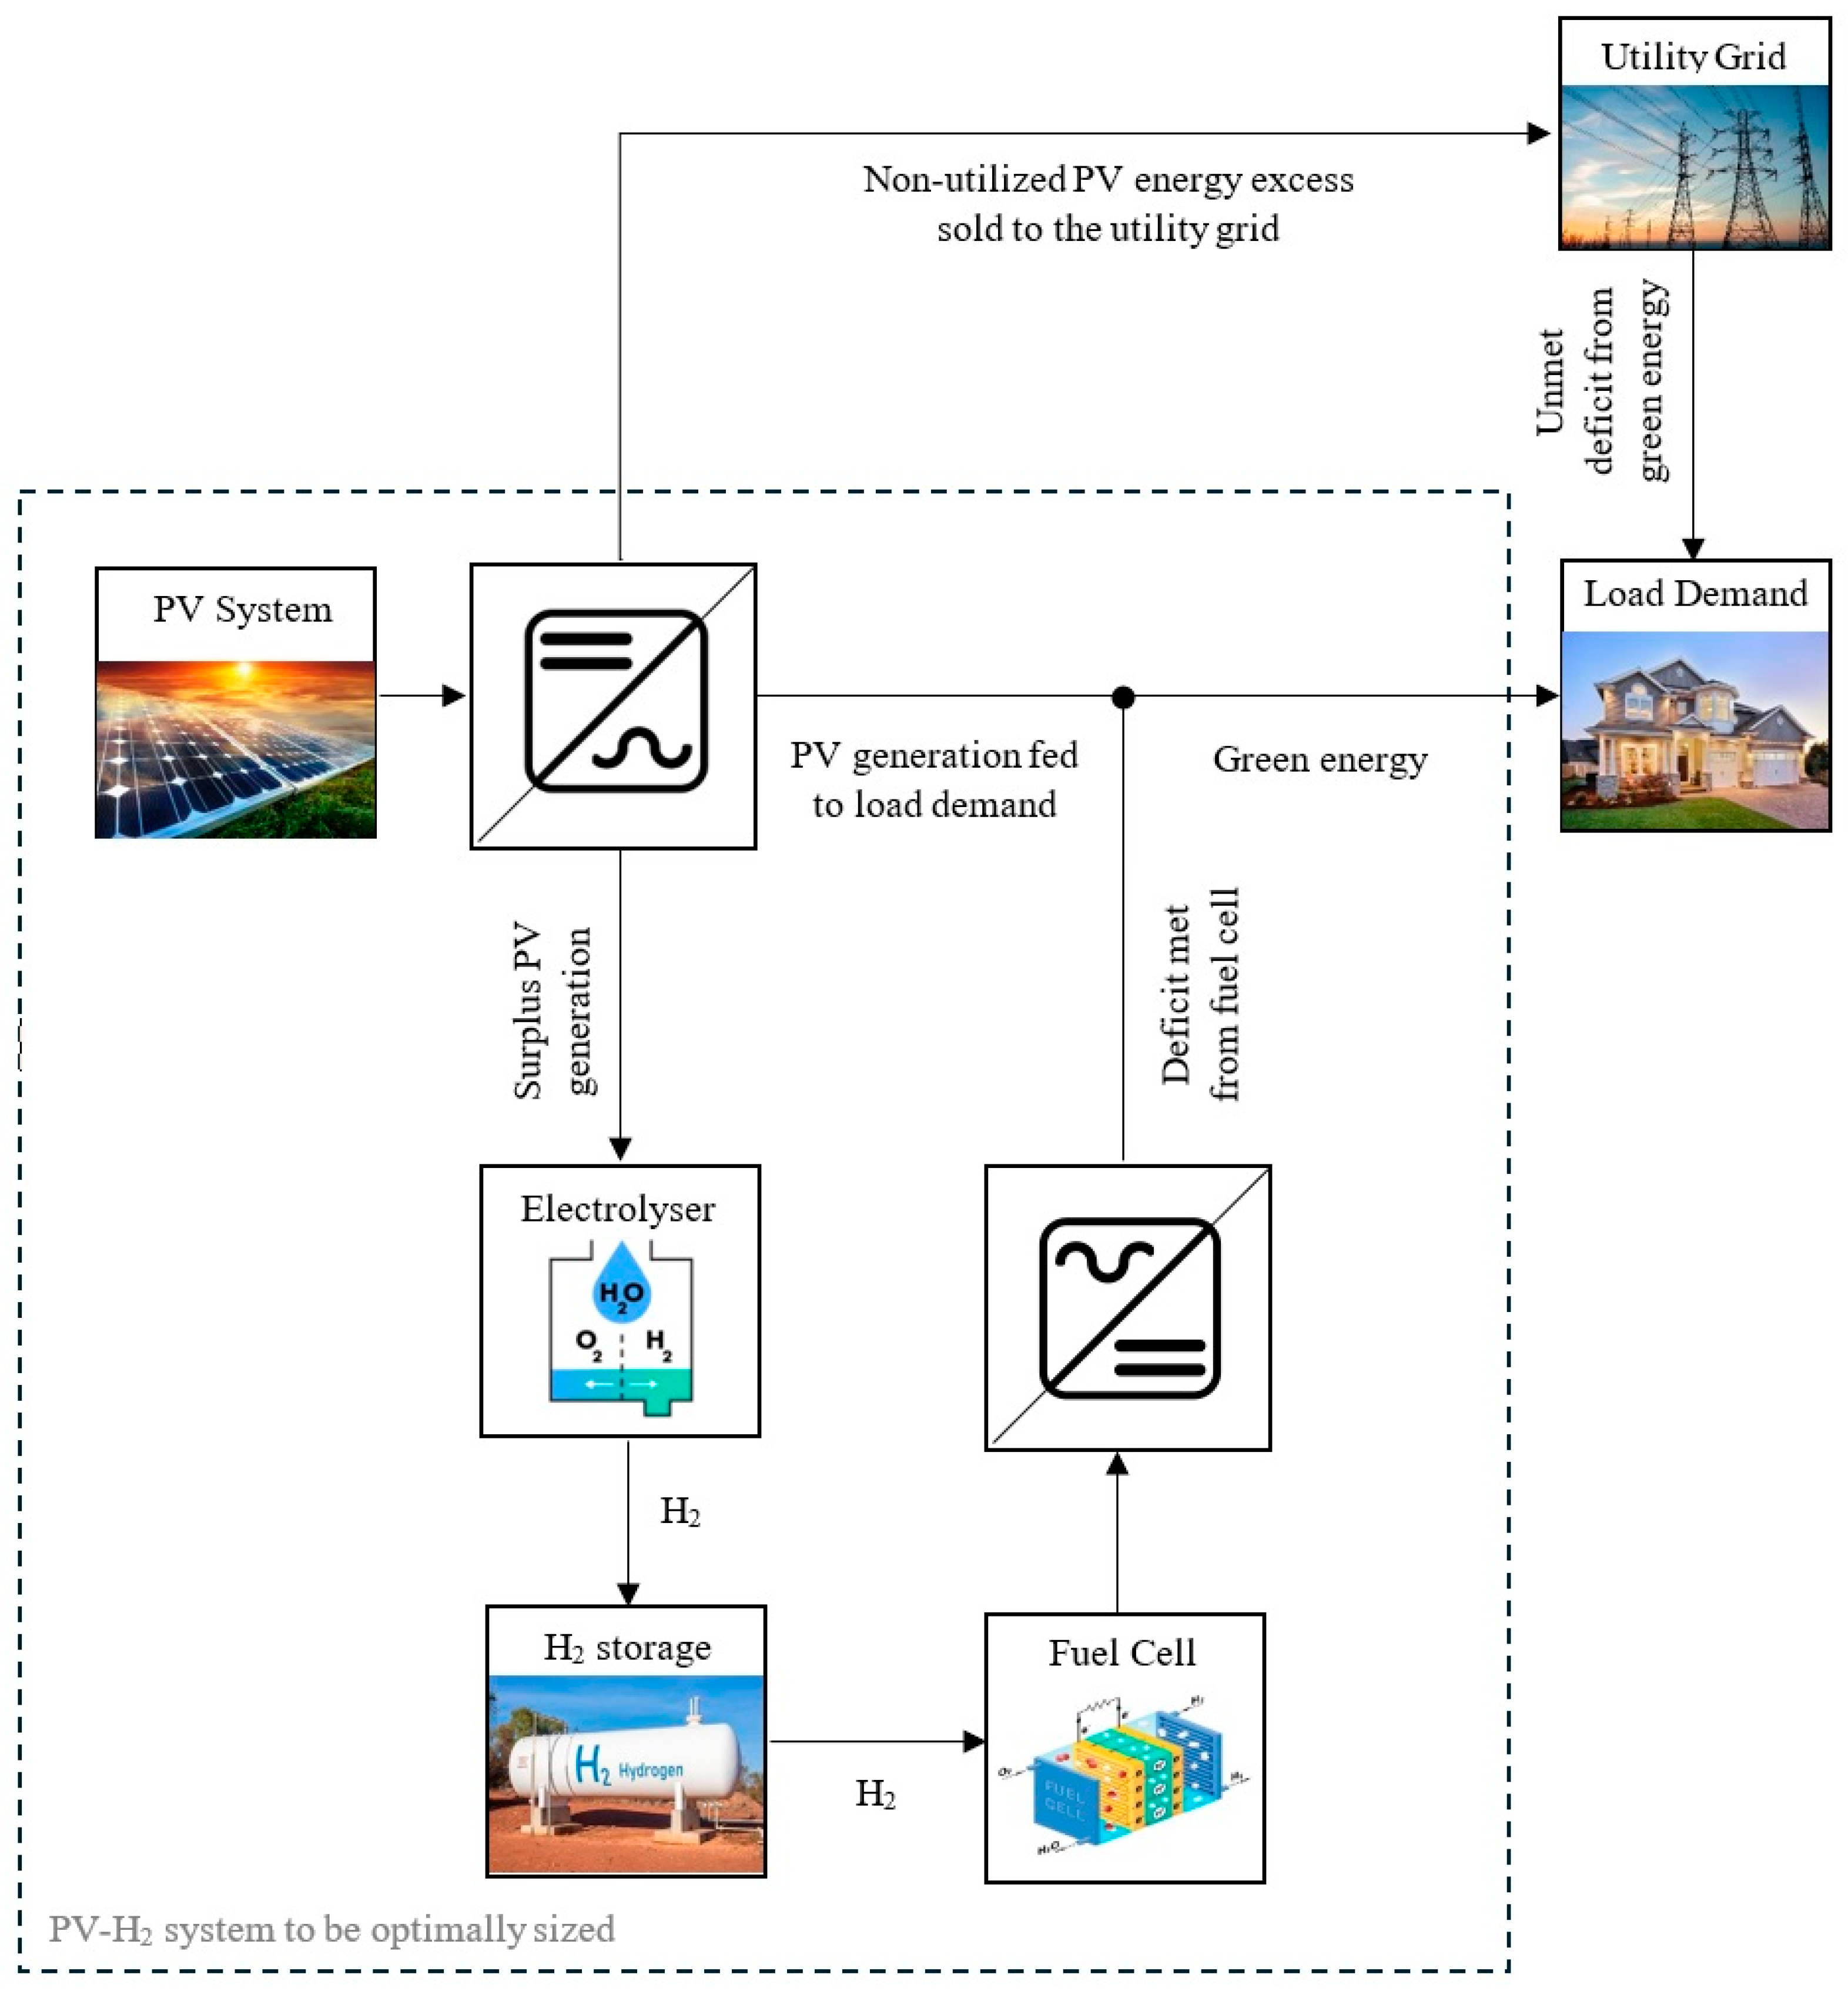
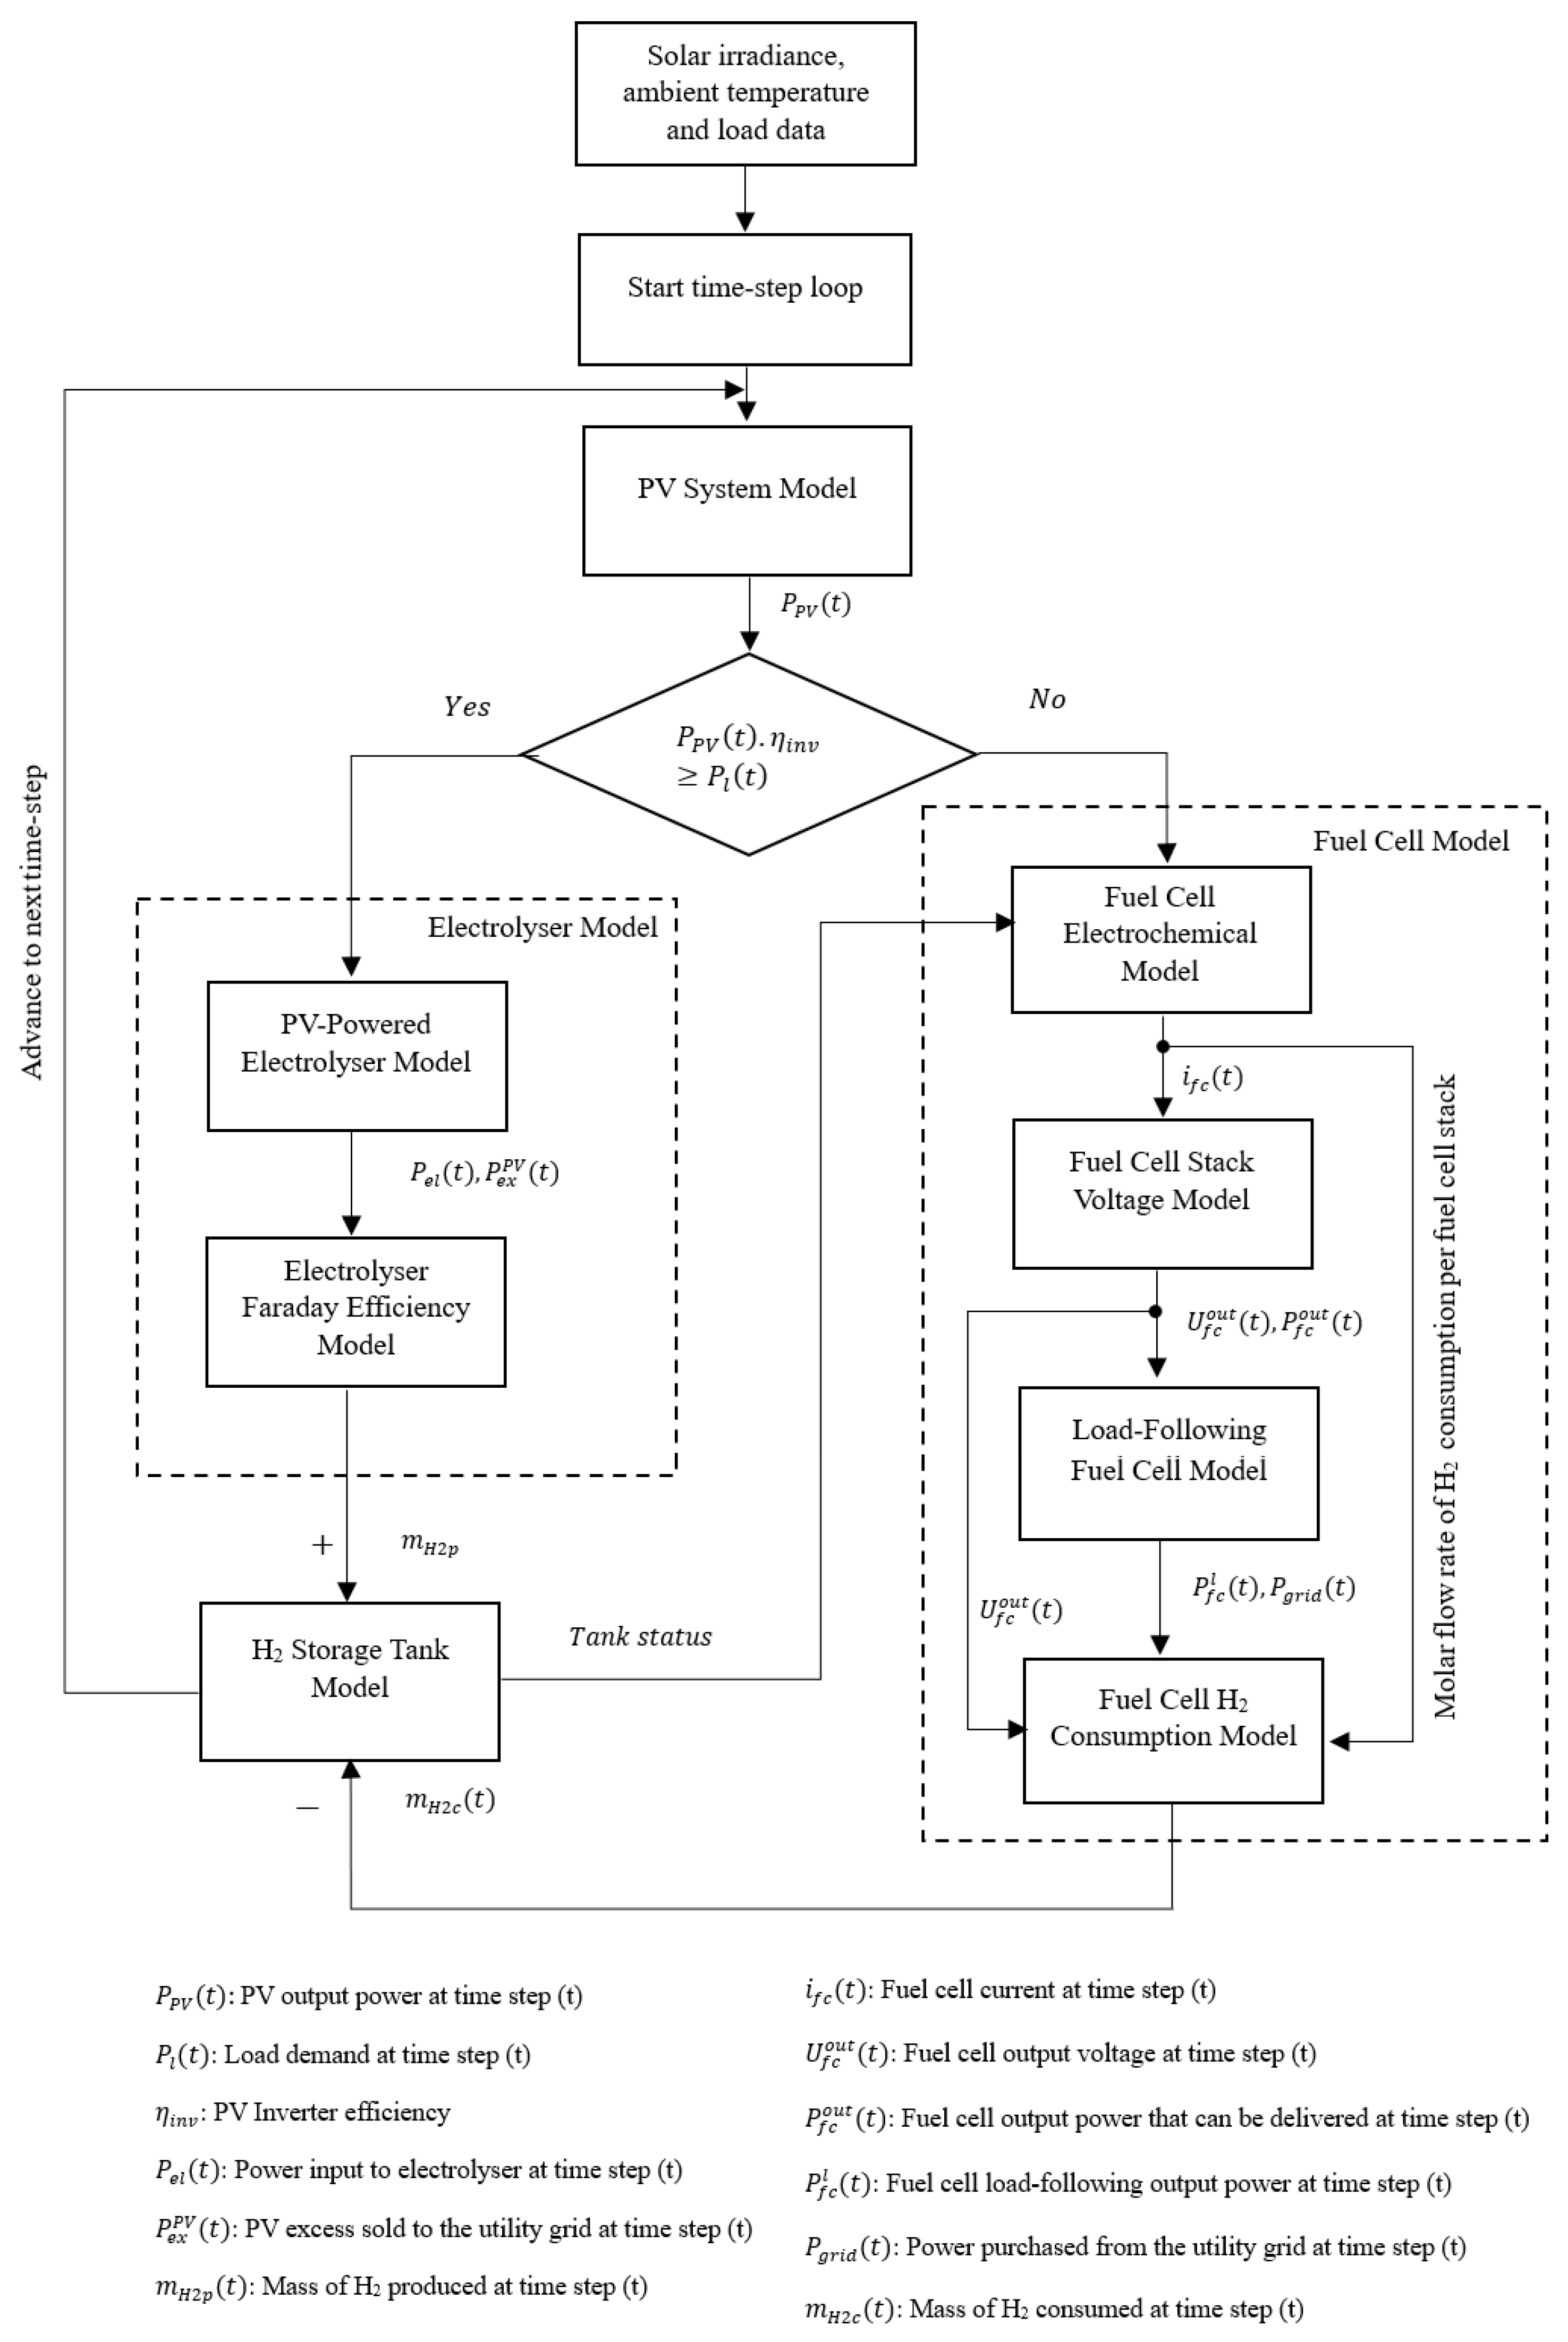
Figure 2 demonstrates the structure of the developed precise dynamic hybrid system model with the implemented energy management strategy. The developed model integrates distinct interconnected smaller models, each modelling a specific component of the hybrid system. This section presents the functioning of the developed model, and the energy management strategy implemented across the hybrid system components and the grid. Further details of the developed mathematical model can be found in our earlier research publication [26]. A comparison between the developed precise dynamic hybrid system model versus the generic models used in the literature can be seen in Table 2.
Figure 2.
Structure of the developed precise dynamic hybrid PV-H2 system model.
Table 2.
Comparison of the developed precise dynamic hybrid system model versus the generic models used in the literature.
In the developed model, the time dependence is taken into consideration by accounting for the hourly variations in load demand and PV generation throughout the day over a one-year timescale. The sizes of all system components are considered as continuous variables which are iteratively updated by the PSO algorithm as will be discussed later in Section 5. The operational conditions of inverters are considered fixed; thus, the inputs/outputs from inverters are related by means of constant efficiencies. The developed model runs on an hourly basis loop over a one-year time interval. For each time step, the PV system model firstly runs to determine the PV output power (
) while considering the variations in solar irradiance and ambient temperature. The net AC hourly output power from the PV system is then compared to the hourly load demand to identify the surplus power. When the PV power is higher than the load demand, the electrolyser model runs to simulate the H2 generation from the available surplus PV power. The developed precise dynamic electrolyser model integrates two sub-models: the PV surplus-powered electrolyser model and the Faraday efficiency model. The PV surplus-powered electrolyser model allows powering the electrolyser by the PV surplus power while limiting this to the rated power of the electrolyser and allocating any extra PV excess (
) for sale to the utility grid. The Faraday efficiency model then accounts for the variations in parasitic current losses taking place in the electrolytic cell stacks due to gas crossover. In this sub-model, the hydrogen output from the electrolyser (
) is quantified while considering the variations in the parasitic current losses in response to the varying power input to the electrolyser (
). The hydrogen output from the electrolyser is then cumulatively added to the hydrogen storage tank model and the hourly tank status is updated accordingly.
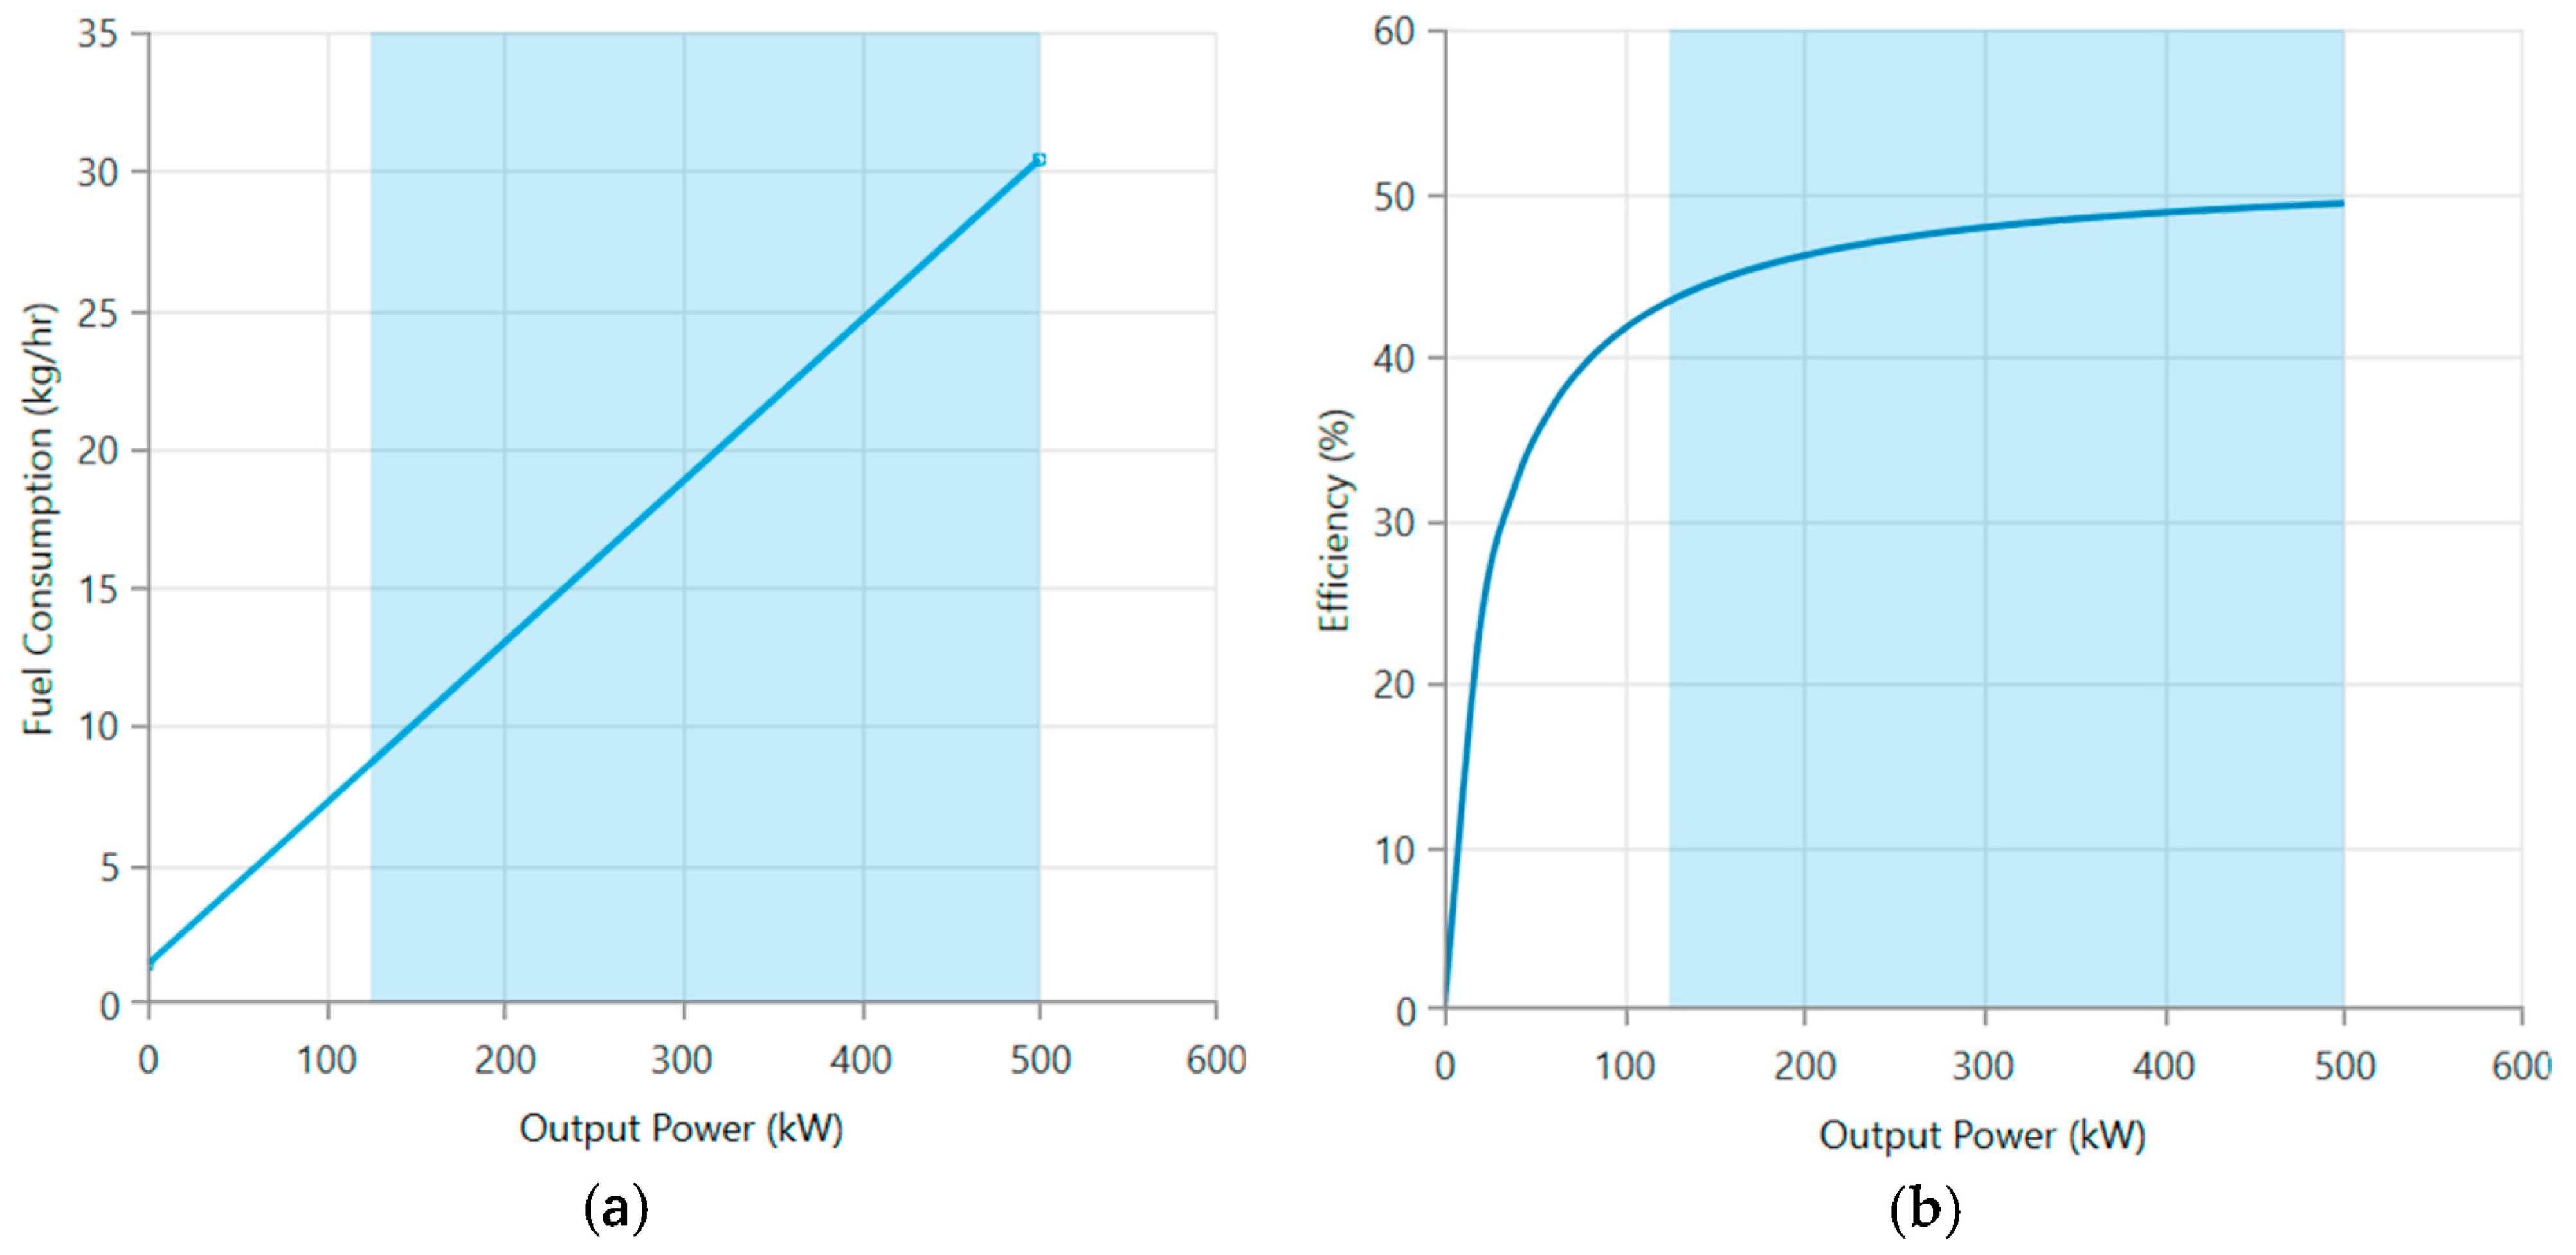
If the net AC output power from the PV system is lower than the load demand, then the fuel cell model is allowed to run. The developed precise dynamic fuel cell model integrates a fuel cell electrochemical model, a stack voltage model, a load-following fuel cell model and a fuel cell hydrogen consumption model. The electrochemical model first allows determining the molar flow rate of the hydrogen consumption per single fuel cell stack based on the status of the hydrogen in the storage tank, then computes the fuel cell current (
) from the electrochemical reaction of a single fuel cell using the total charge carried by the electrons transferred per each mole of hydrogen. The fuel cell stack voltage model is then applied to model the voltage–current characteristics of the fuel cell where the variations in the polarization losses with the change in current at each time step are captured and the corresponding influences on the fuel cell output voltage (
) are calculated, thus allowing the real-world simulation of the fuel cells’ behaviour. The stack voltage model also yields the fuel cell output power (
), which is then used as a threshold value for the load-following fuel cell model. In the load-following model, the fuel cell is allowed to produce power that is only enough to meet the unmet load demand by the PV system. If this unmet load demand exceeds the threshold value of the fuel cell output power, then the fuel cell produces its maximum power, while the remainder of the unmet load demand has to be purchased from the utility grid. Finally, the fuel cell hydrogen consumption model allows determination of the amount of hydrogen that has to be consumed (
) to deliver the fuel cell output power in the load-following mode and then subtract this from the hydrogen storage tank level to update the tank level accordingly. The mathematical formulas used in formulating each model are fully described in [26]. The hourly power balancing equation underlining the energy management strategy set out is given by Equation (1):
where
is the PV output power at time step (t),
is the PV inverter efficiency,
is the fuel cell load-following output power at time step (t),
is the power purchased from the utility grid at time step (t),
is the power consumed by the load demand at time step (t),
is the power consumed by the electrolyser at time step (t) and
is the non-utilised PV excess sold to the utility grid at time step (t). It should be noted that there are specific times that the value of one term or more from the power balancing equation can dynamically be zero depending on the operating conditions.
4. Formulating the Cost-Optimization Objective Function and Constraints for the Optimal Sizing of Hybrid PV-H2 Energy System
A frequently adopted economic metric used for assessing the economic feasibility of hybrid renewable energy systems is the system’s LCOE, which reflects the cost per unit energy [27]. Thus, in formulating the cost-optimization function for the proposed hybrid PV-H2 energy system, the objective function is set to minimize the system’s LCOE as shown in Equation (2). The optimization variables are set as the sizes of the system components (i.e., the PV system, electrolyser, hydrogen storage tank and fuel cell system). The aim is to find the optimal sizing of the hybrid system components (optimization variables) that minimize the system’s LCOE.
The system’s LCOE, given by Equation (3) [16,17], considers the Net Present Cost (NPC) of the hybrid system components over the project lifetime, the cost of grid imports and the earned revenue from selling unutilized PV energy excess to the utility grid.
where
is the objective function for the optimal sizing of the proposed hybrid PV-H2 energy system,
is the system’s levelized cost of energy (GBP/kWh),
,
,
,
,
and
are, respectively, the net present costs of the PV system, electrolyser, fuel cell system, hydrogen storage tank, PV inverter and fuel cell inverter in (GBP),
is the cost of grid imports (GBP),
is the earned revenue from selling unutilized PV energy excess to the utility grid (GBP),
is the hourly building load demand,
is the capital recovery factor [16,17,18],
is the real interest rate and
is the project lifetime.
The net present cost of each of the hybrid system components is calculated considering the capital cost of the component, the operation and maintenance cost that is incurred over the project lifetime, the replacement cost in case the lifetime of the system component is less than the project lifetime and the salvage value of the system component, which defines the earned revenue from the remaining life of the system component at the end of the project lifetime [20]. An illustrative example for calculating the net present cost of the PV system is given in Equation (5) [20].
where
and
are the capital cost and the operation and maintenance cost of the PV system per unit rating (GBP/kW), respectively,
is the rating of the PV system (kW),
is the total replacement cost of the PV system (GBP) and
is the salvage value of the PV system (GBP).
The total replacement cost of the PV system is given by Equations (6) and (7) [20], where when the PV system lifetime is more than the project lifetime, then no replacement is needed for the PV system over the project lifetime, while when the PV system lifetime is less than the project lifetime, then the PV system will need replacement over the project lifetime.
where
is the replacement cost of the PV system per unit rating (GBP/kW),
is the PV system lifetime (year) and
is the number of PV system replacements over the project lifetime rounded down to the nearest integer.
The salvage value of the PV system is given by Equations (8)–(10) [20].
where
is the remaining lifetime of the PV system at the end of the project lifetime (year) and
is the duration of the PV system replacement (year).
The net present costs of the PV inverter and the hydrogen storage tank (
) are also calculated in the same way as the net present cost of the PV system is calculated given that these three components (PV system, PV inverter and hydrogen storage tank) are continuously operating over the year and will, accordingly, need replacement if their predefined lifetime is less than the project lifetime.
To calculate the NPC of the electrolyser, fuel cell system and fuel cell inverter, which are partly operated over the year, an illustrative example is given for the electrolyser in Equations (11) and (12). To find the total replacement cost of the electrolyser (Equation (12)), the exact number of operating hours of the electrolyser is first computed over the project lifetime; if this is found to be less than the electrolyser lifetime in hours, then no replacement is needed for the electrolyser over the project lifetime. If the electrolyser’s operating hours are more than the electrolyser lifetime, then the electrolyser will need replacement over the project lifetime as depicted in Equation (12) [20].
where
and
are, respectively, the capital cost and operation and maintenance cost of the electrolyser per unit rating (GBP/kW),
is the size of the electrolyser (kW),
is the total replacement cost of the electrolyser (£),
is the salvage value of the electrolyser (GBP) and is calculated in the same way that the PV system is calculated,
is the replacement cost of the electrolyser per unit rating (GBP/kW),
is the electrolyser lifetime in (year),
is the exact number of the electrolyser operating hours over the project lifetime (h) and
is the electrolyser lifetime in (h).
is the number of electrolyser replacements rounded down to the nearest integer, which is calculated in the same way that the PV system is calculated
The same applies to the net present costs of the fuel cell system and fuel cell inverter (
) given that they are also partially operated over the year.
The cost of grid imports and the earned revenue from selling unutilized PV energy excess to the utility grid are calculated using Equations (13) and (14) [17,18].
where
(t) is the grid electricity purchase hourly tariff rate considering day/night tariff schemes,
is the grid feed-in tariff rate,
is the power imported from the utility grid at time step (t) and
is the unutilised PV power excess at time step (t).
The objective function
is subject to the inequality constraints given by Equations (15)–(18). These constraints represent the boundary limitations of the optimization variables from which the range of feasible solutions is encountered [16,17,18,20].
where
and
are, respectively, the minimum and maximum boundaries of the PV system’s size,
and
are, respectively, the minimum and maximum boundaries of the electrolyser’s size,
and
are, respectively, the minimum and maximum boundaries of the hydrogen storage tank’s size, and
and
are, respectively, the minimum and maximum boundaries of the fuel cell system.
5. Developing a Novel PSO Dynamic Model for the Optimal Sizing of Hybrid PV-H2 Energy Systems
In this study, the PSO algorithm is implemented to minimize the objective function formulated in Section 4. To deliver accurate optimization results, the PSO algorithm is integrated with the developed precise dynamic model of hybrid PV-H2 energy system to allow optimization of the sizing of the hybrid system components from an economic prospect while considering the real-world dynamic behaviour of the individual hybrid system components. Details of the previously developed precise dynamic model of the hybrid PV-H2 energy system can be found in [26]. A brief overview of the implemented PSO algorithm is provided in the following subsection.
5.1. Overview of the Implemented PSO Algorithm
PSO is a metaheuristic optimization technique that is inspired by the social behaviour of swarming animals such as birds or fishes searching for food by updating their positions and velocities in a searching space [28]. These creatures behave as a ‘swarm’, which stands for the irregular movement of individuals in a searching space to reach their destination. Each individual in the swarm is referred to as a ‘Particle’, which represents a potential solution of the problem [18]. Particles in the swarm move in the search space adjusting their position and velocity using Equations (19) and (20) [29] based on their own experience and their neighbourhood experiences seeking for the global optimum position.
where
is the particle’s number in the swarm,
is the iteration number,
is the velocity of particle (
) at iteration (
),
is the best position for particle (
) based on its own experience at iteration (
), known as Personal best,
is the best position achieved by the entire particles in the swarm at iteration (
) known as Global best,
is the position of particle (
) at iteration (
),
are acceleration constants controlling the movement of particles towards
and
,
,
are random numbers between 0 and 1,
is the inertia weight factor,
,
are the minimum and maximum inertia weights and
is the maximum number of iterations.
In the optimal sizing of the hybrid PV-H2 energy system, the particle’s position is a four-dimensional array consisting of the following four optimization variables: the size of the PV system, the size of the electrolyser, the size of the hydrogen storage tank and the size of the fuel cell system. Therefore, the particle’s position represents a configuration of the hybrid system sizing.
5.2. Integrating the PSO Algorithm with the Newly Developed Hybrid PV-H2 Energy System Precise Dynamic Model to Optimize the System Sizing
To allow the optimal sizing of the hybrid PV-H2 energy systems while considering the real-world dynamic behaviour of their individual system components, the PSO algorithm is integrated with the developed precise dynamic model [26].
Figure 3 outlines the integration of the PSO algorithm with the developed precise dynamic hybrid system model [26]. The developed PSO-based precise hybrid system model allows minimization of the LCOE elaborated on earlier in Section 4 through the following steps as shown in Figure 3:
Figure 3.
The developed PSO-based dynamic hybrid system sizing model.
- Firstly, before starting to minimize the LCOE, the developed model’s initial search space is filtered in a way that ensures feeding at least 40% of the load demand by using the green energy supply. An initial sizing configuration for the hybrid system components is generated in which the size of each of the four hybrid system components is randomly selected from their minimum and maximum boundary ranges. This randomly generated hybrid system sizing configuration is then applied to the developed precise dynamic model to identify the corresponding fraction of the load demand served by the green energy supply. If this fraction is higher than or equal to 40%, then this configuration of hybrid system sizing is taken as the initial generation. If not, then the initial sizing of the hybrid system keeps re-generating until the configuration sizing allows at least 40% of load demand to be fed by the green energy supply.
- The LCOE is then calculated for each particle as elaborated on earlier in Section 4 and evaluated to set and represents the configuration of the hybrid system sizing that allows the minimum LCOE for the individual particle (i) to be achieved, while represents the sizing of the hybrid system configuration that allows the minimum LCOE among all particles in the swarm at iteration (k) to be achieved.
- The values of and are used to update the particles’ velocity and position using Equations (19) and (20), respectively.
- A position control is applied to prevent the updated values of the hybrid system sizing (i.e., each component size in ) from falling outside of their minimum and maximum boundaries. If the updated component size is within its minimum and maximum boundaries, then the updated value of this component size is kept unchanged, while if the updated component size is outside its minimum and maximum boundaries, then this component size returns to its value in the previous iteration and the sizing of the hybrid system configuration is updated accordingly.
- The updated hybrid system sizing configuration corresponding to particle is evaluated by re-applying it in the precise dynamic model [26] and calculating the corresponding LCOE to re-update and .
- The updated values of and are used to update the particles’ velocity and position using Equations (19) and (20), respectively.
- If the iteration number reaches the maximum number of iterations, then exit. Otherwise, execute again from step 4 to 7.
6. Applying the Developed PSO-Based Dynamic Hybrid PV-H2 System Sizing Model on a Case Study: The Sir Ian Wood Building—Robert Gordon University
The developed novel PSO dynamic model is implemented on a case-study grid-connected building, namely the Sir Ian Wood Building (SIWB) within the Robert Gordon University (RGU) campus, in Aberdeen, Scotland. This building is chosen for the case study to implement the developed model as it is the building with the largest energy needs, which covers the School of Computing, Engineering and Technology, School of Pharmacy and Life Sciences, Scott Sutherland School of Architecture and the Built Environment and the University Library.
6.1. Input Data for the Developed PSO Dynamic Model
The data collected for the SIWB hourly load demand, the hourly solar irradiance and the hourly ambient temperature at the building location (Aberdeen) are given in Figure 4. The hourly data of solar irradiance and ambient temperature at the building location were obtained using the Photovoltaic Geographic Information System (PVGIS) web interface.
Figure 4.
(a) SIWB hourly load demand over one-year timescale, (b) the hourly solar irradiance at the building location (Aberdeen City), (c) the hourly ambient temperature at the building location (Aberdeen City).
The data used in the developed novel PSO dynamic model are given in Table 3, Table 4 and Table 5. Table 3 demonstrates the cost parameters needed for calculating the net present cost of each individual component in the hybrid system, where the given per unit rating cost parameters are calculated using the market data given in [17]. Table 3 also gives the lifetime of the hybrid system components based on literature insights [17,18,30]. Note that, the project lifetime
is assumed to be 20 years, and the interest rate
is considered as 8% in this study. Table 4 demonstrates the grid tariff rates and the grid feed-in tariff data as obtained from RGU’s electricity supplier. Based on the information collected from RGU Estates, RGU electricity bills are paid based on day and night tariff rates, where the daytime periods are from 7:00–12:00 a.m. and the nighttime periods are from 12:00–7:00 a.m. According to Ofgem default tariff rates under the UK Government Energy Price Guarantee with effect from January 2023 [31], the day rate of purchasing electricity for north Scotland (applies for Aberdeen) is 45.98 p/kWh, while the night rate of purchasing electricity for north Scotland is 14.20 p/kWh. Regarding the grid feed-in electricity tariff, this is taken as 5.6 p/kWh, which corresponds to the export rate of RGU’s electricity supplier under the Smart Export Guarantee (SEG) with effect from July 2022 [32]. The developed PSO dynamic model utilizes the parameters given in Table 5 as well as the parameters given in [26] for the precise dynamic modelling of the electrolyser, the hydrogen storage tank and the fuel cell. The PV panels used in this study for the PV system are the 300 W monocrystalline, with a nominal operating cell temperate of 46 °C and a temperature coefficient of power of −0.38%/°C.
Table 3.
Data for the cost parameters and lifetime of the hybrid PV-H2 system components.
Table 4.
Data for the tariff rates of grid electricity purchase and grid feed-in electricity based on prices of UK electricity supplier of SIWB at RGU.
Table 5.
Parameters for the PSO algorithm.
6.2. Results of the Developed PSO Dynamic Model
The PSO algorithm applied in SIWB is implemented using MATLAB Rb2023 with a swarm size of 20 particles and a run over 100 iterations as given in Table 5. Table 6 shows the optimal sizing results of the hybrid PV-H2 energy system when using the developed PSO dynamic model for minimizing the system’s LCOE. As can be seen from Table 6, the optimal hybrid system sizing involved 4003.2 kW for the PV system, 1300 kW for the electrolyser, 82.7 kg for the hydrogen storage tank and 600 kW for the fuel cell system. The corresponding LCOE is found to be about 0.3695 GBP/kWh. Figure 5 illustrates the PSO convergence of the objective function, which can be seen as 0.3695 GBP/kWh, dropping from the LCOE corresponding to the filtered initial hybrid system sizing of 0.54 GBP/kWh, thus achieving about a 31.57% reduction in the system’s LCOE after about 30 PSO algorithm iterations.
Table 6.
SIWB hybrid PV-H2 energy system optimal system sizing results for the minimum system’s LCOE.
Figure 5.
PSO convergence of objective function for minimising the system’s LCOE.
6.3. Comparative Analysis of the Results of the Developed PSO Dynamic Model Versus Those of the HOMER Software
To allow validation of the developed novel PSO dynamic model’s results, the hourly data collected for the SIWB load demand together with the data of atmospheric conditions at the building location were used as data input to the commercially available HOMER software to find the economically optimal sizing of the hybrid PV-H2 energy system suited for SIWB given that HOMER only allows cost optimization. The control dispatch strategy implemented in HOMER software is ‘Cycle Charging’, which similarly enables the generators (i.e., PV system and fuel cell) to operate at full output power to serve the primary load demand, while surplus electrical production goes towards serving the electrolyser. Results from the developed PSO dynamic model are then compared to those obtained from the HOMER software to allow assessment of the developed model‘s capability in optimally sizing the hybrid system components from an economic prospect. Table 7 shows that the hybrid PV-H2 energy system optimal sizing results obtained using the developed PSO dynamic model closely matched those obtained using the HOMER software while achieving a lower system LCOE (i.e., 0.3695 GBP/kWh using the developed PSO dynamic model versus 0.3976 GBP/kWh when using HOMER), thus confirming the validity of the developed novel PSO dynamic model in optimizing the size of hybrid system components from the economic perspective.
Table 7.
SIWB hybrid PV-H2 energy system optimal system sizing results using the developed PSO dynamic model versus those obtained using HOMER.
Table 8 shows the simulation results obtained from the optimal hybrid system configuration sizing using the developed PSO dynamic model versus the HOMER simulation results. It can be seen from Table 8 that about 1460.9 MWh are seen to be served to the electrolyser annually when using the developed PSO dynamic model, while around 1170.7 MWh are seen to be served to the electrolyser annually when using the HOMER software. This is because the developed PSO dynamic model integrates the PSO algorithm with the previously developed precise dynamic model [26] and thus minimizes the system’s LCOE while applying the energy management strategy that seeks a reduction in the dependency on the utility grid towards realising the net-zero energy transition, thus forcing the electrolyser to harness more energy from surplus PV energy production. On the other hand, HOMER minimizes the system’s net present cost without forcing all the PV excess to go towards the electrolyser, and therefore, more PV is sold to the grid and, accordingly, there is less energy input to the electrolyser in the HOMER software. This is further reflected in the number of electrolyser operating hours per year in both optimizers; the electrolyser is seen to be operating for 2394 h/yr when using the developed PSO dynamic model versus 1611 h/yr when using the HOMER software.
Table 8.
SIWB hybrid PV-H2 energy system optimal system simulation results using the developed PSO dynamic model versus HOMER software simulation results.
It can also be seen that the annual hydrogen production by the electrolyser is around 8891.6 kg when using the developed PSO dynamic model versus 14,840 kg when using the HOMER software. This is because the PSO algorithm is coupled with the precise dynamic model of the hybrid PV-H2 energy system, which accounts for the hourly variations in the electrolyser’s Faraday efficiency [26] in response to the fluctuations in PV input generation resulting in a less efficient electrolyser and therefore a lower amount of hydrogen produced by the electrolyser. Instead, the HOMER electrolyser model assumes a constant efficiency so that a certain amount of electricity will always result in a certain amount of hydrogen. This constant efficiency is equal to the energy content of the hydrogen produced (based on the hydrogen’s higher heating value of 39.4 kWh/kg) divided by the amount of electricity consumed. Given that the annual electricity consumed by the electrolyser is 1170.701 MWh in HOMER and considering an electrolyser efficiency of 50%, therefore, according to HOMER’s assumptions, the energy content of the hydrogen produced out of the electrolyser is equal to 585,350.5 kWh. Dividing this energy content by the H2 higher heating value yields a total hydrogen production out of the electrolyser of 14,840 kg.
The annual fuel cell energy production was found to be 235.69 MWh when using the developed PSO dynamic model versus 241.329 MWh when using the HOMER software. The lower fuel cell system output when using the PSO algorithm is because of the associated precise fuel cell model, which accounts for the hourly variations in the electrochemical losses in response to the varying input hydrogen stored levels in the tank while adjusting the fuel cell output power to only meet the unmet load demand of the PV system. On the other hand, HOMER models the fuel cell energy production using the fuel slope curve (which is taken as 0.058 kg/h/kW in this study). Based on the slope curve, HOMER plots the fuel cell efficiency curve by calculating the fuel cell efficiency at various points between zero output and rated power output taking into consideration the energy content of the hydrogen fuel consumed (based on the hydrogen lower heating value of 33.33 kWh/kg). Figure 6 shows the fuel cell slope curve and fuel cell efficiency curve plotted by the HOMER software. From HOMER’s simulation results, the mean electrical efficiency of the fuel cell was found to be 48.8% and given that the total hydrogen fuel consumed is 14,840 kg/yr, therefore, according to HOMER assumptions, the energy content of the hydrogen fuel consumption is 494.662 MWh, resulting in a total electrical production of 241.329 MWh.
Figure 6.
(a) Fuel cell slope curve in HOMER software, (b) fuel cell efficiency curve in HOMER software.
In terms of the annual energy purchased from the utility grid, a total of 2298.69 MWh is seen to be purchased when using the developed PSO dynamic model, while a total of 2734.296 MWh is seen to be purchased when using the HOMER software. HOMER tends to purchase more energy from the utility grid during nighttime hours when it is cheaper rather than operating the fuel cell system to save its running costs. Figure 7 illustrates a screenshot of HOMER’s hourly simulation results over an exemplary period of 72 h, demonstrating that the energy management strategy implemented in HOMER allows the purchasing of more energy from the utility grid during nighttime hours to benefit from the grid’s cheap night rate. This accordingly justifies the smaller size of the fuel cell system chosen by HOMER (500 kW versus 600 kW by the developed PSO dynamic model). While HOMER energy management allows an increase in the reliance on the utility grid during the cheap tariff hours and selects a smaller fuel cell system size in order to minimize the system’s net present cost, the developed PSO dynamic model energy management strategy limits the utility grid purchase to only happen when the load demand cannot be met by the green energy supply (i.e., by the PV system and fuel cell) and, accordingly, selects a bigger fuel cell system. As a result, the fuel cell system is seen to be operating for 942 h/yr when using the developed PSO dynamic model compared to only 602 h/yr when using the HOMER software. The energy management strategy implemented within the developed PSO dynamic model is illustrated in Figure 8 over the same exemplary period of 72 h. In terms of the annual energy sale to the grid, while in the HOMER software the system is allowed to sell more energy from surplus PV production to the utility grid if this is economically advantageous rather than utilizing this energy to serve the electrolyser, the developed PSO dynamic model only allows the sale of surplus PV production to the utility grid if this exceeds the rated power input to the electrolyser. As a result, only 225.8 MWh is seen to be sold to the utility grid when using the developed PSO dynamic model, while about 580 MWh is seen to be sold to the utility grid when using the HOMER software.
Figure 7.
Snapshot of SIWB hybrid PV-H2 energy system optimal system hourly simulation results when using HOMER software over an exemplary period (72 h).
Figure 8.
Snapshot of SIWB hybrid PV-H2 energy system optimal system hourly simulation results when using the developed PSO dynamic model over same exemplary period (72 h).
7. Conclusions
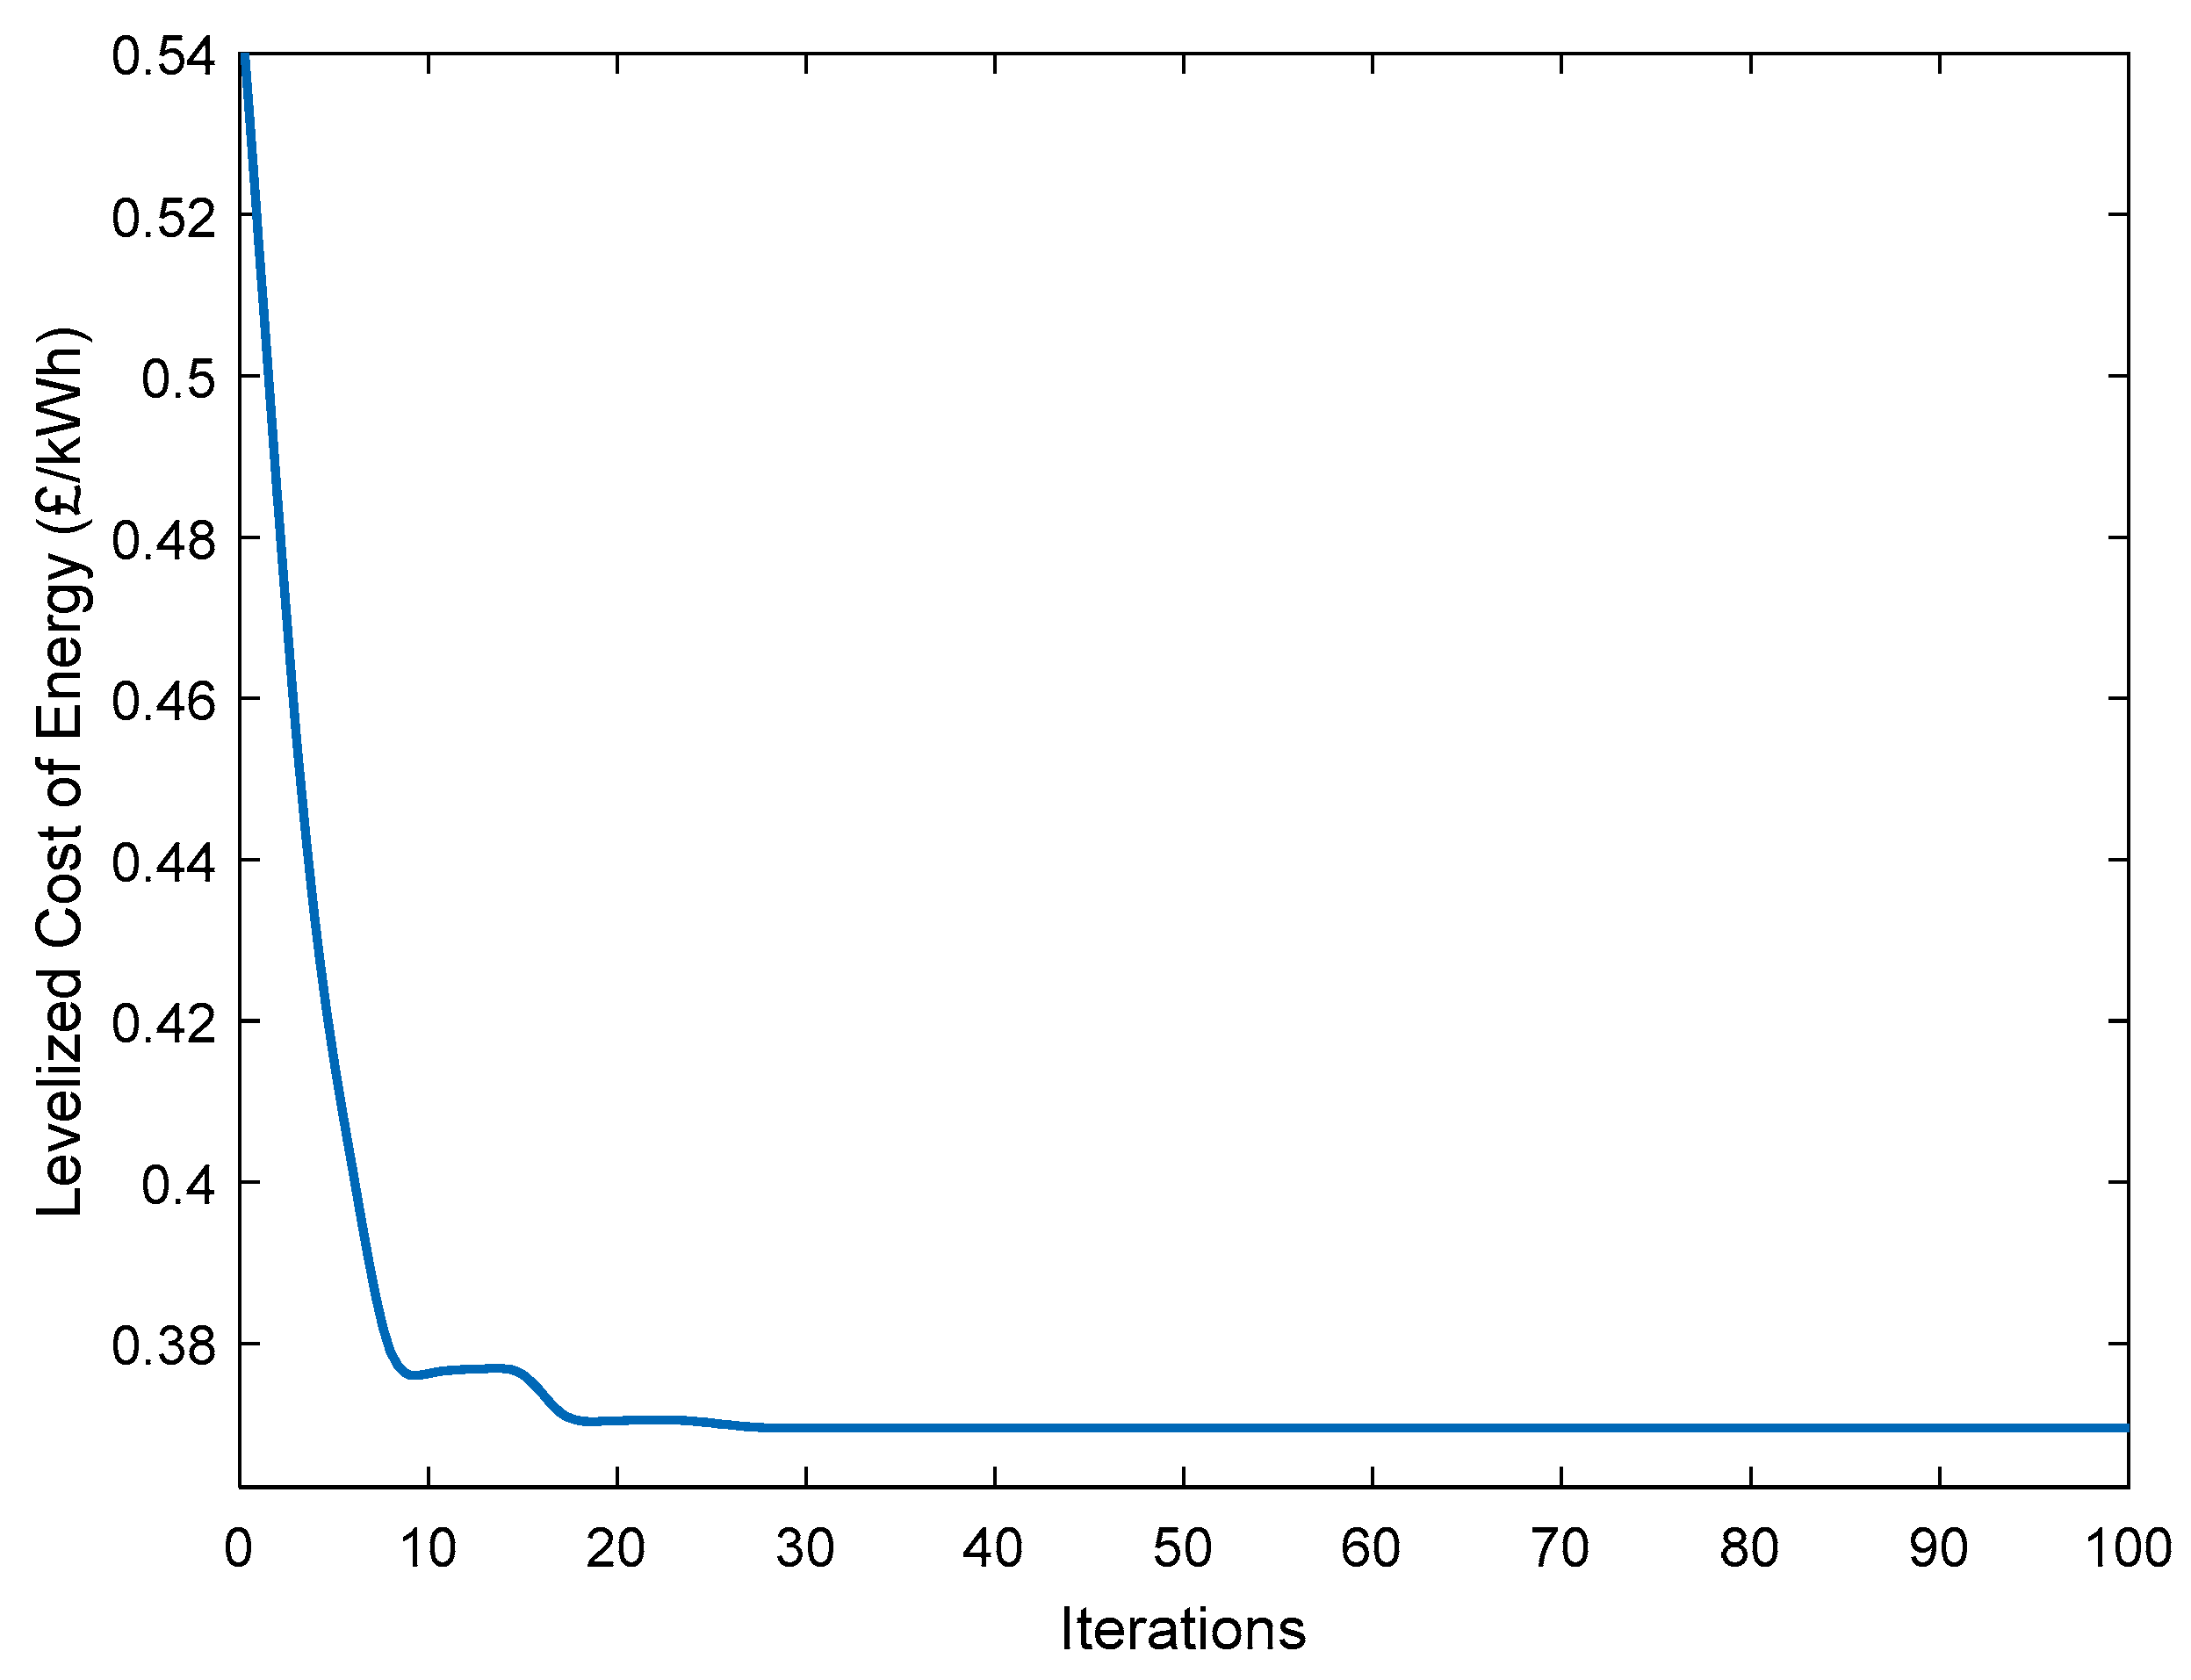
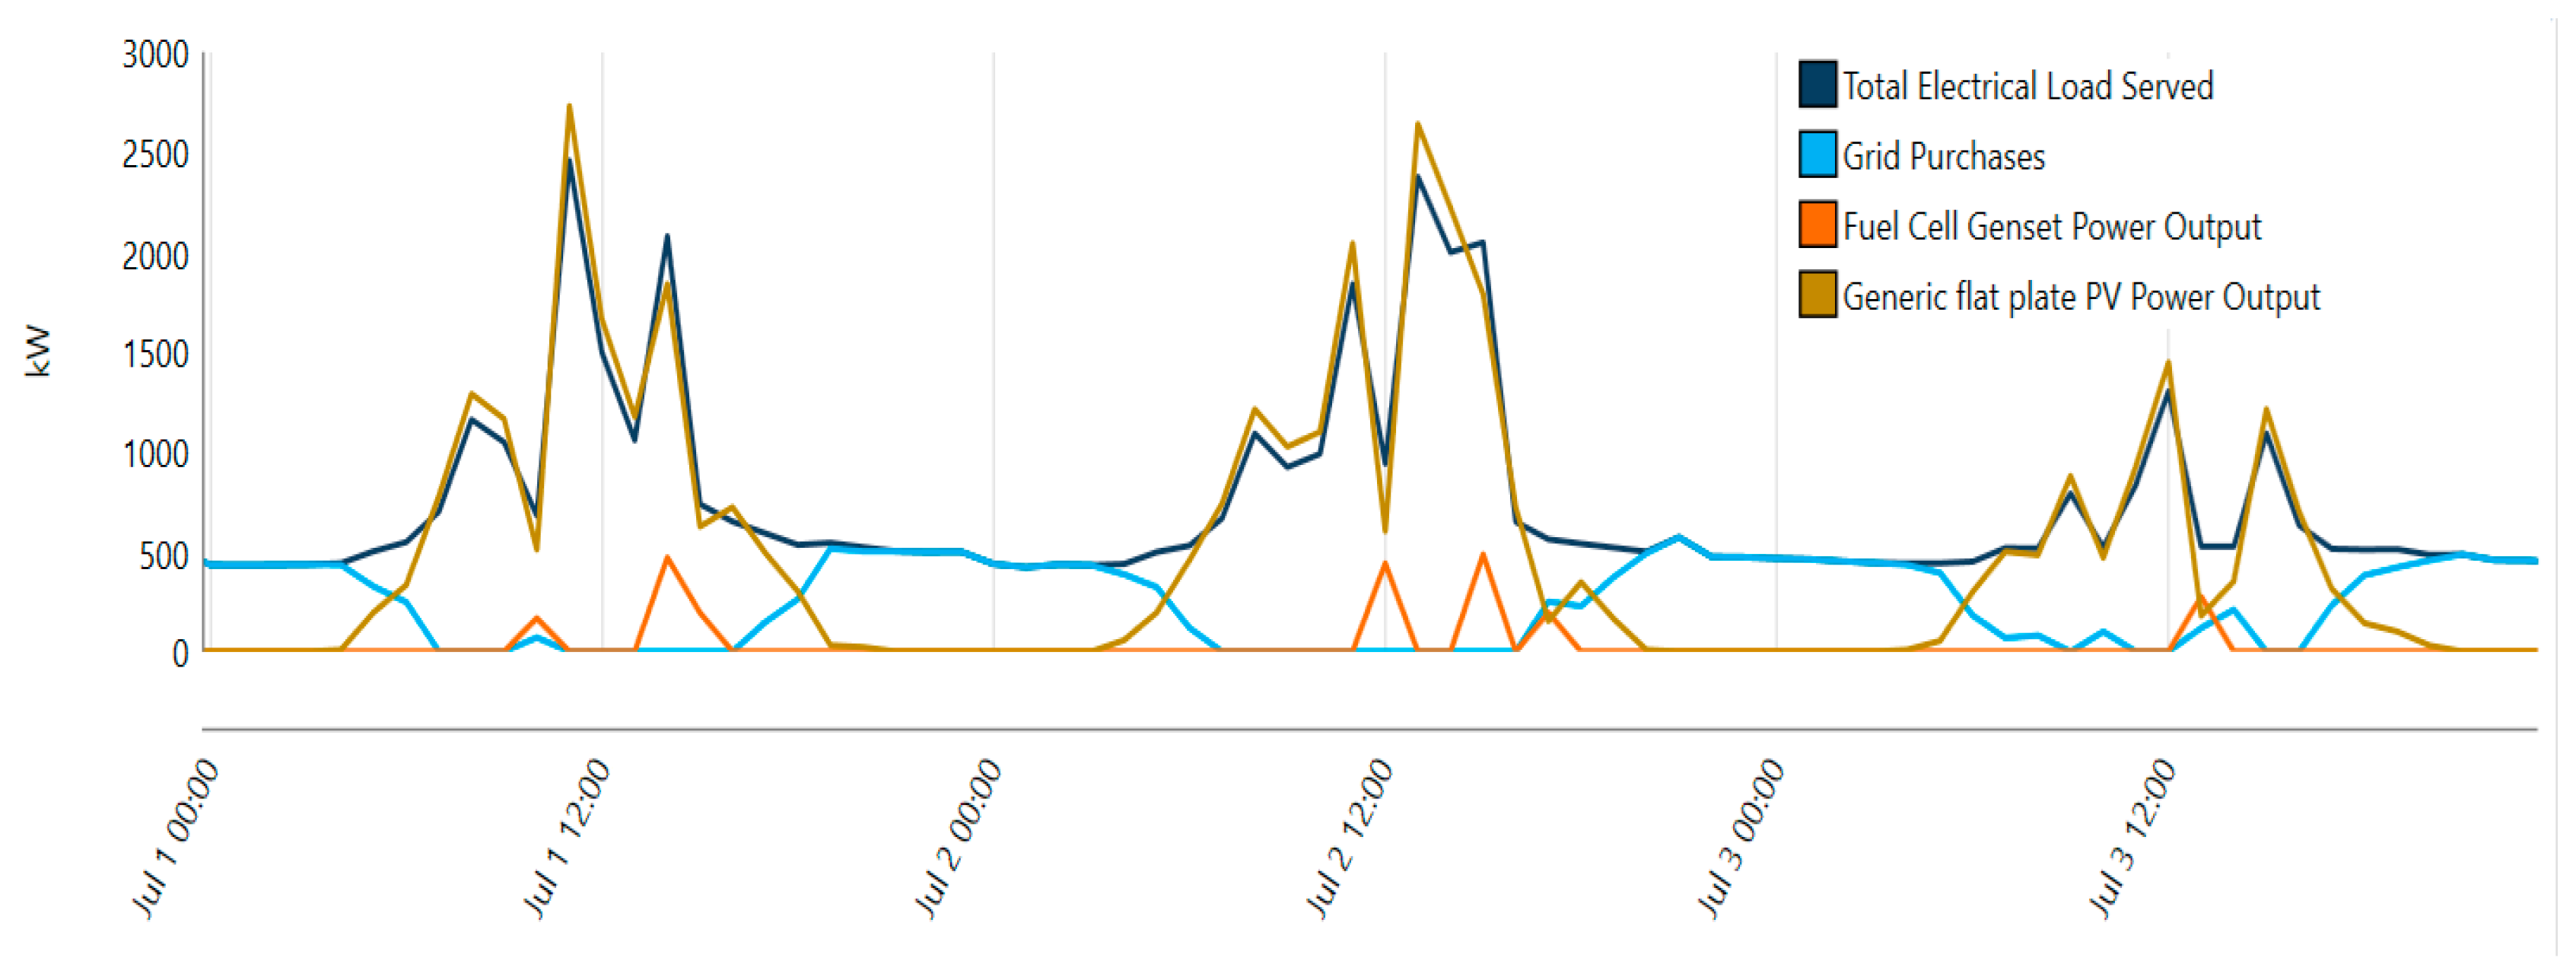
In this paper, a novel PSO dynamic hybrid PV-H2 energy system sizing model is developed to enable the optimal sizing of hybrid PV-H2 energy systems within grid-connected buildings and accurately simulate their real-world dynamic behaviour. This model is developed by integrating a PSO algorithm with a precise hybrid PV-H2 energy system model that allows simulation of the dynamic behaviour of the hybrid system components. The developed novel model allows optimization of the hybrid system components’ sizing from an economic perspective while considering the dynamic behaviour of the hybrid system components. The results obtained from the developed novel PSO dynamic model were verified against those obtained from the commercially available HOMER software showing a strong agreement in the optimal sizing results while achieving a lower LCOE than the one attained by the HOMER software. The benchmarking comparison also revealed the potential of the energy management strategy implemented in the developed model, which allows maximization of the green energy supply to the building, thus aligning with the future of the net-zero energy transition, while the one implemented in HOMER only looks to minimize the system’s net present cost regardless of the green energy supply to the building. The comparison further showed that the developed model provides more accurate dynamic simulation results for the electrolyser and the fuel cell outputs, which reflects their real-world dynamic behaviour because it implements with the optimization a precise dynamic model for the hybrid system.
The analysis of the developed model has pointed out some improvements that can be considered in future work. Firstly, the currently developed model only deals with the time-of-use electricity pricing, which is the most popular choice for many businesses in the UK for paying energy bills; however, in spot electricity markets, prices can fluctuate every hour depending on the market. Therefore, further research work should integrate a dynamic grid pricing mechanism with the developed optimal sizing dynamic hybrid system model to enhance its adaptability in dealing with volatile energy markets. Furthermore, the currently developed model is primarily focused on cost optimization; however, other aspects are not considered in the optimization process. Therefore, future work should aim for the development of a multi-objective optimization technique to allow sizing real-world hybrid PV-H2 energy systems within a grid-connected building while optimizing, along with cost, other aspects like environmental and technical aspects. Developing such an AI-based multi-objective optimal sizing dynamic hybrid system model, which allows addressing the HOMER gap of only considering single-objective cost optimization, will be the scope of our upcoming research paper.
Author Contributions
Conceptualization, A.I.A. and D.A.; methodology, A.I.A. and D.A.; software, A.I.A.; validation, A.I.A.; formal analysis, A.I.A.; investigation, A.I.A. and D.A.; resources, A.I.A. and D.A.; data curation, A.I.A.; writing—original draft preparation, A.I.A.; writing—review and editing, D.A.; visualization, A.I.A. and D.A.; supervision, D.A.; project administration, D.A.; funding acquisition, A.I.A. and D.A. All authors have read and agreed to the published version of the manuscript.
Funding
This research is part of studentship no. ENG20-02, funded by the School of Engineering at Robert Gordon University, Aberdeen, United Kingdom.
Institutional Review Board Statement
Not applicable.
Informed Consent Statement
Not applicable.
Data Availability Statement
Data are contained within the article.
Acknowledgments
The authors would like to thank RGU Estates for providing the actual load data of the SIWB to conduct this study.
Conflicts of Interest
The authors declare no conflicts of interest. The funders had no role in the design of the study; in the collection, analyses, or interpretation of data; in the writing of the manuscript; or in the decision to publish the results.
References
- Li, Z.; Wu, L.; Xu, Y.; Wang, L.; Yang, N. Distributed tri-layer risk-averse stochastic game approach for energy trading among multi-energy microgrids. Appl. Energy 2022, 331, 120282. [Google Scholar] [CrossRef]
- Ram, K.; Swain, P.K.; Vallabhaneni, R.; Kumar, A. Critical assessment on application of software for designing hybrid energy systems. Mater. Today Proc. 2022, 49, 425–432. [Google Scholar] [CrossRef]
- Eriksson, E.L.V.; Gray, E.M.A. Optimization and integration of hybrid renewable energy hydrogen fuel cell energy systems—A critical review. Appl. Energy 2017, 202, 348–364. [Google Scholar] [CrossRef]
- Okundamiya, M.S. Size optimization of a hybrid photovoltaic/fuel cell grid connected power system including hydrogen storage. Int. J. Hydrogen Energy 2021, 46, 30539–30546. [Google Scholar] [CrossRef]
- Akhtari, M.R.; Baneshi, M. Techno-economic assessment and optimization of a hybrid renewable co-supply of electricity, heat and hydrogen system to enhance performance by recovering excess electricity for a large energy consumer. Energy Convers. Manag. 2019, 188, 131–141. [Google Scholar] [CrossRef]
- Mohammad, S.S.; Iqbal, S.J. Hydrogen technology supported solar photovoltaic-based microgrid for urban apartment buildings: Techno-economic analysis and optimal design. Energy Convers. Manag. 2024, 302, 118146. [Google Scholar] [CrossRef]
- Gougui, A.; Djafour, A.; Danoune, B.; Khalfoui, N.; Rehouma, Y. Techno-Economic Analysis and Feasibility Study of a Hybrid Photovoltaic/Fuel Cell Power System. In Proceedings of the 2019 1st International Conference on Sustainable Renewable Energy Systems and Applications (ICSRESA), Tébessa, Algeria, 4–5 December 2019; Institute of Electrical and Electronic Engineers: Piscataway, NJ, USA, 2019; p. 1. [Google Scholar]
- Rahman, M.M.; Ghazi, G.A.; Al-Ammar, E.A.; Ko, W. Techno-Economic Analysis of Hybrid PV/Wind/Fuel-Cell System for EVCS. In Proceedings of the 3rd International Conference on Electrical, Communication and Computer Engineering, ICECCE 2021, Kuala Lumpur, Malaysia, 12–13 June 2021; Institute of Electrical and Electronics Engineers Inc.: Piscataway, NJ, USA, 2021. [Google Scholar] [CrossRef]
- Ali, D.; Gazey, R.; Aklil, D. Developing a thermally compensated electrolyser model coupled with pressurised hydrogen storage for modelling the energy efficiency of hydrogen energy storage systems and identifying their operation performance issues. Renew. Sustain. Energy Rev. 2016, 66, 27–37. [Google Scholar] [CrossRef]
- Ammari, C.; Belatrache, D.; Touhami, B.; Makhloufi, S. Sizing, optimization, control and energy management of hybrid renewable energy system—A review. Energy Built Environ. 2022, 3, 399–411. [Google Scholar] [CrossRef]
- Universidad Zaragoza. iHOGA/MHOGA: Simulation and Optimization of Stand-Alone and Grid-Connected Hybrid Renewable Systems n.d. Available online: https://ihoga.unizar.es/en/ (accessed on 28 September 2024).
- Anoune, K.; Laknizi, A.; Bouya, M.; Astito, A.; Ben Abdellah, A. Sizing a PV-Wind based hybrid system using deterministic approach. Energy Convers. Manag. 2018, 169, 137–148. [Google Scholar] [CrossRef]
- Lee, K.-H.; Lee, D.-W.; Baek, N.-C.; Kwon, H.-M.; Lee, C.-J. Preliminary determination of optimal size for renewable energy resources in buildings using RETScreen. Energy 2012, 47, 83–96. [Google Scholar] [CrossRef]
- Assaf, J.; Shabani, B. Multi-objective sizing optimisation of a solar-thermal system integrated with a solar-hydrogen combined heat and power system, using genetic algorithm. Energy Convers. Manag. 2018, 164, 518–532. [Google Scholar] [CrossRef]
- Park, S.-H.; Jang, Y.-S.; Kim, E.-J. Multi-objective optimization for sizing multi-source renewable energy systems in the community center of a residential apartment complex. Energy Convers. Manag. 2021, 244, 114446. [Google Scholar] [CrossRef]
- Mokhtara, C.; Negrou, B.; Settou, N.; Bouferrouk, A.; Yao, Y. Design optimization of grid-connected PV-Hydrogen for energy prosumers considering sector-coupling paradigm: Case study of a university building in Algeria. Int. J. Hydrogen Energy 2021, 46, 37564–37582. [Google Scholar] [CrossRef]
- Gharibi, M.; Askarzadeh, A. Size and power exchange optimization of a grid-connected diesel generator-photovoltaic-fuel cell hybrid energy system considering reliability, cost and renewability. Int. J. Hydrogen Energy 2019, 44, 25428–25441. [Google Scholar] [CrossRef]
- Singh, S.; Chauhan, P.; Singh, N.J. Capacity optimization of grid connected solar/fuel cell energy system using hybrid ABC-PSO algorithm. Int. J. Hydrogen Energy 2020, 45, 10070–10088. [Google Scholar] [CrossRef]
- Zhang, G.; Shi, Y.; Maleki, A.; ARosen, M. Optimal location and size of a grid-independent solar/hydrogen system for rural areas using an efficient heuristic approach. Renew. Energy 2020, 156, 1203–1214. [Google Scholar] [CrossRef]
- Abdelshafy, A.M.; Hassan, H.; Jurasz, J. Optimal design of a grid-connected desalination plant powered by renewable energy resources using a hybrid PSO–GWO approach. Energy Convers. Manag. 2018, 173, 331–347. [Google Scholar] [CrossRef]
- Izadi, A.; Shahafve, M.; Ahmadi, P. Neural network genetic algorithm optimization of a transient hybrid renewable energy system with solar/wind and hydrogen storage system for zero energy buildings at various climate conditions. Energy Convers. Manag. 2022, 260, 115593. [Google Scholar] [CrossRef]
- Katoch, S.; Chauhan, S.S.; Kumar, V. A review on genetic algorithm: Past, present, and future. Multimed. Tools Appl. 2021, 80, 8091–8126. [Google Scholar] [CrossRef]
- Shami, T.M.; El-Saleh, A.A.; Alswaitti, M.; Al-Tashi, Q.; Summakieh, M.A.; Mirjalili, S. Particle Swarm Optimization: A Comprehensive Survey. IEEE Access 2022, 10, 10031–10061. [Google Scholar] [CrossRef]
- Ye, T.; Wang, W.; Wang, H.; Cui, Z.; Wang, Y.; Zhao, J.; Hu, M. Artificial bee colony algorithm with efficient search strategy based on random neighborhood structure. Knowl. Based Syst. 2022, 241, 108306. [Google Scholar] [CrossRef]
- Taherdoost, H. Deep Learning and Neural Networks: Decision-Making Implications. Symmetry 2023, 15, 1723. [Google Scholar] [CrossRef]
- Atteya, A.I.; Ali, D.; Sellami, N. Precise Dynamic Modelling of Real-World Hybrid Solar-Hydrogen Energy Systems for Grid-Connected Buildings. Energies 2023, 16, 5449. [Google Scholar] [CrossRef]
- Luna-Rubio, R.; Trejo-Perea, M.; Vargas-Vázquez, D.; Ríos-Moreno, G.J. Optimal sizing of renewable hybrids energy systems: A review of methodologies. Sol. Energy 2012, 86, 1077–1088. [Google Scholar] [CrossRef]
- Kennedy, J.; Eberhart, R. Particle Swarm Optimization. In Proceedings of the ICNN’95—International Conference on Neural Networks, Perth, Australia, 27 November–1 December 1995; Volume 4, pp. 1942–1948. [Google Scholar] [CrossRef]
- Eberhart; Shi, Y. Particle Swarm Optimization: Developments, Applications and Resources. In Proceedings of the 2001 Congress on Evolutionary Computation (IEEE Cat. No.01TH8546), Seoul, Republic of Korea, 27–30 May 2001; Volume 1, pp. 81–86. [Google Scholar] [CrossRef]
- Bucher, C.; Wandel, J.; Joss, D. Life Expectancy of PV Inverters and Optimisers in Residential PV Systems. In Proceedings of the 8th World Conference on Photovoltaic Energy Conversion, Milan, Italy, 26–30 September 2022; pp. 865–873. [Google Scholar]
- EDF. Government Energy Price Guarantee Prices n.d. Available online: https://www.edfenergy.com/sites/default/files/government_energy_price_guarantee_prices._standard_variable_deemed_and_welcome._credit_meters.pdf (accessed on 24 May 2024).
- EDF. Smart Export Guarantee n.d. Available online: https://www.edfenergy.com/energy-efficiency/smart-export-tariff (accessed on 24 May 2024).
Disclaimer/Publisher’s Note: The statements, opinions and data contained in all publications are solely those of the individual author(s) and contributor(s) and not of MDPI and/or the editor(s). MDPI and/or the editor(s) disclaim responsibility for any injury to people or property resulting from any ideas, methods, instructions or products referred to in the content. |
© 2024 by the authors. Licensee MDPI, Basel, Switzerland. This article is an open access article distributed under the terms and conditions of the Creative Commons Attribution (CC BY) license (https://creativecommons.org/licenses/by/4.0/).