1. Introduction
One of the riskiest fields of work is thought to be the construction industry. Compared to workers in other industries, construction workers have twice as high a risk of injury. The nature of construction sites is well known for its high volume of activity, large machinery, frequent incidents, and numerous risks, all of which call for the careful consideration and application of safety precautions. Personal protective equipment (PPE) is the main line of defense against any threats that workers may encounter during their presence on construction sites. Manual inspections, which may be laborious and prone to human mistakes, are a major component of traditional ways of guaranteeing PPE compliance. Further, it was found that 70% of fall accidents in 2017 occurred because of workers not wearing personal protective equipment (PPE) on sites, as per a study conducted by Kang et al. [
1]. Further, statistics [
2,
3,
4] show that there is a significant risk of worker fatalities and injuries in the construction sector. In addition, statistics on worker accidents in the construction industry are continuously increasing, which is alarming and points to the urgency of developing safety tracking systems for construction sites. For example, research by the Korea Occupational Safety and Health Agency states that among all industries, the construction sector has the second-highest rate of occupational accidents/injuries (25.5%) and the highest rate of fatalities (46.7%) [
5].
Notwithstanding human efforts in manual and visual inspections, computer vision techniques have been developed and have progressed. This development is crystal clear to see in the use of automated PPE detection systems, which have more options nowadays than ever before. Such detection systems are a viable way to automate PPE recognition on building sites, improving safety and lessening the workload for engineers and site managers. Hence, significant efforts are currently being made to improve worker safety, which also greatly benefits construction companies because PPE can reduce the probability and severity of falling accidents. Creating recognition and monitoring systems for PPE used during working hours is one of the targeted initiatives. That is why Ferdous and Ahsan [
6] created a YOLO-based architecture model for the recognition of workers wearing PPE on construction sites. Consequently, artificial intelligence (AI) capabilities can be adapted to create reasonably priced automation solutions for the construction industry, such as monitoring systems that can identify workers and PPE and determine whether or not they are adhering to safety requirements.
The major objective of this research is to exploit AI’s capabilities to create a PPE detection system by using YOLO-based architecture. This aim can be established by attaining the following subtargets: (1) evaluating the accuracy of the performance of YOLO-based architectures in creating a PPE detection system; (2) comparing between models’ performance matrixes, such as precision, recall, and mAP; (3) exploring trade-offs between the speed and accuracy of different YOLO architectural models; and (4) proposing future recommendations for optimizing PPE detection systems in real-world applications.
The outline of this research study is delineated in the following manner.
Section 2 enumerates previous research endeavors in relation to computer vision’s adaptation through detection and recognition systems in fields such as the construction industry.
Section 3 describes steps that were taken during the preparation of this study; it also incorporates the research methodology framework.
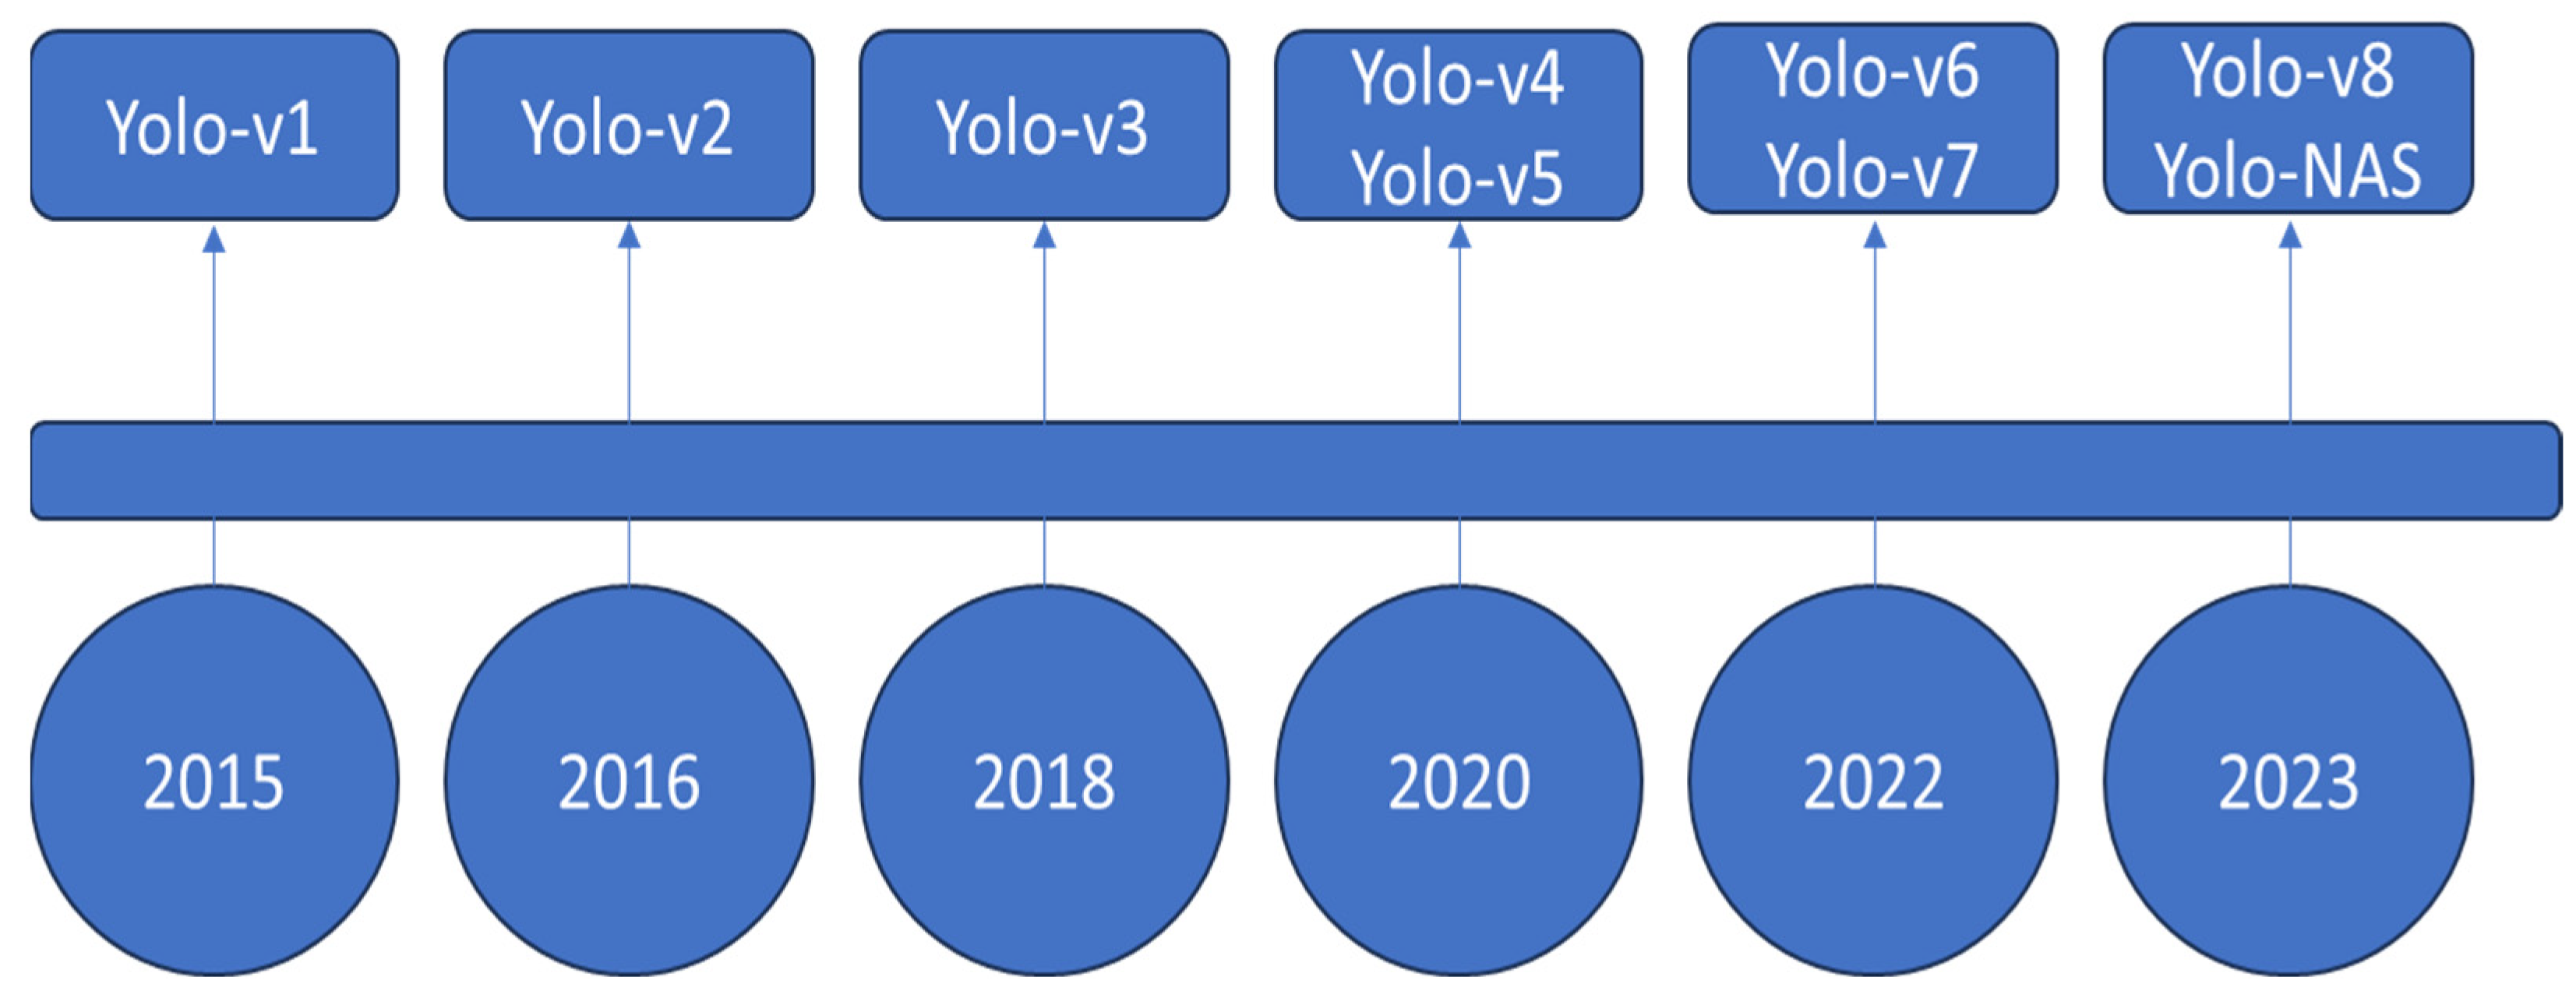
Section 4 illustrates the evolution of YOLO across the years, in addition to enumerating the framework used in the implementation of the YOLO model.
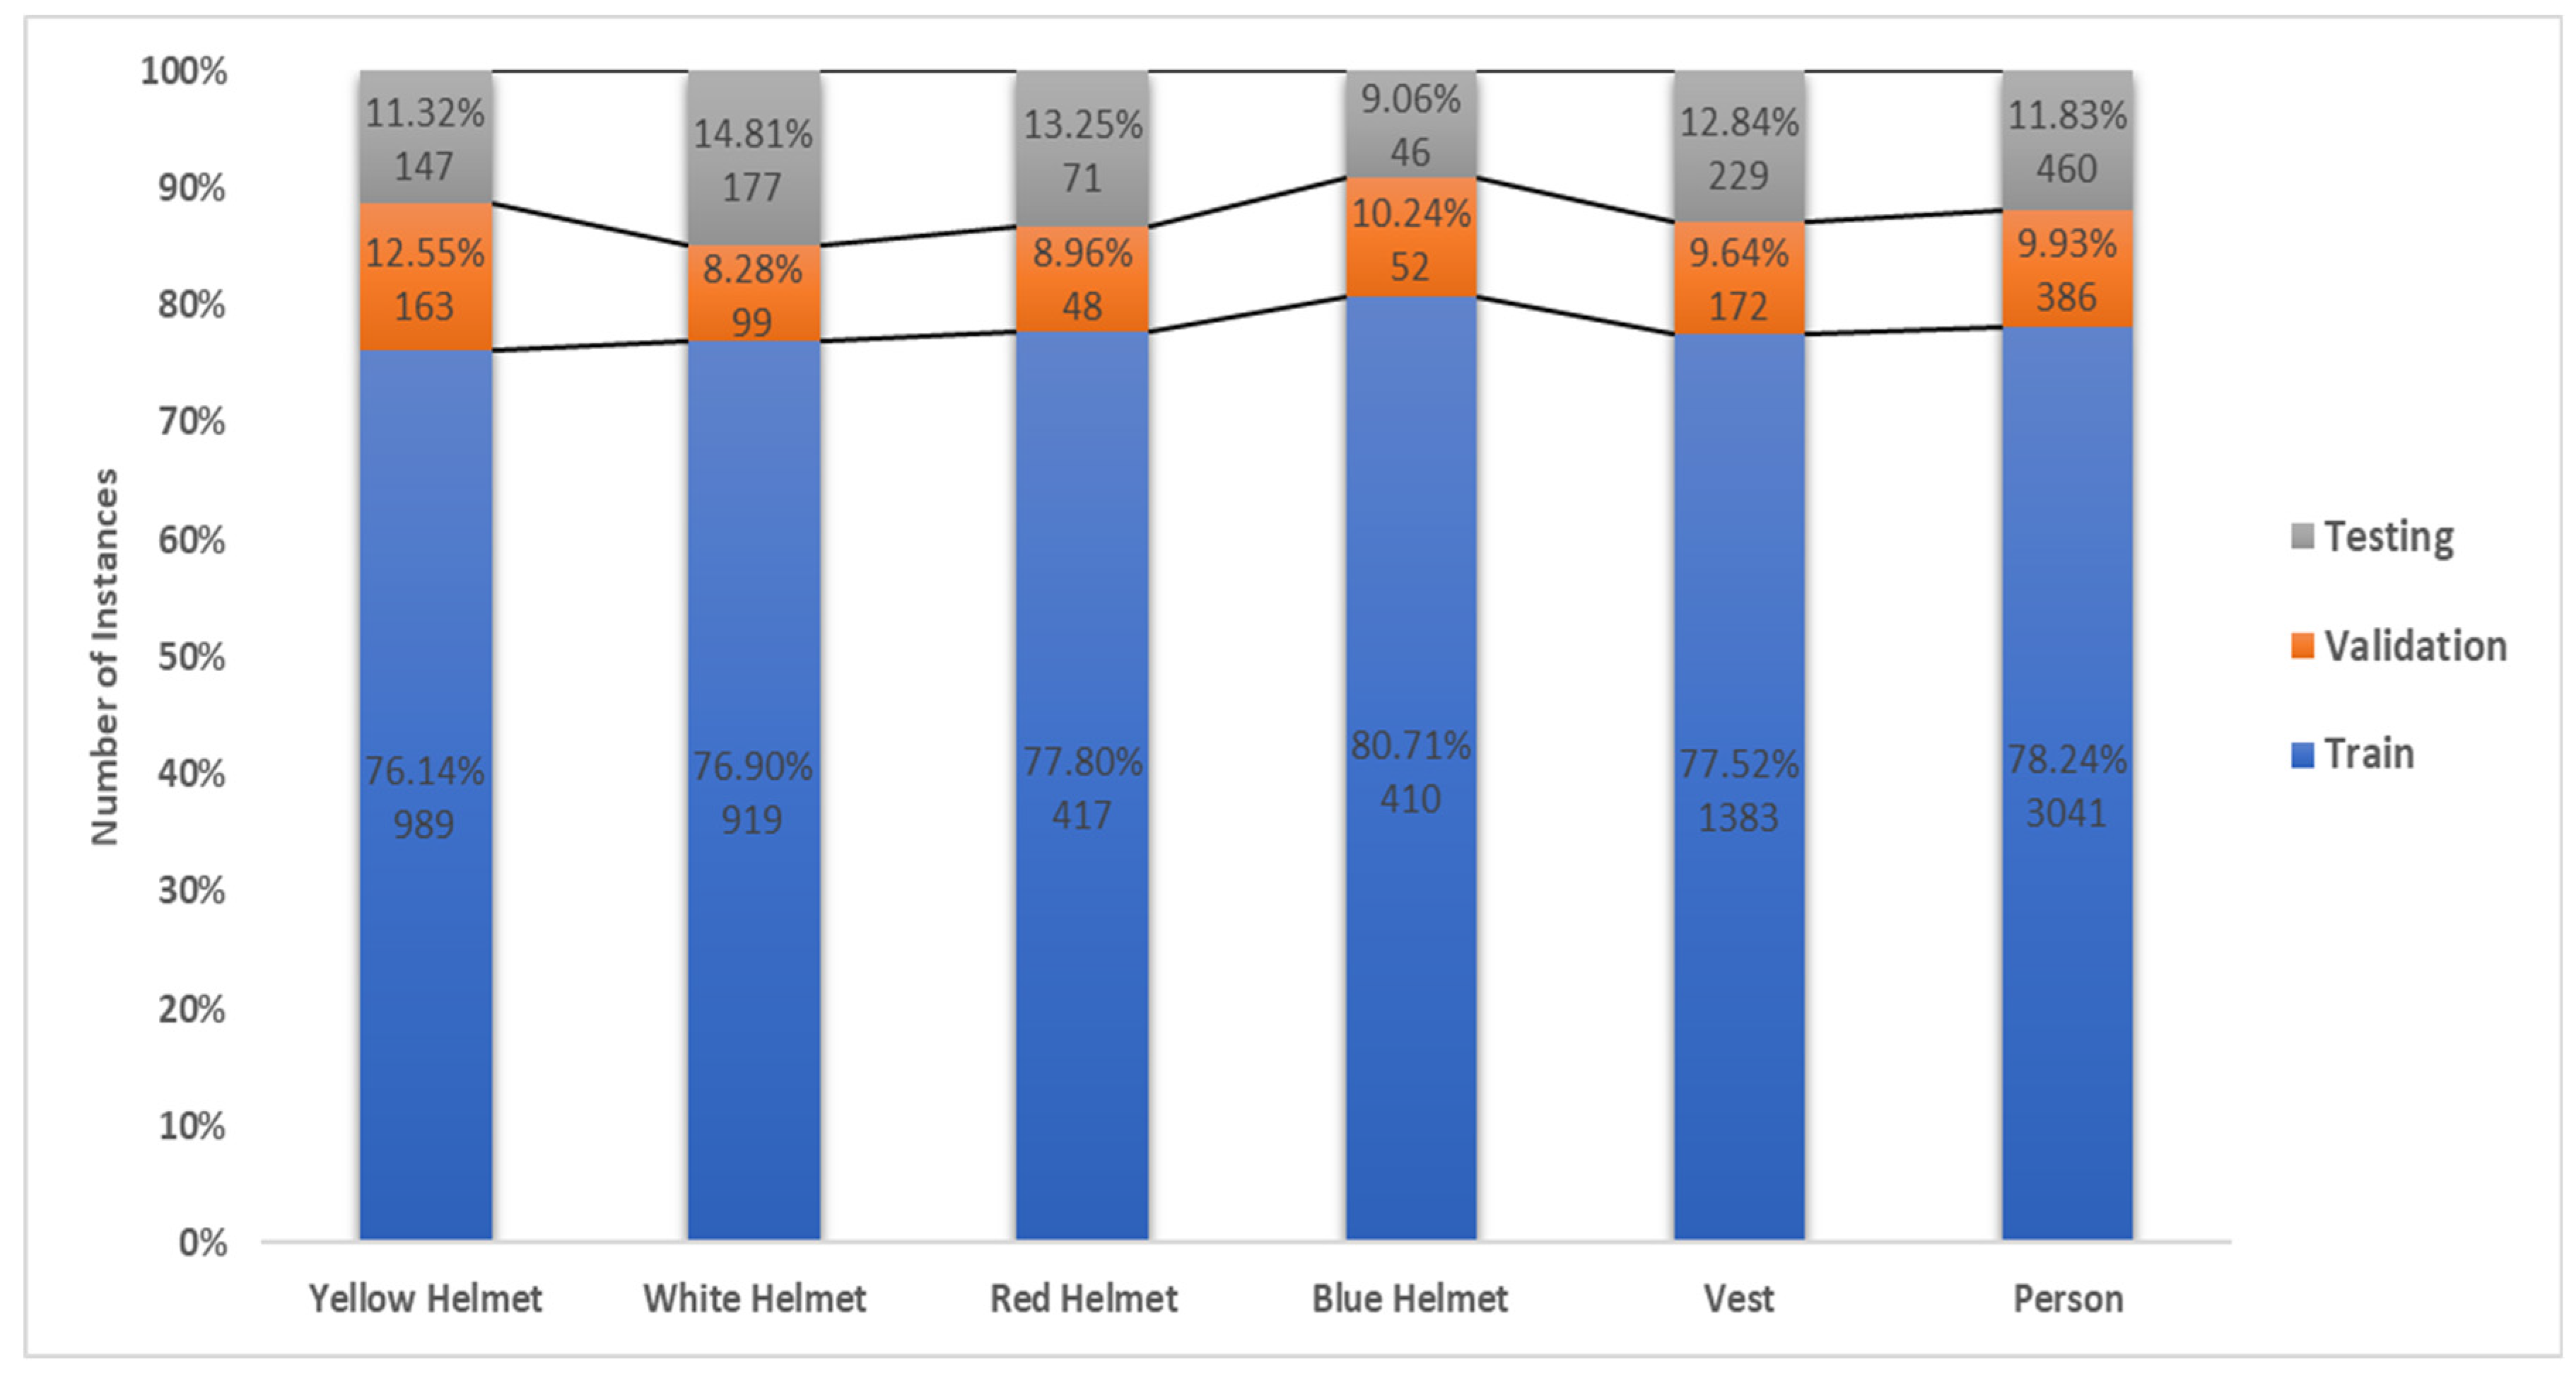
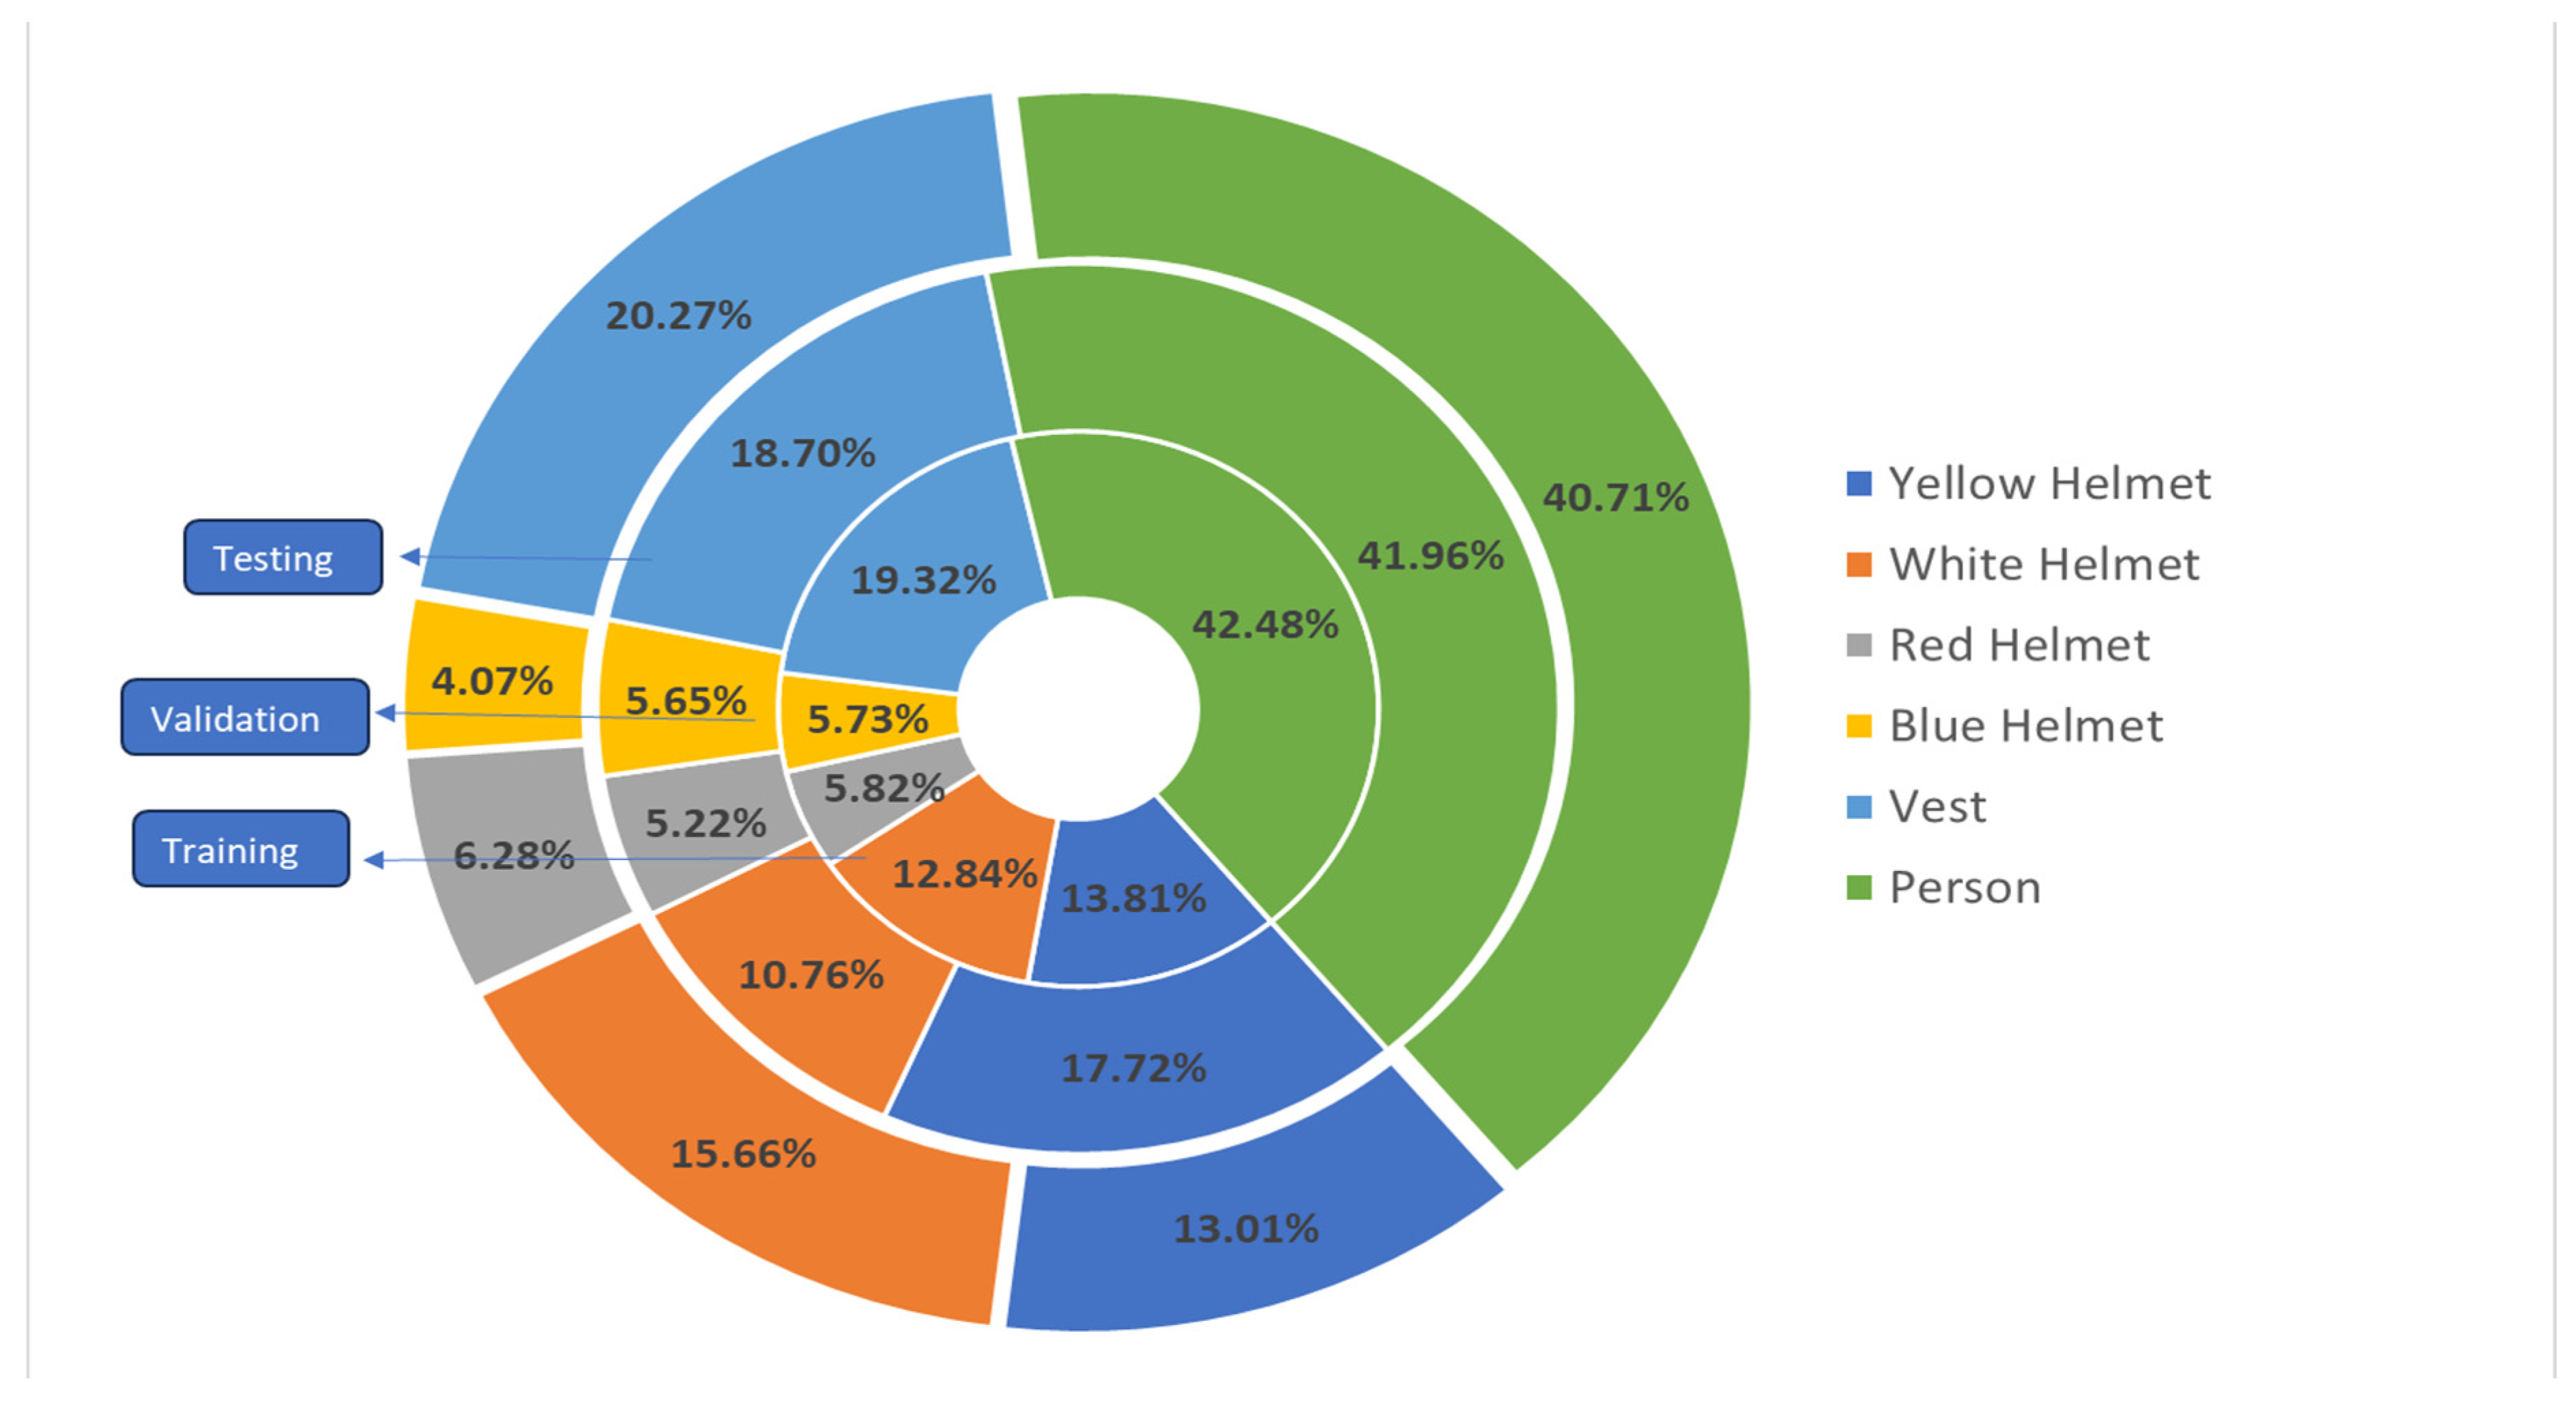
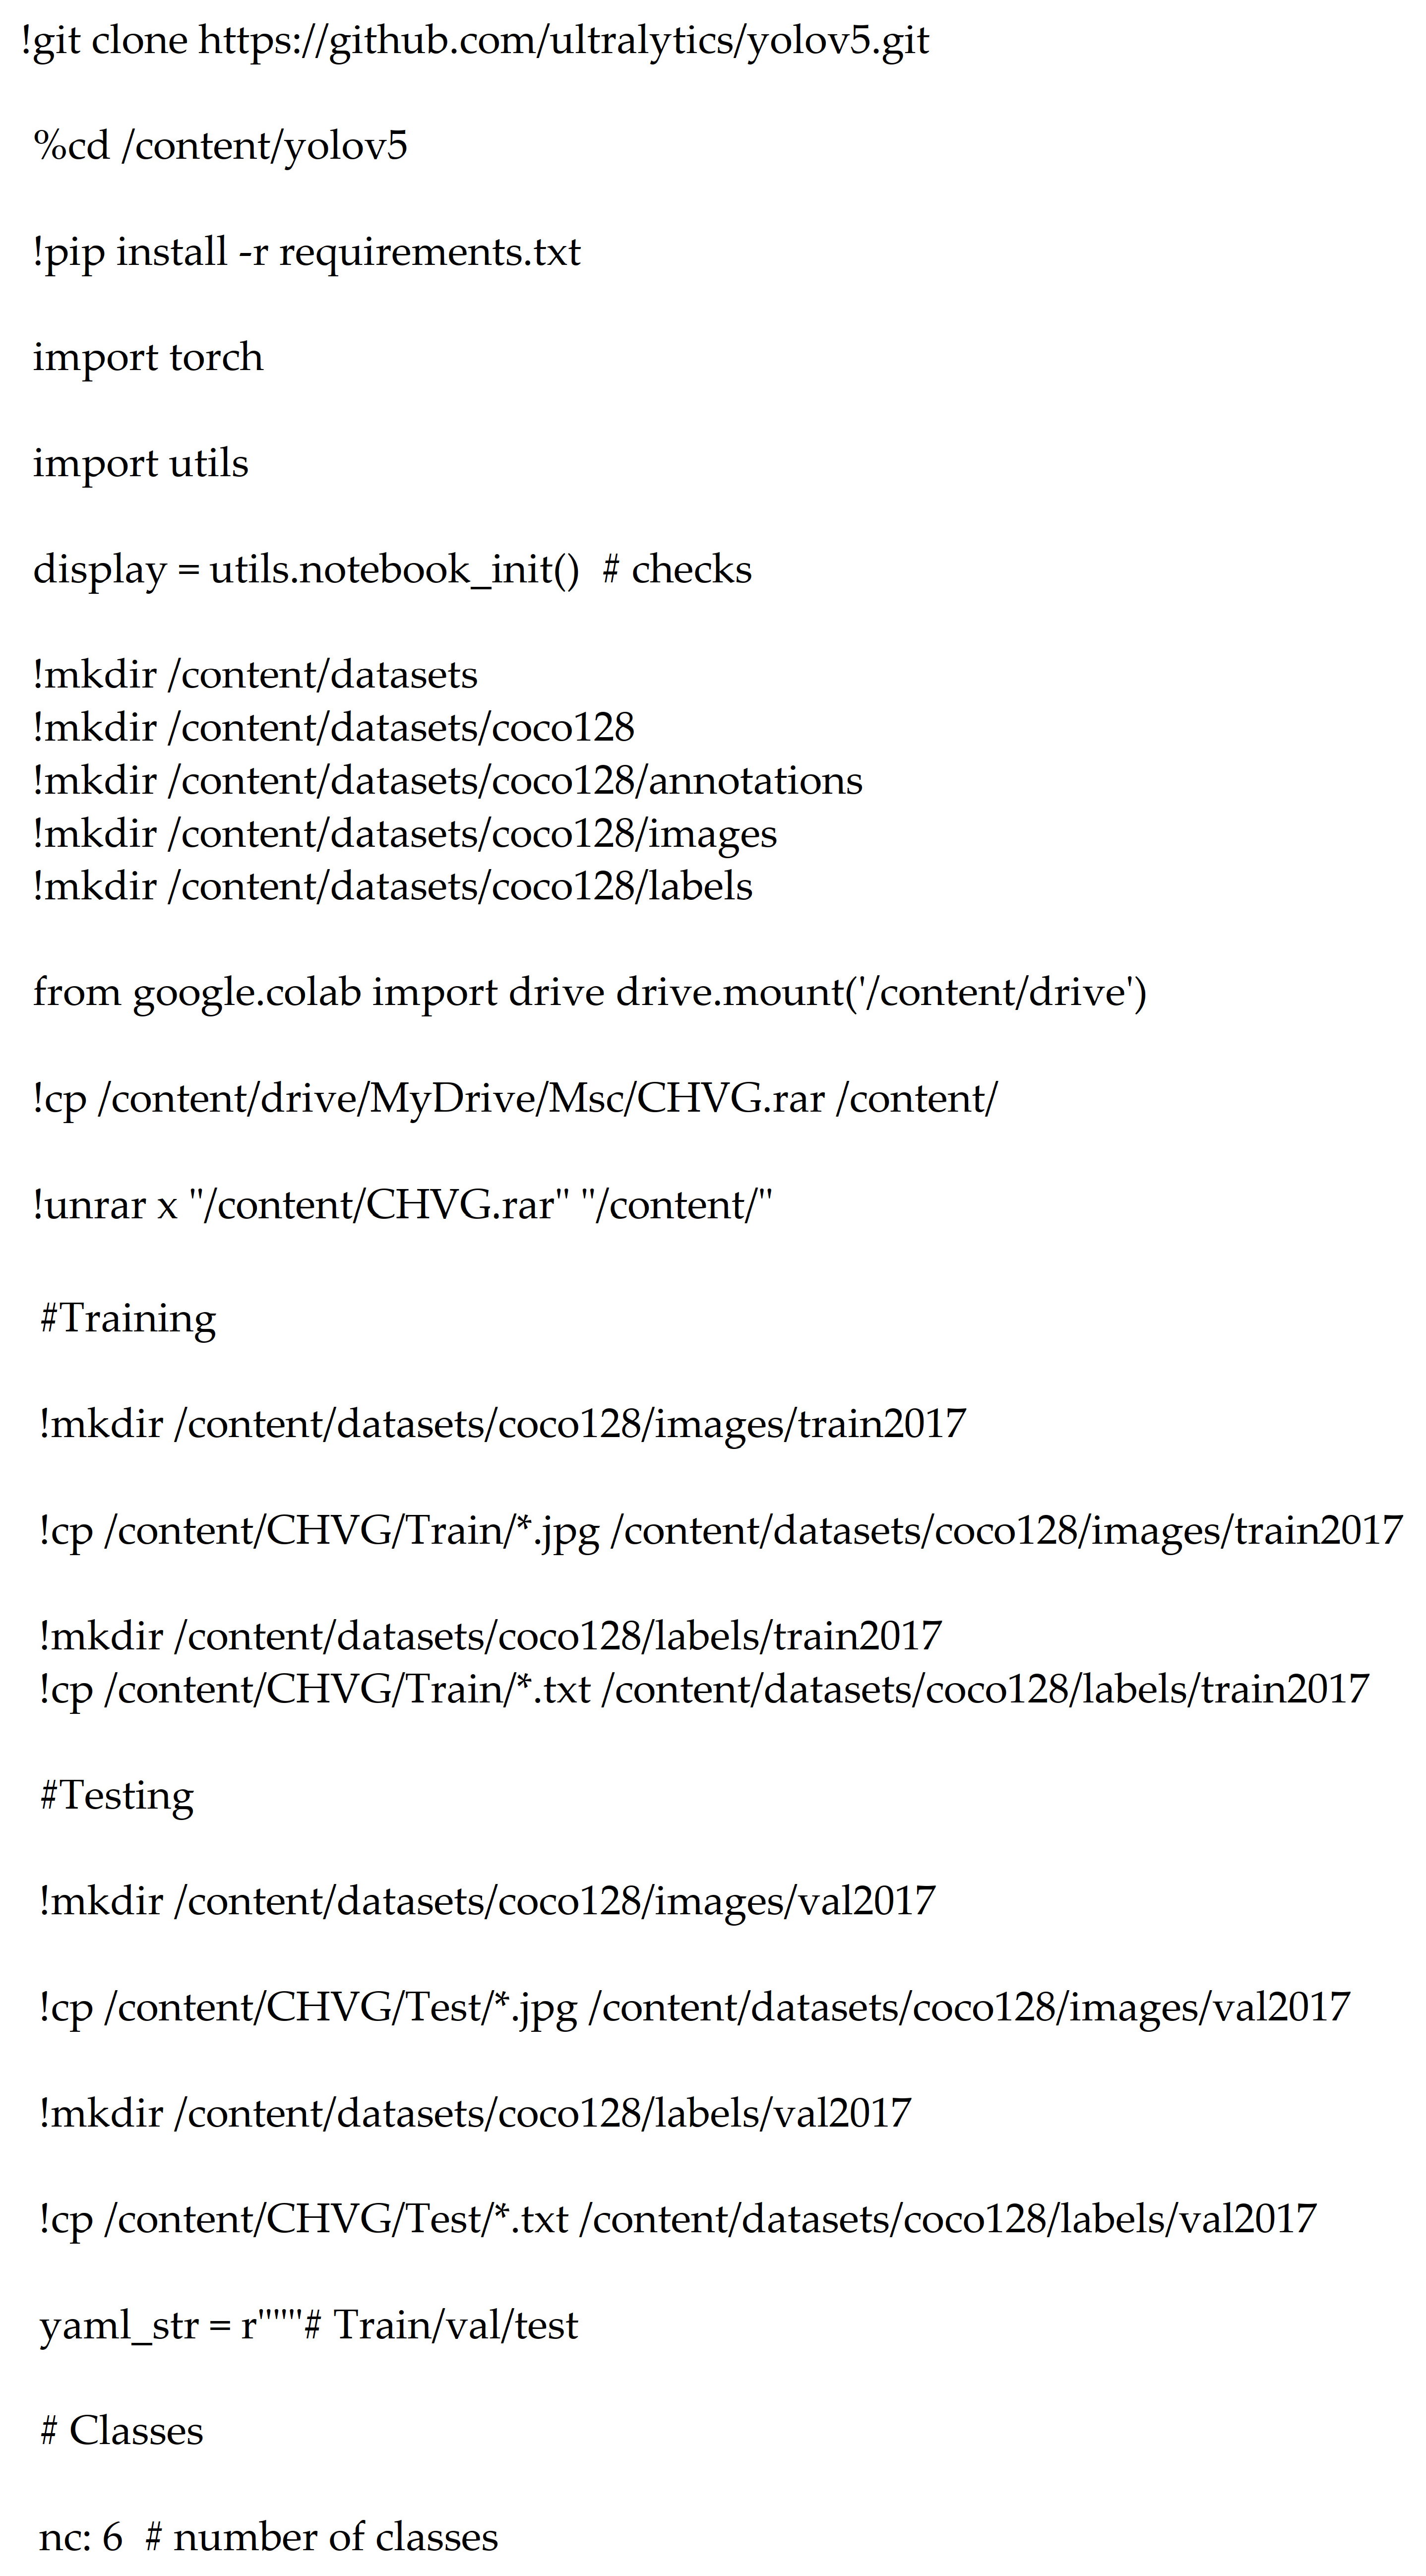
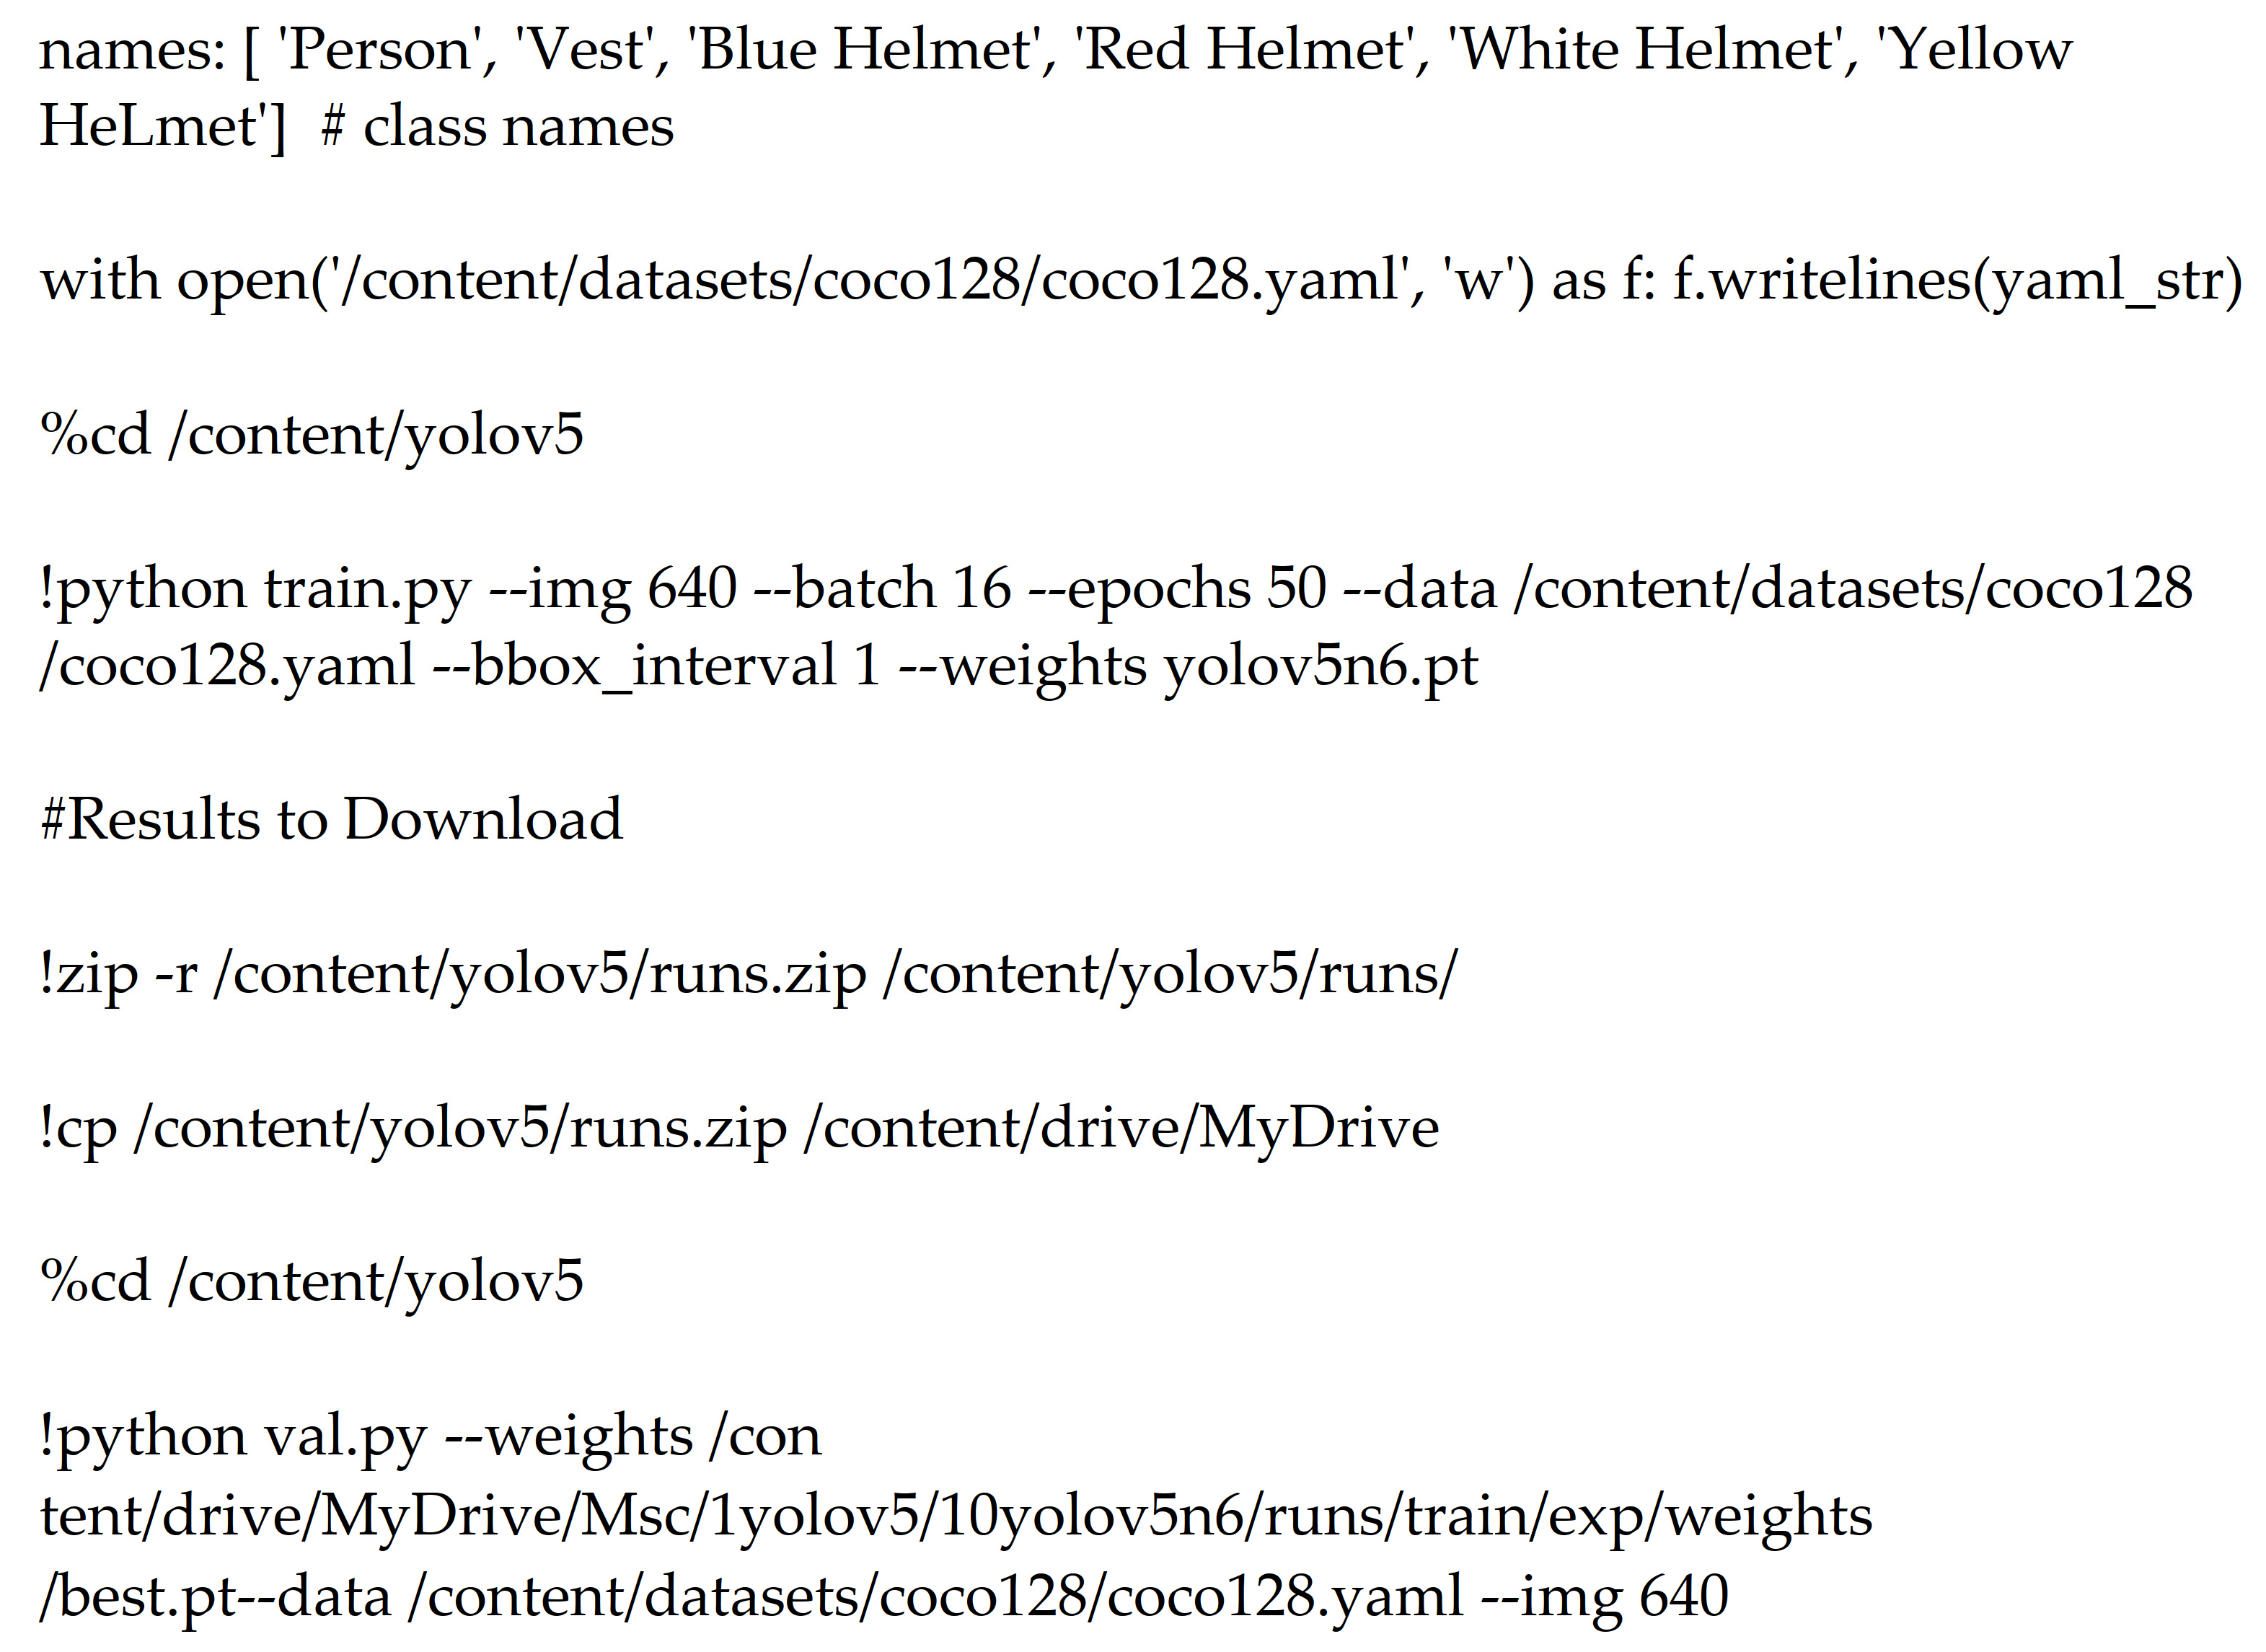
Section 5 represents the dataset used in the training, validation, and testing of different YOLO models, as well as incorporating the code used for the training of the YOLO model.
Section 6 highlights the performance evaluation matrix that can be considered as the basis of comparison between the different YOLO models.
Section 7 clarifies the results of comparing the YOLO models in terms of the performance evolution matrix (recall, pression, F1 score, and mAP).
Section 8 summarizes the whole study and provides readers with recommendations for future YOLO training to be more beneficial in the construction field.
2. Literature Review
Preserving the safety of construction workers during their presence on construction sites is the main aim of this study. This can be achieved by reducing the probability and/or severity of construction incidents. According to recent studies, as mentioned in the introduction, construction workers’ safety is highly dependent on them wearing proper personal protective equipment (PPE) during their presence on construction sites. Hence, this study was conducted to continue work on recognizing PPE by using computer vision applications. Consequently, this literature review shows a number of recent studies on such computer vision techniques, including a number of investigations conducted within the latest six years. The recent studies that will be discussed and reviewed in this paper mainly concentrate on the progression of PPE recognition using computer vision techniques such as convolutional neural networks (CNNs) and the application of transfer learning principles. In addition, by examining these studies, a research gap can be identified, as well as recommendations for future research for the development of an effective PPE detection system that can be tailored specifically for the construction field. As a result, and in terms of incident reduction and avoidance, this would be advantageous.
In this regard, the Web of Science (WoS), which incorporates a significant number of high-impact papers, is the most widely used platform for databases of the scientific literature. Thus, researchers often use this database to collect precise data for bibliometric analyses [
7,
8]. Consequently, the investigation of the literature review for this research is obtained from the WoS database. Accordingly, to find the desired papers in the database, a variety of criteria are analyzed, such as (construction worker) AND ((safety) OR (risk) OR (health)) AND ((machine learning) OR (deep learning) OR (computer vision) OR (vision-based))).
In a study conducted by Delhi et al. [
9], the researchers applied a type of deep learning, which is computer vision, by recognizing the PPE on construction sites on an immediate basis. Accordingly, the researchers collected the dataset on which they conducted the research manually, in addition to applying web scraping. The dataset contained around 2500 images that were classified into four classes, as follows: NOHARDHAT, NOJACKET, SAFE, and NOT SAFE. Hence, YOLO-v3 was trained on that dataset. Furthermore, following the augmentation step based on the data, YOLO-v3 was trained on a sample of data. This gives the model resilience and generalization by performing flipping along with rotation on both sides, left and right, with an angle of 30 degrees. Further, by using a validation test strategy, the provided dataset was split into 90%, 8%, and 2% random segments for training, validation, and testing, respectively. Consequently, and based on the tested data, the model succeeded to fulfil an mAP and F1 score of 97%.
Deep learning neural networks were applied in the research of Wang et al. [
10] for real-time detection and recognizing of objects to address the problem of worker safety by making sure that employees followed safety protocol. They consequently suggested applying YOLO-v3, YOLO-v4, and YOLO-v5, which are detectors based on deep learning of YOLO architectures. They used data from a high-quality dataset called CHV. Such data incorporated 1330 images extracted from Wang et al.’s [
11] dataset and broken down into six categories: person, vest, and helmets with four colors. The research results showed that YOLO-v5s had the fastest GPU performance of 52 FPS, while YOLO-v5x had the best mAP of 86.55%. A newly introduced cognitive analysis of safety measures for a monitoring system was proposed by Torrse et al. in another study [
12]. Such a system was used in this study to instantly determine whether personal protective equipment is being used appropriately based on data gathered by the monitoring of CCTV cameras. Further, the system employed a deep learning algorithm to identify objects. Hence, the study resulted in the creation of a YOLO-v4 system that could achieve an 80.19% mAP at 80 frames per second in real time. Most of the current deep learning detectors had limitations with far-away objects and close-range objects [
13,
14]. YOLO models perform with a higher accuracy more than other detection models.
A similar study by Hayat and Morgado Dias [
15] adopted a deep learning method for real time for the sake of identifying the heads and helmets on construction site workers. This paper investigated three different iterations of the well-known deep learning architecture YOLO: YOLO-v3, YOLO-v4, and YOLO-v5x. The model was implemented by the authors using the public dataset made available by Make ML [
16]. Therefore, a huge number of 3000 instances were used for training, and 1000 instances were used for testing. Furthermore, in this study, only the “Head” and “Helmet” were used as classes. To address the preprocessing of the images, power-law transformation [
17] was used for image preprocessing so as to increase the quality of contrast and lighting in such data. With accuracy, precision, recall, and F1 scores of 92%, 92.4%, 89.2%, and 90.8%, respectively, the YOLO-v5x model gave the best accuracy and, hence, the best performance.
Gallo et al. suggested a system in [
18] to recognize personal protective equipment (PPE) in hazardous industrial areas. Deep neural networks were used for the system’s analysis of a video stream. Five models—YOLO-v4, YOLO-v4-Tiny, SSD, CenterNet, EfficientDet, and MobileNet—were trained to determine whether or not the workers are implementing the safety measures by wearing safety equipment. The authors utilized three datasets: two were collected under controlled conditions and incorporated 215 and 236 images, respectively; the third one is an available public dataset [
19] with 7035 images. Because of its rapid detection speed, YOLO-v4-tiny was implemented in the system, achieving an mAP of 86%. Further, and by using the INRIA person dataset [
20], Li et al. [
21] were able to train an autonomous safety-helmet-wearing recognition system. Furthermore, a safety helmet detection model was suggested by Wang et al. [
22], trained using 10,000 photos taken on construction sites by 10 distinct surveillance cameras. Geng et al. [
23] presented an enhanced helmet recognition method based on an unbalanced dataset of 7581 photos, the majority of which included a person wearing a helmet against a complicated backdrop. By testing it on 689 photos, it resulted in a label confidence of 0.982.
A transfer learning model-based automated technique was developed by Vibhuti et al. [
24] to identify individuals who were not wearing masks in public in the period of the COVID-19 epidemic. InceptionV3, ResNet50, VGG16, MobileNet, MobileNetV2, and Xception were among the deep learning models that were employed in the intervention. Training, testing, and validation were conducted using the Simulated Masked Face dataset (SMFD) [
25]. Through the use of fine-tuning strategy, the pretrained Inception (V3) model was developed and optimized. The greatest results, obtained with the SMFD dataset [
26], were 100% accuracy and specificity in testing and 99.92% in training. The main outcomes highlighted the excellent accuracy of non-mask-wearer recognition automation achieved by the proposed transfer learning model.
Notwithstanding the above-mentioned studies, the previous studies and research did not address a detailed comparative analysis between the different YOLO-based architecture models’ performance. This is deemed to be the research gap in the mentioned studies that is addressed and dealt with in this research by applying a detailed comparative performance analysis between the different YOLO models.
6. Metrics for Performance Evaluation
The CHV dataset was benchmarked by using state-of-the-art one-stage object detection models. The CHV dataset was tested by different YOLO models such as YOLO-v5x, YOLO-v5l, YOLO-v5m, YOLO-v5s, YOLO-v5n, YOLO-v5x6, YOLO-v5l6, YOLO-v5m6, YOLO-v5s6, YOLO-v5n6, YOLO-v8x, YOLO-v8l, YOLO-v8m, YOLO-v8s, and YOLO-v8n.
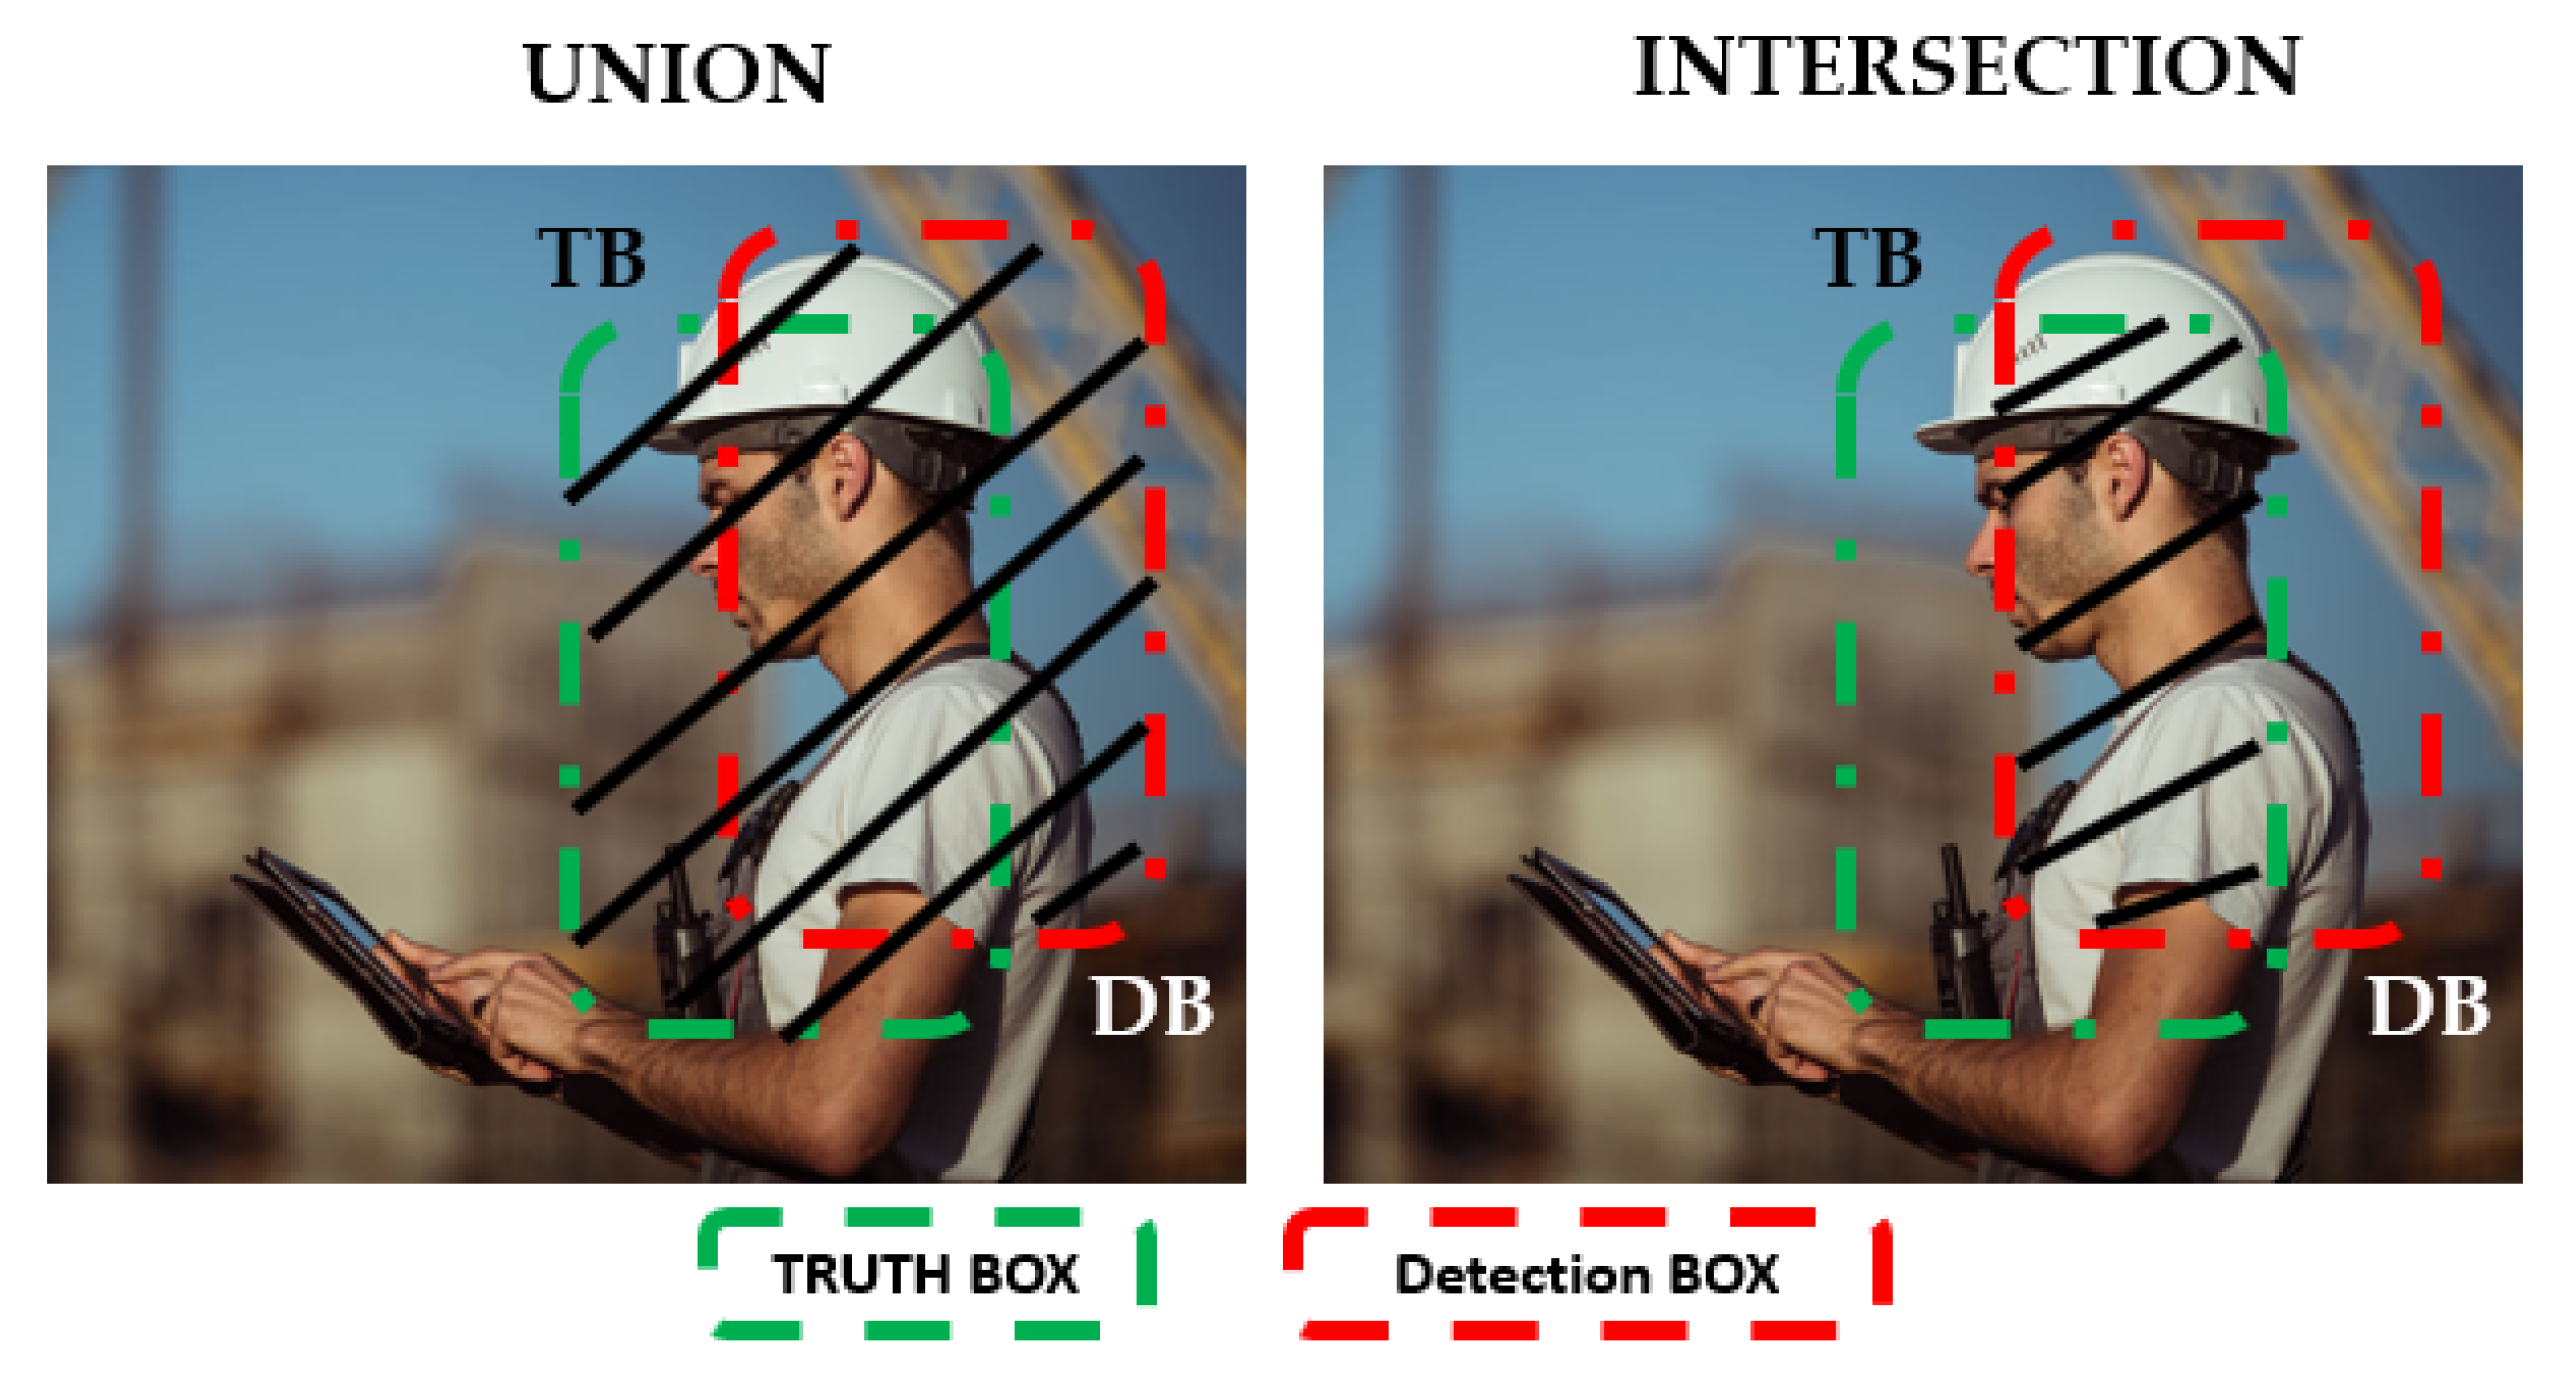
A basic metric to measure the performance of object detection algorithms is intersection over union (IOU). IOU is the ratio between the overlap of two boxes, ground truth box (TB) and detection box (DB). It is calculated using Equation (1) [
33].
Figure 8 shows the relationship between the ground truth box (TB) and the detection box (DB).
After calculating an IOU, the confusion matrix criteria are applied using true positive (TP), false positive (FP), and true negative (TN). These basic concepts are described to aid in understanding the following equations, as follows. True positive (TP) is the correct detection of a ground truth bounding box [
33]. False positive (FP) is the incorrect detection of a nonexistent object [
33]. False negative (FN) is an undetected ground truth bounding box [
33]. In object detection, true negative (TN) results do not apply as there are an infinite number of bounding boxes.
One of the most important and difficult steps in machine learning is choosing appropriate metrics for performance evaluation. ROC curves, F1 score, precision, accuracy, and recall are frequently used metrics for comparison between different models [
34,
35]. They are not suitable for all datasets [
36], especially when the positive and negative datasets are imbalanced [
37]. Since accuracy and ROC curves do not accurately reflect the true classification performance of rare classes, they can be useless performance measures in unbalanced datasets [
38,
39]. In the proposed analysis, the precision, recall, F1 score, and mean average precision (mAP) were used as the evaluation metrics to perform comparison between YOLO’s different models. Precision is the ability of a model to identify only the relative objects [
33]. Precision shows the percentage of correct positive predictions among all detections [
40], as shown in Equation (2).
Recall is the ability of the model to find all the relevant cases [
33]. Recall shows the percentage of true positives among all ground truths [
41], as shown in Equation (3).
Moreover, the F1 score is the harmonic mean of precision and recall, as shown in Equation (4).
Additionally, the most common metric used to measure the accuracy of the detection is mean average precision (mAP). The mAP is a metric used to measure the accuracy of object detectors over all classes, not only a specific class. The mAP is the score achieved by comparing the detected bounding box to the ground truth bounding box. If IOU is greater than or equal to 50%, the detection is counted as TP. The formula of the mAP is given in Equation (5).
where AP
k is the average precision of class k and n represents the number of classes. In this study, n = 6 (person, vest, and four colored helmets).
In addition to assessing the above metrics, multiple metrics such as model layers, floating-point operations per second (FLOPs), and frames per second (FPS) were used to evaluate the performance and efficiency of the YOLO models. The complexity of the model is measured by FLOPs, which express the number of computations of the model. The number of frames per second is represented by FPS. These metrics aid in the comprehension of variables including inference speed, computational cost, and model complexity.
7. Results and Discussion
7.1. YOLO Models Results Comparison
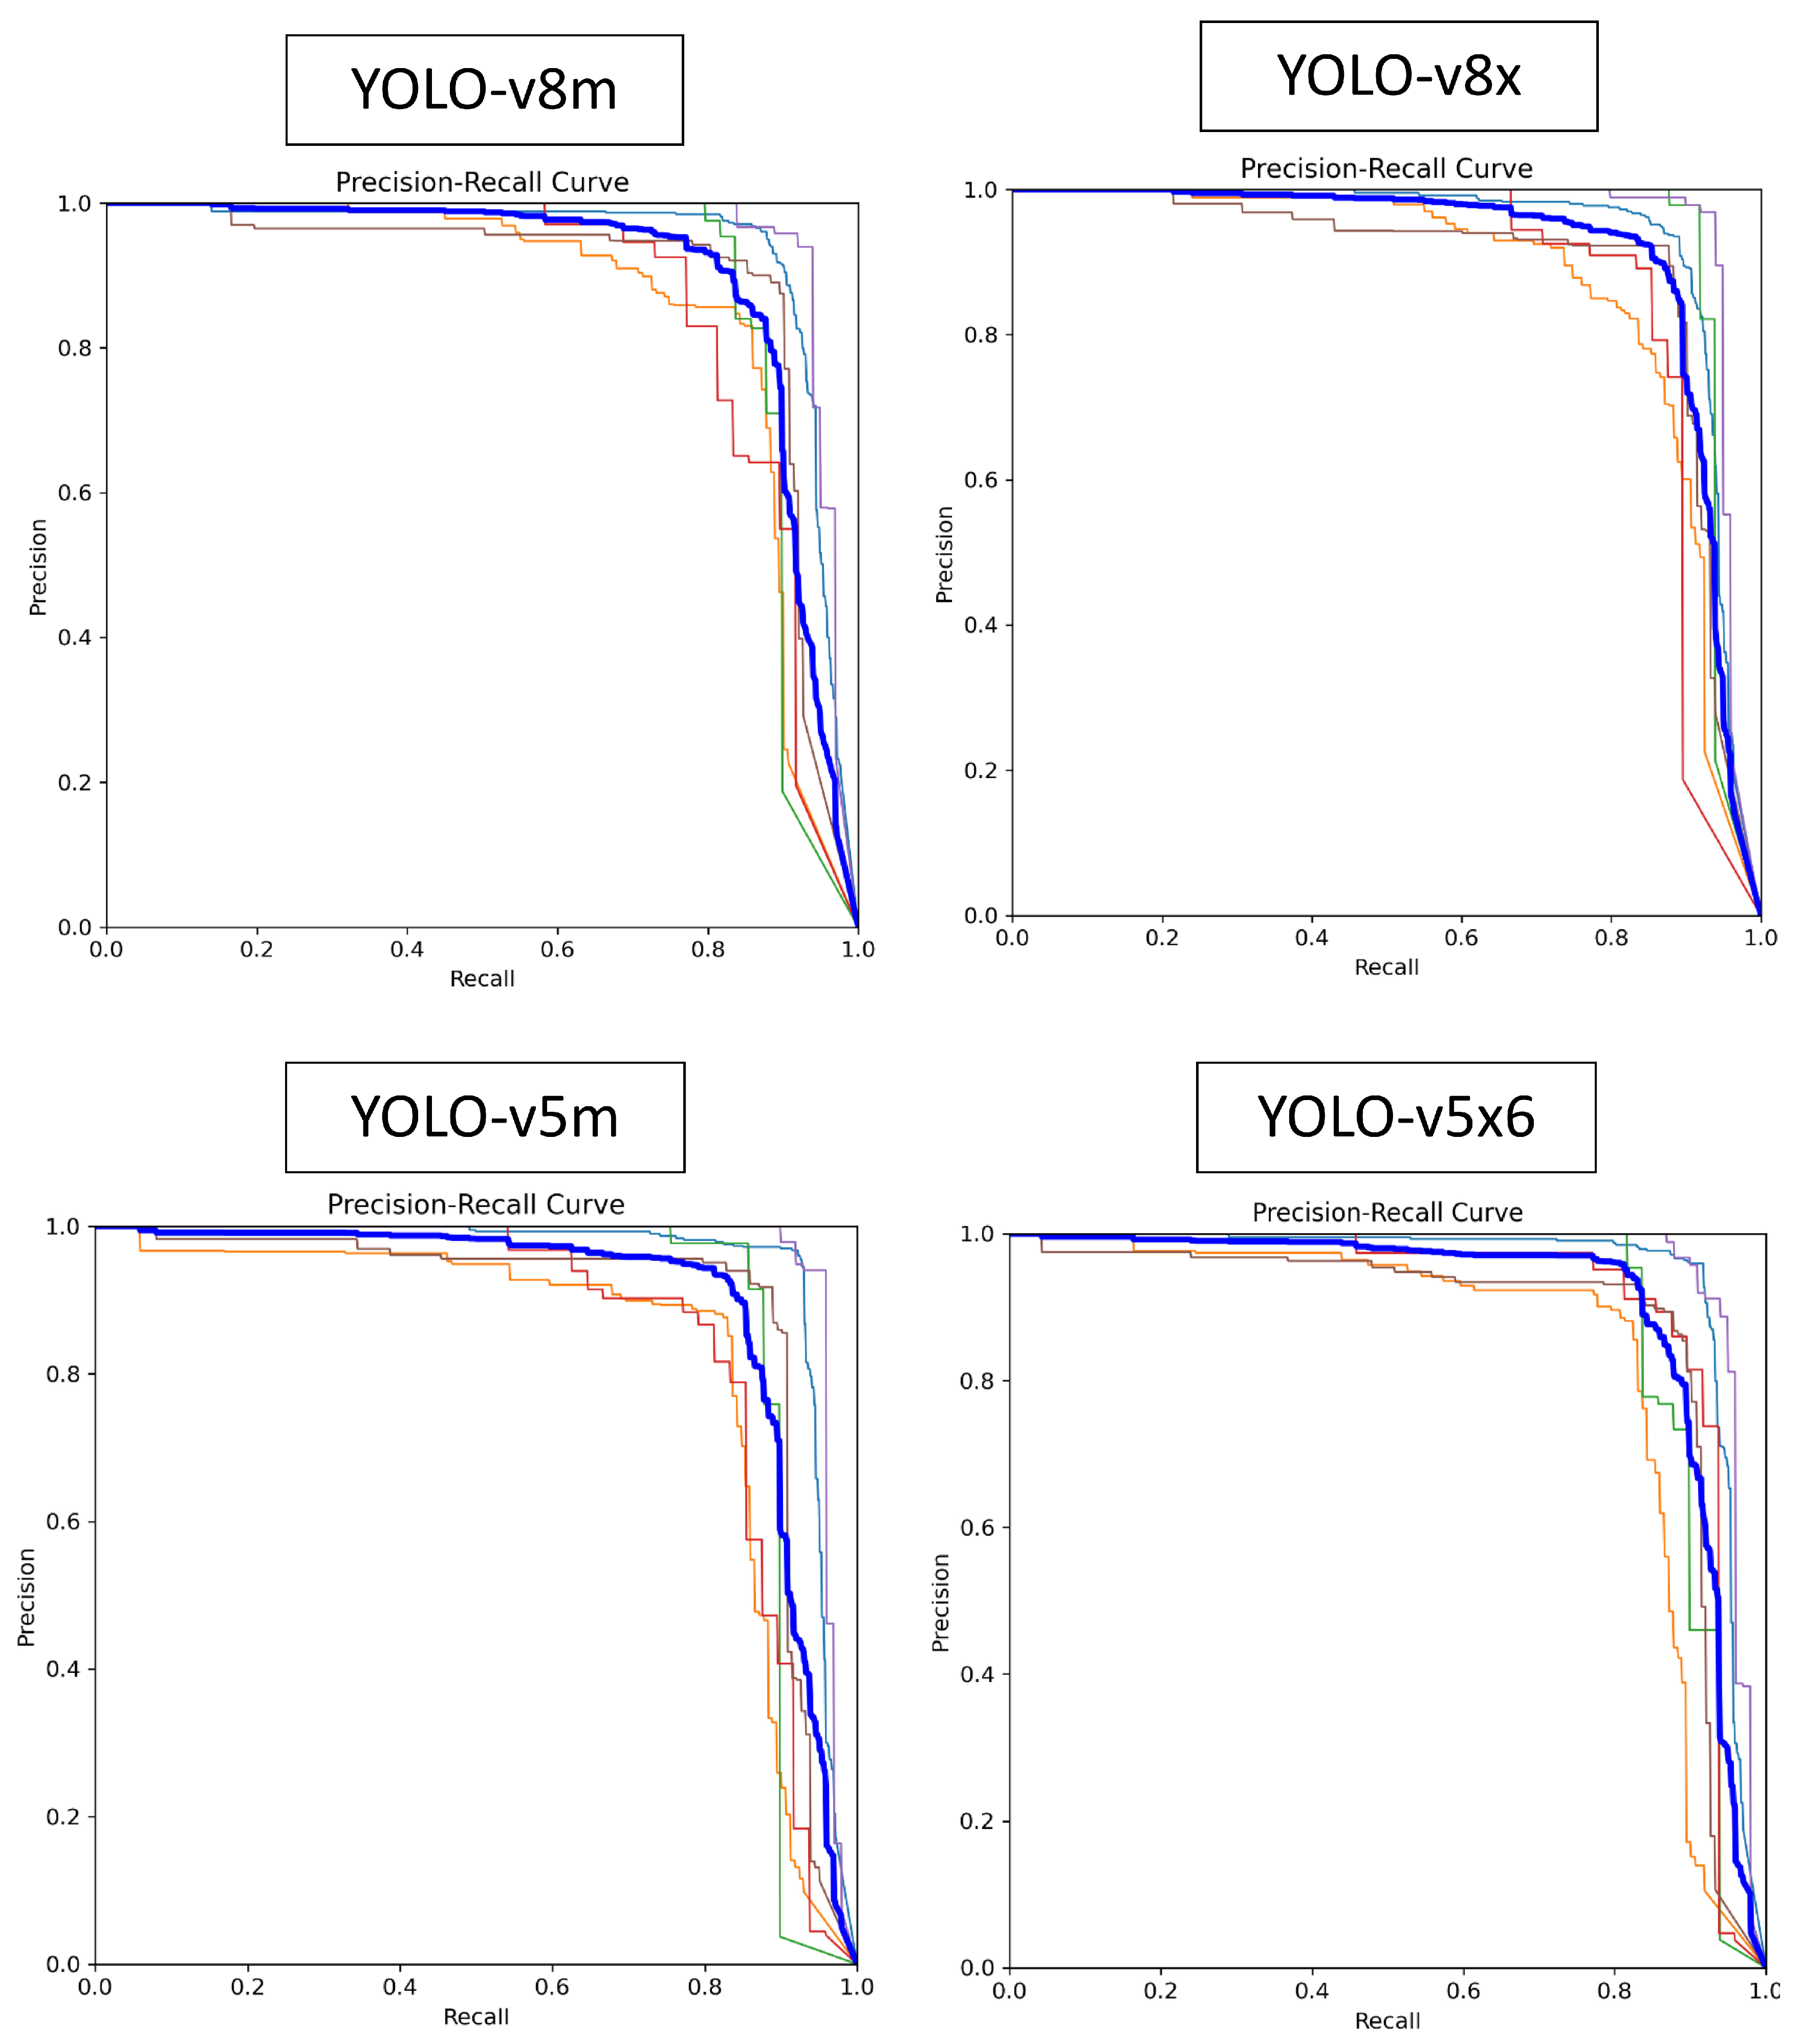
After running the model, precision × recall curves were extracted from the model. For a precision × recall curve, the accuracy of the model increases when the precision has a higher value accompanied with increase in the recall. Therefore, the curves which are closer to the right corners have higher performance. The precision × recall curves for YOLO’s different models are presented in
Figure 9.
In order to calculate the precision, recall, F1 score, and mean average precision (mAP), the TP, FP, and FN need to be extracted from the model after validating it.
Table 3 shows the TP, FP, and FN for the ten YOLO-v5 models.
Table 4 shows the TP, FP, and FN for the five YOLO-v8 models. Regarding the person class, YOLO-v5m6 scored the highest TP, which leads to an increase in precision and recall metrics. YOLO-v5n scored the highest FN, which leads to a decrease in recall metric. For the vest class, YOLO-v8s scored the highest TP, while YOLO-v5s6 scored the highest FN. For blue and red helmet classes, YOLO-v5n6 and YOLO-v8s scored the highest TP, while YOLO-v5N scored the highest FN. Other comparisons can be deduced from
Table 3 and
Table 4.
After calculating TP, FP, and FN, the precision, recall, F1 score, and mean average precision (mAP) can now be calculated by applying Equations (2)–(5).
Table 5,
Table 6,
Table 7 and
Table 8 show a comparative analysis between YOLO’s different models.
Figure 10,
Figure 11,
Figure 12 and
Figure 13 elaborate the results shown in
Table 5,
Table 6,
Table 7,
Table 8 and
Table 9.
7.2. Analysis of the Results
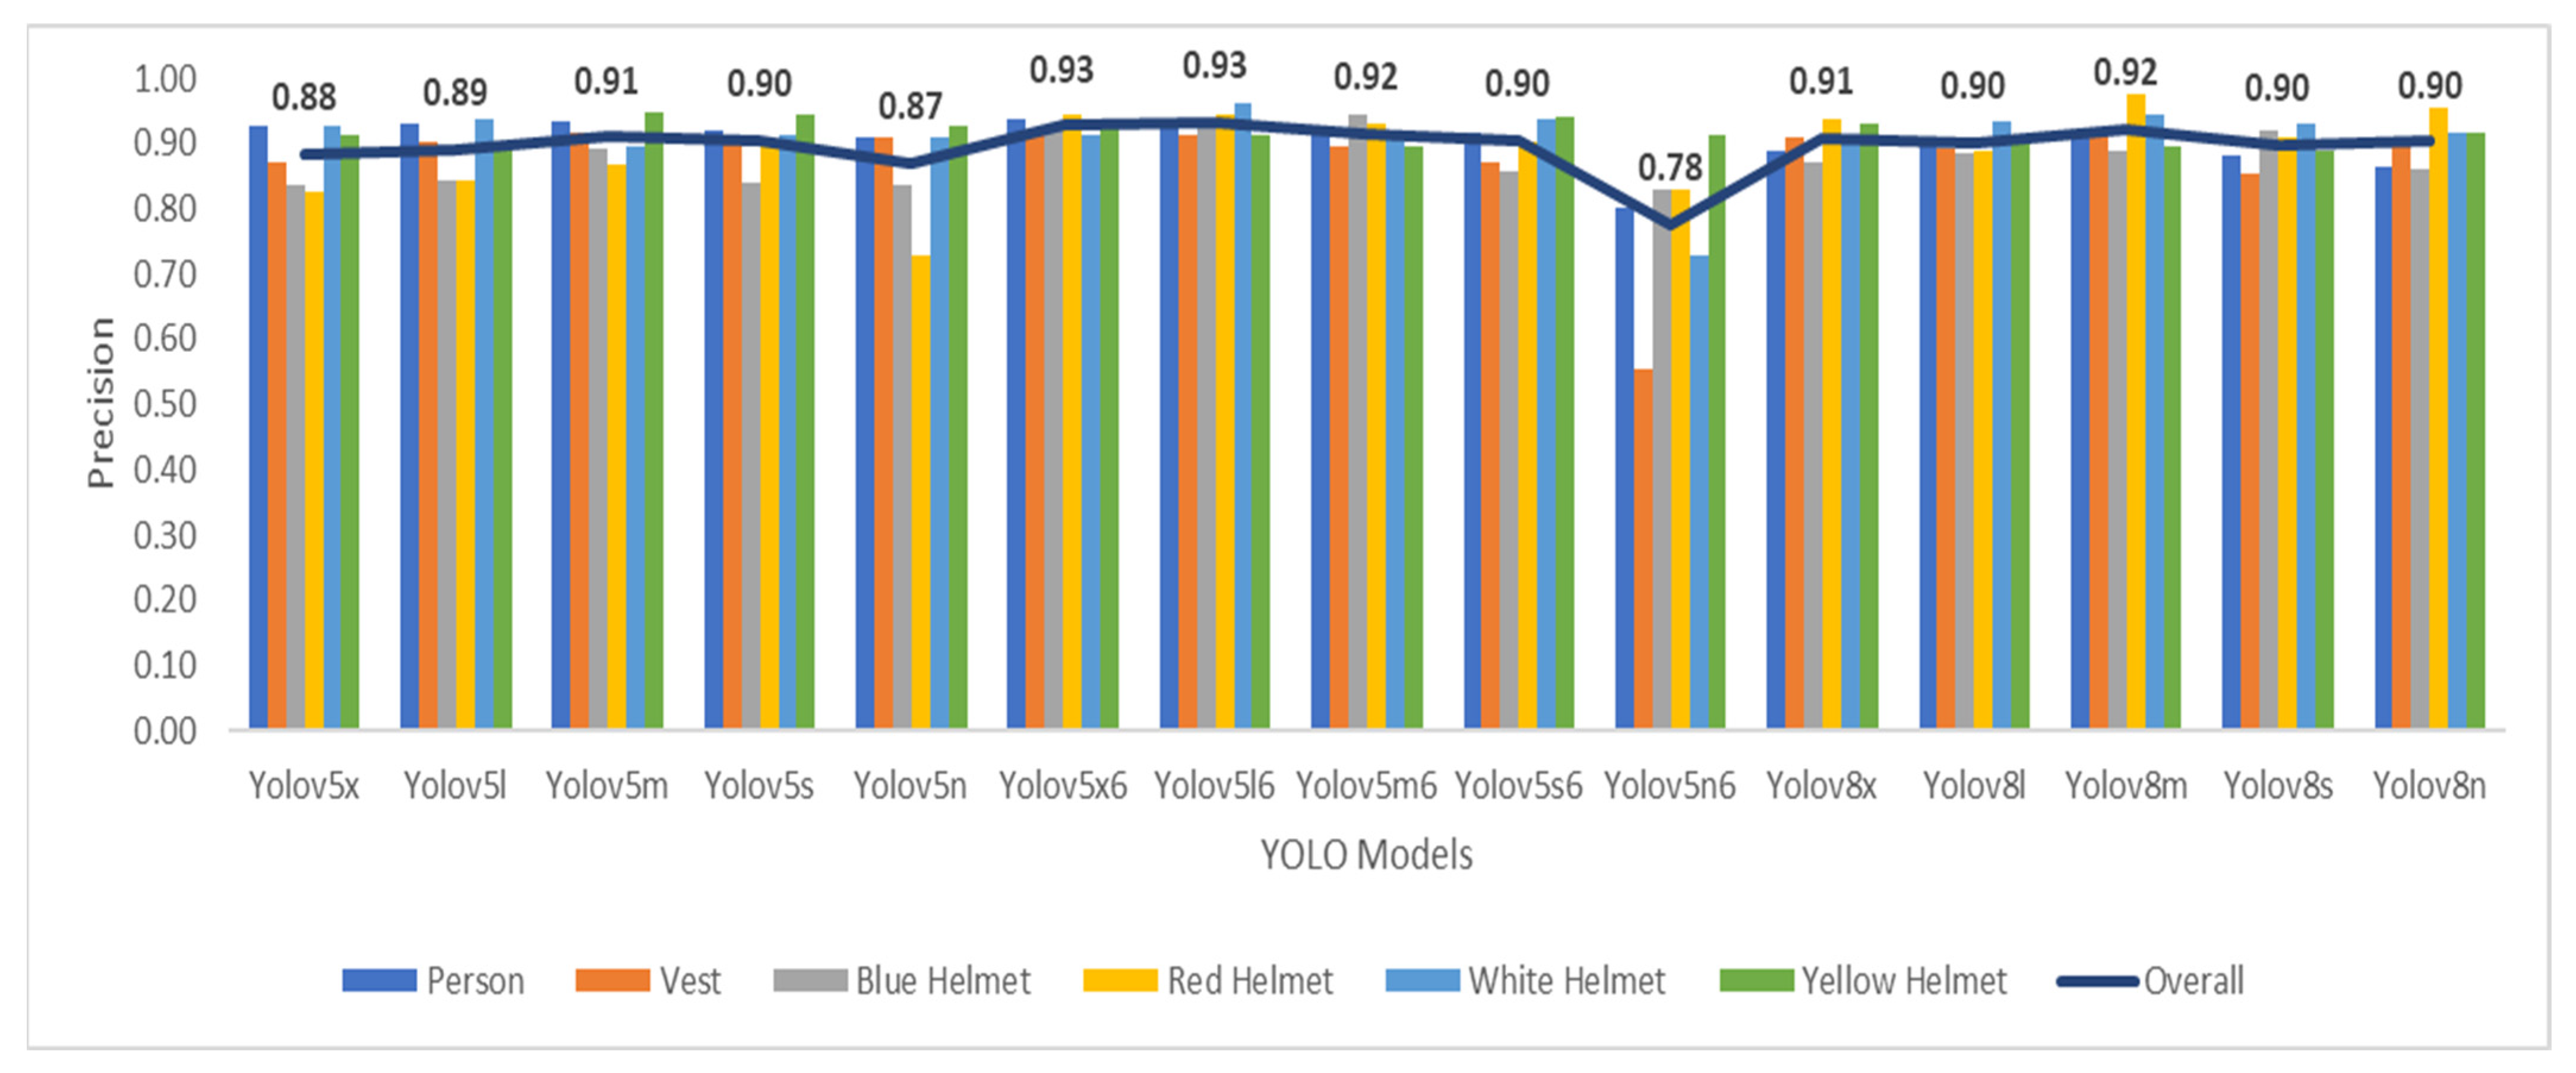
Regarding detailed comparative analysis of YOLO-based architectures for the detection of personal protective equipment (PPE) on construction sites, key findings were shown by various performance metrics. Notably, as shown in
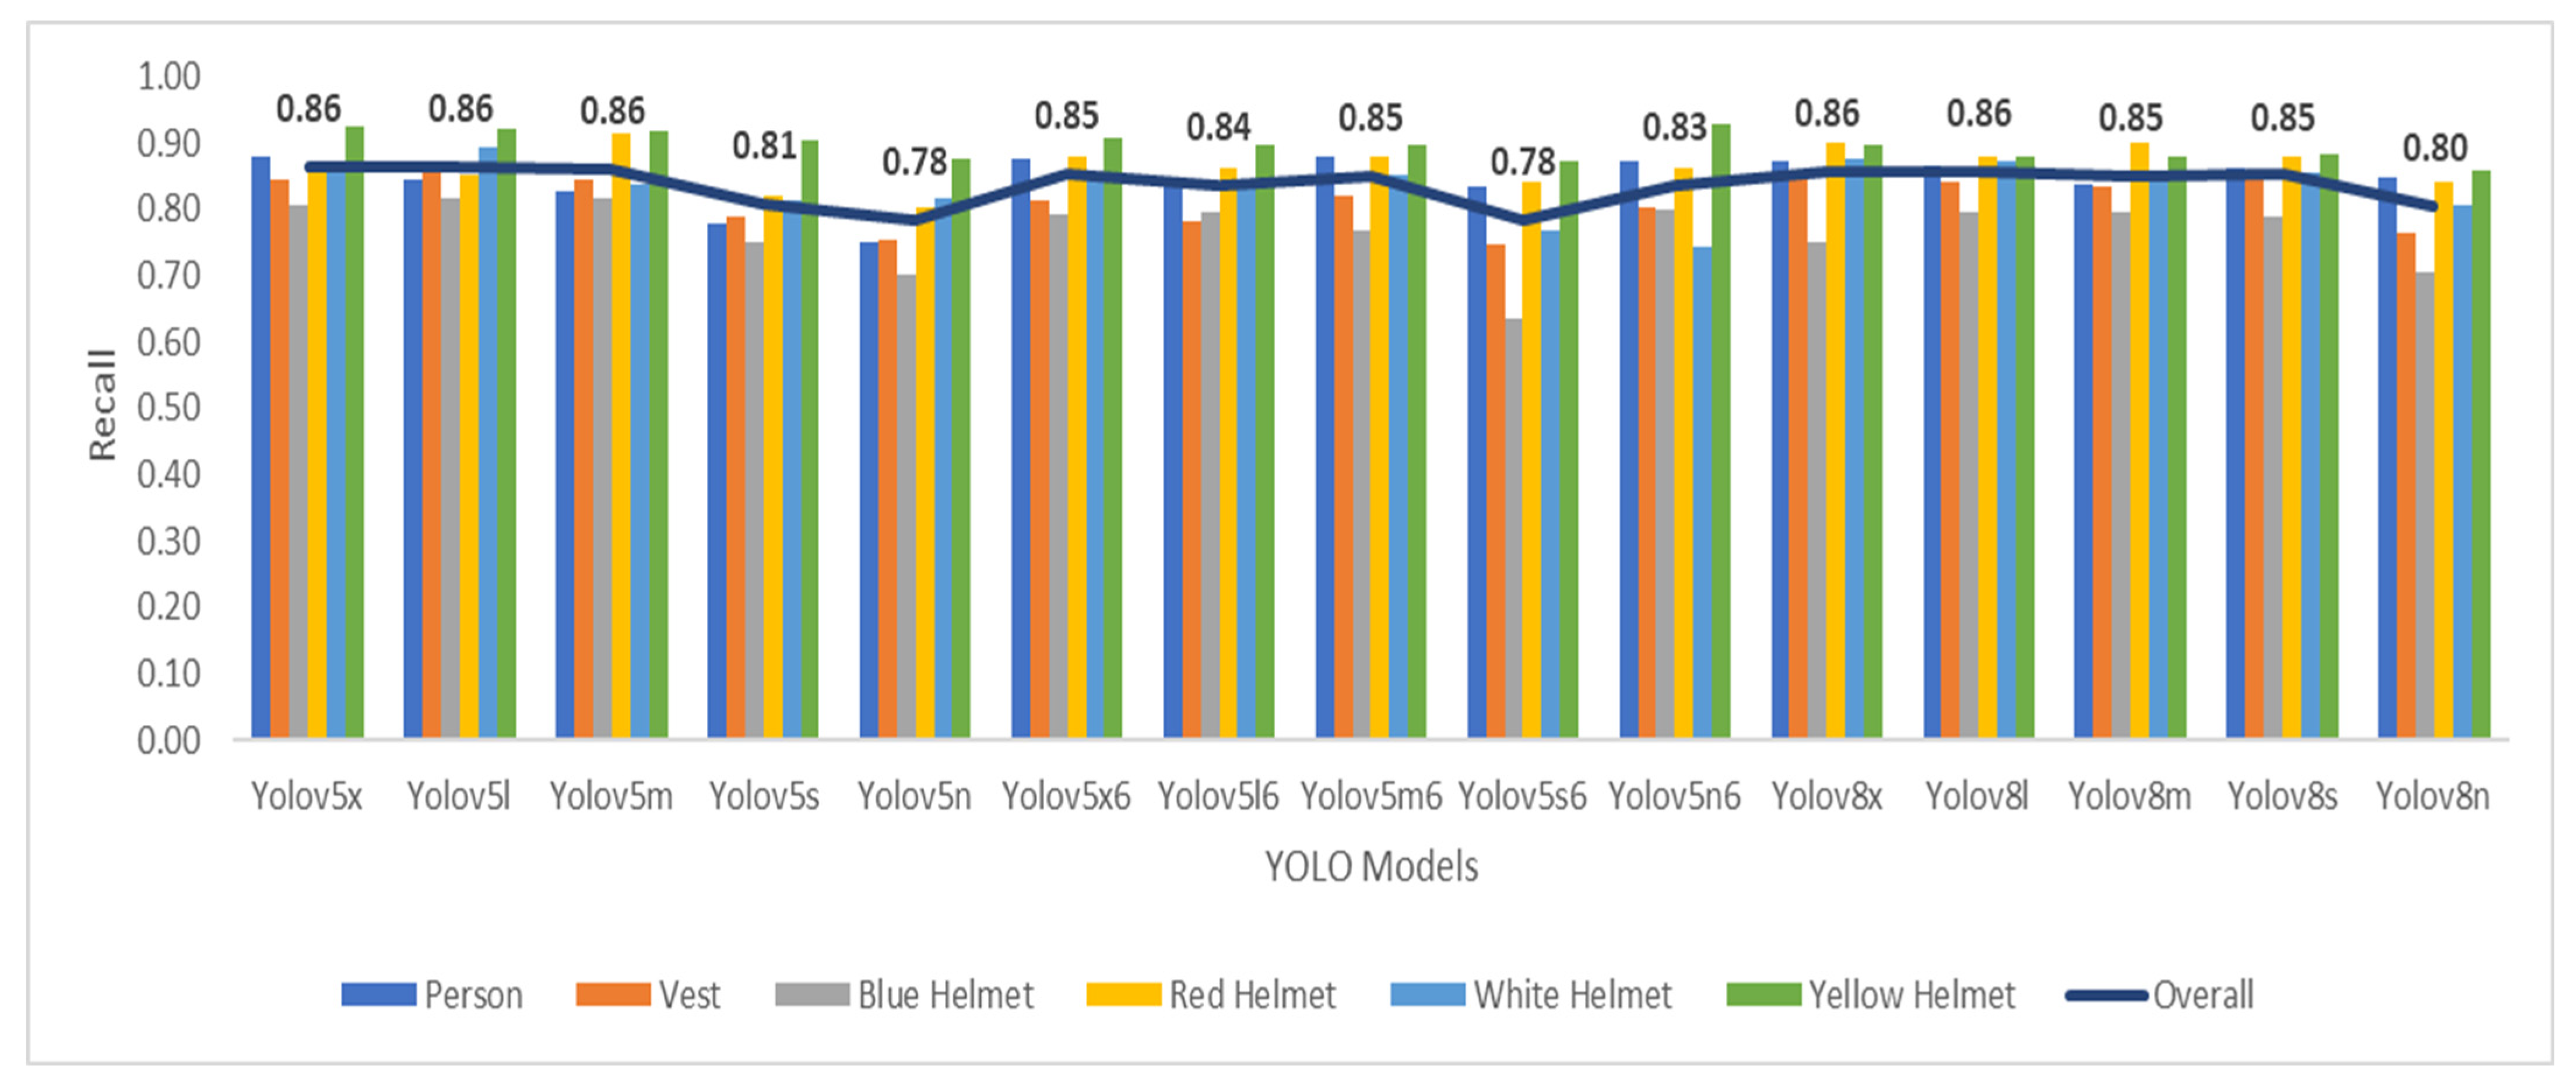
Table 5, in terms of precision, three models demonstrated exceptional accuracy in identifying PPE instances within construction site images. YOLO-v5x6 and YOLO-v5l6 were the top-performing models in terms of precision. Following them closely was YOLO-v8m. Turning our attention to the recall metric, the results show that YOLO-v5x, YOLO-v5l, and YOLO-v8m shared identical recall values. This suggests a comparable ability among these models to effectively capture instances of personal protective equipment in different construction site scenarios.
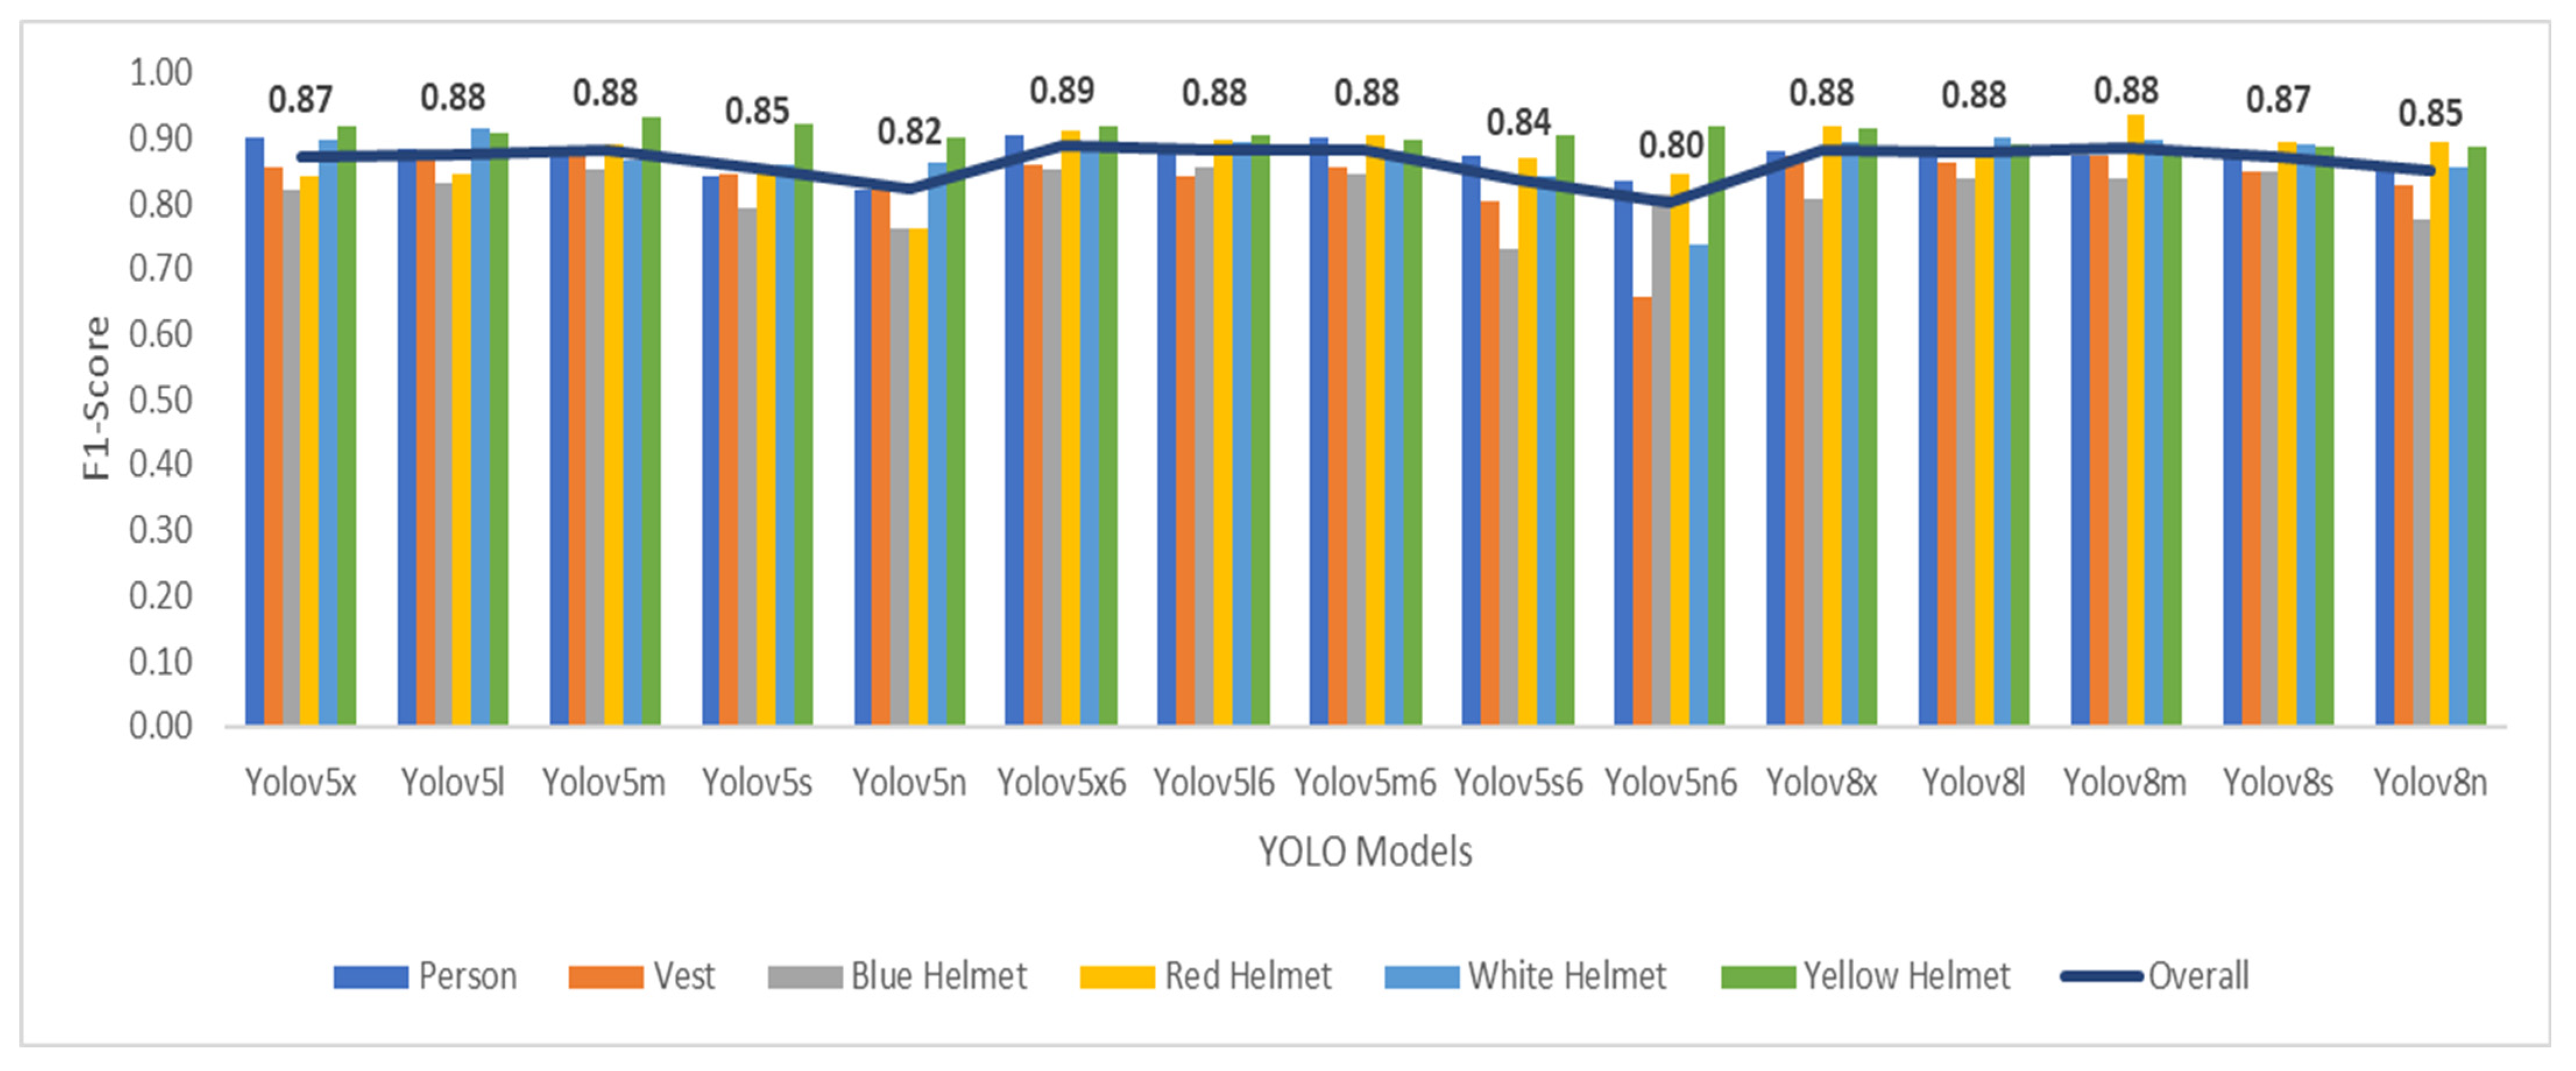
The F1 score, harmonic mean of precision, and recall revealed another set of top-performing models. YOLO-v5x6 stands out with the highest F1 score of 0.89, closely followed by YOLO-v5l, YOLO-v5m, YOLO-v8m, and YOLO-v8x, all achieving an F1 score of 0.88. These models demonstrated strong overall performance, balancing precision and recall effectively. YOLO-v5n6 and YOLO-v5n exhibited slightly lower F1 scores at 0.8 and 0.82, respectively. In general, these YOLO models offer reliable object detection capabilities, with specific variations in F1 scores that users can consider based on their application requirements.
The mAP (mean average precision) comparative analysis for various YOLO models indicates a consistent level of performance across different configurations. YOLO-v8m leads the group with the highest mAP of 0.92, closely followed by YOLO-v8x and YOLO-v8l, both achieving an mAP of 0.91. YOLO-v5x, YOLO-v5l6, YOLO-v5l, and YOLO-v5m share a common mAP of 0.90, highlighting their comparable precision in object detection. YOLO-v5s, YOLO-8n, and YOLO-v8s also delivered solid performance, with mAP values ranging from 0.87 to 0.89. YOLO-v5n6 and YOLO-v5s6 exhibited slightly lower mAPs at 0.8 and 0.85, respectively. Overall, these YOLO models showcase reliable and competitive mAP scores, with users able to choose based on specific application requirements and computational considerations.
Considering the values of model layers, YOLO-v5x6 has the highest number of layers (416), indicating a more complex architecture. YOLO-v5s and YOLO-v5n have the fewest layers (157), suggesting a simpler architecture. Regarding FPS, YOLO-v5n6 has the highest FPS (87.72), indicating faster processing of frames per second. YOLO-v5s and YOLO-v5s6 also have high FPS values, suggesting good real-time performance. YOLO-v8x has the lowest FPS (20.37), indicating slower frame processing. Concerning models’ parameters, YOLO-v5x6 has the highest number of parameters (140.02 million), signifying a more complex model. YOLO-v5n has the lowest number of parameters (1.77 million), indicating a simpler model.
In addition to the abovementioned results, and after comparing computational cost for different models, it was deduced that YOLO-v8x has the highest FLOPS (214 million), suggesting higher computational efficiency. YOLO-v5x has the highest FLOPS among YOLO-v5 models, indicating higher computational load. Moreover, YOLO-v8x has the highest FLOPS among YOLO-v8 models. YOLO-v5n and YOLO-v5n6 have the lowest FLOPS (4.20 million), suggesting lower computational load. Accordingly, YOLO-v5n6 stands out for its high FPS and low FLOPS, indicating good real-time performance and computational efficiency. YOLO-v5x6, while having a high number of parameters, has a lower FPS, suggesting a trade-off between complexity and processing speed. The other models fall in between, offering a range of choices based on specific requirements for model complexity, real-time performance, and computational load. Notwithstanding the forementioned, the benefit of this detailed analysis is that YOLO-v8m benchmarks against previous related research studies with an increase of 6.64% advancement in mAP, making it more reliable and accurate.
8. Conclusions
To sum up, the construction workers have a higher risk of becoming injured. It was figured out that most of the construction accidents resulted from the construction workers’ negligence in wearing the personal protective equipment (PPE). Hence, the researchers agreed that the PPE is the main line of defense against any threats that workers may encounter during their presence on construction sites, as per Delhi et al. [
9]. Therefore, the YOLO-based architectural model was thought to be one of the AI applications in terms of tracking the workers’ safety on construction sites by detecting the workers’ who are not wearing the PPE.
In the light of the abovementioned conclusions and after experimenting with the CHV dataset on YOLO-v5 ten models and YOLO-v8 five models, the precision, recall, F1 score, mean average precision (mAP), number of layers, number of parameters, FPS, and FLOPS were calculated to compare between different YOLO models. YOLO-v8m benchmarks against previous related research studies with an increase of 6.64% advancement in mAP, making it more suitable for applications where detection performance is the measure for decision making. These findings collectively help to understand the strengths and capabilities of each YOLO-based architecture in the context of PPE detection on construction sites, providing valuable insights for the development and deployment of computer vision solutions in occupational safety applications.
In this regard, one drawback of different YOLO models is their difficulty in identifying small objects at a long distance, especially when there are some huge objects nearby. This might be resolved by changing or developing the architecture. Additionally, even though the model was extended to include six distinct PPE classes, it may be expanded more to detect more PPE sets, such as masks, glasses, and gloves. Regarding future research, our studies will be expanded to optimize each model and enhance its performance by gathering original datasets from different actual construction sites, which could help more in the model training process. This will be reflected in more accurate predictions.


