Article

A Basic Study for Predicting Dysphagia in Panoramic X-ray Images Using Artificial Intelligence (AI) Part 2: Analysis of the Position of the Hyoid Bone on Panoramic Radiographs

1
Division of Radiology, Department of Oral Diagnostic Sciences, Showa University School of Dentistry, 2-1-1 Kitasenzoku, Ohta-ku, Tokyo 145-8515, Japan
2
Department of Engineering on Intelligent Machines & Biomechanics, School of Regional Innovation & Social Design Engineering, Faculty of Engineering, Kitami Institute of Technology, 165 Koencho, Kitami 090-8507, Hokkaido, Japan
*
Author to whom correspondence should be addressed.
Eng 2023, 4(4), 2542-2552; https://doi.org/10.3390/eng4040145
Submission received: 2 September 2023 / Revised: 20 September 2023 / Accepted: 22 September 2023 / Published: 10 October 2023
(This article belongs to the Special Issue Artificial Intelligence and Data Science for Engineering Improvements)

Abstract

:
Background: Oral frailty is associated with systemic frailty. The vertical position of the hyoid bone is important when considering the risk of dysphagia. However, dentists usually do not focus on this position. Purpose: To create an AI model for detection of the position of the vertical hyoid bone. Methods: In this study, 1830 hyoid bone images from 915 panoramic radiographs were used for AI learning. The position of the hyoid bone was classified into six types (Types 0, 1, 2, 3, 4, and 5) based on the same criteria as in our previous study. Plan 1 learned all types. In Plan 2, the five types other than Type 0 were learned. To reduce the number of groupings, three classes were formed using combinations of two types in each class. Plan 3 was used for learning all three classes, and Plan 4 was used for learning the two classes other than Class A (Types 0 and 1). Precision, recall, f-values, accuracy, and areas under the precision–recall curves (PR-AUCs) were calculated and comparatively evaluated. Results: Plan 4 showed the highest accuracy and PR-AUC values, of 0.93 and 0.97, respectively. Conclusions: By reducing the number of classes and not learning cases in which the anatomical structure was partially invisible, the vertical hyoid bone was correctly detected.

1. Introduction

Oral frailty is a risk factor for physical frailty, and is related to quality of life. In previous studies [1,2], we suggested that patients with dysphagia have a lower position of the hyoid bone on panoramic radiographs. However, this anatomical structure did not focus on the dental treatment. In our recent study [3], we found that, in patients diagnosed with dysphagia by videofluoroscopic examination of swallowing, the position of the vertical hyoid bone was significantly lower than in people who did not have dysphagia. A cut-off value was investigated to determine how low the hyoid bone was observed in the vertical direction to indicate a high probability of dysphagia. From these articles, we suggested it is important to check the position of the hyoid bone, not only for oral frailty but also the risk of dental treatment. General dentists typically do not focus on the position of the hyoid bone. Instead of these dentists, an artificial intelligence (AI) system could automatically check the position of the hyoid bone and alert them to the risk of dysphagia if the hyoid bone is in a low position. We believe that it is possible to prevent the decline in oral function from an earlier stage.
Advances in computer processing power have made it possible to analyze vast numbers of images in relatively short time periods. As a result, AI systems have evolved, and these are now being applied to various fields, such as daily life and medicine.
In the field of dentistry, the usefulness of AI in image diagnosis is now being investigated. In addition, researchers have sought to evaluate diagnostic ability using AI in a number of recent studies, as described below.
Kabir et al. [4], Yilmaz et al. [5], and JH Lee et al. [6] investigated the extraction of normal anatomical structures. Shaffi et al. [7] were teeth lesion detection by using deep learning and the Internet for the automated healthcare diagnosis.
Regarding diseases, Fatima et al. [8] detect the periapical disease, a lightweight Mask-RCNN model is proposed for periapical disease detection. Mao et al. [9] detected furcation involvement on molar teeth, and Son et al. [10] discussed automatic fracture detection in the maxillofacial area. Ha et al. [11] evaluated the detection of supernumerary teeth, and Okazaki et al. [12] investigated diagnostic accuracy in the detection of odontoma and impacted teeth. Other studies that have examined multiple diseases, including the detection of cysts and tumors by Yang et al. [13]. In addition, Tareq et al. [14] attempted diagnostic evaluation of dental caries using smartphone images of teeth, and found that that this may be useful for remote dental treatment.
Concerning evaluation of the degree of growth and development, Li et al. [15] assessed the maturity of the cervical spine using AI. With regard to evaluation of non-anatomical structures, Park et al. [16] investigated automatic extraction of implant bodies on radiographs using AI.
It can be seen, then, that many diagnostic imaging studies using AI have been reported to date. More generally, Putra et al. [17] focused on diseases such as dental caries, periapical lesions, periodontal disease, and cystic benign tumors. Finally, Thurzo et al. [18] summarized the frequency and trends of studies on AI in the dental field over the last 10 years, and found that published papers were particularly focused on the field of radiology.
The purpose of this study was to perform image diagnosis of the vertical position of the hyoid bone on panoramic radiographs using AI.

2. Materials and Methods

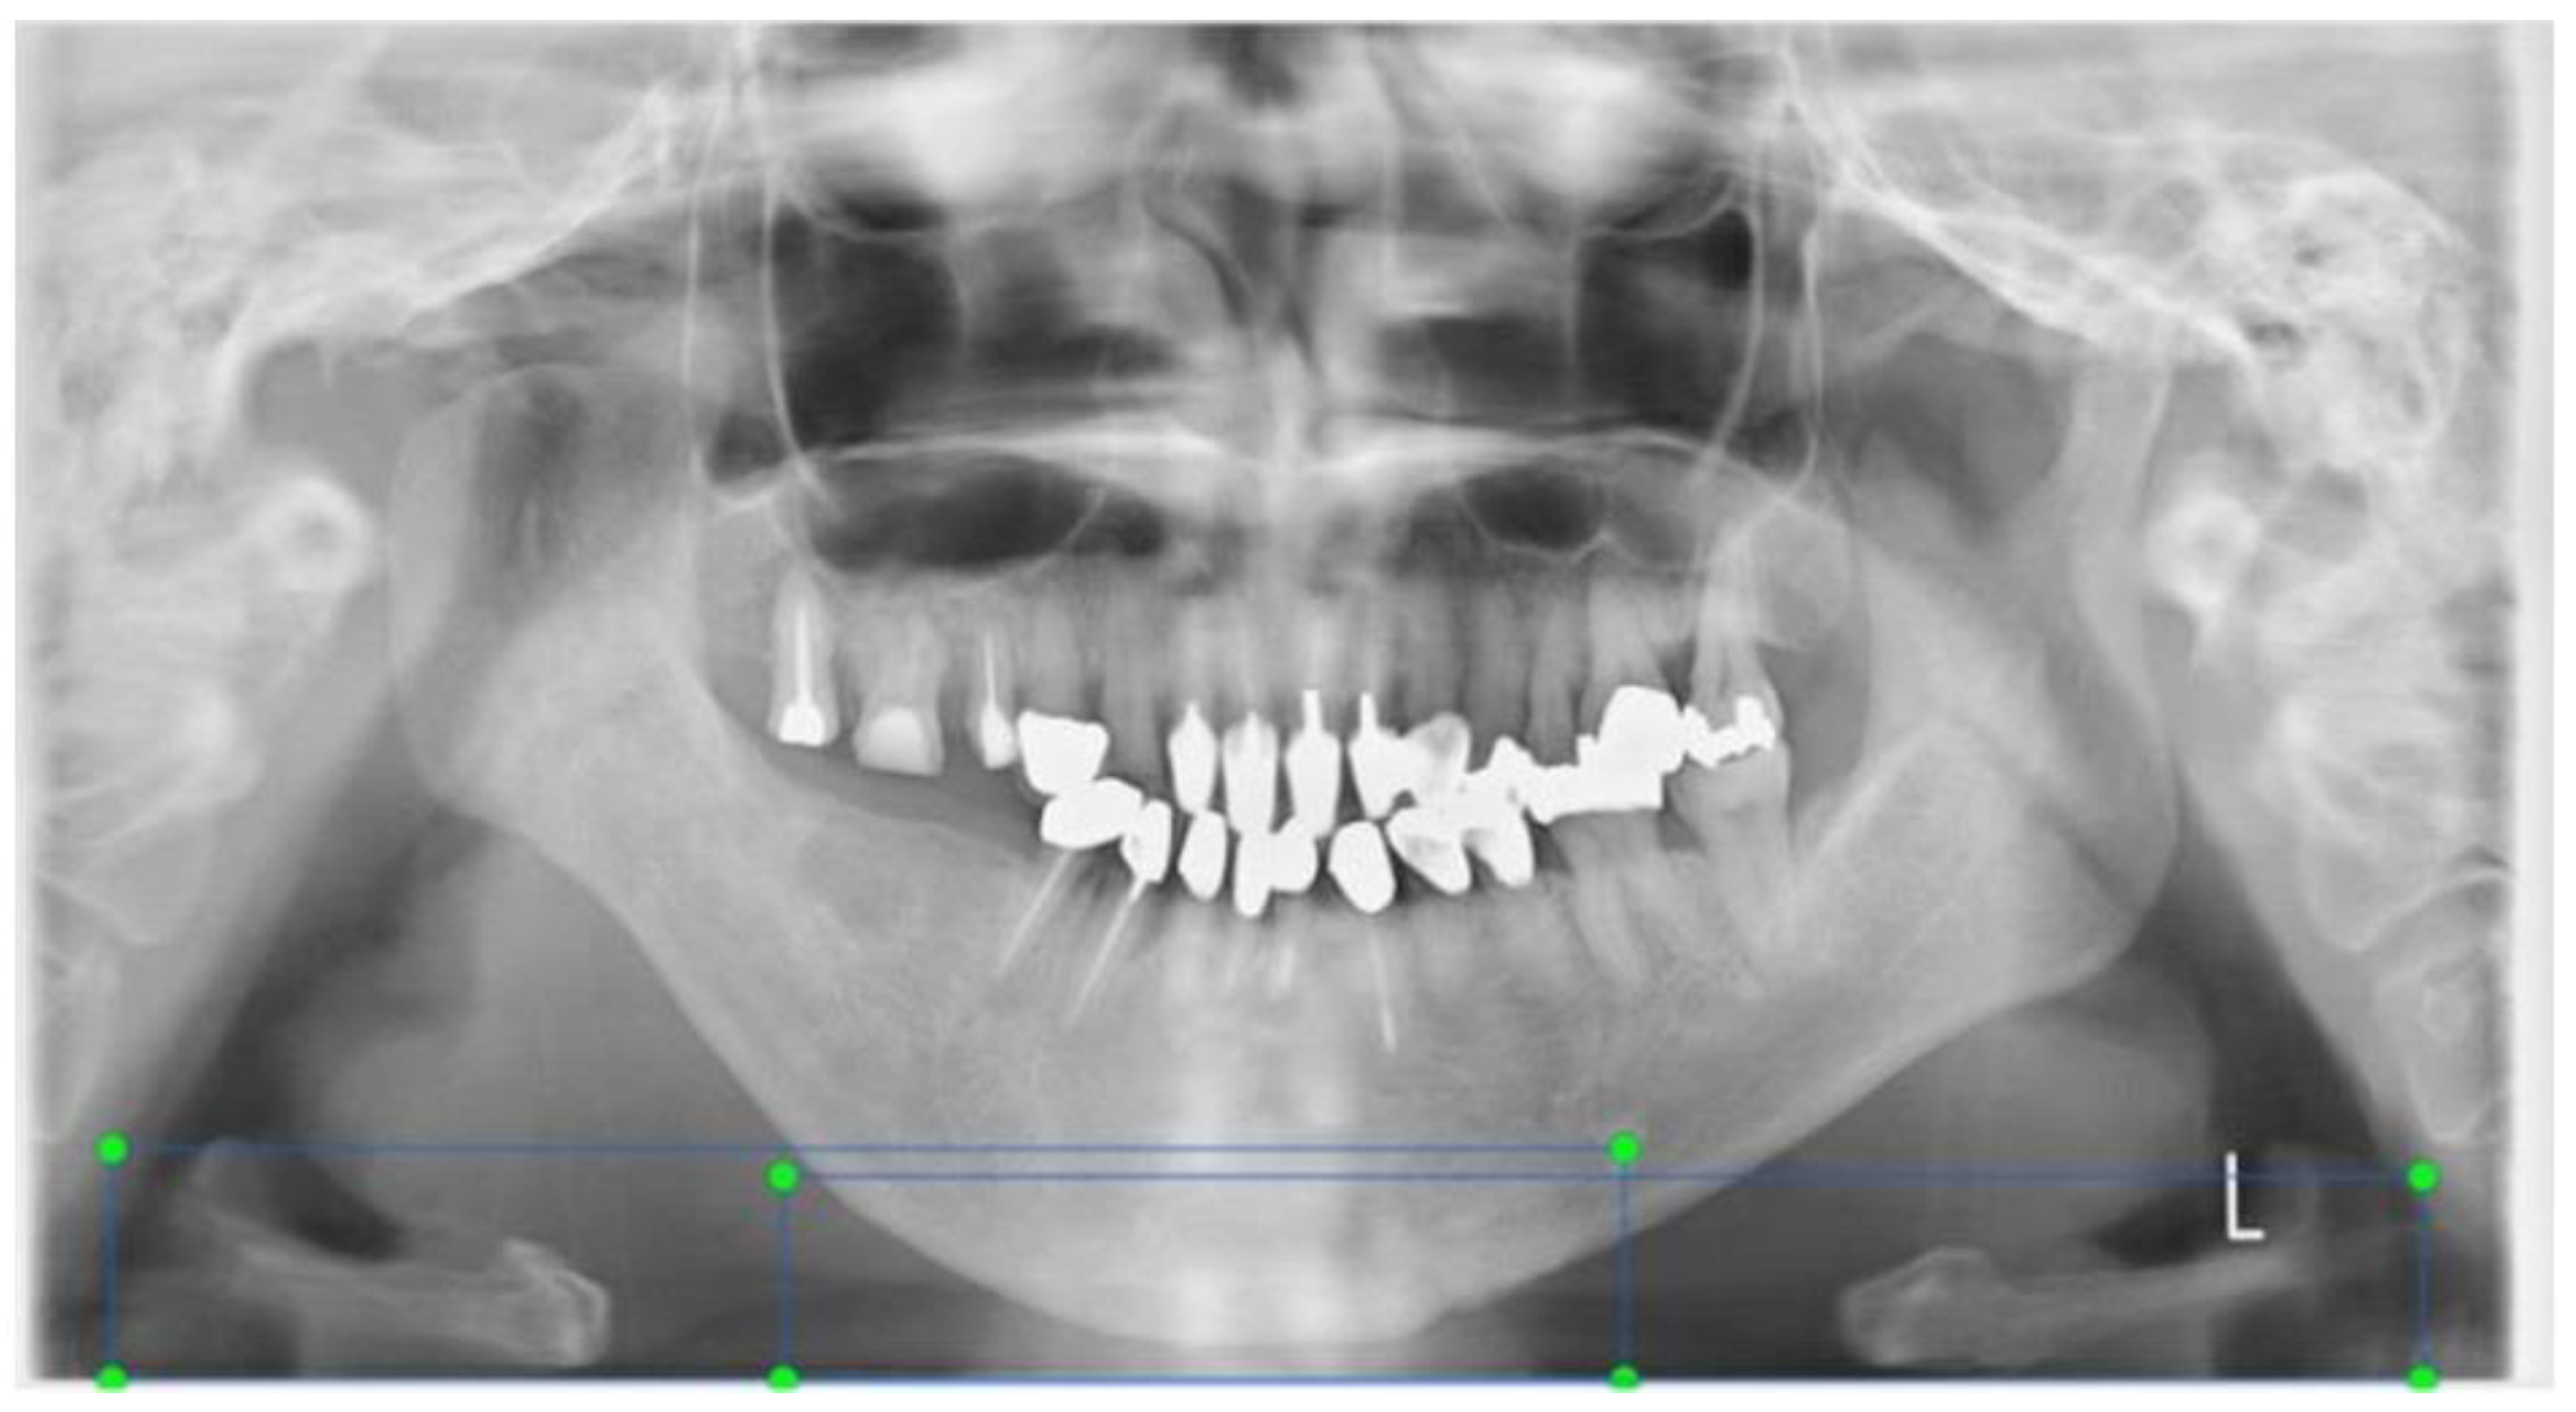
2.1. Acquisition of Panoramic X-ray Images

Panoramic radiographs of 915 patients aged 20 to 95, who visited our university—specifically, the department of Periodontology, Orthodontics, and Oral rehabilitation—from June 2013 to February 2021 and underwent panoramic radiography, were used for AI analysis.
A Hyper-XF radiography machine (Asahi Roentgen Ind. Co., Ltd., Kyoto, Japan) was used. Exposure parameters were set to 78 to 82 kV, 10 mA, and 12 s. Panoramic radiographs were taken as a standardized protocol. During the panoramic radiograph, the patient bit down on a cotton roll to prevent infection. The patients were also instructed to relax their tongues. The excluded objects that hyoid bone moved during the exposure. Patients with clear suspicion of jaw deformity or tumor based on the images were excluded. The image quality of panoramic radiograph was assessed by Izetti et al. [19]. Synmetry, inclination of the occlusal plane, localization of mandibular condyles, aspect of upper teeth root apexes, and position of the cervical spine were assessed.
The pixel size of the panoramic radiograph was 1976 × 976.

2.2. Ethical Statement

All subjects gave their informed consent for inclusion before they participated in the study. The study was conducted in accordance with the Declaration of Helsinki, and the protocol was approved by the Ethics Committee of Showa University (SUDH0034).

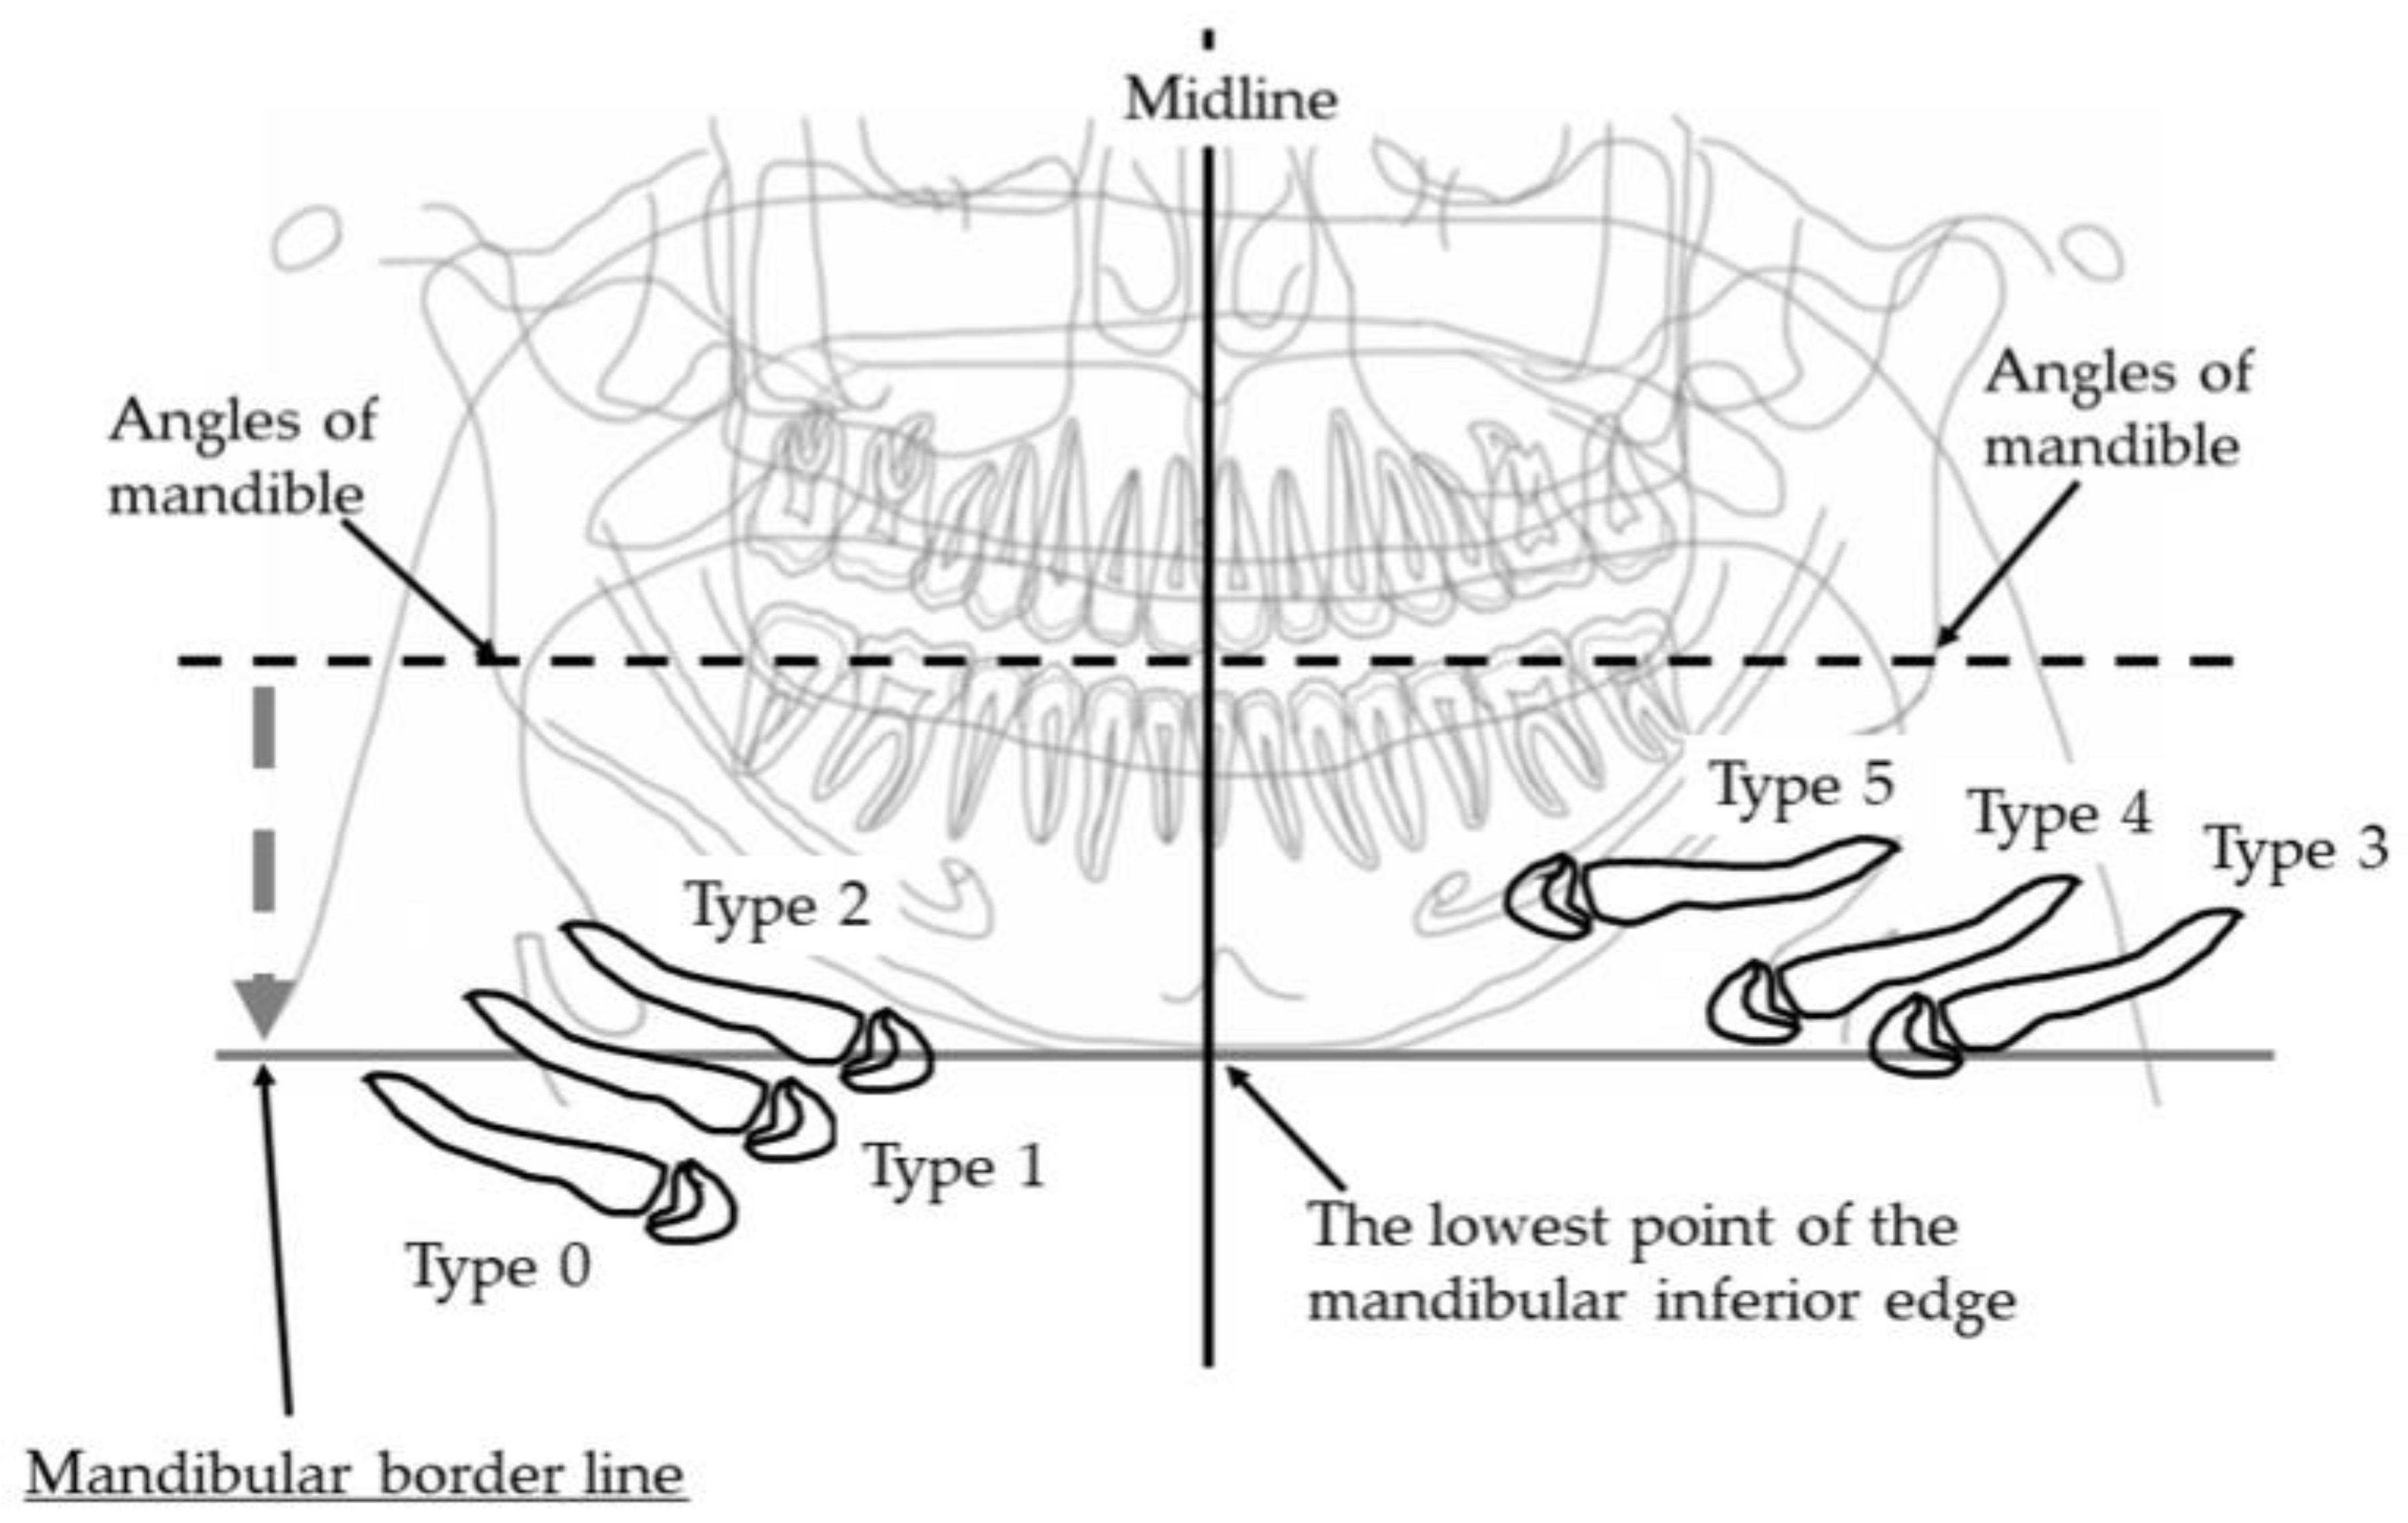
2.3. Vertical Position Classification of the Hyoid Bone

The vertical position of the hyoid bone was classified into 6 types based on the classification method described in our previous paper [3]. Figure 1 shows the shame of the hyoid bone position which was cited from our previous paper [3].
Two landmarks were defined as follows:
  • The bilateral mandible line: A simulated line connecting the right and left sides of the angles of the mandible.
  • The mandibular border line: The line that moved the bilateral mandibular line parallel to the lowest point of the lower border of the mandible.
An evaluation was conducted of to what extent the hyoid bone body and large angle appeared in the upper area from the mandibular border line. The following six groups were categorized:
Type 0: The hyoid bone could not be observed in the upper area from the mandibular border line;
Type 1: Only the greater horn was observed in the upper area from the mandibular border line;
Type 2: A piece of the hyoid body was observed in the upper area from the mandibular border line;
Type 3: Half of the hyoid body was observed in the upper area from the mandibular border line;
Type 4: All of the hyoid body was observed in the upper area from the mandibular border line;
Type 5: The hyoid body overlapped with the mandible bone.
On the right and left sides, if the vertical position of the hyoid bone was different, the lower position side was recorded.
Evaluations were carried out by a dental radiologist (Y.M.) with 37 years of experience and another (E.I.) with 3 years of experience. When the ratings of these two radiologists differed, they reviewed the images together to reach a consensus.
Since the hyoid bone can be seen on both the left and right sides of a panoramic X-ray image, the positions of the left and right hyoid bones were evaluated. As a result, a total of 1830 hyoid bone sites in 915 images were evaluated. Table 1 shows the number of cases by type.

2.4. Convolutional Neural Network Selection

In this study, we used YOLOv5, a deep learning method for object detection, to extract the vertical position of the hyoid bone from panoramic radiographs and develop a learning model that predicts the risk of dysphagia.

Annotations

We annotated the data used for learning; specifically, the correct label and coordinate information of the object were added as annotations.
When providing coordinate information for the image, we specified the mentum in addition to the hyoid bone as the coordinates of the target object so that learning included the positional relationship between the hyoid bone and the virtual line, which is the standard for type classification.
Next, in order to improve learning accuracy, we expanded the amount of data. As an expansion method, the number of data was doubled by performing left–right reversal processing. Coordinate information was also reversed and specified for certainty.
When providing the coordinate information, the hyoid bone area was set from the mentum to the edge of the projected image so that it would have roughly the same area as the other types. Figure 2 shows an image with coordinate information on both sides.

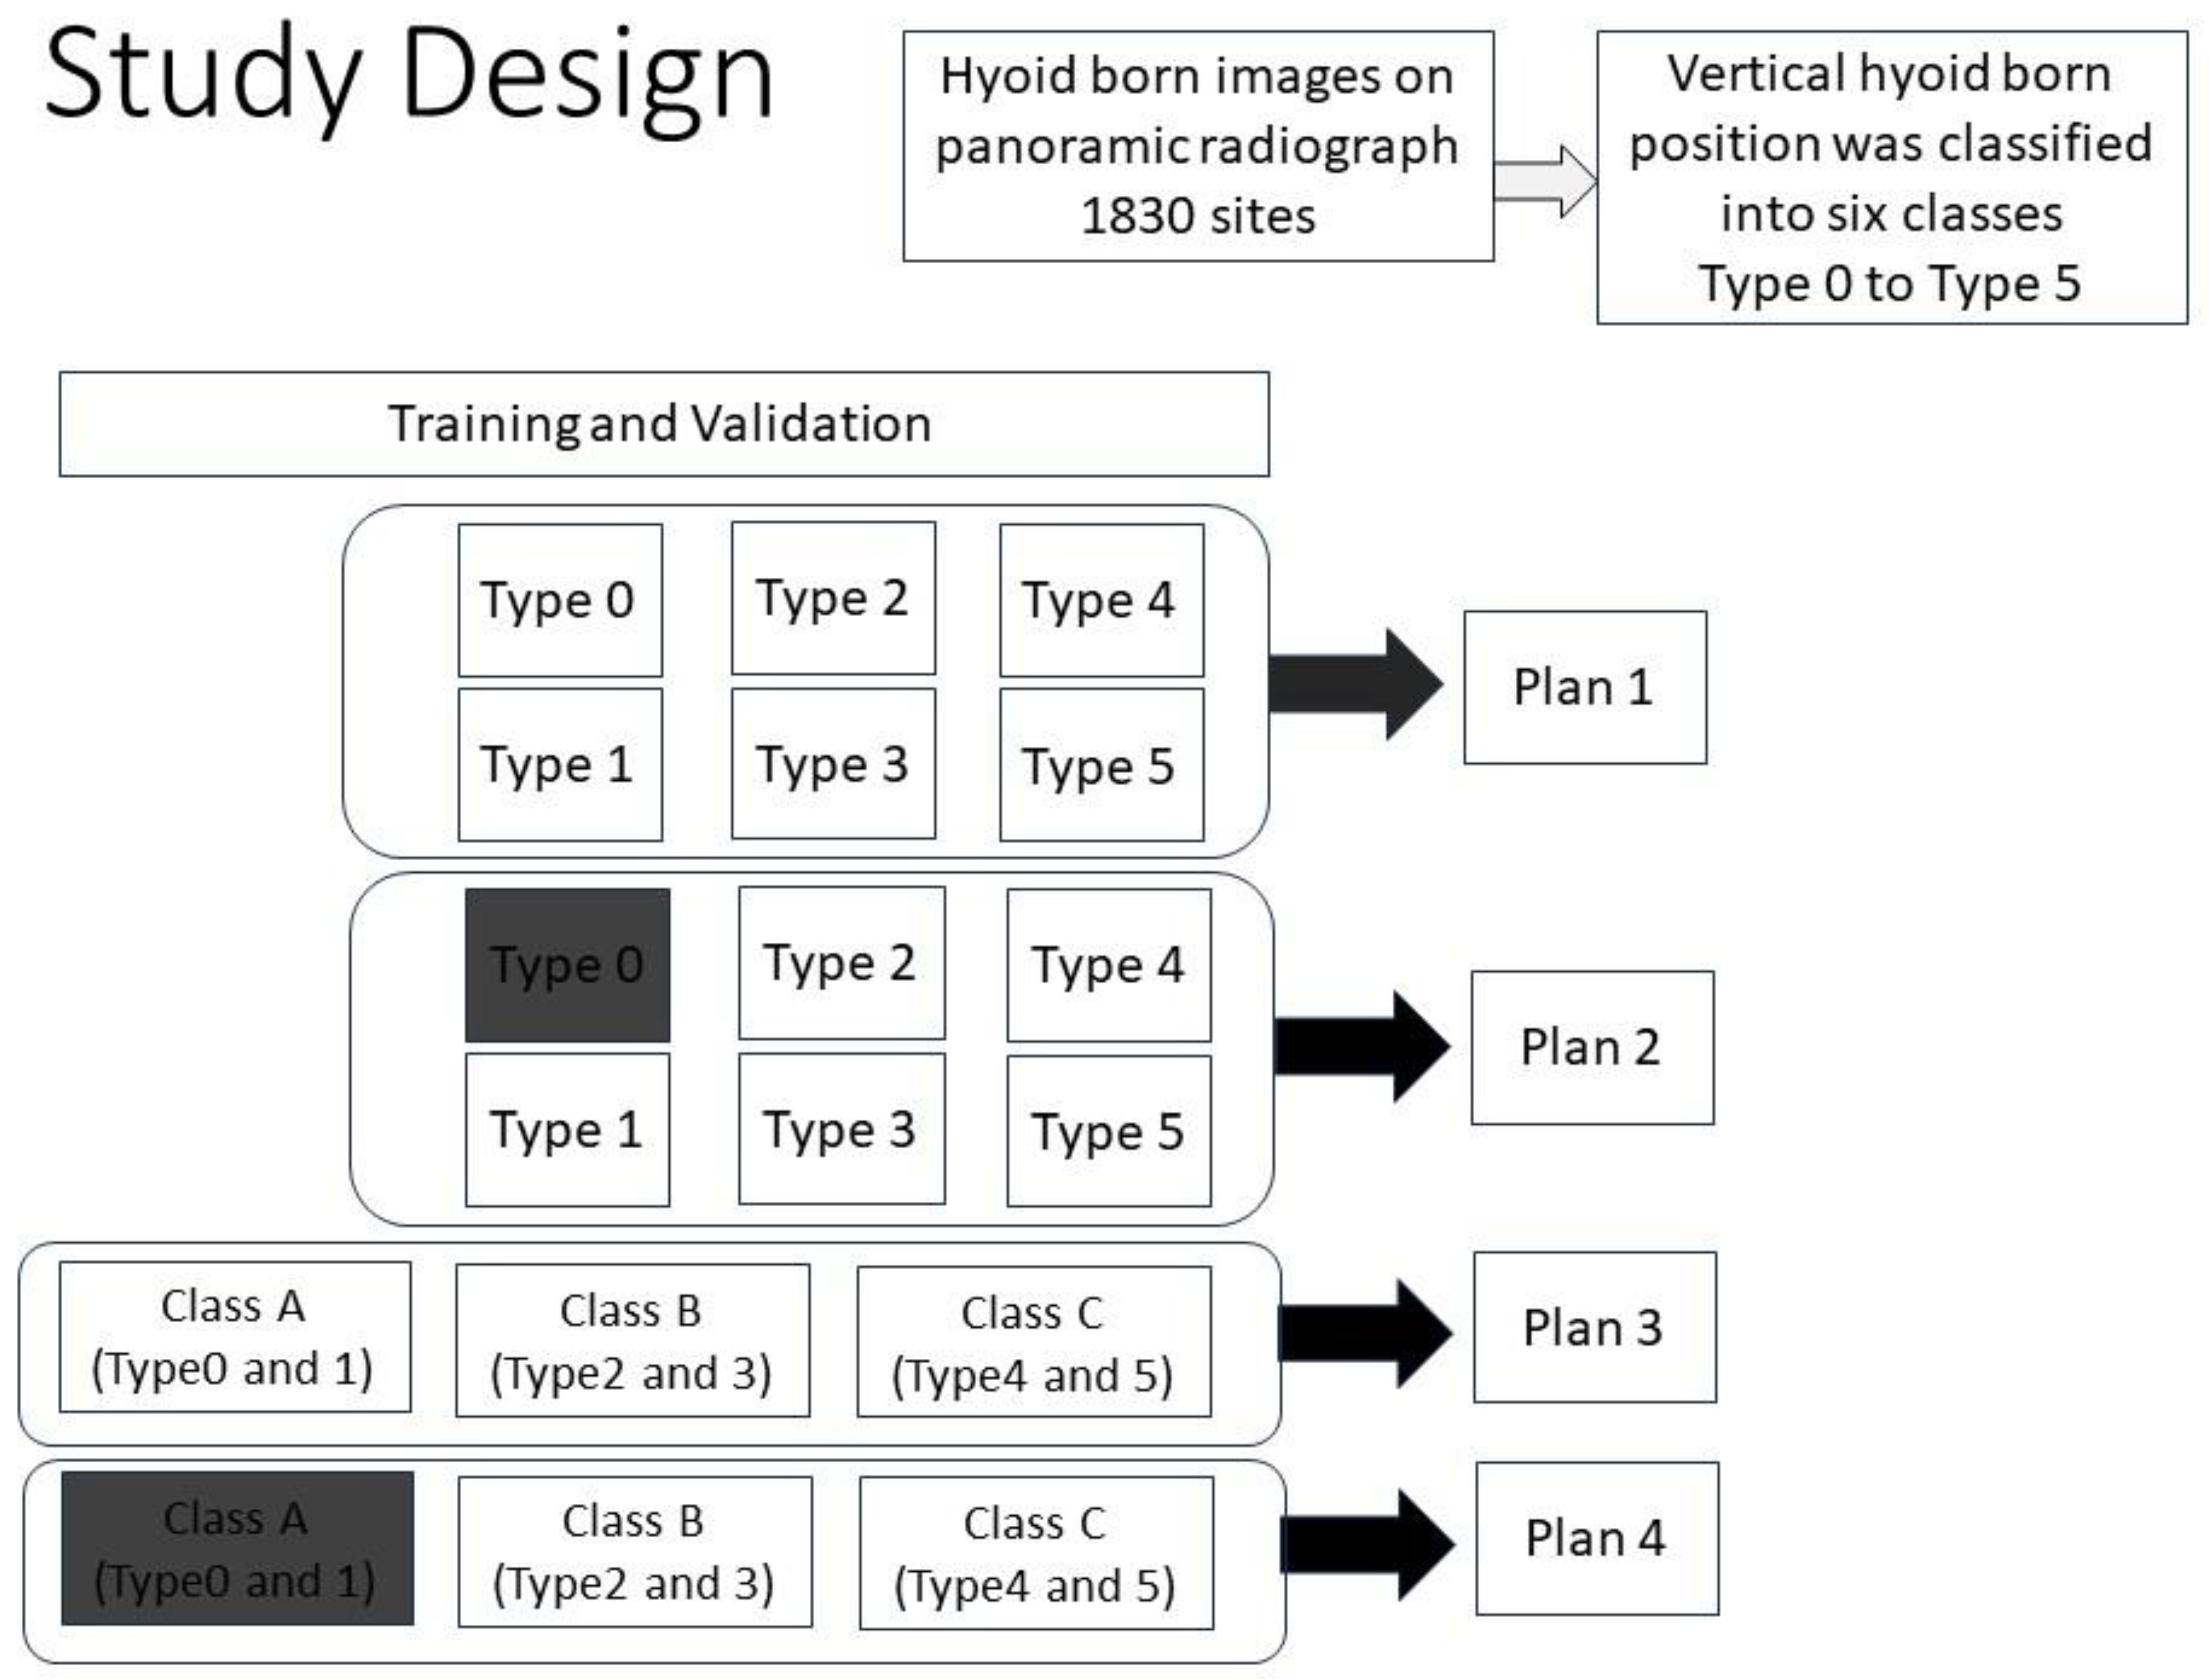
2.5. Learning Method

The number of groupings and the number of learning groups are shown in Figure 3. The following four learning methods were used:
  • Plan 1 (study of 6 types).
Each of the 6 types from Types 0 to 5 were trained and evaluated.
  • Plan 2 (study of 5 types).
Type 0 was considered difficult to learn because the hyoid bone was not visible, so it was excluded, and the 5 types from Type 1 to 5 were learned and evaluated.
This learning model was set to determine Type 0 when the hyoid bone was not detected.
  • Plan 3 (study of 3 Classes)
Types 0 and 1 were combined into one group and designated as Class A. Similarly, Types 2 and 3 were grouped together to form Class B, and Types 4 and 5 were grouped to form Class C.
These three groups were trained and evaluated.
  • Plan 4 (study of 2 Classes)
Class A (Types 0 and 1), was not learned because Type 0 and Type 1 were difficult to learn since the hyoid bone was not observed or partially visible.
The remaining two groups, i.e., Class B and Class C, were learned. There were thus two groups of learning data: Class B (Types 2 and 3) and Class C (Types 4 and 5).
This learning model was set to determine Class A when the hyoid bone was not detected.

2.6. Cross Validation

In this study, we performed cross validation. Table 2 shows the number of training sets, validation sets, and test sets for each plan. The learning parameter, the number of epochs, was set to 100, and the batch size was set to 2. Confidence interval was examined under various conditions, and the value with the highest average F value was adopted.

2.7. Evaluation

In this study, recall, precision, F-values, and accuracy were calculated as the evaluation values of the learning model. Recall expresses the proportion of predicted positives that were positive. The calculation formula may be expressed as follows:
  • Recall (true positive rate, TPR) = TP/(TP + FN).
  • Precision = TP/(TP + FP).
  • Accuracy = (TP + TN)/(TP + FP + TN + FN).
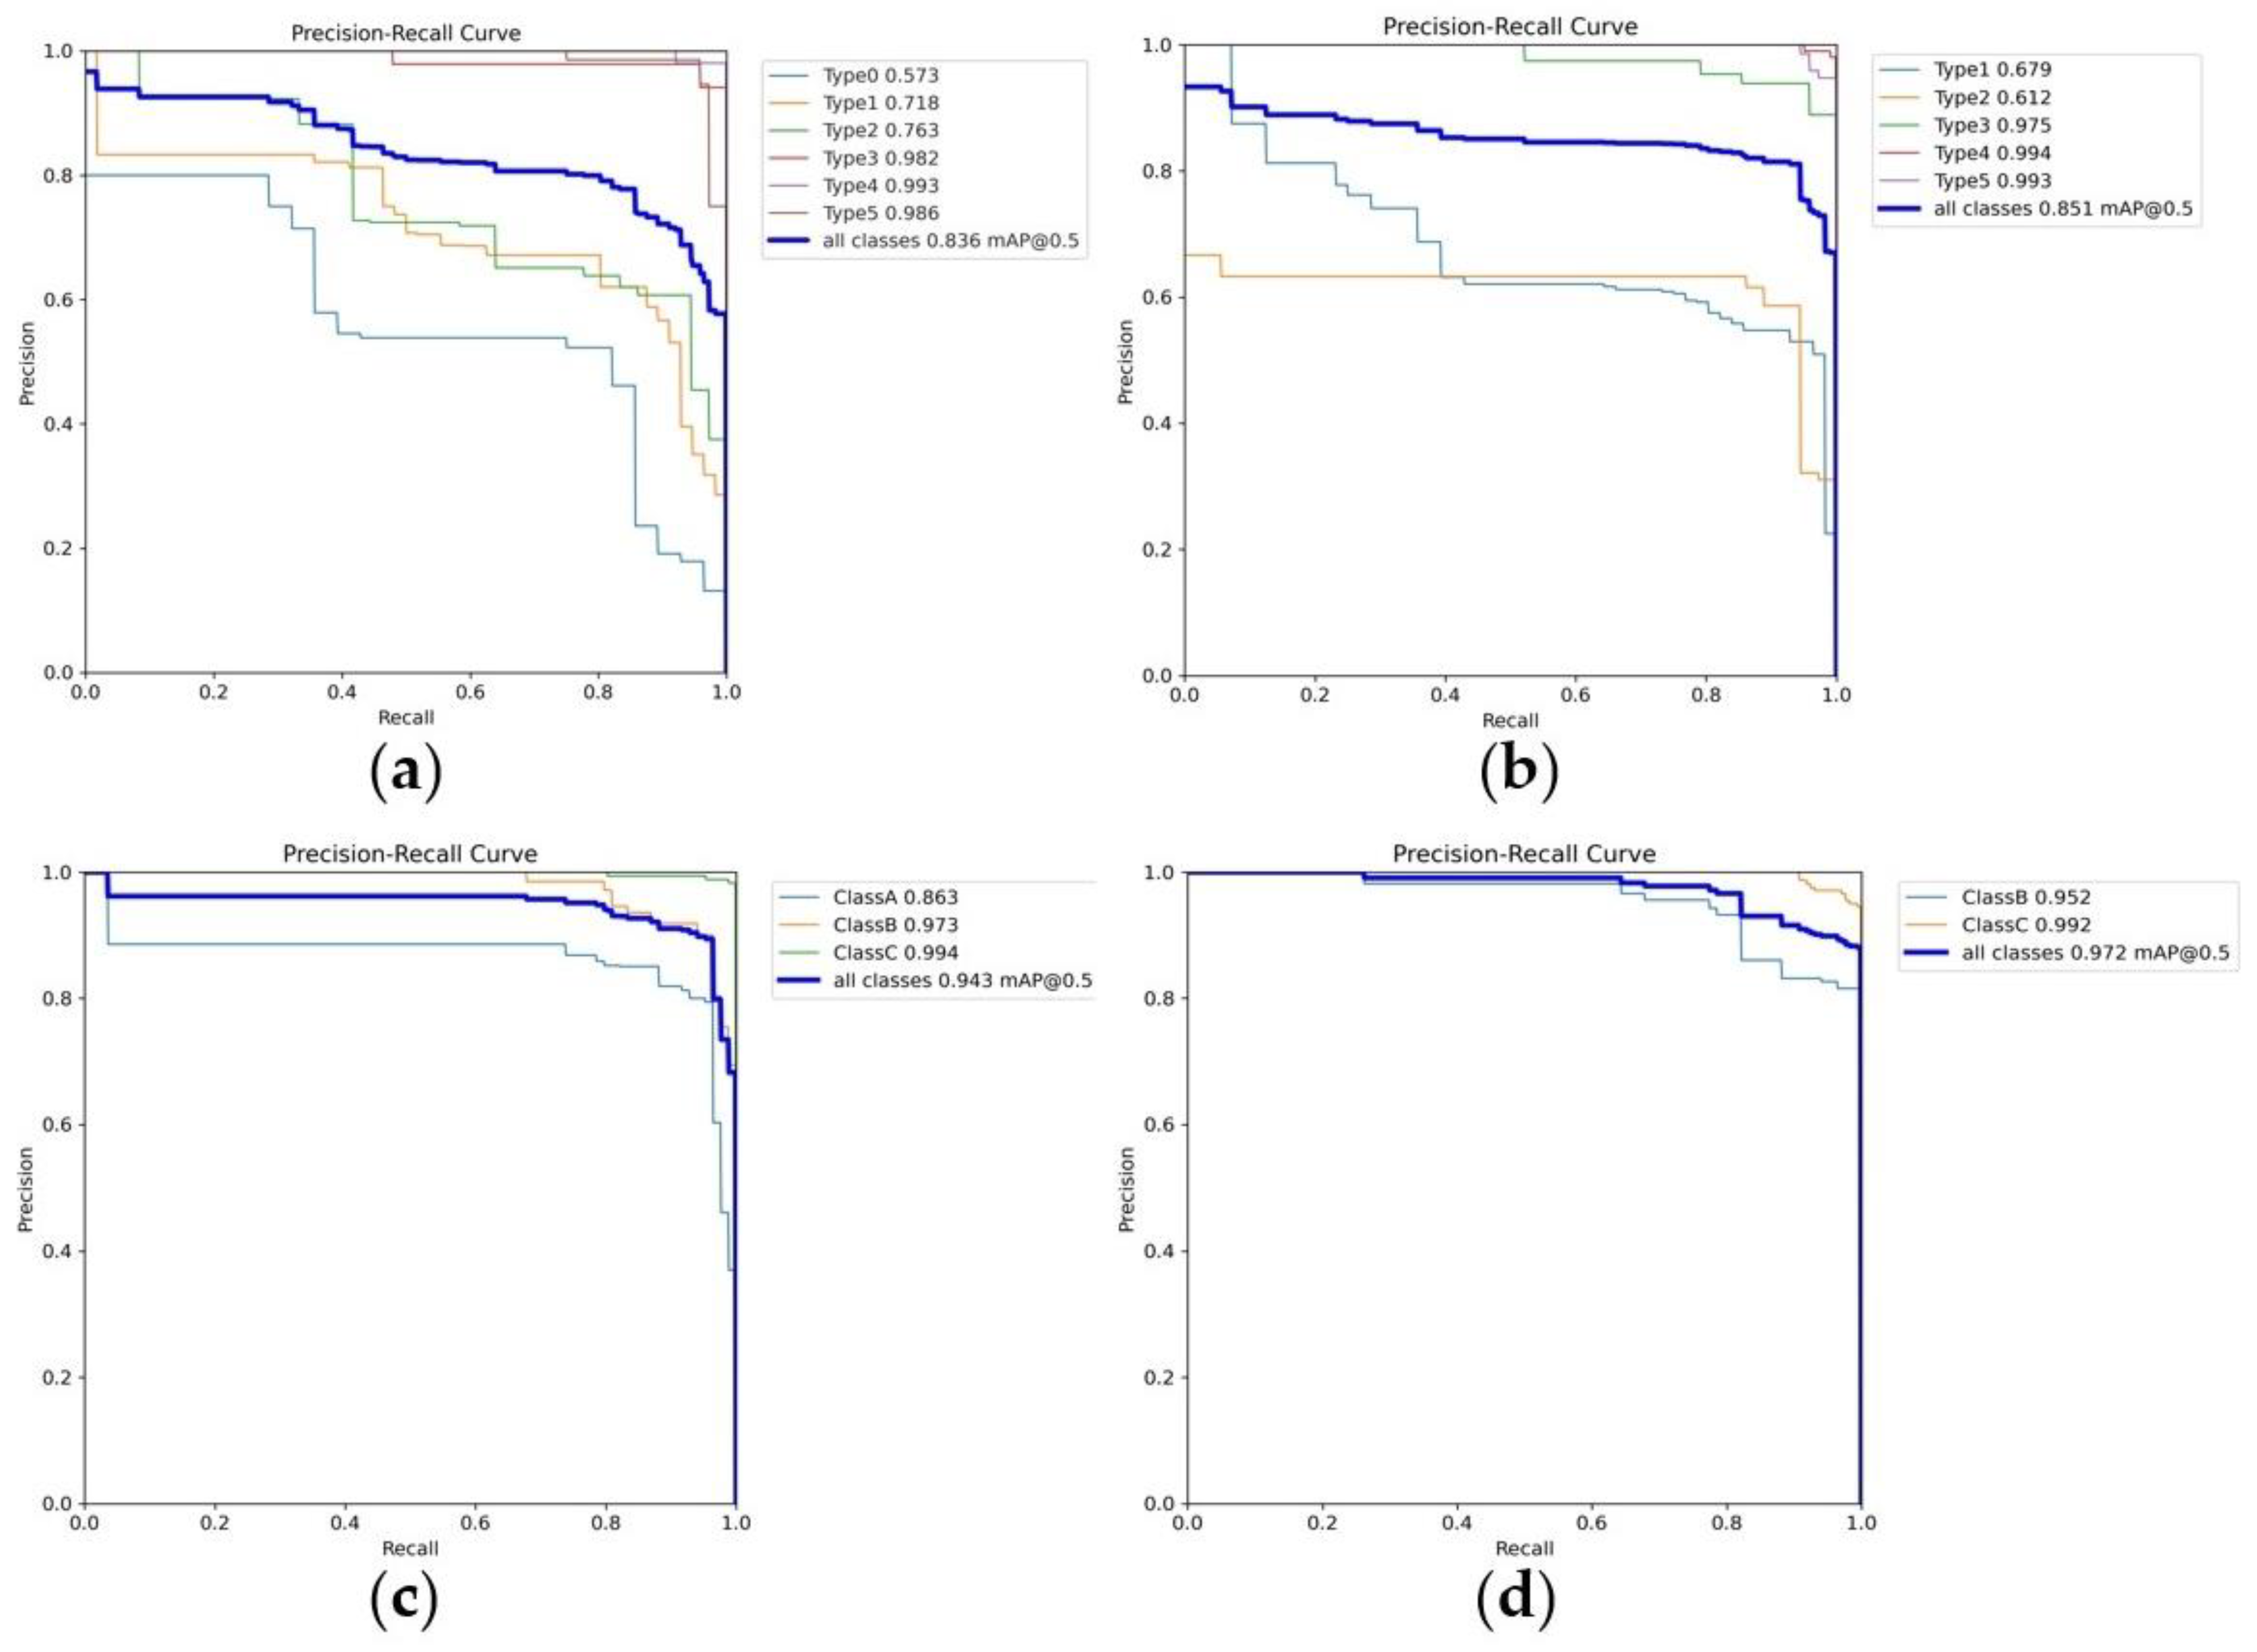
  • PR-AUC (area under the precision–recall curve) was plotted for evaluation of the classification ability, and the AUC values under the PR curve were calculated. The AUC of a random model was 0.5, and the predictive ability/diagnostic ability was judged based on the AUC value, as follows:
AUC value of 0.9 or higher: high accuracy.
AUC values above 0.7 and below 0.9: moderate accuracy.
AUC value greater than or equal to 0.5 and less than 0.7: low accuracy.

3. Results

3.1. PR Curves and AUC Values

Figure 4 shows the PR curves and AUC values for each plan. Plan 2, which did not include Type 0 in learning, had a higher average AUC value than Plan 1, which included Type 0 in learning.
Plan 3 and 4 was evaluated with fewer classes than Plans 1 and 2. Plan 3 which was learned with all classes, had a better average AUC value than Plan 1 and 2. Plan 3 had an average AUC value was 0.9.
Plan 4, which was learned without Class A, had a higher average AUC value than Plan 3, which was learned with Class A included. Plans 1 and 2 both had an average AUC value of less than 0.9, and the lowest AUC values for each group were 0.57 and 0.61, respectively.
On the other hand, Plans 3 and 4 both had an average AUC value greater than 0.9. In addition, the lowest AUC values for each group were 0.86 and 0.95, respectively.

3.2. Precision, Recall, F-Values, and Accuracy

Table 3 shows the evaluation values for precision, recall, F-values, and accuracy. Comparing Plans 1 and 2, the precision and recall values of Type 0 were higher in Plan 2 than in Plan 1. In the evaluation of the six types of Plan 1, the recall values of Types 1 and 2 were lower than those of the other types. Comparing Plans 3 and 4, the precision values for Class A (Types 0 and 1) were higher in Plan 4 than in Plan 3.
Plans 3 and 4, which reduced the number of groupings, had higher precision and recall values than Plans 1 and 2. The highest accuracy value of 0.93 was achieved by Plan 4.

4. Discussion

4.1. Hyoid Bone Detection

In our previous study, we concluded that the 43 patients diagnosed with dysphagia, 28 patients had either Type 0 or Type 1 hyoid bone position. We found that dysphagia was observed when the hyoid bone was positioned below the mandibular border line [2]. However, the hyoid bone is an anatomical structure that has received little attention in the literature concerning panoramic radiographs. In light of this result, in the present study, we aimed to detect the position of the hyoid bone on panoramic radiographs using AI.
In particular, we found that suspected cases of dysphagia in which the hyoid bone was not visible or only partially visible could be accurately assessed.

4.2. Regarding Research Plan Setting Conditions

In Type 0, the position of the hyoid bone could not be learned because the hyoid bone was barely visualized. or only part of it could be seen. Plans 1 and 2 were examined in order to examine how much the learning outcome would change by excluding the group that could not be learned.
Plans 3 and 4 were designed to reduce the number of classifications, and plan 4 to examine how much learning outcomes would change by excluding groups in which the hyoid bone was not completely visible or only partially visible.

4.2.1. Plan 1: Learning the Position of the Hyoid Bone in Six Groups

The precision value of Plan 1 showed the lowest average value of 0.68. If there were too many groupings, or if the hyoid bone was positioned too low, the hyoid bone appeared to be partially missing. In addition, calcification of the thyroid cartilage and of the carotid artery were included in the diagnosis area, so there was a high possibility of erroneous recognition.

4.2.2. Plan 2: Learning the Position of the Hyoid Bone in Five Groups

Compared to Plan 1, precision and recall values for Type 0 improved from 0.47 to 0.87, and from 0.69 to 0.80, respectively. Accuracy also improved from 0.68 to 0.76.
However, the average precision and recall values were 0.68 vs. 0.70, and 0.62 vs. 0.69, respectively, indicating no significant improvement.

4.2.3. On Reducing Grouping

Compared to Plan 2, in Plans 3 and 4, where classes of two types were learned, average precision values were higher, at 0.90 and 0.86, respectively, and average recall values were also higher, at 0.83 and 0.87, respectively. As one of the methods for improving diagnostic accuracy, it may be suggested that when evaluating the degree of visibility of anatomical structures, it is possible to improve the learning effect by not dividing into many groups.
We reduced the number of learning groups by combining them, and by not learning groups that were difficult to detect. Hence, we were able to obtain a high diagnostic performance. Depending on the number of categories to be classified and the maximum number of objects to be found in an image, the number of detected results increased, adding to the processing load and possibly reducing the accuracy.
This may be because, in supervised learning, by reducing the number of groupings, it becomes easier to perform clustering, among others, and diagnostic accuracy can therefore be improved.
Regarding the number of groupings, a previous paper by Okazaki et al. [12] may be recalled. These authors investigated whether abnormal images of different teeth could be correctly diagnosed; however, the targets of this study were single supernumerary teeth and odontomas. Concerning the hyoid bone, the same structure was reviewed by Park et al. [16] for the purpose of implant detection. They studied classifying various types of dental implant systems (DISs) using a large-scale multicenter dataset in panoramic X-ray and intraoral images. They found no significant difference between the results for the two image types, and concluded that high precision could be obtained for both.
In this study, we investigated differences in the position of the hyoid bone, but we were able to obtain good results by reducing the number of groups rather than increasing them. This may be due to the increased number of cases per group.

4.3. Recognition of Missing Images

In the case of a simple shape, such as an implant body, AI may be able to provide a diagnosis even if part of the image is missing. However, in the case of a U-shaped feature such as the hyoid bone, only a small part is within the region of interest. Even if it is included, it may be quite difficult to recognize it as a hyoid bone. Elmahmudi and Ugail [20] reported learning by dividing a face, so that if only half of the face was captured, it could be individually recognized as a face. Using this method, the identification rate of recognizing half of the hyoid bone as the hyoid bone may increase.

4.4. Limitations of This Study

There is a method of measuring the position of the hyoid bone relative to the lower border of the mandible in analysis using lateral cephalometric radiographs, and we have also used this measurement method in our previous research [3]. However, there were no papers that analyzed the position of the hyoid bone in panoramic X-ray photographs. We consider this point to be a limitation of our research.

4.5. About the AI Program

AI learning in the medical field is mainly evaluated using a method called the convolutional neural network (CNN), specifically, object detection by deep learning with CNN. Object detection methods include R-CNN and YOLO. In the case of R-CNN, methods such as Faster R-CNN, Mask-RCNN and Cascade R-CNN have been developed. Studies on panoramic X-ray diagnosis using R-CNN include that of Li et al. [15], for the extraction of cervical vertebrae.
Disadvantages of R-CNN include slow processing times and large memory consumption. The reason for this is that it is necessary to trace thousands of anatomical structures of interest or manually select regions containing the anatomical structures one by one. After that, it is necessary to repeat the steps of convolution and pooling for each of them.
Yilmaz et al. [5] compared the performance of YOLO and R-CNN with respect to object detection in panoramic radiography diagnosis. They examined the accuracy and speed of tooth detection on panoramic radiographs and found that the YOLOv4 method was superior to the Faster R-CNN method in terms of predicting tooth detection, the speed of detection, and detection of impacted teeth. They concluded that the YOLOv4 method outperformed the Faster R-CNN method in terms of the accuracy of tooth prediction, the speed of detection, and the ability to detect impacted and erupted third molars.
In the present study, we used YOLO, which is one of the more widely used object detection methods. Among object detection algorithms, YOLO is notable for its very high processing speed. YOLO’s object recognition method divides the entire image into square grids in advance, and judges whether the target object is included in each grid. In addition, because bounding-box setting and analysis are performed simultaneously, the analysis speed is greatly improved. As a result, we believe that high-speed real-time object detection will be possible. In addition, false detection, in which an object is recognized from a blank background, is reduced to a considerable degree. YOLO is license-free and can be used commercially; in addition, YOLOv5 runs in Python and can be easily learned from researchers’ own datasets.
In present study, Type 4, in which the entire hyoid bone was visible, had a large number of cases, but all the plans in our study exhibited high precision and recall values. This is probably because anatomical structures rarely overlap and are relatively easy to find, but it is also thought that this shows the characteristics of learning via YOLO. On the other hand, when only a part of the hyoid bone could be seen, as in Type 1, or when it could not be seen at all, as in Type 0, it is possible that the learning made detection difficult.

5. Conclusions

The vertical hyoid bone position is important for the risk of dysphagia. In usually, dentist do not to focus to this position. In this study, we could create the AI program for the automatic detection of the position of the hyoid bone by reducing the number of classes and increasing the number of cases in each class, and by not learning cases where the hyoid bone is not visible or only partially visible.
In the future, we would like to create a program that can automatically alert users when the hyoid bone is in a low position.

Author Contributions

Conceptualization, Y.M. and Y.H.; methodology, Y.M. and W.N.; software, W.N.; validation, W.N.; formal analysis, Y.M. and E.I.; investigation, M.K.; resources, K.A.; data curation, W.N.; writing—original draft preparation, Y.M.; writing—review and editing, Y.M.; visualization, Y.M.; supervision, Y.M.; project administration, Y.M.; funding acquisition, Y.M. All authors have read and agreed to the published version of the manuscript.

Funding

This research was supported by JSPS KAKENHI, grant number 20K10169.

Institutional Review Board Statement

The study was conducted in accordance with the Declaration of Helsinki, and approved by the Ethics Committee of Showa University Dental Hospital (approval number: SUDH0034, 25 May 2020).

Informed Consent Statement

This study was a retrospective study, and thus informed consent was not applicable.

Data Availability Statement

Not applicable.

Acknowledgments

We are grateful to Yuma Hanada for their support of this study.

Conflicts of Interest

The authors declare no conflict of interest.

References

  1. Kuroda, M.; Matsuda, Y.; Ito, E.; Araki, K. Potential of Panoramic Radiography as a Screening Method for Oral Hypofunction in the Evaluation of Hyoid Bone Position. Showa Univ. J. Med. Sci. 2019, 31, 227–235. [Google Scholar] [CrossRef]
  2. Ito, E.; Matsuda, Y.; Kuroda, M.; Araki, K. A novel dysphagia screening method using panoramic radiography. Showa Univ. J. Med. Sci. 2021, 33, 74–81. [Google Scholar] [CrossRef]
  3. Matsuda, Y.; Ito, E.; Kuroda, M.; Araki, K. A Basic Study for Predicting Dysphagia in Panoramic X-ray Images Using Artificial Intelligence (AI)—Part 1: Determining Evaluation Factors and Cutoff Levels. Int. J. Environ. Res. Public Health 2022, 19, 4529. [Google Scholar] [CrossRef] [PubMed]
  4. Kabir, T.; Lee, C.-T.; Chen, L.; Jiang, X.; Shams, S. A comprehensive artificial intelligence framework for dental diagnosis and charting. BMC Oral Health 2022, 22, 480. [Google Scholar] [CrossRef] [PubMed]
  5. Yilmaz, S.; Tasyurek, M.; Amuk, M.; Celik, M.; Canger, E.M. Developing deep learning methods for classification of teeth in dental panoramic radiography. Oral Surg. Oral Med. Oral Pathol. Oral Radiol. 2023. epub ahead of print. [Google Scholar] [CrossRef] [PubMed]
  6. Lee, J.-H.; Han, S.-S.; Kim, Y.H.; Lee, C.; Kim, I. Application of a fully deep convolutional neural network to the automation of tooth segmentation on panoramic radiographs. Oral Surg. Oral Med. Oral Pathol. Oral Radiol. 2020, 129, 635–642. [Google Scholar] [CrossRef] [PubMed]
  7. Shafi, I.; Sajad, M.; Fatima, A.; Aray, D.G.; Lipari, V.; Diez, I.D.L.T.; Ashraf, I. Teeth Lesion Detection Using Deep Learning and the Internet of Things Post-COVID-19. Sensors 2023, 23, 6837. [Google Scholar] [CrossRef] [PubMed]
  8. Fatima, A.; Shafi, I.; Afzal, H.; Mahmood, K.; Díez, I.D.L.T.; Lipari, V.; Ballester, J.B.; Ashraf, I. Deep Learning-Based Multiclass Instance Segmentation for Dental Lesion Detection. Healthcare 2023, 11, 347. [Google Scholar] [CrossRef] [PubMed]
  9. Mao, Y.-C.; Huang, Y.-C.; Chen, T.-Y.; Li, K.-C.; Lin, Y.-J.; Liu, Y.-L.; Yan, H.-R.; Yang, Y.-J.; Chen, C.-A.; Chen, S.-L.; et al. Deep Learning for Dental Diagnosis: A Novel Approach to Furcation Involvement Detection on Periapical Radiographs. Bioengineering 2023, 10, 802. [Google Scholar] [CrossRef] [PubMed]
  10. Son, D.-M.; Yoon, Y.-A.; Kwon, H.-J.; An, C.-H.; Lee, S.-H. Automatic Detection of Mandibular Fractures in Panoramic Radiographs Using Deep Learning. Diagnostics 2021, 11, 933. [Google Scholar] [CrossRef] [PubMed]
  11. Ha, E.-G.; Jeon, K.J.; Kim, Y.H.; Kim, J.-Y.; Han, S.-S. Automatic detection of mesiodens on panoramic radiographs using artificial intelligence. Sci. Rep. 2021, 11, 23061. [Google Scholar] [CrossRef] [PubMed]
  12. Okazaki, S.; Mine, Y.; Iwamoto, Y.; Urabe, S.; Mitsuhata, C.; Nomura, R.; Kakimoto, N.; Murayama, T. Analysis of the feasibility of using deep learning for multiclass classification of dental anomalies on panoramic radiographs. Dent. Mater. J. 2022, 41, 889–895. [Google Scholar] [CrossRef] [PubMed]
  13. Yang, H.; Jo, E.; Kim, H.J.; Cha, I.-H.; Jung, Y.-S.; Nam, W.; Kim, J.-Y.; Kim, J.-K.; Kim, Y.H.; Oh, T.G.; et al. Deep Learning for Automated Detection of Cyst and Tumors of the Jaw in Panoramic Radiographs. J. Clin. Med. 2020, 9, 1839. [Google Scholar] [CrossRef] [PubMed]
  14. Tareq, A.; Faisal, M.I.; Islam, M.S.; Rafa, N.S.; Chowdhury, T.; Ahmed, S.; Farook, T.H.; Mohammed, N.; Dudley, J. Visual Diagnostics of Dental Caries through Deep Learning of Non-Standardised Photographs Using a Hybrid YOLO Ensemble and Transfer Learning Model. Int. J. Environ. Res. Public Health 2023, 20, 5351. [Google Scholar] [CrossRef] [PubMed]
  15. Li, H.; Xu, Y.; Lei, Y.; Wang, Q.; Gao, X. Automatic Classification for Sagittal Craniofacial Patterns Based on Different Convolutional Neural Networks. Diagnostics 2022, 12, 1359. [Google Scholar] [CrossRef] [PubMed]
  16. Park, W.-S.; Huh, J.-K.; Lee, J.-H. Automated deep learning for classification of dental implant radiographs using a large multi-center dataset. Sci. Rep. 2023, 13, 4862. [Google Scholar] [CrossRef]
  17. Putra, R.H.; Doi, C.; Yoda, N.; Astuti, E.R.; Sasaki, K. Current applications and development of artificial intelligence for digital dental radiography. Dentomaxillofac. Radiol. 2022, 51, 20210197. [Google Scholar] [CrossRef]
  18. Thurzo, A.; Urbanová, W.; Novák, B.; Czako, L.; Siebert, T.; Stano, P.; Mareková, S.; Fountoulaki, G.; Kosnáčová, H.; Varga, I. Where Is the Artificial Intelligence Applied in Dentistry? Systematic Review and Literature Analysis. Healthcare 2022, 10, 1269. [Google Scholar] [CrossRef] [PubMed]
  19. Izzetti, R.; Nisi, M.; Aringhieri, G.; Crocetti, L.; Graziani, F.; Nardi, C. Basic Knowledge and New Advances in Panoramic Radiography Imaging Techniques: A Narrative Review on What Dentists and Radiologists Should Know. Appl. Sci. 2021, 11, 7858. [Google Scholar] [CrossRef]
  20. Elmahmudi, A.; Ugail, H. Deep face recognition using imperfect facial data. Future Gener. Comput. Syst. 2019, 99, 213–225. [Google Scholar] [CrossRef]
Figure 1. Vertical hyoid bone position. (It was sited from reference [3]). Reprinted/adapted with permission from Ref. [3]. 2022, Yukiko Matsuda.
Eng 04 00145 g001
Figure 2. Annotation image. The rectangular area surrounded by green dots was used as the target area for learning.
Eng 04 00145 g002
Figure 3. Study design.
Eng 04 00145 g003
Figure 4. PR curves and AUC values for each plan: (a) Plan 1, (b) Plan 2, (c) Plan 3, and (d) Plan 4.
Eng 04 00145 g004
Table 1. Numbers of cases for each type of age and gender.
AgeClass 0Class 1Class 2Class 3Class 4Class 5
20–29424221412492
30–39365826509072
40–49609216508866
50–59747224185472
60–69564630223044
70–7940442824364
80–95822252482
Table 2. Number of cases assigned to the training, validation, and test sets of the four plans: (a) Plan 1, (b) Plan 2, (c) Plan 3, (d) Plan4.
(a) Plan 1
Type 0Type 1Type 2Type 3Type 4Type 5
Training set222240114154324244
Validation set143018245036
Test set426836489670
 
(b)Plan 2
Type 0Type 1Type 2Type 3Type 4Type 5
Training set-240114154324244
Validation set-3018245036
Test set2786836489670
 
(c)Plan 3
Class AClass BClass C
Training set462268524
Validation set4442130
Test set11084166
 
(d)Plan 4
Class AClass BClass C
Training set-268524
Validation set-42130
Test set61684166
Table 3. Evaluation values for precision, recall, F-values, and accuracy.
ModelClassificationPrecisionRecallF-ScoreAccuracy
Plan 1 Type 00.430.690.53
Type 10.580.460.51
Type 20.390.360.38
Type 30.770.420.54
Type 40.900.930.91
Type 51.000.890.94
Average (overall)0.680.620.640.68
Plan 2Type 00.870.800.83
Type 10.420.660.52
Type 20.460.500.48
Type 30.680.480.56
Type 40.870.890.88
Type 50.920.810.86
Average (overall)0.700.690.690.76
Plan 3Class A (Types 0 and 1)0.810.950.87
Class B (Types 2 and 3)0.930.620.74
Class C (Types 4 and 5)0.950.930.94
Average (overall)0.900.830.850.86
Plan 4Class A (Types 0 and 1)0.970.950.96
Class B (Types 2 and 3)0.660.710.69
Class C (Types 4 and 5)0.950.950.95
Average (overall)0.860.870.870.93
Disclaimer/Publisher’s Note: The statements, opinions and data contained in all publications are solely those of the individual author(s) and contributor(s) and not of MDPI and/or the editor(s). MDPI and/or the editor(s) disclaim responsibility for any injury to people or property resulting from any ideas, methods, instructions or products referred to in the content.

