1. Introduction
Estimation of the potential consequences from events occurring downstream of a dam is part of the risk assessment needed during the installation phase of a new dam. However, another type of analysis is also required, the so-called “emergency calculation”, which should be carried out in case of specific natural or man-made ongoing or prospected events. It may also be important to carry out fast computations that can provide information on the areas at risk either because the original design analyses are not available or because the parameters needed are different.
These “emergency calculation” are needed, for example, during an ongoing tropical cyclone, as a large amount of rainfall can quickly increase the level of the lake upstream of a dam and cause sudden overspilling from the dam with the potential flooding of the areas downstream, or, in the worst case, the complete failure of the dam if it is an earth-filled type. An example of such a failure is the
Laos dam break in 2018. An extensive flood occurred on 23 July 2018 downstream of one of the dams of the Xe-Pian Xe-Namnoy Power Project, in southern Lao People’s Democratic Republic; the flood was due to the partial failure of the dam (Annunziato et al., 2018 [
1]). Yudianto et al., 2020 [
2], described how dam break analyses can be important for the establishment of inundation risk caused by severe meteorological conditions. The
Mosul dam was analyzed because of the risk of intentional bombing and destruction of the dam (Annunziato et al., 2016 [
3]); in this case, the failure luckily did not happen, but great concern was expressed by the United Nations (
https://news.un.org/en/tags/mosul-dam accessed on 23 June 2023), and therefore, dedicated quick analyses were necessary to identify the possible risk and the evacuation needs downstream. Many other examples can be reported where a dam break analysis was performed under strict timeline conditions. The most recent and unfortunately real application was related to the potential effects of a dam break at the Khavokva dam in Ukraine; this analysis was performed by JRC using the NAMI DANCE code in order to assess the travel time of the wave and the expected inundation extent but also to calculate the expected reduction in water level in the flooded areas or the duration of the voiding of the upstream lake due to possible consequences on the cooling system of the Zaporisha Nuclear Power Plant (Annunziato et al., 2022, non-public document). Unfortunately, what was feared did occur on 6 June 2023, and the devastation downstream was relevant. The event is still ongoing at the time of writing.
Such analyses are different from the ones normally performed for the certification of a dam during the dam construction or the dam authorization procedures; in that case, the analysts have sufficient time to prepare and run a case study and carry out risk assessment studies. In the case of “emergency calculations”, the production time is a critical parameter and the analysis has to be produced in the shortest possible time in order to suggest evacuation strategies. If a tropical cyclone is approaching in 2 days, the analysis cannot take more than 1 day to be completed, and this poses a challenge to the analysis. NAMI DANCE can be used to solve this issue.
The typical analysis of a dam break by numerical modeling requires a number of input data and output quantities, which are explained in detail in the following sections. This study aimed to develop a procedure that facilitates the preparation of the input deck and the derivation of the output quantities to allow a fast analysis of a dam break event using a shallow water model, NAMI DANCE, as the analysis tool.
In the numerical analysis of a dam break, the necessary components to be defined to perform the computations are as follows:
Topography of the area.
- ○
The area below the dam has to be characterized and specified in detail in order to be able to describe the inundation. The presence of rivers or lakes downstream could be included but in general, the amount of water displaced is so large that the presence of existing rivers can be neglected as the water will flow on top of the existing rivers.
- ○
The resolution is a trade-off between CPU time and precision in the definition of the output quantities (i.e., the population affected). A resolution of at least 30–50 m is necessary but for some specific cases, as explained in the paper, a higher resolution is necessary to correctly describe the break characteristic.
The lake area upstream of the dam in question.
- ○
The form of the lake upstream of the dam defines, together with the bathymetry of the lake, the amount of water that will be displaced.
The bathymetry of the lake.
- ○
The depth of the water in the lake is important to define the upstream volume. In general, this quantity is unknown. It can be assumed constant, exaggerating the amount of water in the lake, or deduced by the form of valleys around the lake. In general, it is an important unknown in this type of computation.
The characteristics of the timing and length of the break of the dam.
- ○
The size of the break is a major quantity that has to be defined because it has a direct effect on the flooding extent and the height of the inundation. The break opening time may be important only if the timing extends for several hours; otherwise, it is not a major parameter.
The quantities to be computed (main outputs) are generally the following:
The flooding extent (distribution of maximum flow depth along the flow path).
- ○
This is one of the most important quantities because the flooding extent has a direct influence on the affected population and affected construction buildings in the area.
The timing of the flooding (wave travel time).
- ○
The timing of the flooding determines the potential for early warning in case of a catastrophic event. Knowing this time can allow one to plan the evacuation of downstream areas.
The time histories of water elevations at relevant observation points (numerical gauges).
- ○
The timeline of the water elevation allows one to understand what will be the maximum height reached and for how long the water will remain above a certain elevation. Performing very long calculations may also provide information about the need for pumping devices to reduce the water or if, due to the topography, the water will naturally recede in a reasonable time.
The population to be affected in the impacted area.
- ○
The knowledge of the population involved is extremely important for Civil Protection authorities to plan evacuation or relocation strategies.
The building area to be affected by the flood.
- ○
The number of buildings affected by the flood has an impact on the cost of the reconstruction.
The state of the art for dam break analyses is well documented in the literature. One example of a review is by Kumar et al., 2017 [
4], who summarized the strategies of various researchers to tackle this phenomenon. They concluded that “
HEC-RAS is efficient tool which provides more reliable results in dam break study and results obtained from the simulation model can be exported to GIS platform through GeoRAS to prepare the inundation mapping”. HEC-RAS is the code developed by the US Army Corps of Engineers and represents a reference point for all the engineers who work in this field: it allows performing one-dimensional steady flow calculations, one- and two-dimensional unsteady flow calculations, sediment transport/mobile bed computations, and water temperature/water quality modeling.
Another review was published by Nema and Desmuck, 2016 [
5]. In their review, they indicated the input data needs and the output quantities that the models should provide and concluded that MIKE 11 and HEC-RAS are the codes [
6].
The preparation of the inputs and the quick analysis of the output quantities is not very simple for most of the codes and can represent a limitation if you need a quick estimation of a possible imminent impact. This paper tries to simplify this aspect of the problem.
2. Details of Numerical Model NAMI DANCE
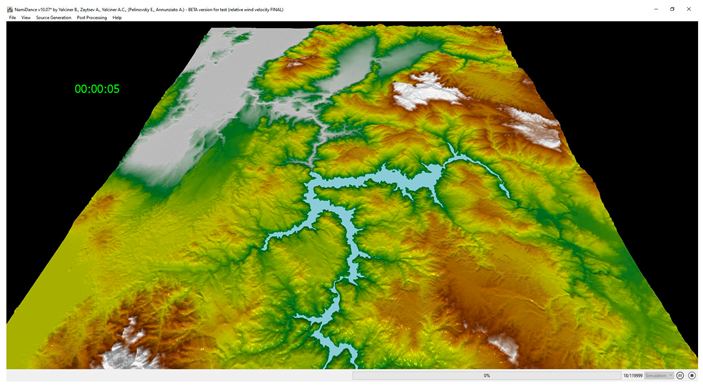
The numerical model, NAMI DANCE, was originally developed for solving tsunamis based on shallow water theory. The code solves the nonlinear shallow water equations covering the surface and bottom stresses, the Coriolis force, and uses the water surface disturbances as the inputs simulating the propagation and coastal amplification of long waves. The governing equations of NAMI DANCE (continuity and momentum equations) are given in Equations (1)–(3). The equations are solved using a staggering leapfrog scheme numerical solution procedure in single or nested domains with rectangular structured mesh.
is the water surface elevation;
represents the seawater density;
is gravitational acceleration;
is time;
and
are the horizontal coordinates in zonal and meridional directions;
is the total water depth;
is the undisturbed basin depth;
is the Coriolis parameter with
, where ω is the angular velocity of the Earth and ∅ is the y-coordinate in degree.
and
, the discharge fluxes in the horizontal plane along
and
coordinates, are calculated from
and
are the bottom shear stresses in the horizontal plane along the
and
directions, where the Manning law is used for the bottom friction with coefficient
, also given in the following:
Manning’s coefficient
is calculated by
where
fb denotes the bottom friction.
NAMI DANCE has been validated by several benchmark problems and applied to many tsunami events and modeling studies (Dogan et al., 2023 [
7]; IAEA-TECDOC 2022 [
8]; Dogan et al., 2021a [
9]; Velioglu Sogut and Yalciner 2019 [
10]; Lynett et al., 2017 [
11]). The model has been upgraded to use a Graphical Processor Unit (GPU) for high-speed processing capability (Yalciner and Zaytsev 2017, [
12]) and can also solve long waves due to atmospheric pressure and wind disturbances in the latest version, NAMI DANCE SUITE (Dogan et al., 2021b [
13]). NAMI DANCE uses the bathymetry and topography data in raster format [
14,
15], the initial water surface displacement, and fluxes, if needed, as the standard inputs, as well as the spatial and temporal distributions of atmospheric pressure and wind for solving long waves due to atmospheric disturbances.
3. Methodology
The computation of a dam break consists of the preparation of an input that contains the topography of the area, with the location of the break removed to allow the exit flow from the lake. The lake should be modeled so that once the calculation starts, the water can flow through the opening in the dam structure being considered. The water is allowed to propagate into the valley downstream of the dam for a length of time that must be determined at the beginning.
The first action for the numerical analysis of dam break events is the approximate identification of the potentially affected area and the time expected for the calculation (a few hours or several days). The definition of the area is not precise at the beginning of a new problem, particularly for dams created for irrigation where an output river is not present. If the dam is used for energy production, there will be a river immediately downstream of the dam, and therefore, that will most likely be the direction of the flow in case of a break; in the case of an irrigation-type dam or water reservoir for water collection only, a river could not be present, and therefore, it is not immediately clear in which direction the water displacement will be.
However, looking at the topography of the valley downstream of the dam, it is normally possible to have an idea of what could be the overall extent of the calculation. A preliminary bounding box can therefore be established for an initial low-resolution calculation to be conducted for an expected initial duration of the analysis time. The idea is to check if the flow reaches or not the whole extent of the study domain in the expected duration. In case the inundation does not reach the whole extent, it is possible to reduce the domain bounding box and thus reduce the computational effort, or, if the water reaches the borders of the bounding box before the end of the expected duration of the calculation, the bounding box could be expanded.
For the determination of the analysis time, in general, it is important to verify if large cities are present downstream, and a requirement is to identify the timing when the flow reaches those cities. Again, a preliminary calculation with a low-resolution nodalization can clarify this aspect.
The extent of the calculation, the resolution, and the analysis time define the amount of CPU time needed to perform the calculation. Therefore, in order to contain the CPU time within a reasonable range (i.e., 8–12 h), it is necessary to minimize the bounding box and the analysis time and maximize the resolution.
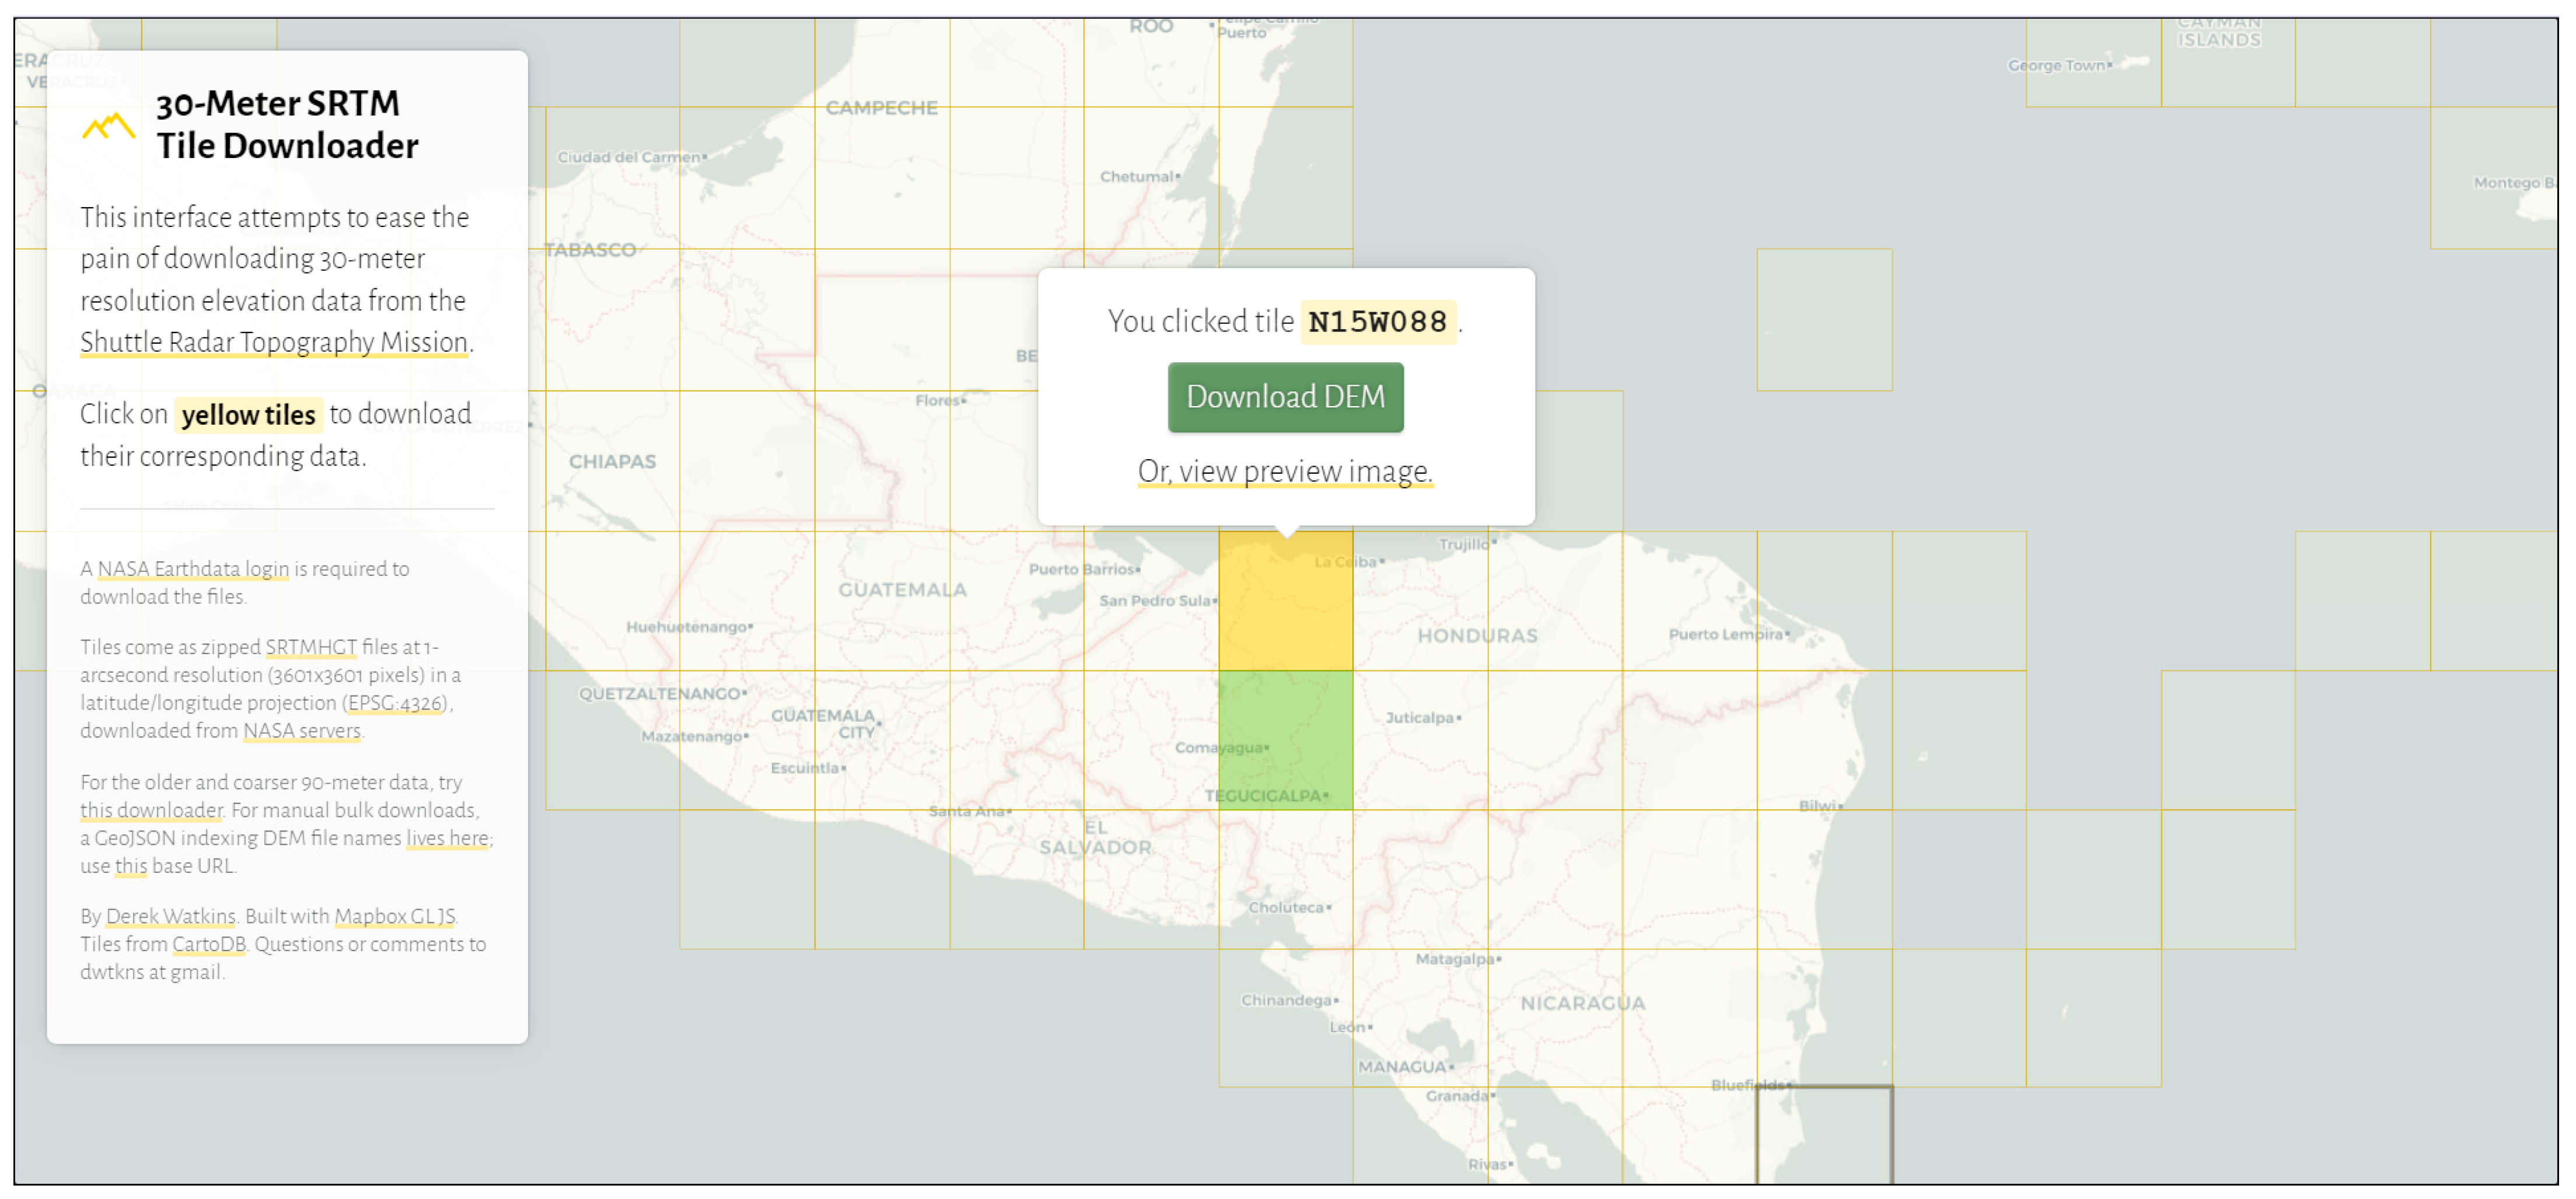
A topography and bathymetry database defining the topography of the area and the bathymetry of the lake is needed to perform the calculations. If no specific and detailed data are available for the case, the publicly available SRTM 30 m resolution data represent the best option (Tufekci-Enginar et al., 2022 [
9,
10]). The data can be easily downloaded for a selected area from various sources such as
https://dwtkns.com/srtm30m/, accessed on 29 June 2023 (
Figure 1). For the case in question, it was necessary to download several sections and merge them into a single gridded raster dataset.
The raster file representing the topography will be our main datum to start the following manipulation.
3.1. Input Quantities
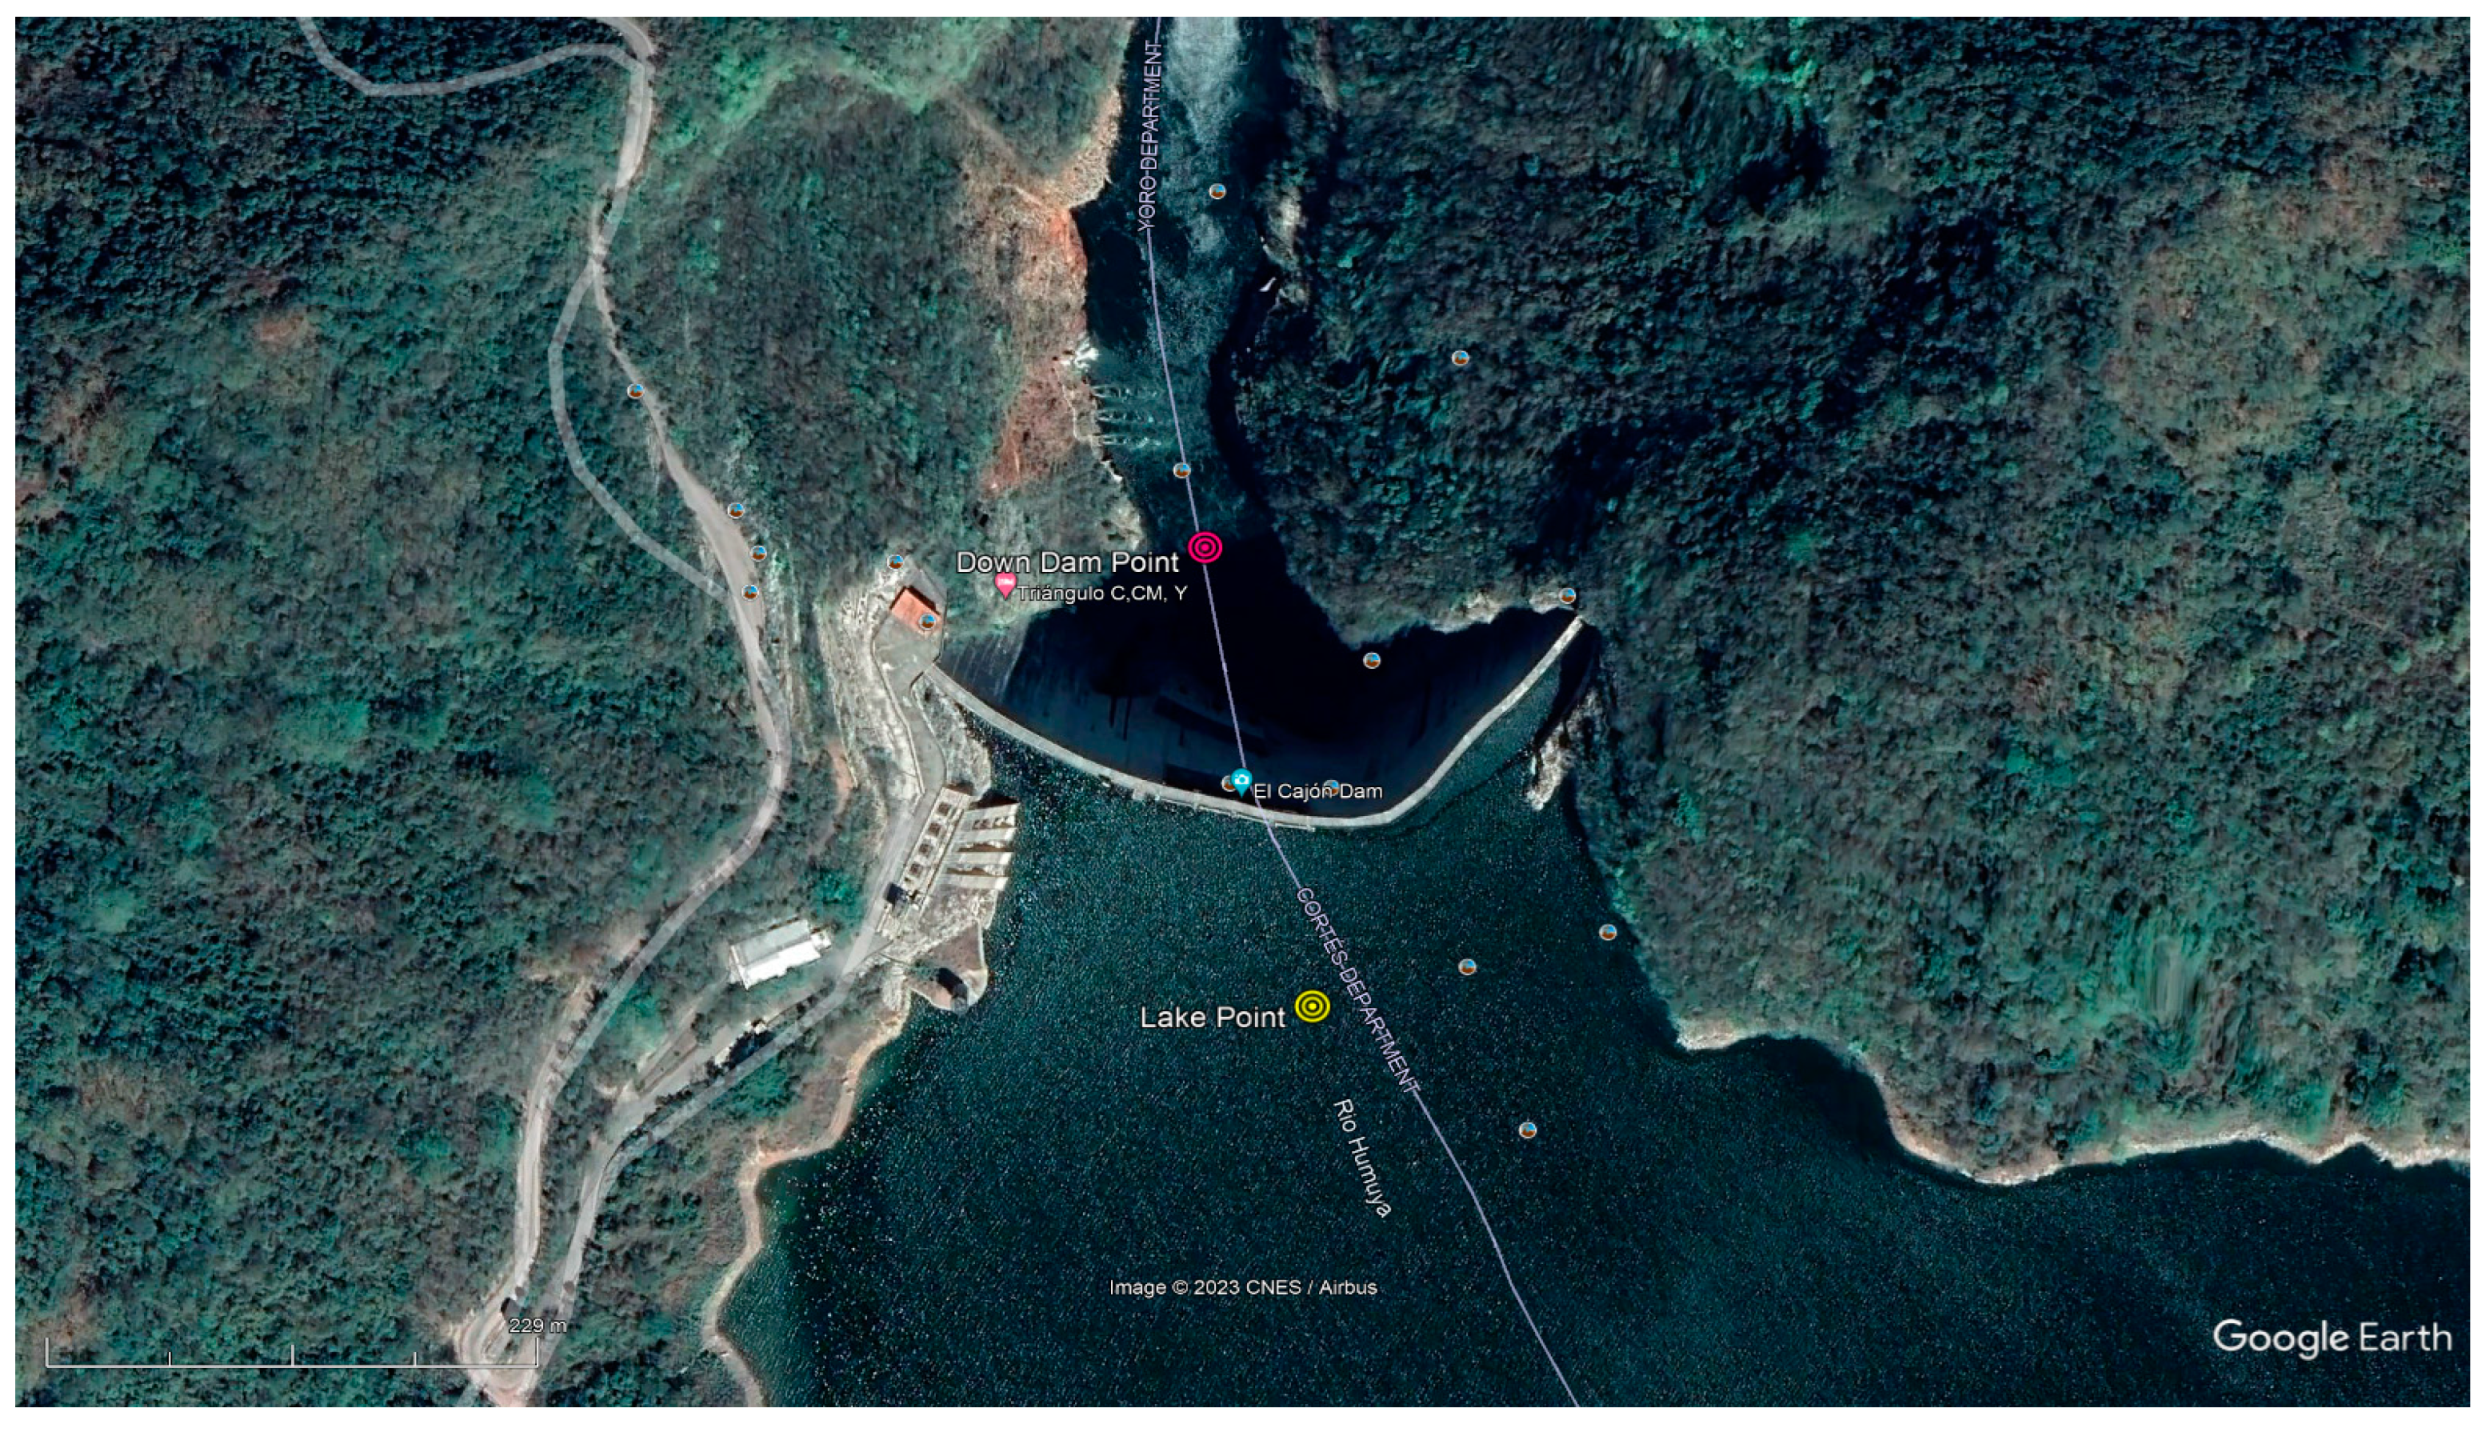
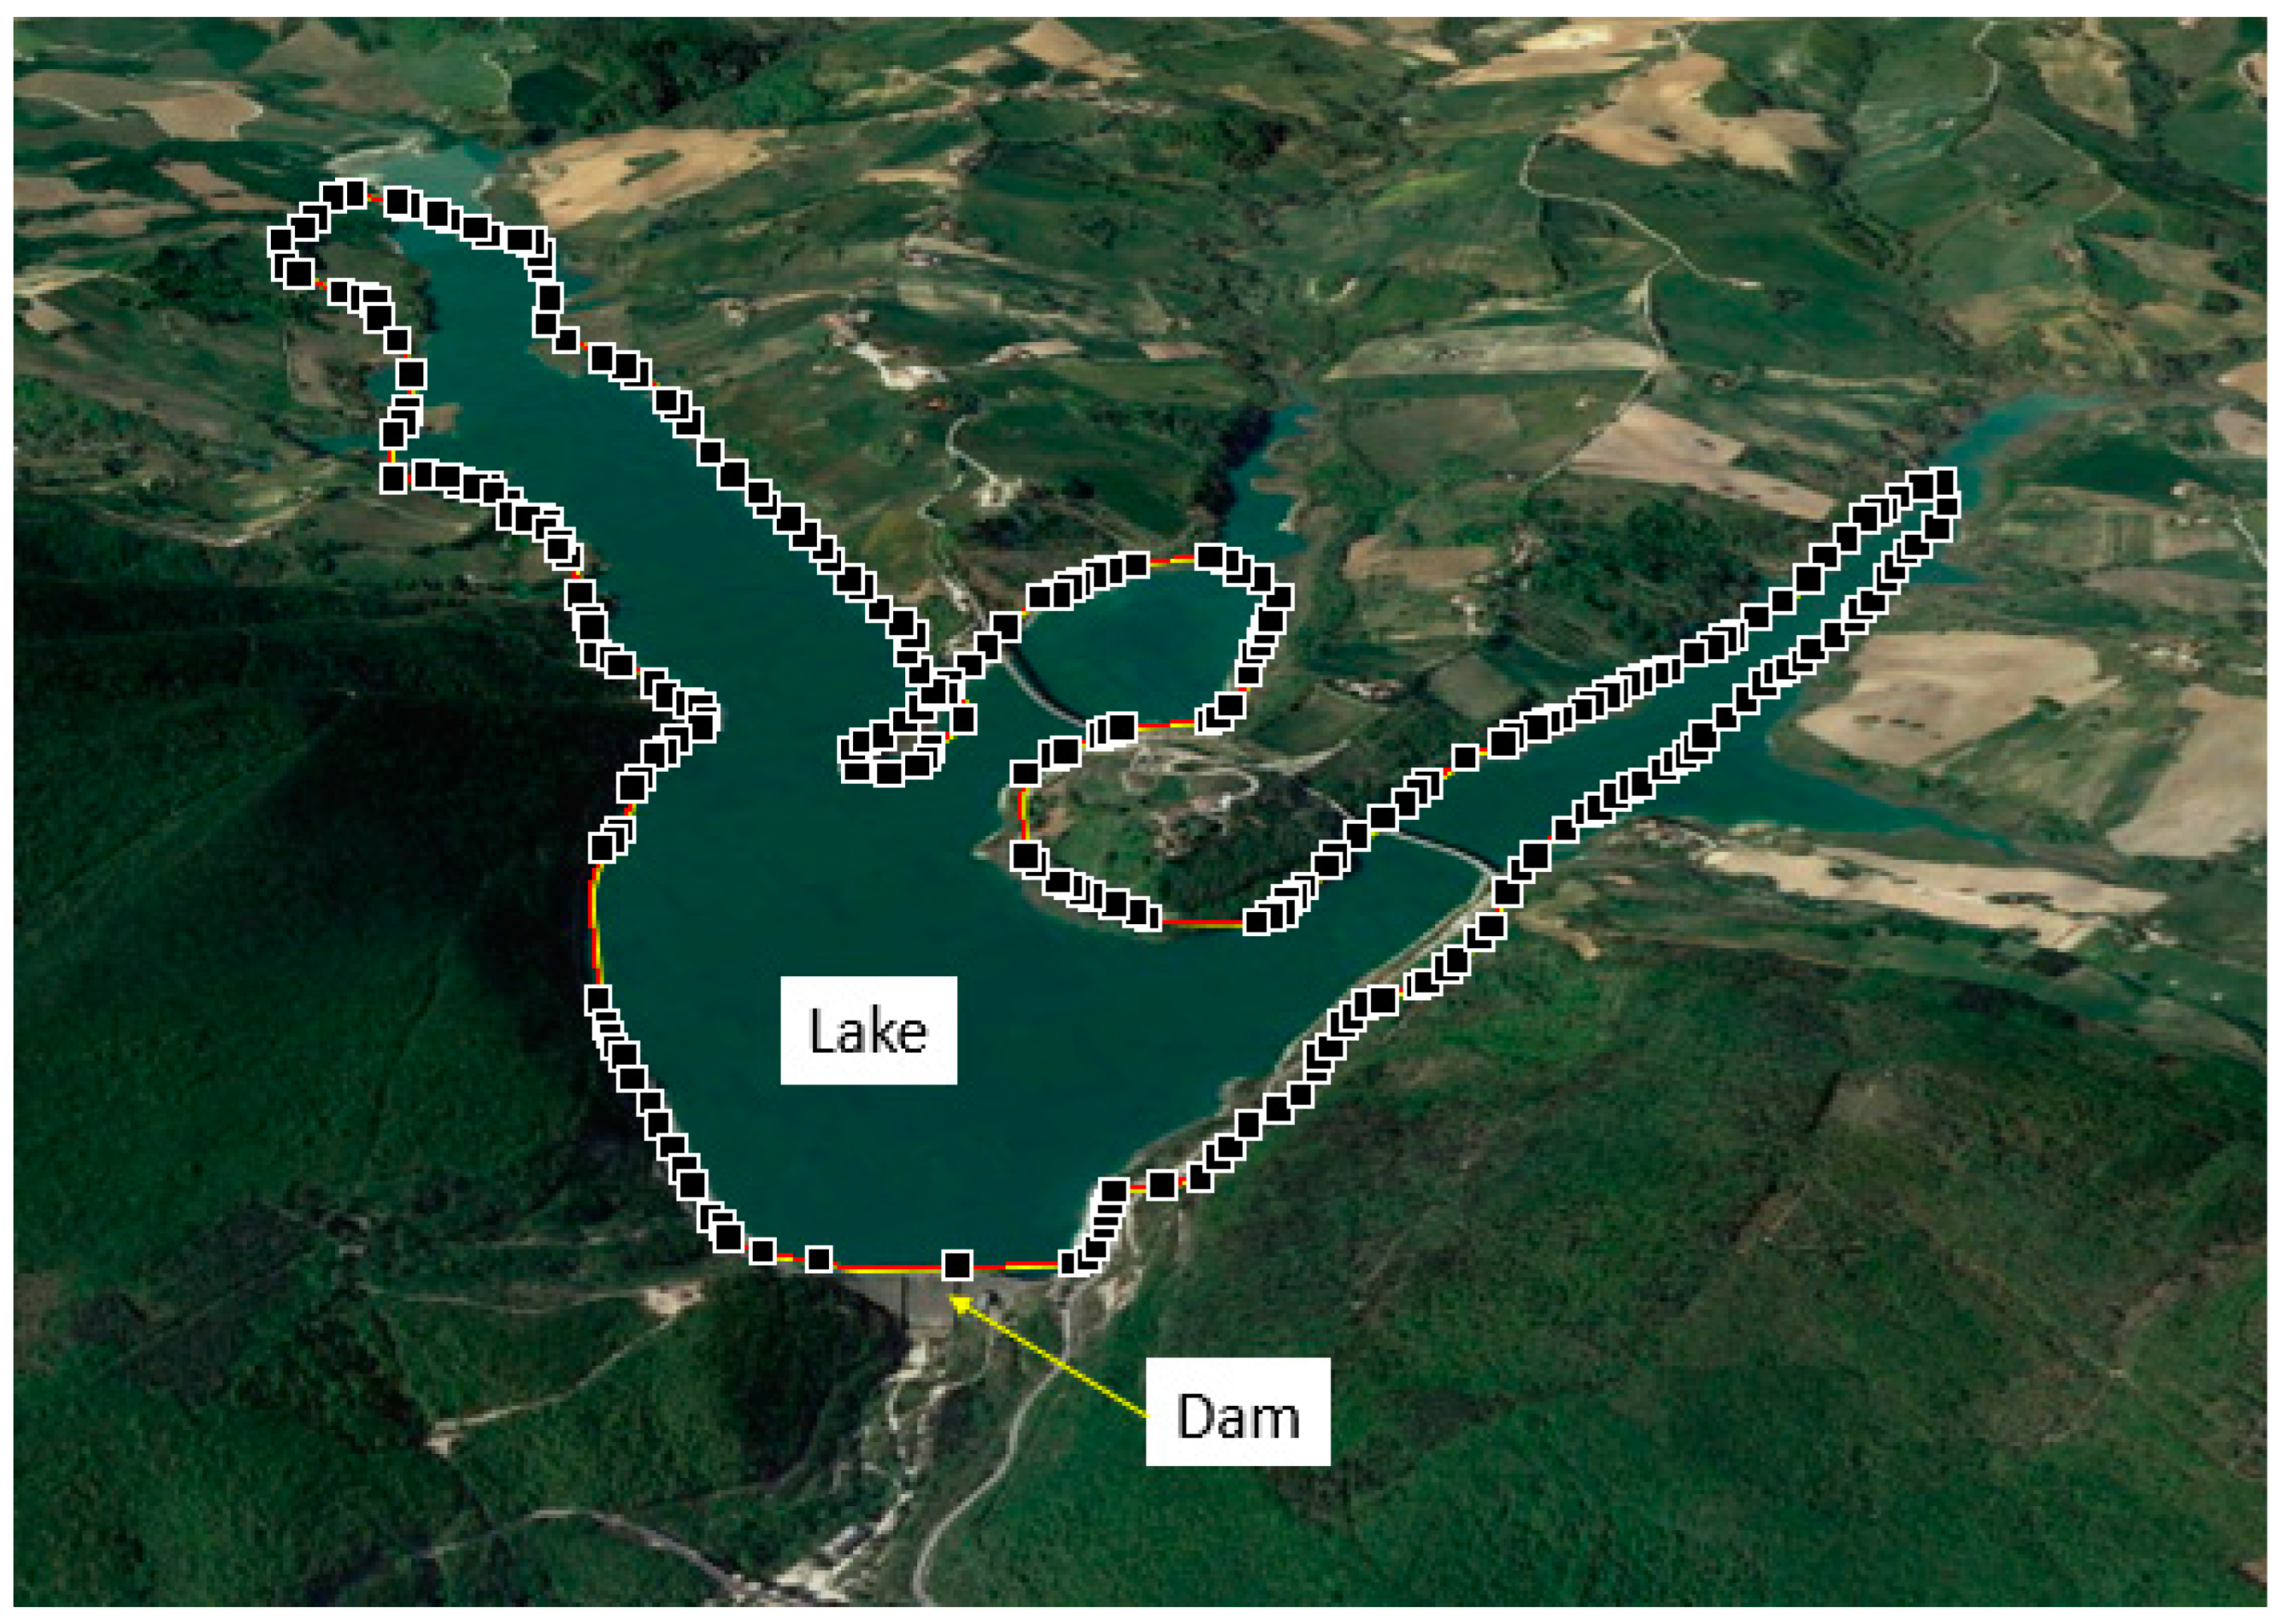
The first activity is the identification of the extent of the lake upstream of the dam. This is generally executed by following the perimeter of the lake at a specific elevation representing the surface of the lake. Technically speaking, this can be carried out by identifying a lake point close to the dam, estimating its elevation, and then selecting all the adjacent points at that same elevation (
Figure 2).
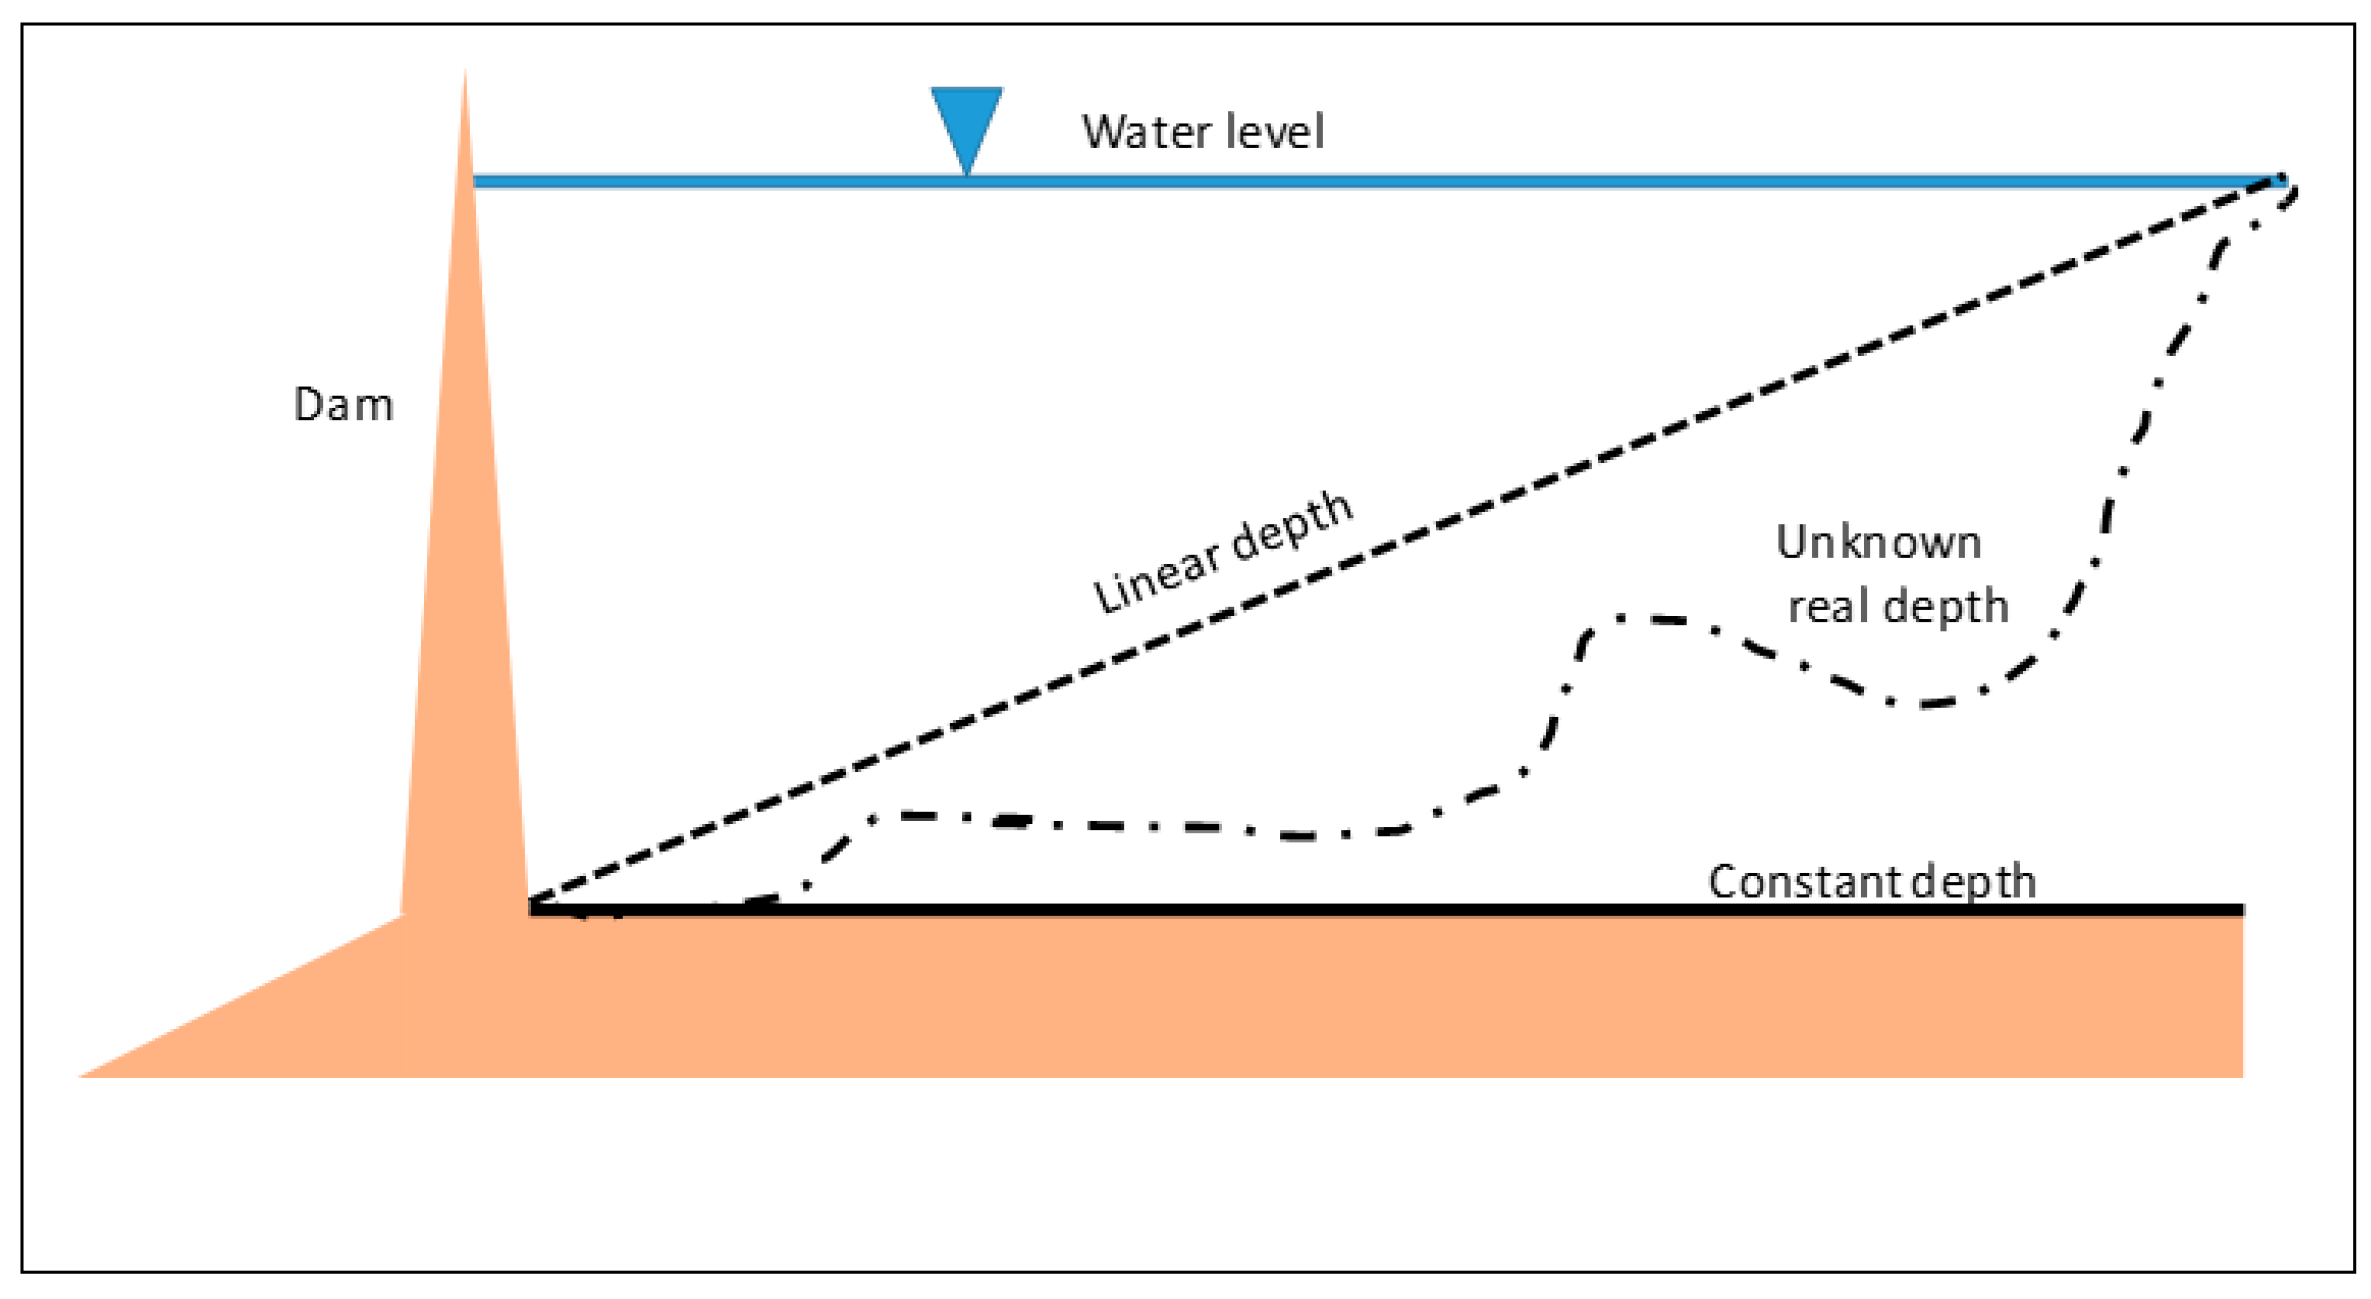
The lake bathymetry is generally unknown. It is very rare that dam lakes are examined after construction to obtain the current depth of the lake. In some rare cases, the topography of the valley before the construction of the dam is available and that can represent good information. Performing bathymetric studies for each dam where an emergency calculation has to be performed is impossible, first, because a bathymetric survey takes a lot of time, and second, because in some cases, the areas are not easily accessible. The need for precise bathymetry is also evident in the fact that debris deposits can substantially change the lake volume over the years. Therefore, considering that in the majority of cases, the lake depth is unknown, some possible hypotheses can be implemented: constant lake depth, linear depth, and reconstruction of the depth based on the form of surrounding valleys (
Figure 3).
The constant lake depth is the simpler one. The assumed depth is the difference between the lake elevation provided by SRTM and the elevation of the Earth downstream of the dam (down dam elevation). This depth is preserved for the whole surface of the lake. It is clear that this is an overestimation of the lake volume because far from the dam, the depth will be certainly smaller. This procedure can be the best option in emergency calculations.
The linear depth from the beginning of the lake to the dam is probably closer to the real lake volume, but in some cases, it could be an underestimation of the volume.
The reconstruction of the possible bathymetry considering the slopes of the surrounding areas is a rather long and expensive procedure and requires manual intervention. In case there is no time limitation, this is probably the best solution.
3.2. Specific Needs for NAMI DANCE
The NAMI DANCE code foresees:
The definition of a bathymetry raster file, where the depth is positive below the water surface;
A deformation file that represents the height of the initial water disturbance that is then moved to give the water propagation;
The bathymetry and deformation files must have the same extent and number of cells (rows and columns).
Since the NAMI DANCE code was developed for tsunami propagation but not for dam break calculations, we needed to find a way to initialize the system so that the code could perform the calculation of the propagation. We used the following procedure:
The bathymetry is the topography multiplied by −1 and with a constant value removed so that the surface of the lake is set equal to the constant depth.
- ○
Suppose that the elevation of the lake is 290 m and the constant depth of the lake is 15 m:
- ▪
[bathymetry] = 290.0 − [topography (SRTM)];
- ▪
[bathymetry] over the lake is set to 15 m.
The deformation file is assumed to be the opposite of bathymetry on part of the lake that is left at a level of 0:
- ○
In the same example above:
- ▪
[deformation] = [topography (SRTM)] − 290.0.
In order to verify if the manipulations have been performed correctly, the bathymetry on the lake area will be 15 m and the deformation will be 0. At any other point lower than the lake elevation, the bathymetry will have a positive value and the deformation will have the same value negative. At any point at an elevation higher than the lake, the bathymetry will be negative (as if it is on land in a tsunami computation) and the deformation will be positive with the same absolute value.
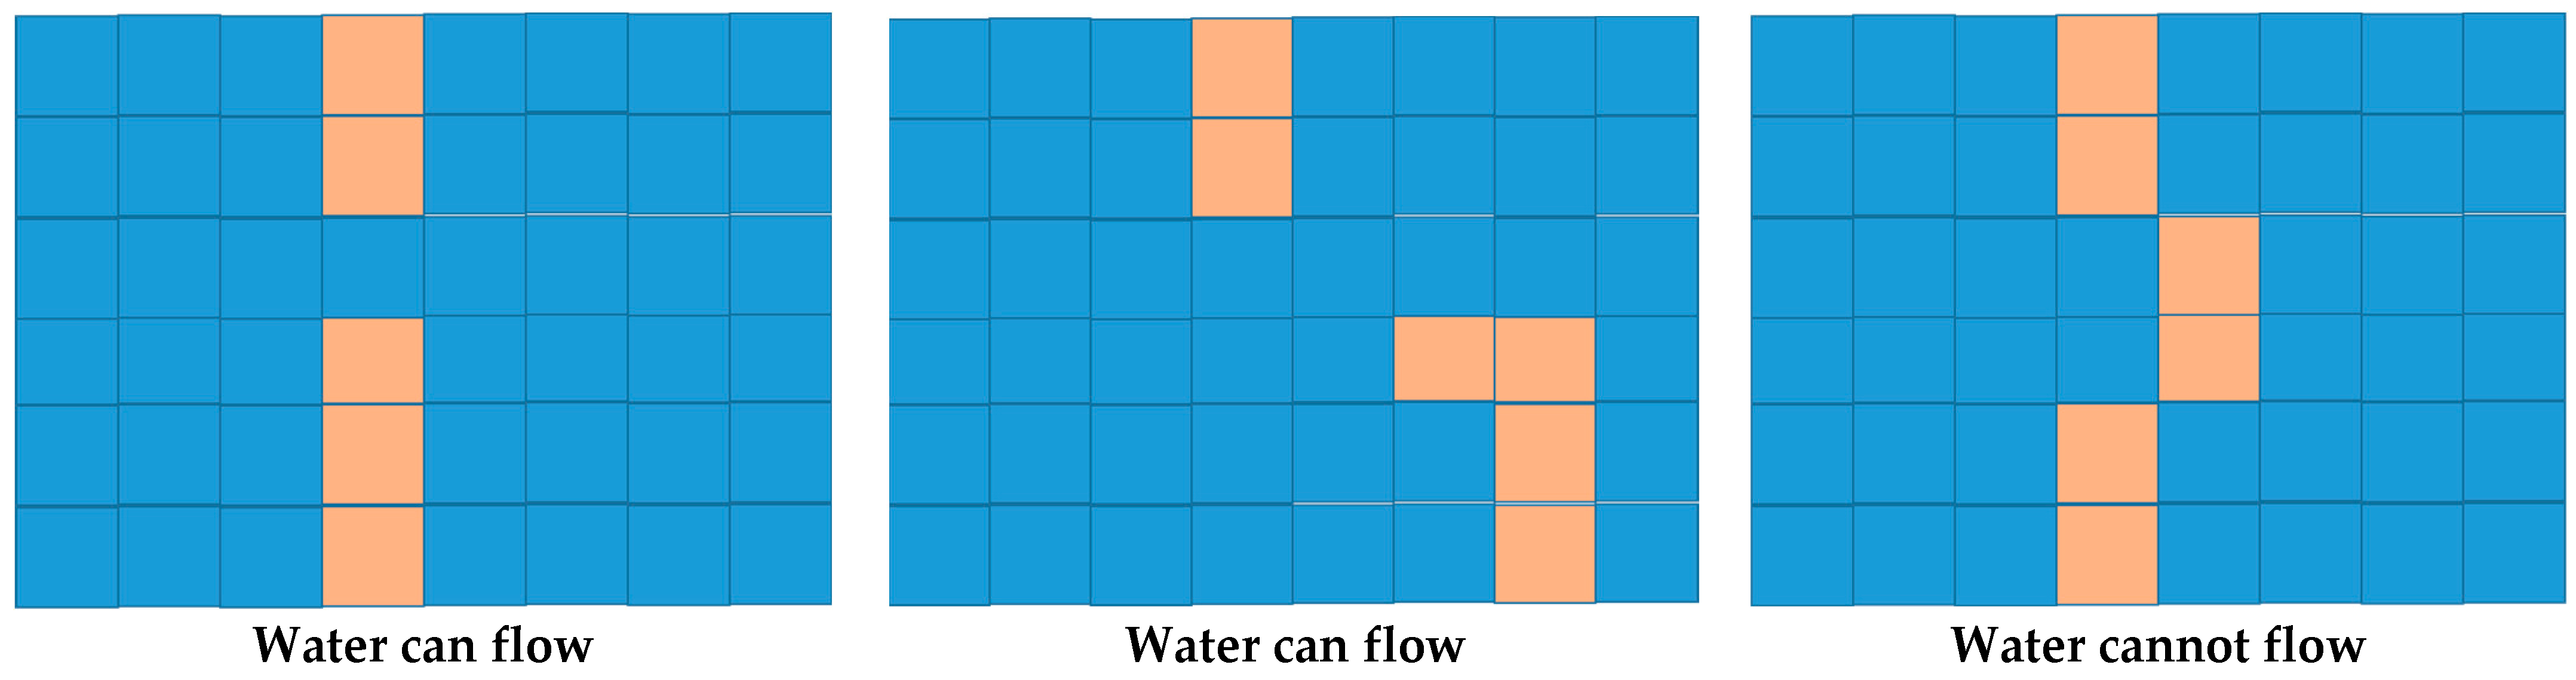
The other needed modification is the opening of the broken section of the dam in the bathymetry file. The opening will be a number of pixels that represent the opening, which is set at an elevation corresponding to the height of the opening. For example, if the opening is 130 m, this will be represented with 4 pixels (SRTM is 30 m, so the total will be a bit smaller, 120 m) with a value of the maximum water depth (15 m in the previous case), or smaller if you want to represent a partial break. In the positioning of the broken pixel, it is necessary to take into account that, in order to have water flow, it is always necessary to have “at least” one pixel in common between the row; otherwise, water will not flow in (
Figure 4).
In case the break is smaller than 1 pixel (i.e., 20 m or less), it is necessary to reduce the grid size, i.e., resample the SRTM to 15 m or less, before performing the calculations to satisfy this requirement.
Although the break opening time can range from a few minutes to a few hours, depending on the type of dam and the break type, in these calculations, the break opening time is assumed to be instantaneous. In general, this mode can provide the maximum initial flow rate and therefore the largest inundation extent. In principle, it could be possible to perform a number of initial steps with different break sizes and perform one restart after the other. The code, at the moment, is not programmed to do this, and therefore, the restarts should be performed manually or a procedure could be written to simulate such behavior. However, the break opening time, although very important to establish the possible impact forces on an obstacle, is not considered to have major importance in the overall timing and extent of the inundation.
Overtopping or continuous rain flow on top of the lake has not yet been implemented, but the NAMI DANCE code has the ability to consider a constant or a time-dependent flow rate on the calculation domain. This feature has not yet been implemented in dam break calculations, so the situation evolves from the initial conditions until the emptying of the upstream lake without any water addition or change in geometry.
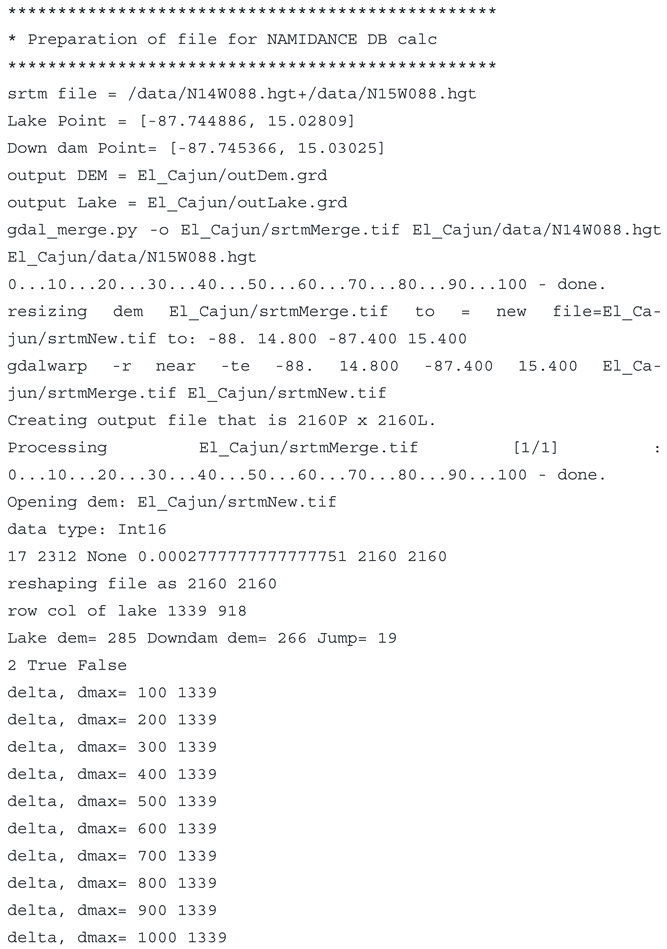
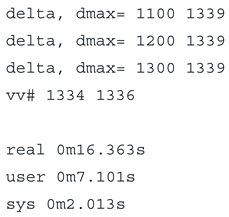
3.3. Python Script to Facilitate the Input Files Preparation
In order to facilitate the preparation of the input files according to the procedure explained above, a Python script was created, present in
Appendix A, which allows generating the required files, ready for use with the NAMI DANCE code.
https://github.com/annunal/DamBreak.
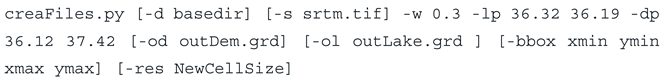
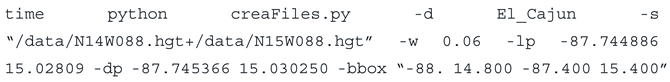
Once the script is installed as explained in GitHub, it is possible to provide the following command:
![Eng 04 00105 i001]()
where:
-d is the base directory. If not specified, the current directory is used. The output will be located in that directory
-s is the SRTM file that is used [default: srtm.tif]. You can specify more files included in double apices and separated by a + sign (example: -s “file1.tif + file2.tif”). In that case, the script will merge the files before cropping to the desired extent specified by the bbox parameter;
-w is the dam break width in km;
-lp is the lake point and is a couple of numbers (longitude, latitude) representing one point on the lake very close to the dam. It should not be too close to the dam and be 2 or 3 pixels (ab 100 m) away from the beginning of the dam;
-dp is a downstream point of the dam and represents the first point after the dam along the flow path downstream. This point should not be too far from the dam or inside the area of the dam;
-od (optional) is the output file name for the bathymetry. By default, it is outDem.grd;
-ol (optional) is the output file name for the deformation file. By default, it is outLake.grd;
-bbox is the bounding box of the calculation “lonmin latmin lonmax latmax”, in double apices, with the values representing the boundary of the computation;
-res (optional) is the required resolution in degrees. If not specified, the SRTM30 original value is assumed.
An example of this call is the following:
The output of this call is the creation of two grid files, “outDem.grd” and “outLake.grd”, in the format Surfer6, required by NAMI DANCE, that can be included as input files in the NAMI DANCE code user interface (outDem.grd as bathymetry and outLake.grd as deformation file) or used to create an input deck to launch a NAMI DANCE calculation with a script.
3.4. Output Quantities
The duration of a NAMI DANCE simulation depends on the domain extent, running time, and desired resolution and can take quite a long time in the case of either large extent and long time or fine resolution. The NETCDF format is one of the output format options of NAMI DANCE calculations and if the NETCDF format is selected for the output, two important files are generated:
- -
The file “OUT-T-ETA.nc”, which contains the timeline of the water surface elevation at each cell point over time.
- -
The file “OUT-EXTREMUM.nc”, which contains the spatial distributions of the computed maxima and minima of the selected tsunami parameters through the calculation. The quantity which is most useful for this type of analysis is “FD_MAX”, representing the maximum flow depth.
The quantities to be analyzed are generally the following:
The flooding extent (distribution of maximum flow depth along the flow path).
- ○
This is obtained by extracting the FDMAX from the OUT-EXTREMUM.nc file.
The timing of the flooding (wave travel time).
- ○
In order to obtain this quantity, a program called “Arrival_time.py” has been developed that allows indicating for each cell the hour at which the wave arrives (the arrival time is considered when a definable threshold is surpassed by the flow depth).
The time histories of water elevations at relevant observation points.
- ○
If these points are known before performing the calculations, their locations can be included in the file gauges.dat and specified before launching the calculations. If other required points are not known in advance, they can be extracted using the script extract.py, which analyzes the OUT-T-ETA.nc and performs the required estimation.
The population to be affected along the flow path.
- ○
This can be obtained using the script classify.py, which allows computing the population in each cell using the maximum flow depth and performs the analysis of the population distribution per class of heights. For the population file, it is possible to use files such as LandScan (
https://www.eastview.com/resources/e-collections/landscan/, accessed on 23 June 2023) or GHSL from the JRC (
https://ghsl.jrc.ec.europa.eu, accessed on 23 June 2023) or any other file with proper resolution and reading mode changes.
The building area to be affected by the flood.
- ○
Similar to the population affected, using the built-up area information and the maximum flow depth, it is possible to estimate the built-up area subject to each height class. A built-up dataset is offered, for example, by JRC (
https://ghsl.jrc.ec.europa.eu, accessed on 23 June 2023).
An analysis of a dam break should produce all the output above. A number of scripts have been developed that facilitate obtaining the quantities. Using those scripts, it could be possible in the future to automatically perform the risk assessment for all the dams subject to a strong tropical cyclone and include them in the algorithms present in the Global Disasters Alerts and Coordination System (GDACS,
https://www.gdacs.org, accessed on 23 June 2023), for example. However, at the moment, at least the identification of the lake point and the down dam point should be performed manually to avoid wrong results, but it is not unfeasible that clever methods could be used to automatize also this last step.
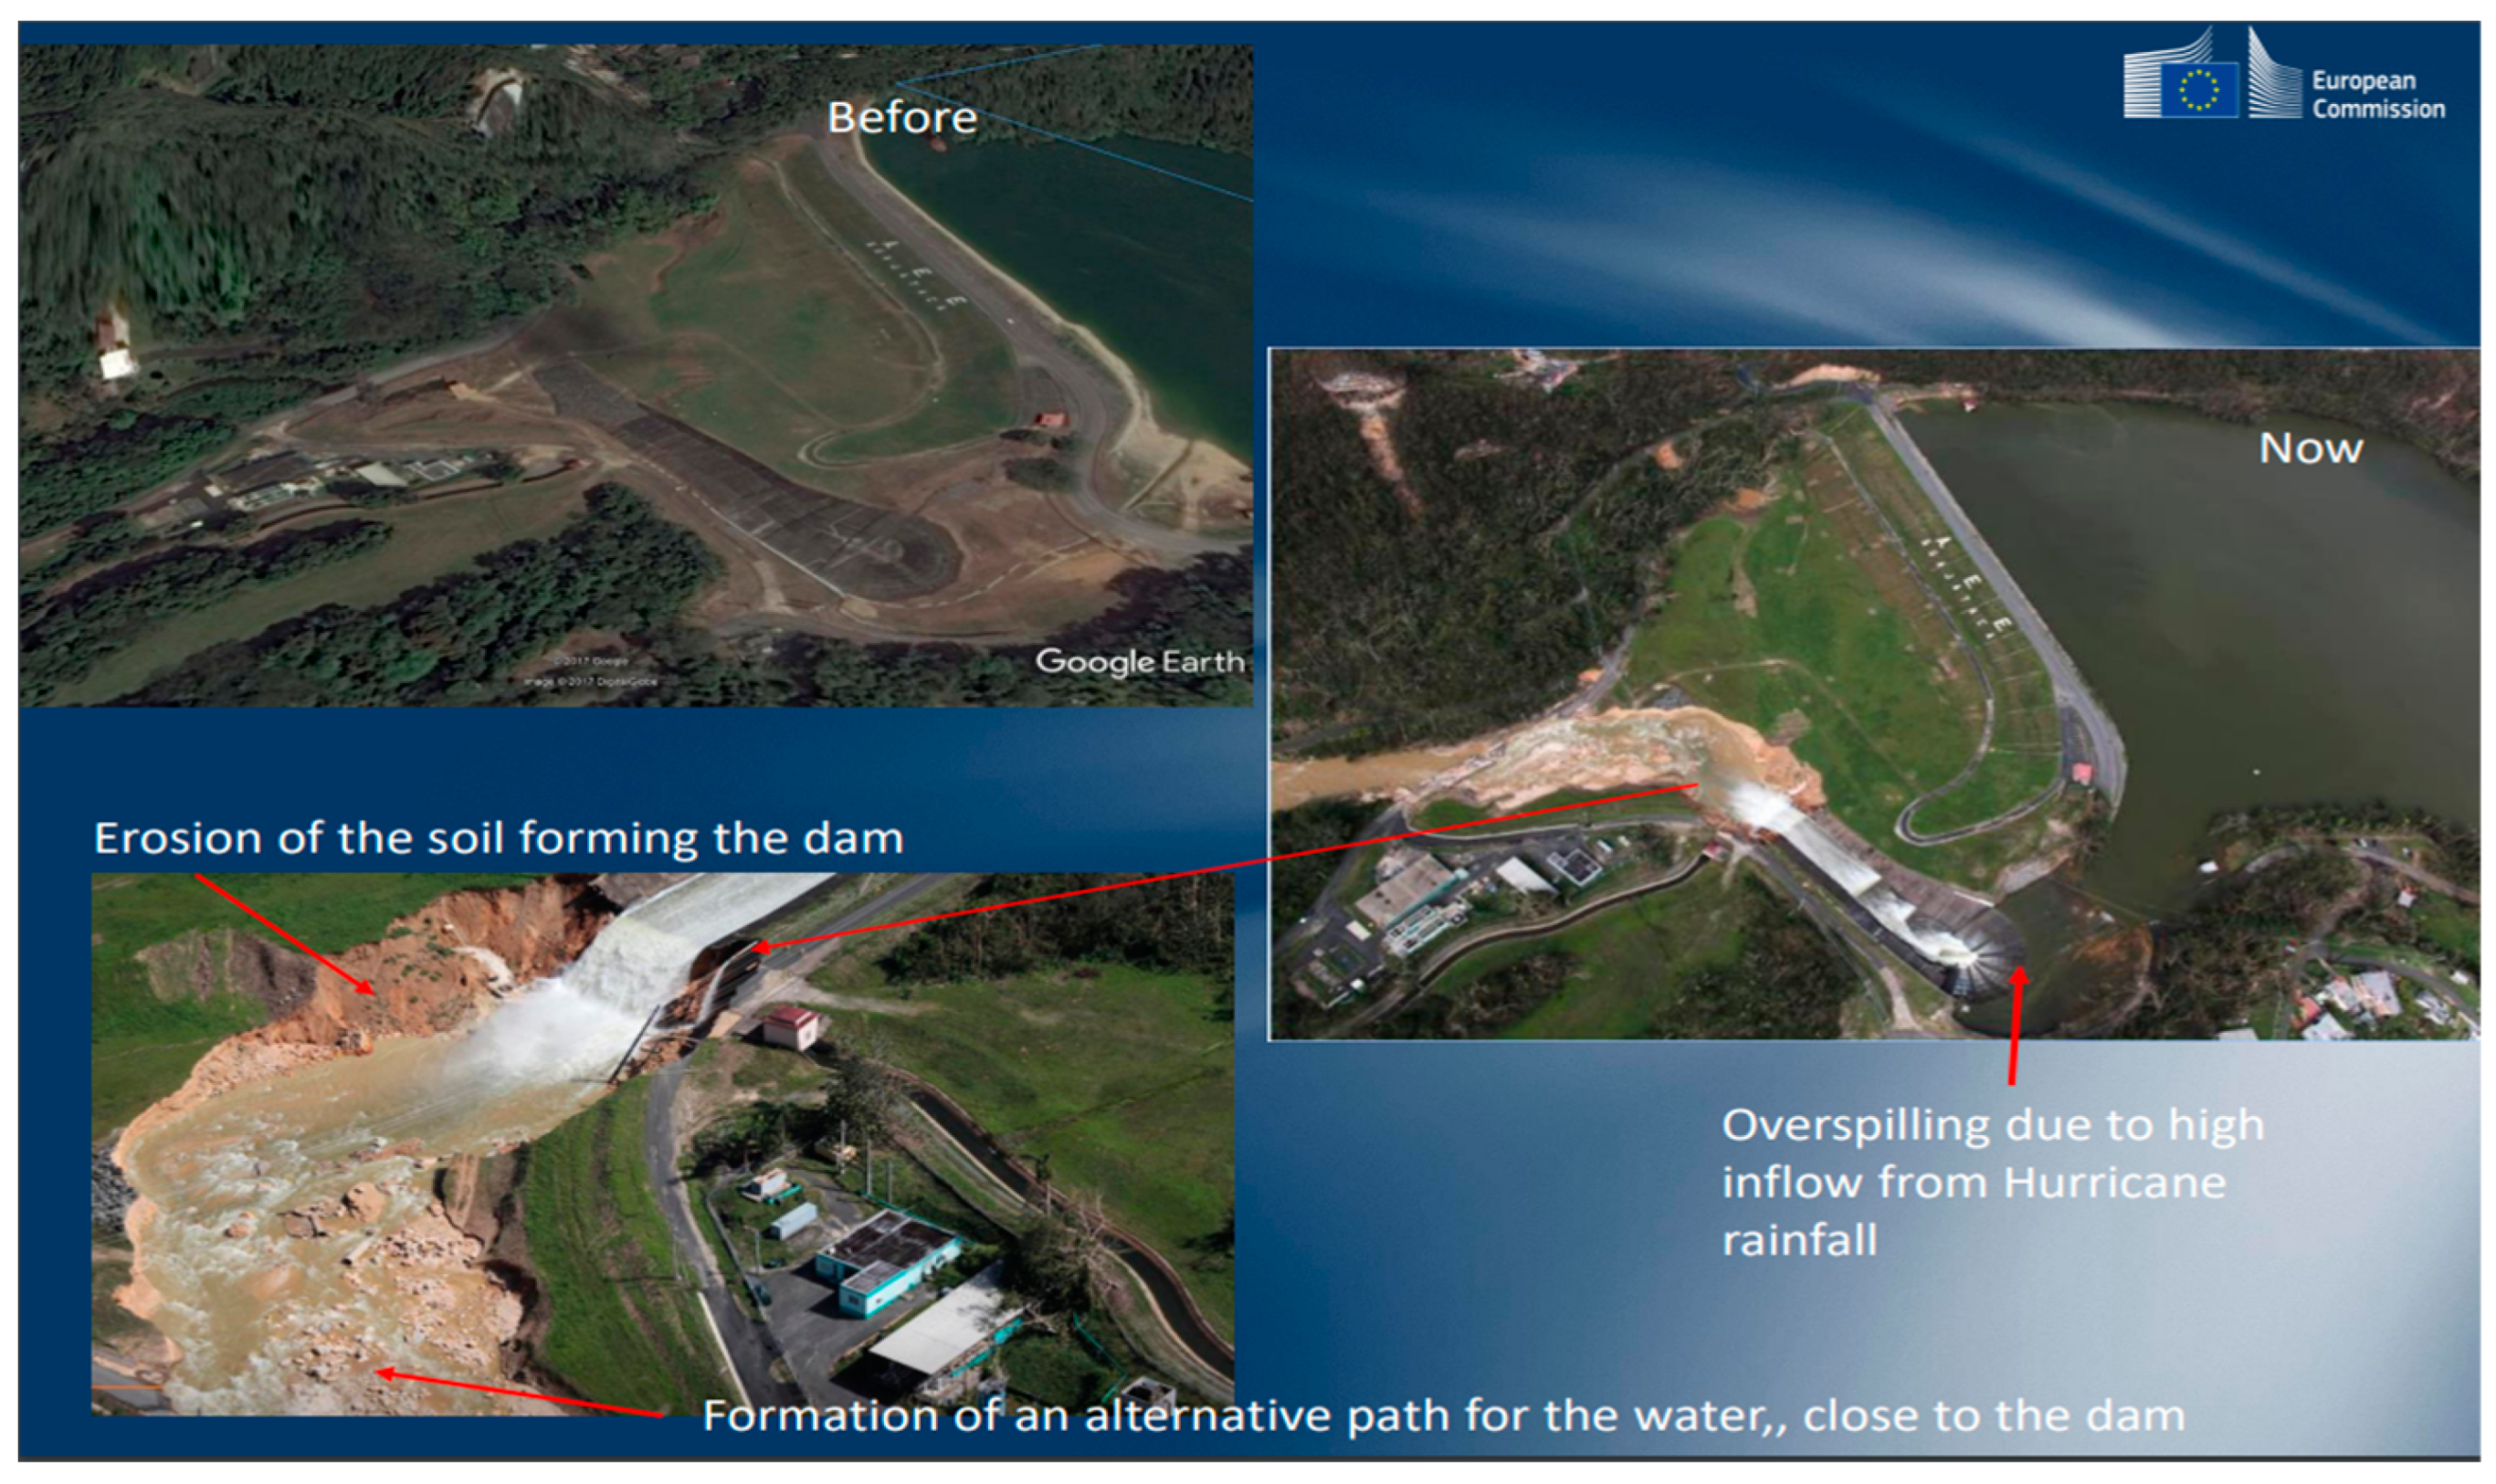
4. Case Study
As a case study, we selected an important event that occurred in 2017 due to the passage of Hurricane Maria, where the Guajataca Dam in Puerto Rico was partly broken, causing significant flash floods downstream and causing the evacuation of more than 70,000 people. The European Commission Joint Research Center (EC JRC) analyzed the event and produced a number of reports on it, identifying the major consequences in terms of timeline and population affected. A summary of the findings can be found in the following document:
https://floodobservatory.colorado.edu/Events/2017USA4523/PuertoRicoDam.v2.1.pdf (accessed on 23 June 2023),
Figure 5.
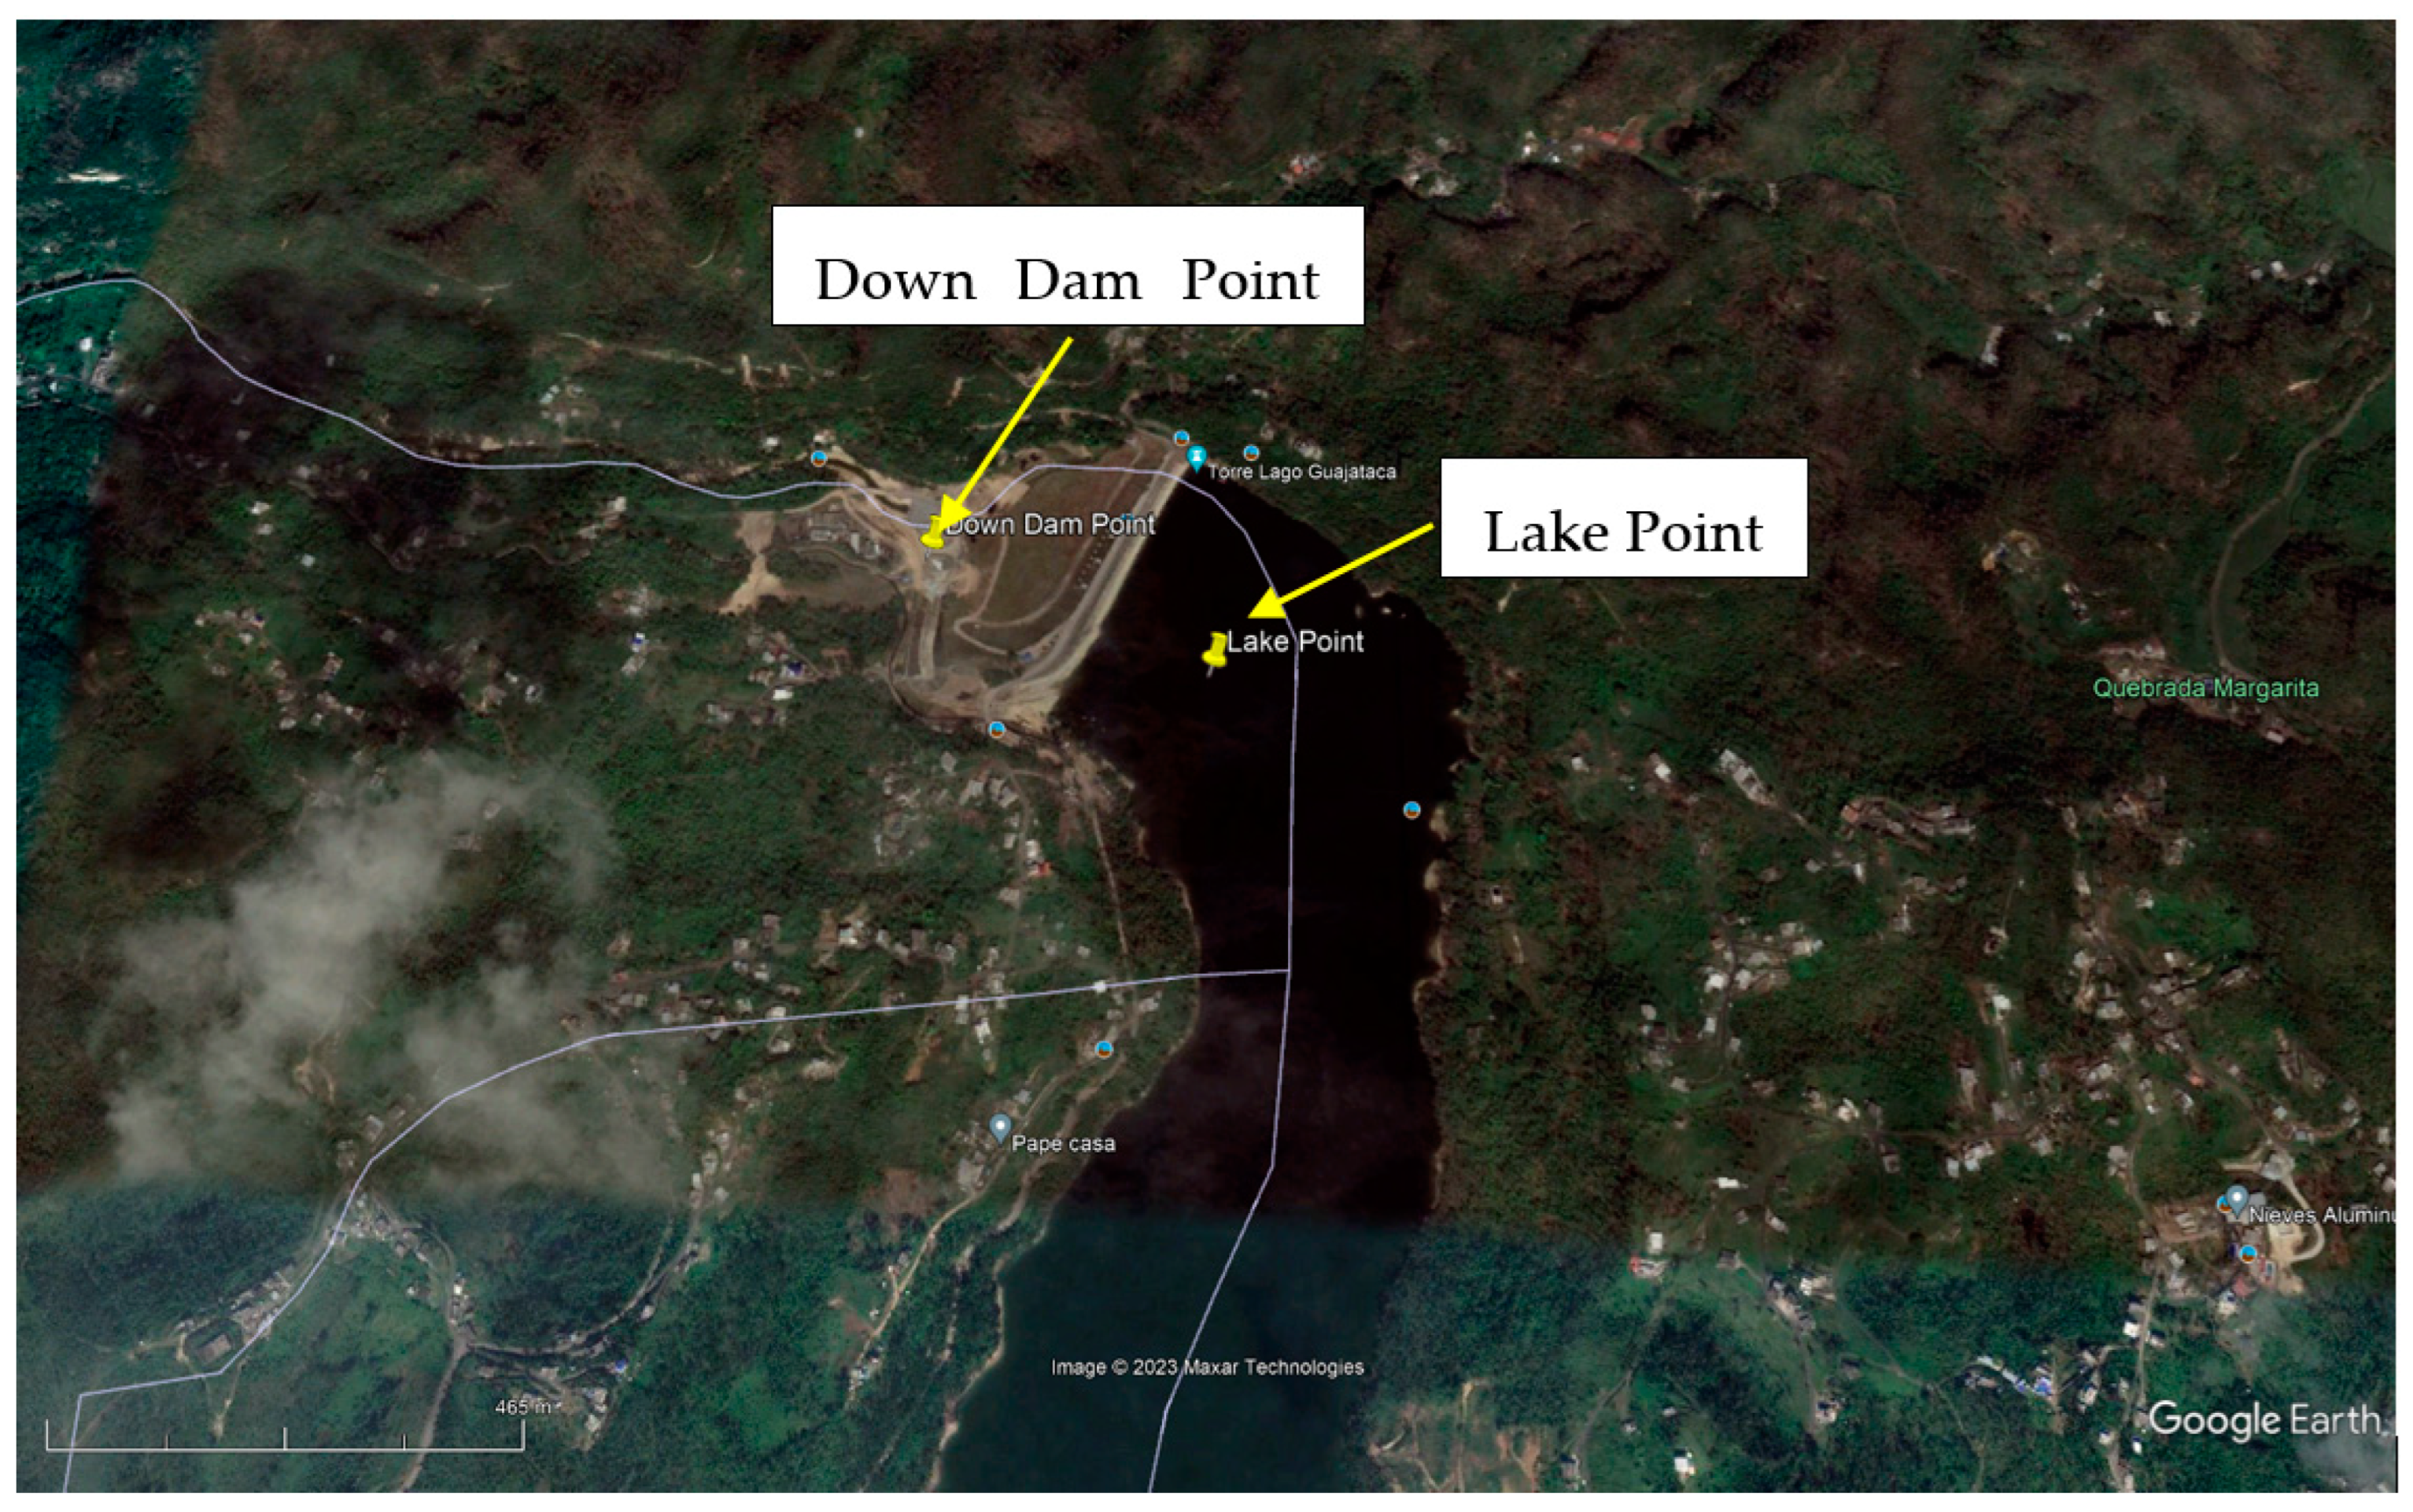
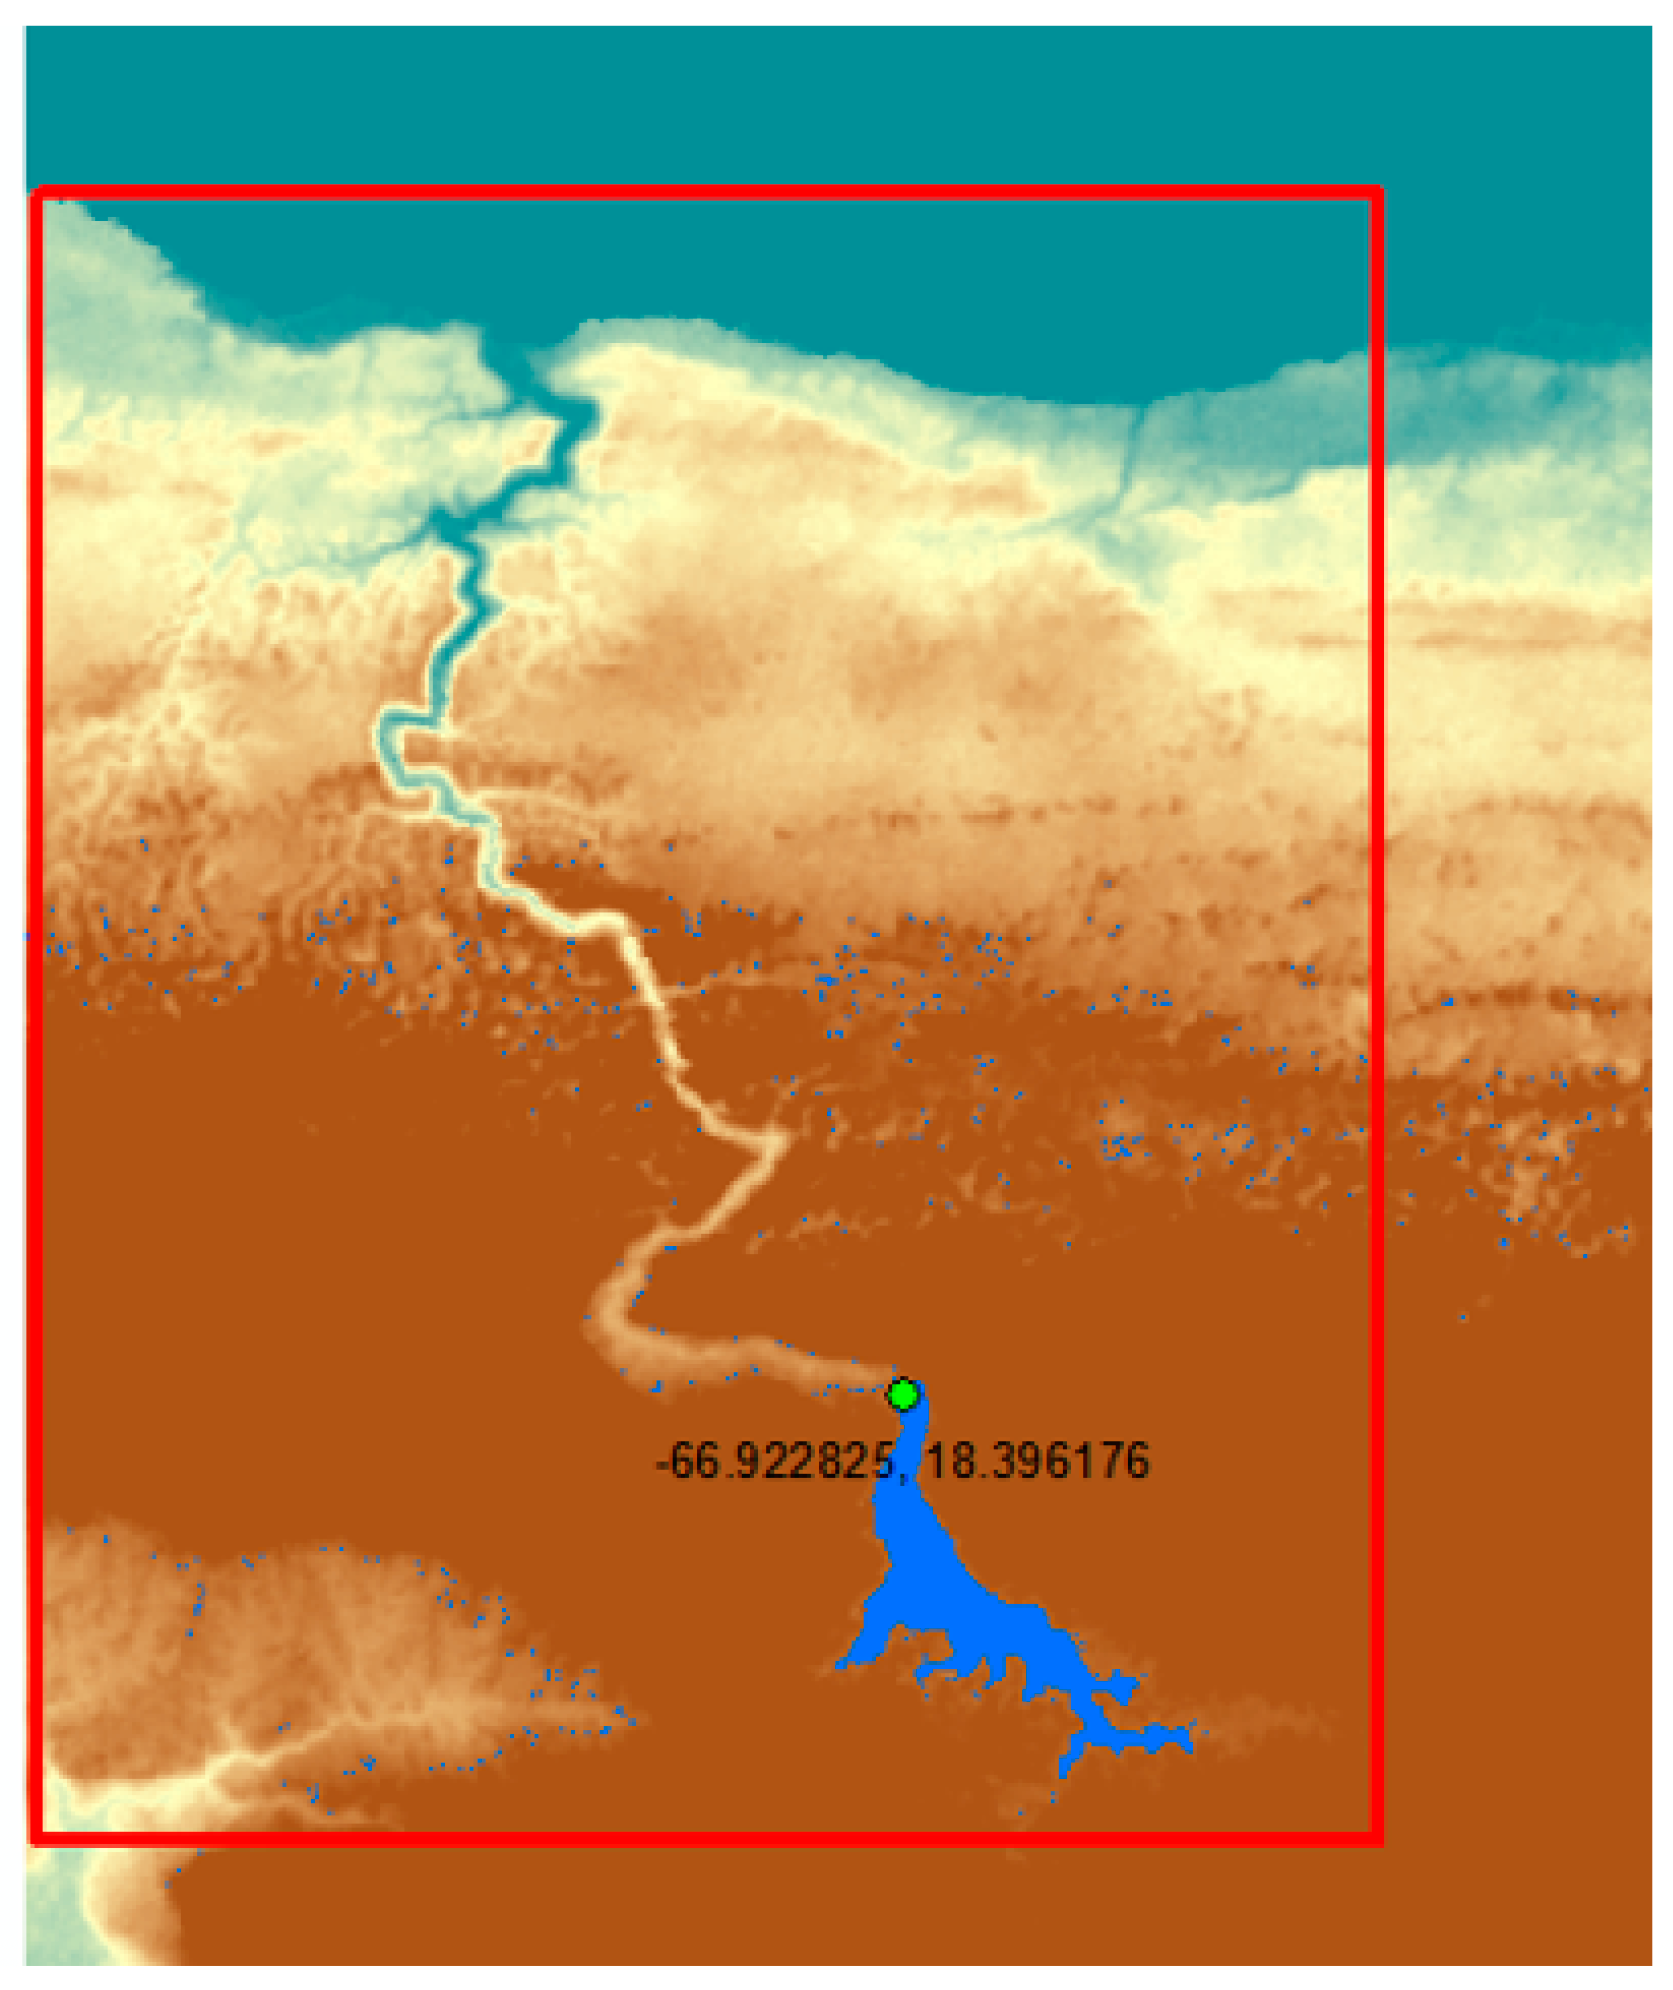
Looking at the location of the Guajataca Dam in Puerto Rico, it is possible to identify the two relevant observation points for our procedure, the lake point and the down dam point (
Figure 6), as follows:
Lake Point (lon/lat): −66.922825°/18.396176°;
Down dam point (lon/lat): −66.925838°/18.397463°.
From the SRTM30 repository, we can download the file N18W067, which contains the data of the whole flow path of this case. Given the location of the lake and the expected flow plain, we can identify the following bounding box for the domain of the analysis, marked in red in
Figure 7.
[Lonmin, Latmin, Lonmax, Latmax] = [−67° 18.358° −66.88° 18.50°]
The study domain is about 12 km by 16 km, a relatively small area. In many other cases, the bounding box can be much larger and can require much more computational effort.
4.1. Preparation of the Files and NAMI DANCE Run
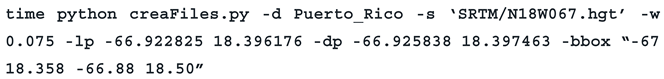
We can launch the following script with the parameters that are explained in
Section 3.3:
The resulting files, “outDem.grd” and “outLake.grd”, are the ones that can be immediately used with NAMI DANCE as the bathymetry and initial water surface elevation (forcing) and have 0 m in the “outLake.grd” file over the lake and 11 m (the hydraulic jump) in the “outDem.grd” file.
These files are relatively small (432 × 511 pixels), and therefore, it could be a good idea to use a resampled version of them by adding the parameter-res 0.000069444445 (a quarter of the original SRTM cell size), so the case would be 1728 × 2044 with a resolution of 7.5 m instead of 30 m. This can allow us to analyze smaller break sizes at a finer resolution.
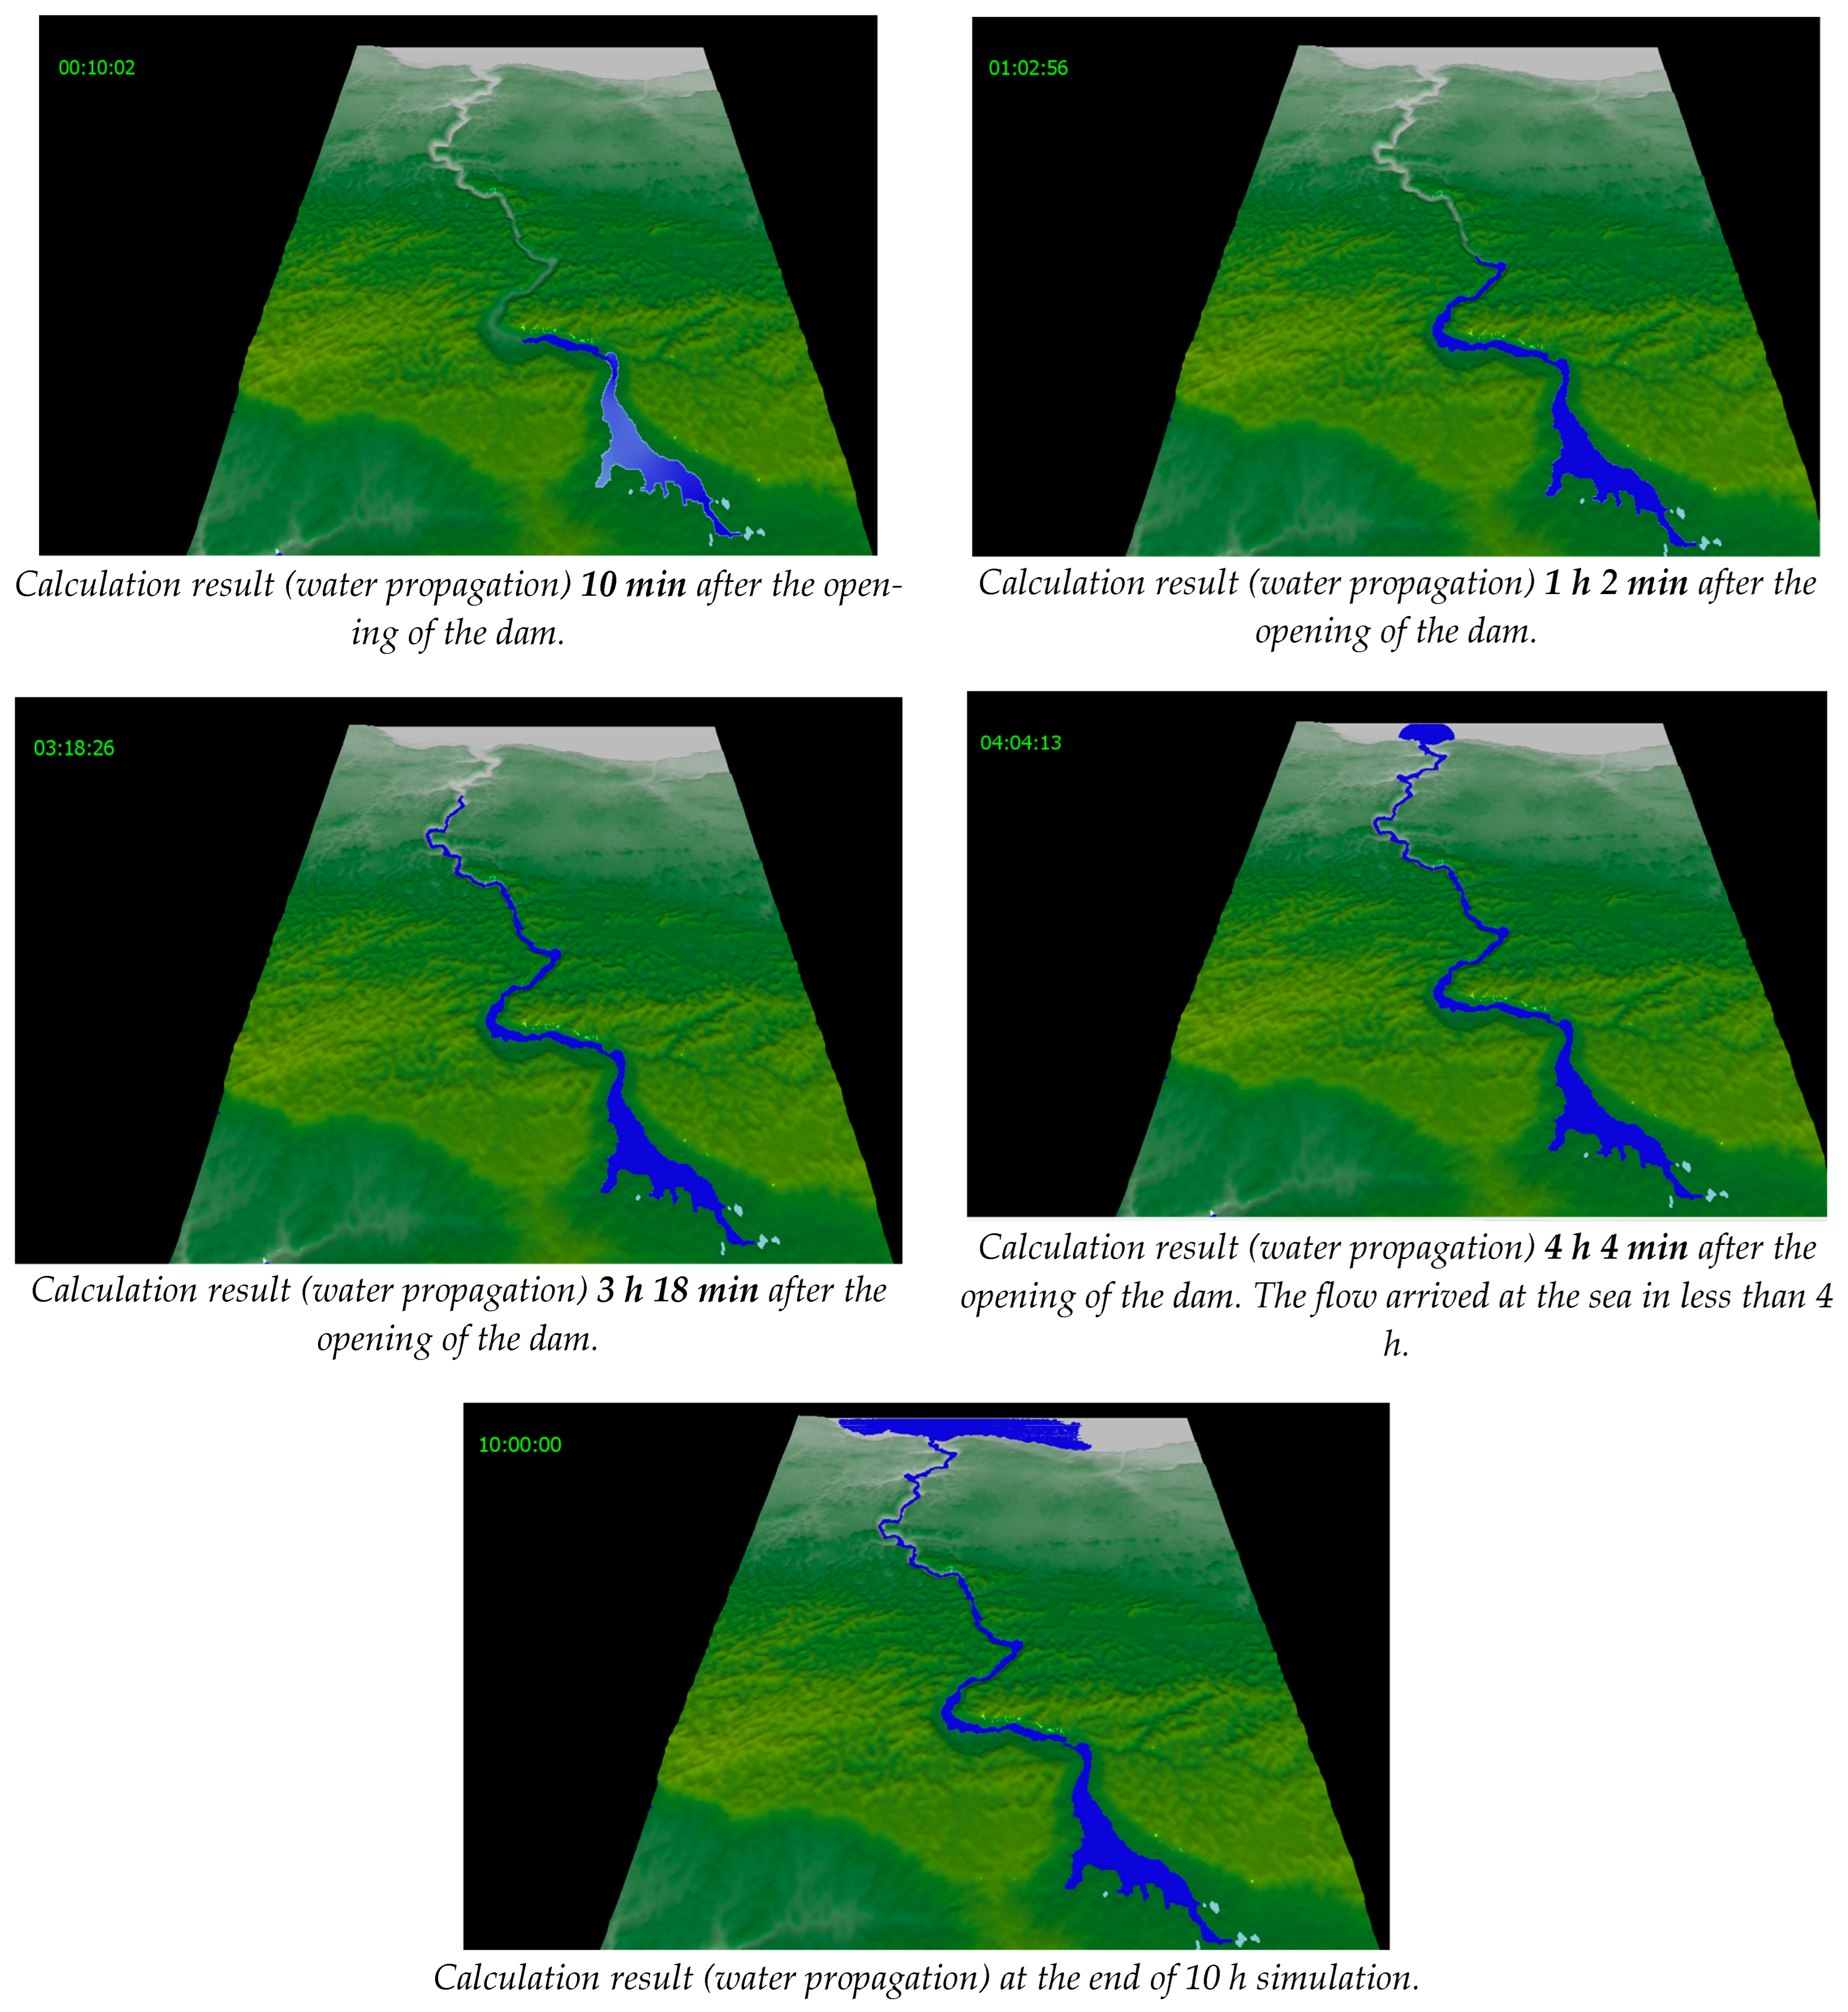
The maximum water depth is shown in
Figure 8 and the resulting water propagation dynamic is presented in
Figure 9.
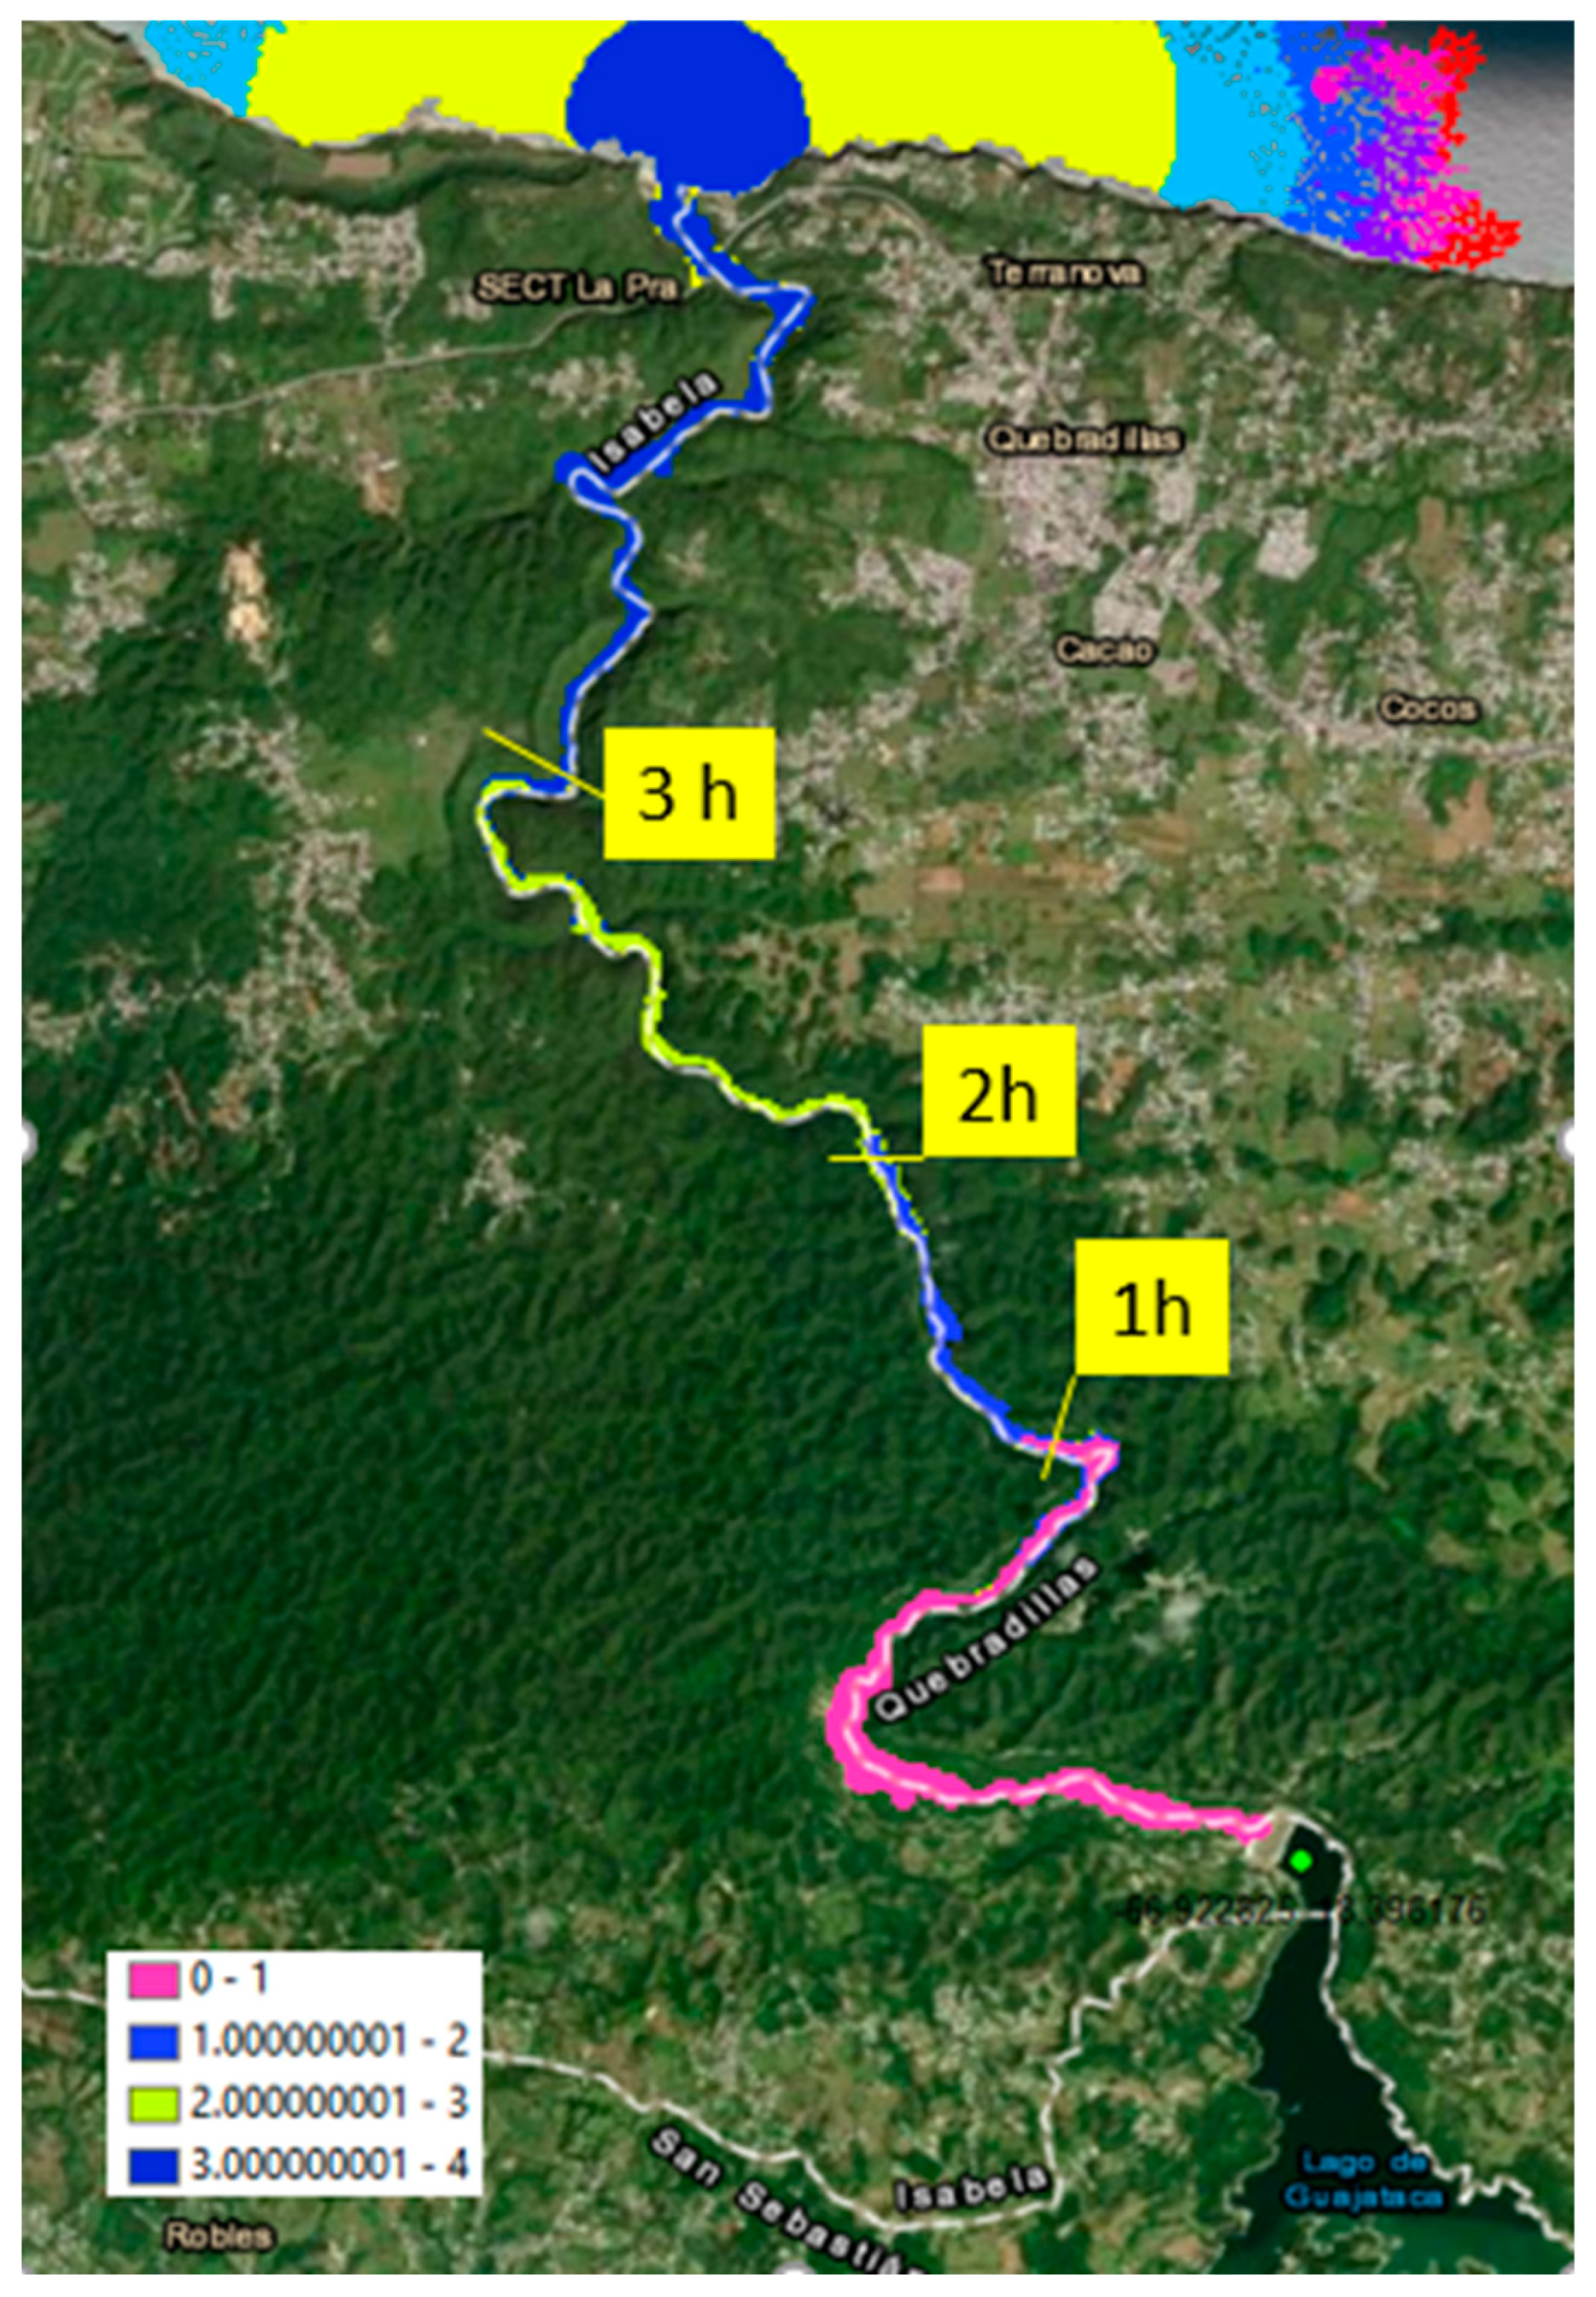
4.2. Calculation of Arrival Time
At the end of the calculation of NAMI DANCE, it is possible to extract the necessary output parameters:
The arrival time is calculated using the calcArrivalTime.py script that establishes for each point the moment when the water level is greater than a threshold that can be varied. The parameters to call the script are:
-d, the base directory. If it is not specified, the current directory is used. The output will be located in that directory;
-s, the step between each point. It is used for very large computations to reduce time;
-h, the threshold water elevation (m) above which the wave is considered as it arrived at that location.
The following example is valid for this command:
The result of running “calcArrivalTime.py” is shown graphically in
Figure 10.
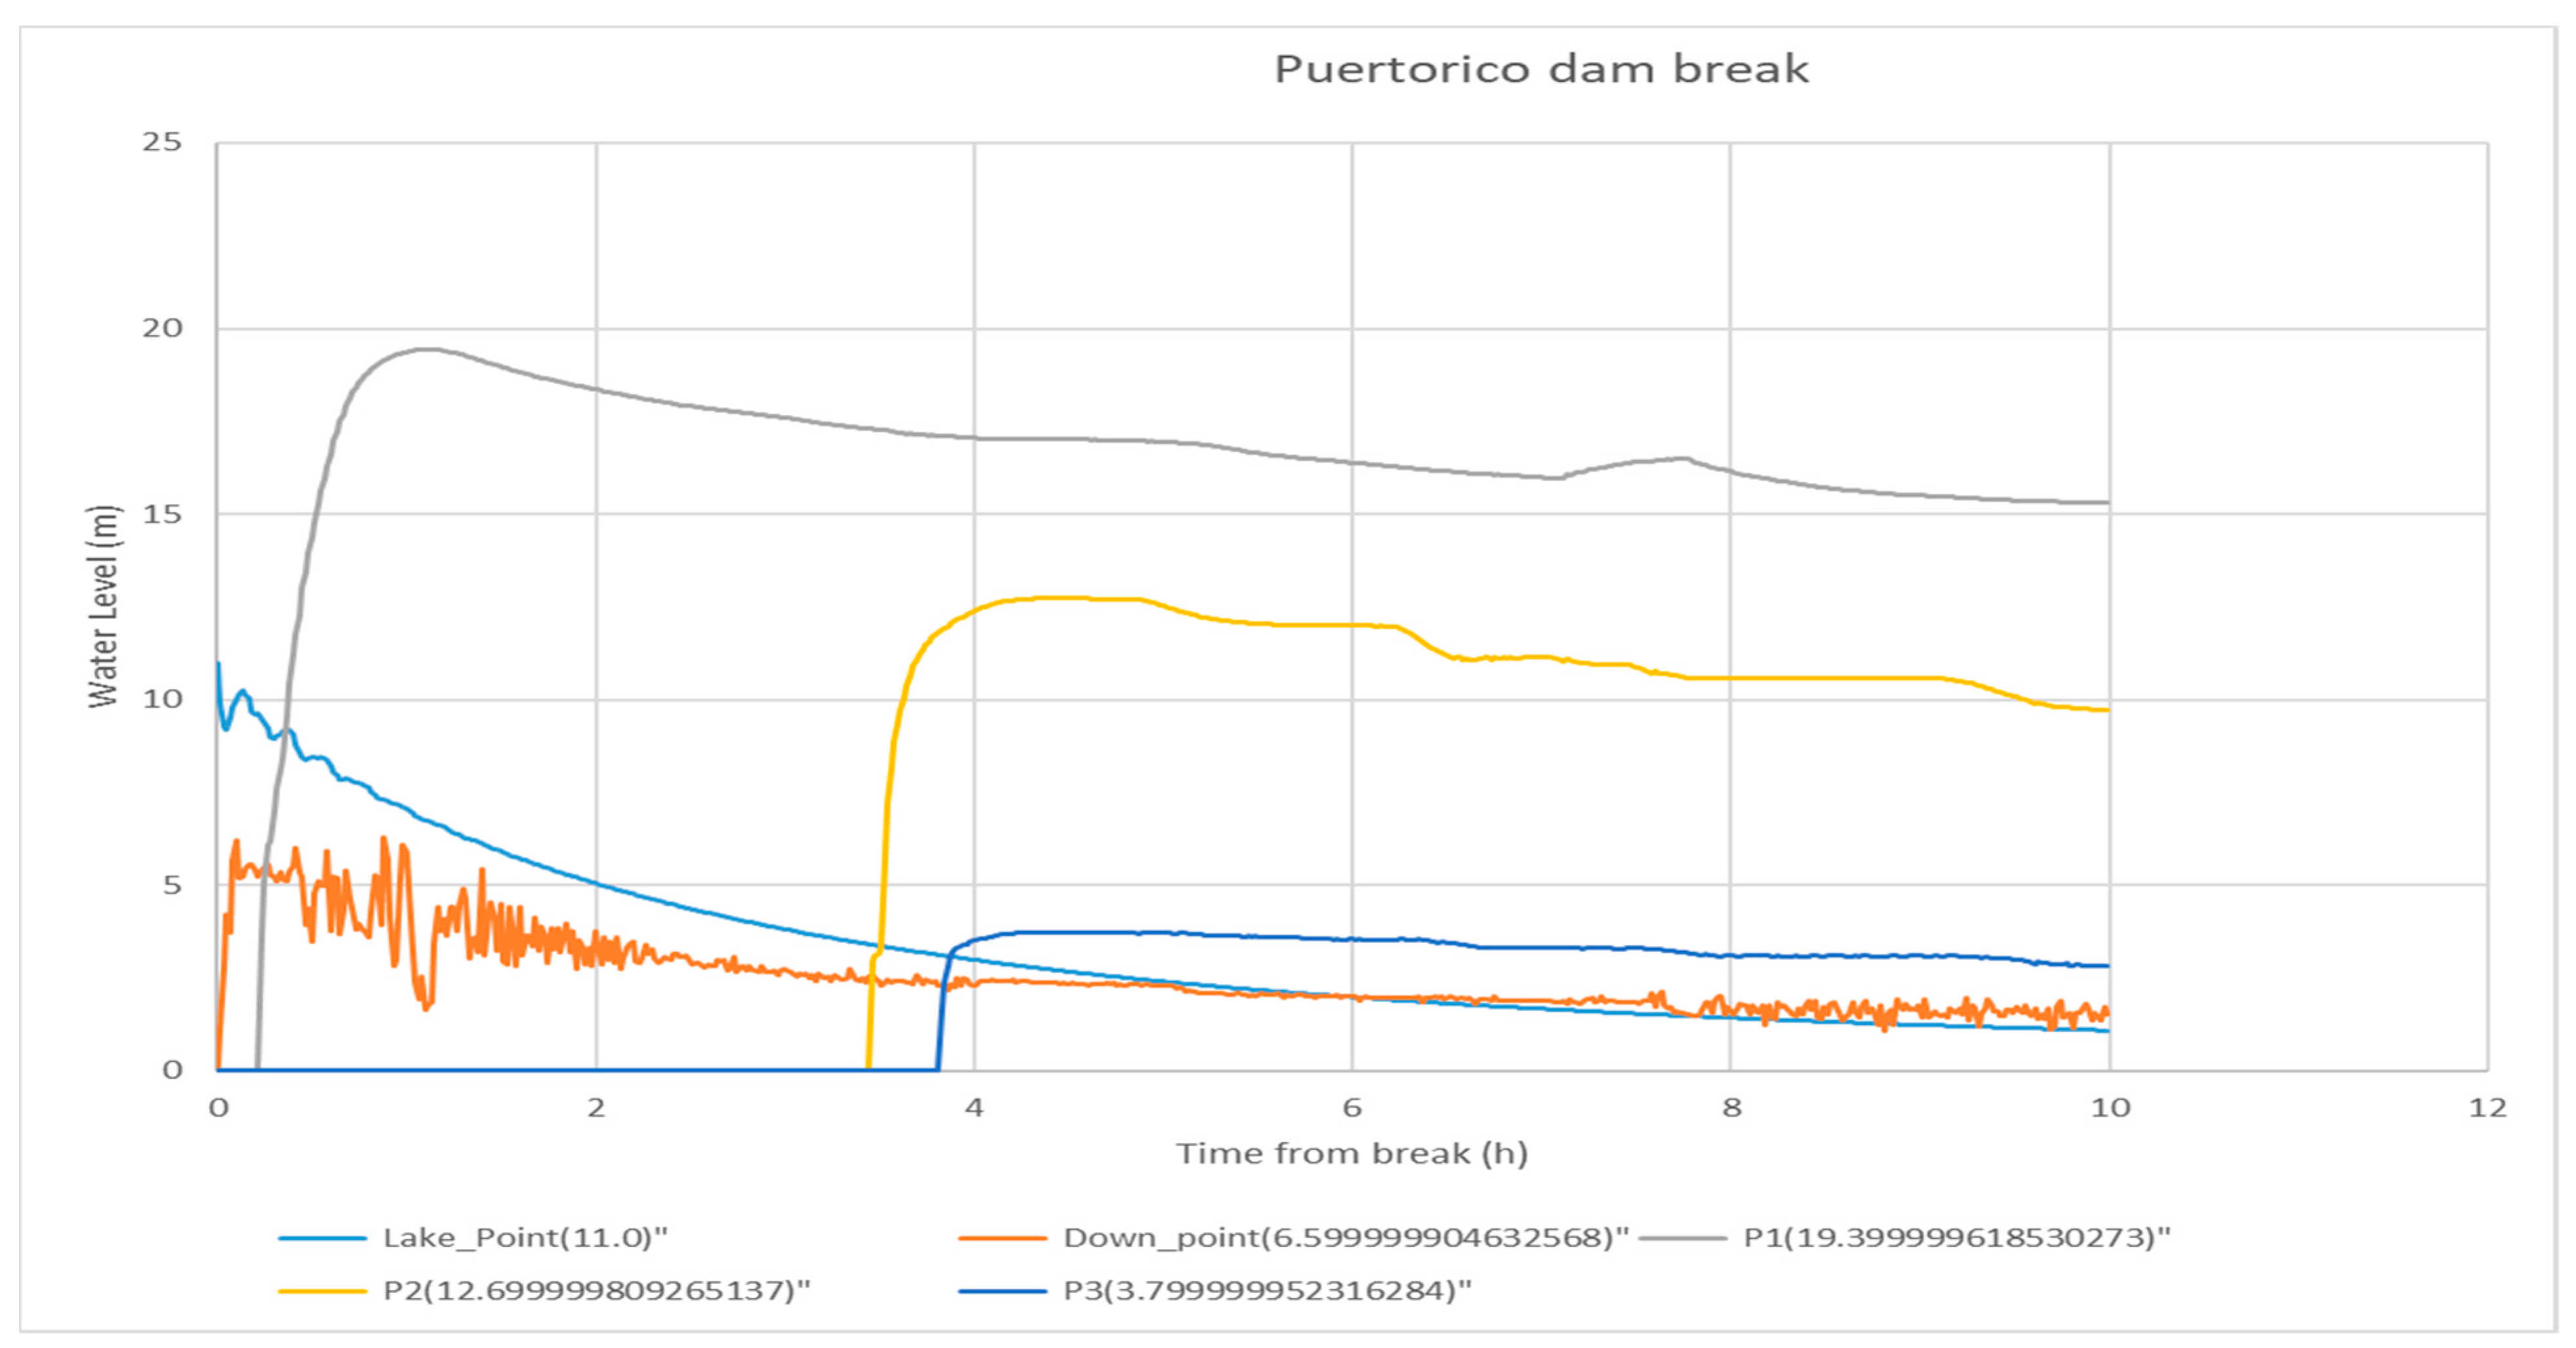
4.3. Extraction of Wave Parameters at Specific Points
The NAMI DANCE code has the ability to provide the text format output which includes the time histories of defined wave parameters at selected numerical gauge (observation) points. However, it is also sometimes necessary to obtain the parameters at other points rather than the initially selected ones and it takes several hours or days to re-compute.
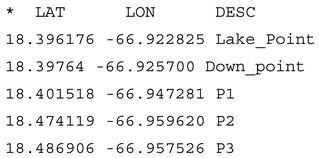
Therefore, the script named “extract.py” reads the output of NAMI DANCE and extracts the timeline from a list of specified points with their coordinates organized in the same way.
So, for this particular case, the file contained the following lines:
The output for the five points indicated is shown in
Figure 11, using the following command:
4.4. Extraction of Population Involved
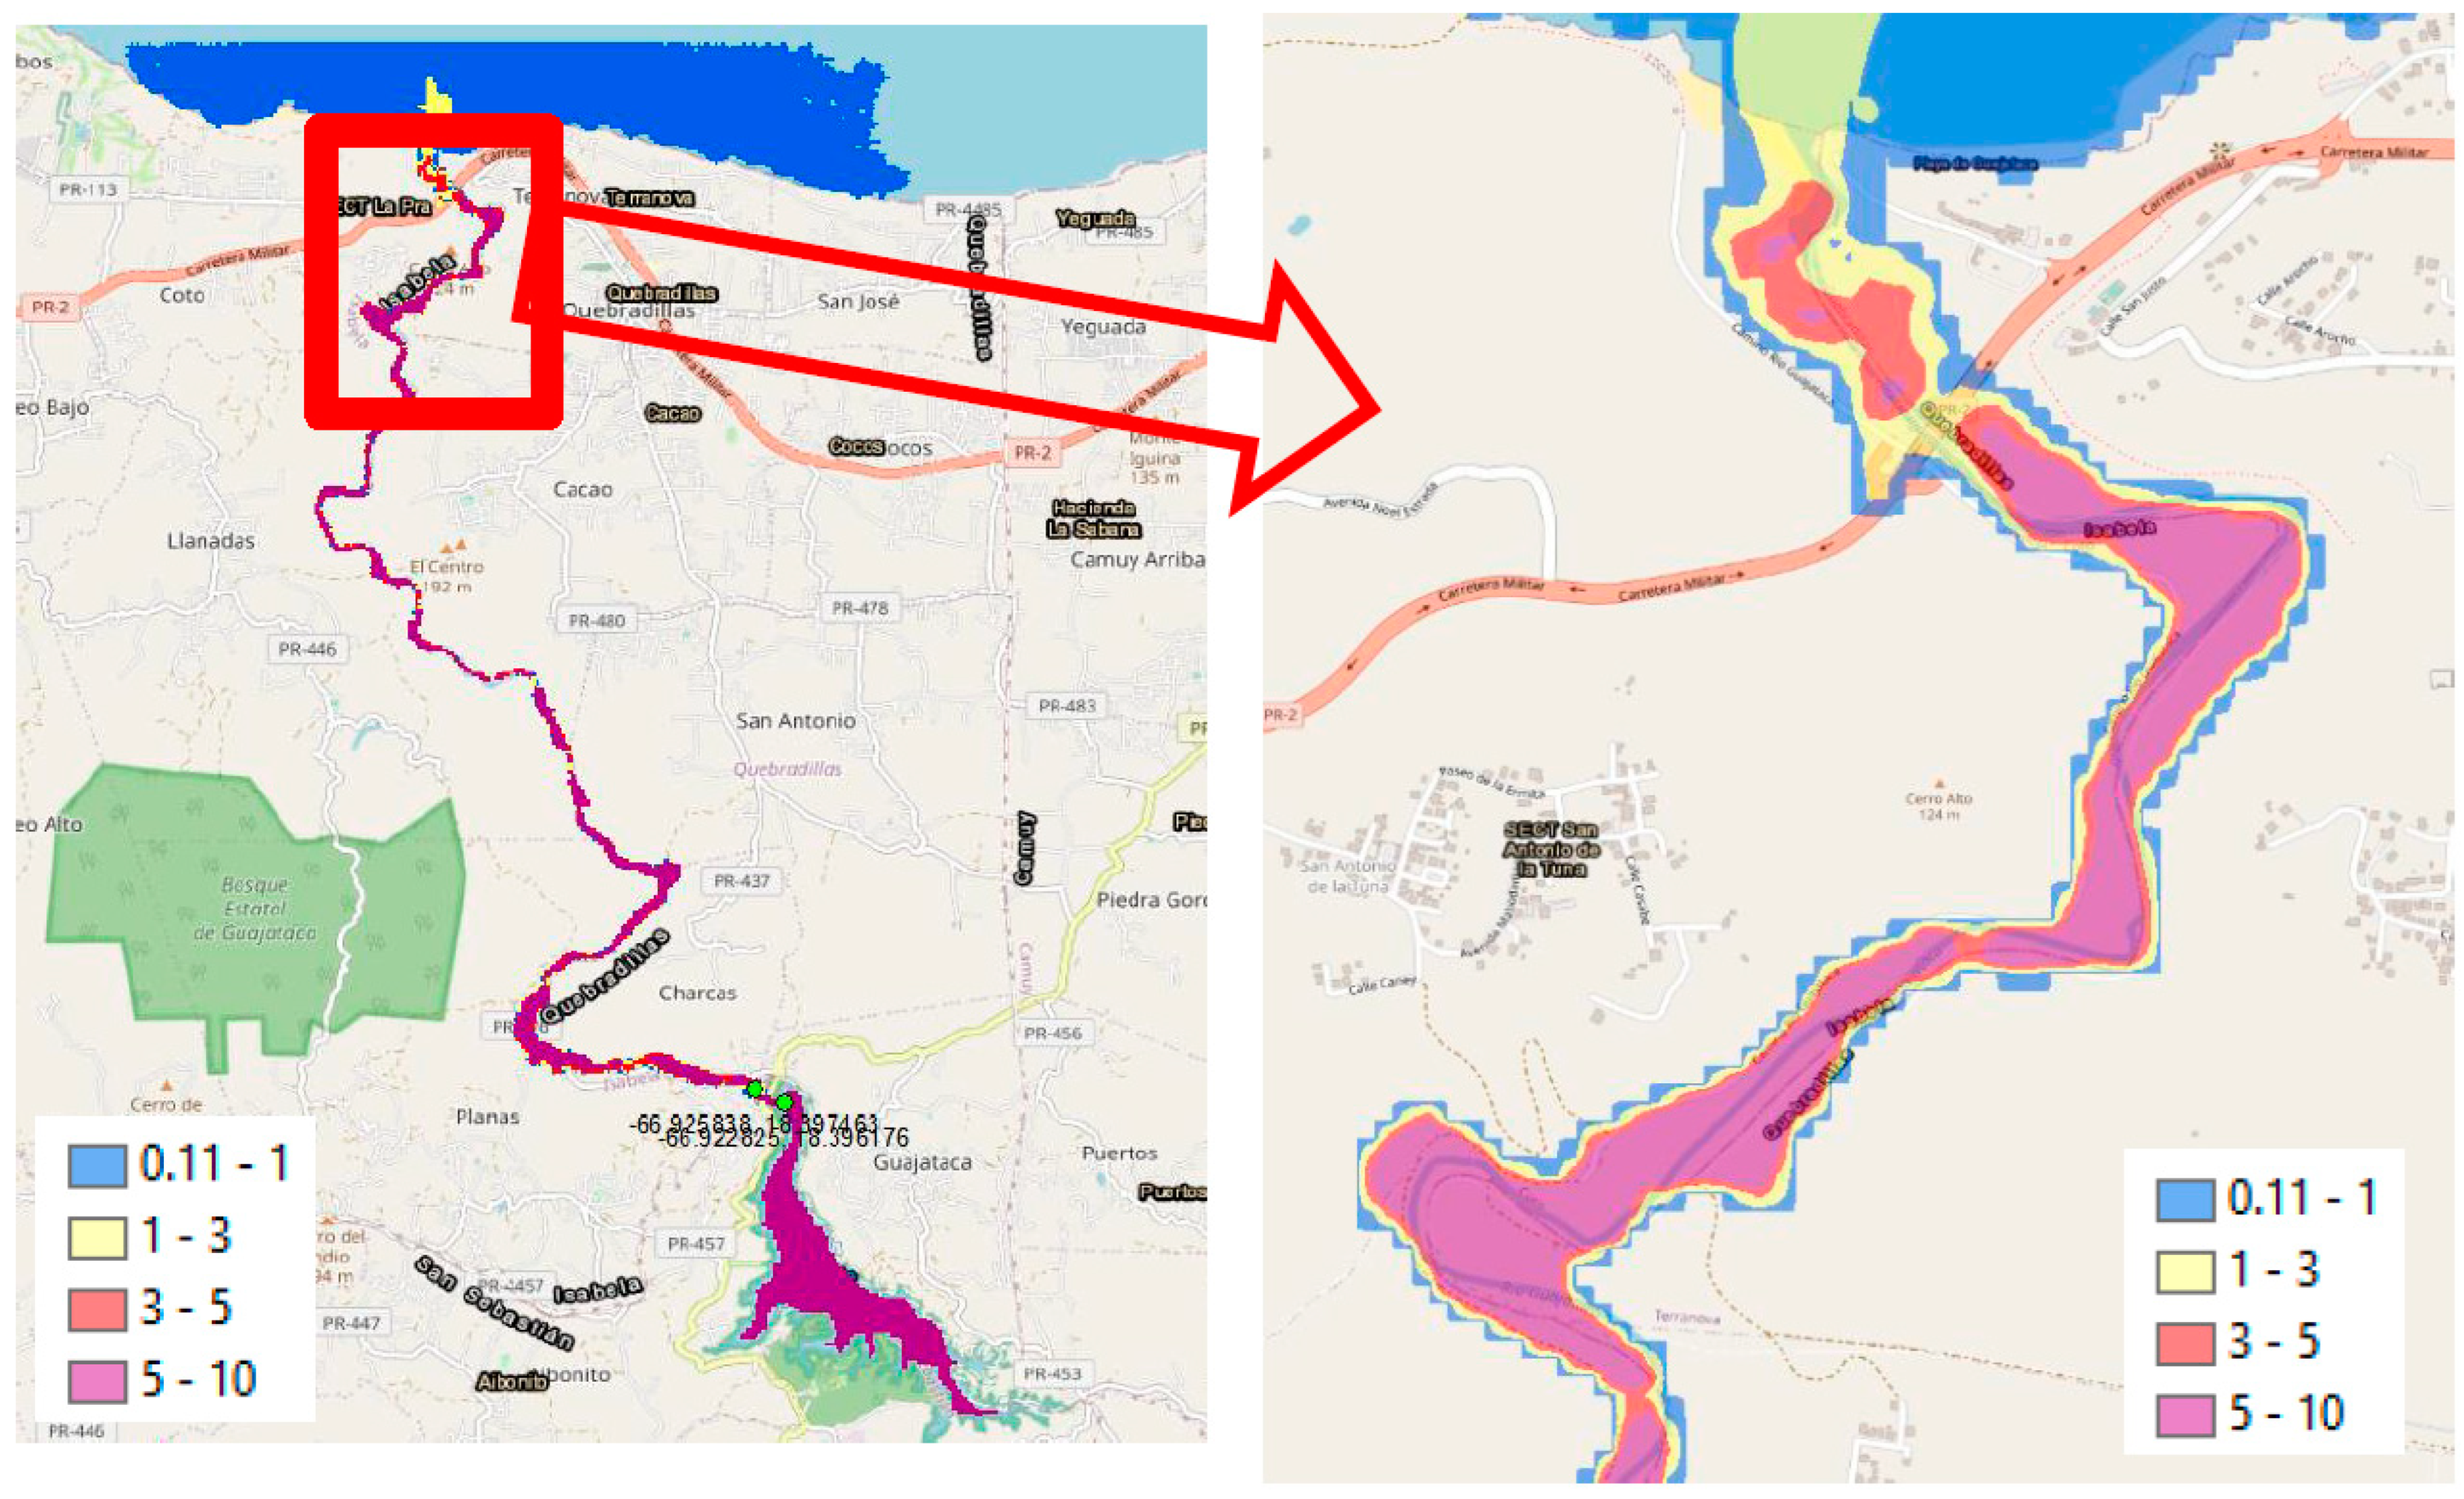
Among the most important quantities to produce from the dam break analysis are the inundation extent and the involved population. The inundation extent is a standard quantity contained in the file OUT-EXTREMUM.nc of NAMI DANCE and represents the distribution of maximum flow depth reached over the course of the simulation.
Using this quantity, it is important to identify how much population is involved. To define this, another script has been developed, named “classifyPopulation.py”, that allows extracting the population based on a predefined class of water elevations.
The script includes the following parameters:
-d, the base directory. If it is not specified, the current directory is used. The output will be located in that directory;
-desc, the description that will be included in the output file;
-fm, the file containing the maximum flow depth. If not specified, it will use by default FD_MAX.tif;
-nc, True or False: if True, the system will look into the directory and search for OUT-EXTREMUM.nc, and from here, it will extract the layer FD_MAX and will write FD_MAX in the base directory. If it is not specified, the current directory is used. The output will be located in that directory;
-p, which is LS or GHSL to specify LandScan or Global Human Settlement Layer population density files. Please note that you need to have those files present in the system.
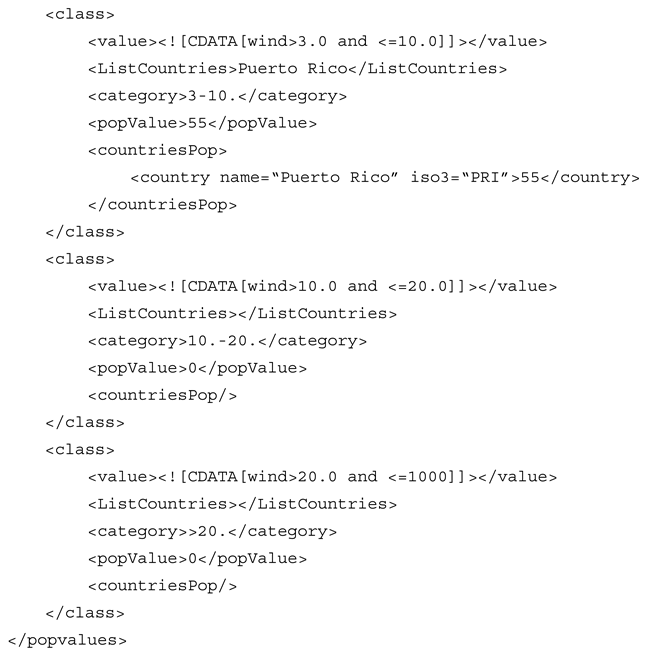
For the example shown, the command is
This will produce the following output in xml format:
Similar values can be obtained by specifying-p GHSL to use the GHSL population density file. Please note that in GitHub, we included only the GHSL file that is freely distributable from JRC.
The file above is represented in
Table 1.
For the calculation of the population affected in the selected case study here, the Landscan 2014 population density file was used. Other types of datasets can also be used. If more than one country was involved, the system would have split the number of people among the various countries.
It is relevant to note that both Landscan2014 and GHSL2015 have a rather coarse resolution, 1 km. To have a more precise estimation of the population, it would be important to use higher-resolution files such as GHSL 100 m or, in Europe, even GHSL 10 m. In such cases, the computational time increases considerably. Those rather coarse-resolution files can be used for a coarse estimation of the involved population.
5. Conclusions
The execution of dam break calculations involves the preparation of input decks needed to be used in a computer code solving the water propagation, a shallow water model in this case. NAMI DANCE is a good option for such cases as it has a Graphical User Interface and hence is easy to use. It is valid and verified, providing reliable results in a short time with high resolution, benefiting from Graphical Processing Unit (GPU) cards. Nevertheless, in case of emergency situations, the bottleneck has always been the time needed for the collection and the adaptation of the input decks that require a few days.
A novel method has been developed that uses a Python script to facilitate the creation of the files required by the NAMI DANCE model and following additional scripts that help in the determination of the output quantities needed to perform a complete analysis of a dam break event.
The quality of the computed calculations has been verified by code-to-code qualitative comparison but not with an extensive analysis of real cases for which some of the needed comparison quantities are available. This may be the subject of a future study that will also involve a detailed comparison with other relevant models such as HEC-RAS.
A number of scripts have been developed to facilitate input preparation and output analysis.
The proposed methodology can help in the future to automatize the analysis of those events in the case of relevant natural disasters, such as a tropical cyclone, that can put in danger the population downstream of big dams; this is particularly true for earth-filled dams that can suffer relevant damage in case of overfilling due to extensive raining in the area. In those cases, automatic systems such as the Global Disasters Alerts and Coordination System (GDACS) could provide immediate (or in a relatively short time) output of the expected consequences from a disaster caused by the dam rupture and inform the population downstream of the potential consequences.


 where:


