Article

Monitoring Soil Degradation Processes for Ecological Compensation in the Izmir Institute of Technology Campus (Turkey)

by
Stefano Salata
1,* and
Virginia Thompson Couch
2
1
Laboratory of Ecosystem Planning and Circular Adaptation—Lab EPiCA, Department of City and Regional Planning, Izmir Institute of Technology, Gülbahçe Campus Urla, Izmir 35430, Turkey
2
Department of Architecture, Izmir Institute of Technology, Gülbahçe Campus Urla, Izmir 35430, Turkey
*
Author to whom correspondence should be addressed.
Eng 2022, 3(3), 325-342; https://doi.org/10.3390/eng3030024
Submission received: 25 April 2022 / Revised: 21 June 2022 / Accepted: 7 July 2022 / Published: 9 July 2022
(This article belongs to the Special Issue Green Engineering for Sustainable Development)

Abstract

:
Monitoring changing environmental conditions for short-term periods is a key aspect of adaptive urban planning. Unfortunately, the official environmental datasets are often produced at too large time intervals, and sometimes the speed of urban transformation requires real-time monitoring data. In this work we employed ESRI ArcGIS (ver. 10.8.1) to process two normalized difference vegetation indices for the campus area of the Izmir Institute of Technology (Turkey). The area of this campus constitutes an optimal site for testing whether alterations to the soil due to excavation and new construction can be monitored in small areas of land. We downloaded two different Sentinel acquisitions from the Copernicus ONDA DİAS platform: one taken on 28 March 2021 and the second taken on 13 March 2022. We processed the images while elaborating the normalized difference vegetation index for both years and compared them. Results demonstrate that all major and minor soil degradations on the campus during the intervening year were detected and empirically quantified in terms of NDVİ reduction (abrupt changes). These findings confirm that detailed seasonal environmental monitoring of every part of the world is now possible using semi-automatic procedures to process original Sentinel data and recommend site-specific ecological compensation measures.

1. Introduction

In a rapidly changing world monitoring the speed and typology of soil degradation can be crucial to establishing adequate local policies and implementing local actions against climate change [1,2,3]. Most research in this area focuses on the anthropization process [4], which causes the worst kind of soil degradation, namely, the phenomena referred to as sealing [5]. However, several less-recognized forms of soil degradation also create serious environmental unbalances [6]. Excavation, or soil compaction due to the periodic transit of car or trucks over unpaved land, such as can be found on construction sites, can reduce the soil’s infiltration capacity, evapotranspiration, and topsoil biodiversity [7,8]. Soil pollution can be tremendously harmful to any human activity [9], and soil erosion [10,11], can cause biodiversity reduction and the loss of organic carbon and soil fertility [12]. All of these degradation processes affect the chemical and physical structure of the soil [13] while impacting the ecosystem’s capacity to perform natural biophysical processes [14,15,16]. It is worth mentioning that good soil management through the recognition and valorization of ecosystem services is widely acknowledged as one of the most effective solutions to climate change [5,17,18]. Although reducing emissions through rapid technological reconversion can play a vital role in climate change mitigation [19], this so-called adaptation must include a more holistic and organic approach to land transformation and soil management [20,21].
An enormous amount of attention has been paid to monitoring the soil sealing phenomena, but still there is much uncertainty about how to best monitor this phenomena and what monitoring methods are useful for establishing a more comprehensive approach to the soil degradation phenomena [22,23,24]. Nevertheless, freely-available remote-sensed geographic information can now support the monitoring process while furnishing a rich amount of seasonal information about the earth’s surface that can be used to establish adequate ecological compensation measures [25,26,27].
Ecological compensation, generally defined as the re-balancing of potential biodiversity loss during land and soil degradation processes [28], is the final and most radical action against soil sealing processes in the “mitigation hierarchy” sequence [29]. When land transformation cannot be avoided, and when mitigation measures are not sufficient to balance residual ecological impacts, creation or restoration of habitats is considered a basic measure to achieve No Net Loss, or result in a net gain, of biodiversity [30]. These practical concerns have been empirically investigated in recent literature on environmental compensation, but there is no common agreement about which type of biophysical assessment can be used as a basic reference [31].
There are at least two aspects to consider: (i) the absence of convergence on empirical assessment of ecological compensation [32] and (ii) the utilization of specific monitoring indicators for ecologic compensation [33]. Regarding the first aspect, a major concern is the effectiveness of the system, which fails to clearly define what No Net Loss means in specific terms [34]. Few studies investigate its operationalization, and there is a high degree of uncertainty about how the system should be measured empirically and how it should be designed to effectively perform nature conservation [31], thus, there is a fundamental need for a standardized measure of the impact by systematic monitoring. Regarding the second aspect, significant differences arise within the scope and kind of indicators that are used to measure the impacts of land-use changes [35]. Soil sealing, tree cover density, habitat quality, carbon sequestration, nutrient retention, water yield, and many other biophysical datasets can be employed to measure the impacts of human-induced land alteration [36]. Among the various kinds of indicators used, a growing body of literature refers to the normalized difference vegetation indices (NDVI). NDVI has been massively discussed in recent scientific bibliography due to its capacity to be employed for different purposes, such as agricultural productivity [37], biodiversity recovery [38], cooling capacity [39,40,41], environmental conservation and valorization [42], afforestation and natural coping capacity [43]. NDVI is also employed globally to monitor drought and to forecast biomass production or desertification [37,44].
In simple terms, NDVI uses near-infrared wavelengths of light to measure the health of vegetation based on how the plant reflects light. Chlorophyll absorbs visible light; therefore, when a plant becomes dehydrated or sick it absorbs more near-infrared light rather than reflecting it. In this way, the presence of chlorophyll is used to indicate the health of vegetation [45,46].
Unfortunately, the application of NDVI to detect landscape changes presents many incongruities. Short-time series are normally used to detect only vegetation changes that occur due to climatic dynamics, while long-time series are used to monitor human-induced changes. The definition of NDVI thresholds for landscape changes is another problem. Considering vegetation by defining different NDVI threshold values such as 10%, 15% or 20% can be considered relevant for short-time monitoring, while defining NDVI threshold values of 25% to 50% can be considered large steps for longer time interval observations [33]. According to this approach, it is commonly used to detect statistically significant differences between NDVI values in small catchment sites while employing standard deviation (z-scores) and probability values (p-scores) at certain confidence levels in small spatial radius (500 m or less) [35].
The Copernicus Sentinel is one of several image acquisition technologies that are freely accessible and it is usable for relatively short monitoring periods [47]. In particular, Sentinel-2 provides high-resolution multispectral imaging especially dedicated to land monitoring, including vegetation, soil and water cover, inland waterways, and coastal areas. The band’s composition varies between 10 and 60 m from the ground resolution, and the multispectral composition allows auto-production of many different environmental indicators [46,48].
The scope of this work is to use the original bands available through Sentinel-2 to provide a relatively short-term (1 year) diachronic spatial analysis based on two different NDVI in a small catchment that has been subjected to various soil degradation processes [42,49,50].
The Izmir Institute of Technology Campus (IZTECH) is located in the Karaburun promontory of western Izmir, directly facing the Aegean Sea [27,51]. The campus, active since 1992, has been built on a typical hilly Mediterranean maquis landscape. In the last year the campus has been subject to various renovation works, including the construction of new buildings, new excavations for construction sites, deposits of construction materials, open space re-design, and the widening of road banks by depositing new raw material. All of these actions caused some soil degradation processes. We chose to monitor these through a one-year comparison between two auto-produced NDVI indices (March 2021 and March 2022).
This paper wants to demonstrate that it is now possible to use Sentinel acquisition worldwide for seasonal monitoring of environmental degradation processes. In addition, it demonstrates that field analysis can be used to integrate a combination of remote-sensed digital indicators for a more qualitative understanding of the soil degradation typologies. Results will be discussed in the light of how and what potential ecological compensation measures should be designed to regenerate the degraded soil, even considering long-term perspectives [52]. In doing this we applied a purely biophysical compensation based on the ecological equivalence principle: we determined how many new green areas should be provided to restore the recorded NDVI losses.
The paper is structured as follows: in the Section 2 we carefully described the ESRI ArcGIS tools that we employed for this research and which processing and post-processing phases we used to obtain the final map of soil degradation. In the Section 3 we briefly described the output of the processing and post-processing GIS phases, in the light of a qualitative field survey of the campus area. In the Section 4 we proposed site-specific ecological compensation measures. Finally, in the Section 5 we summarized the entire process and made some final remarks.

2. Materials and Methods
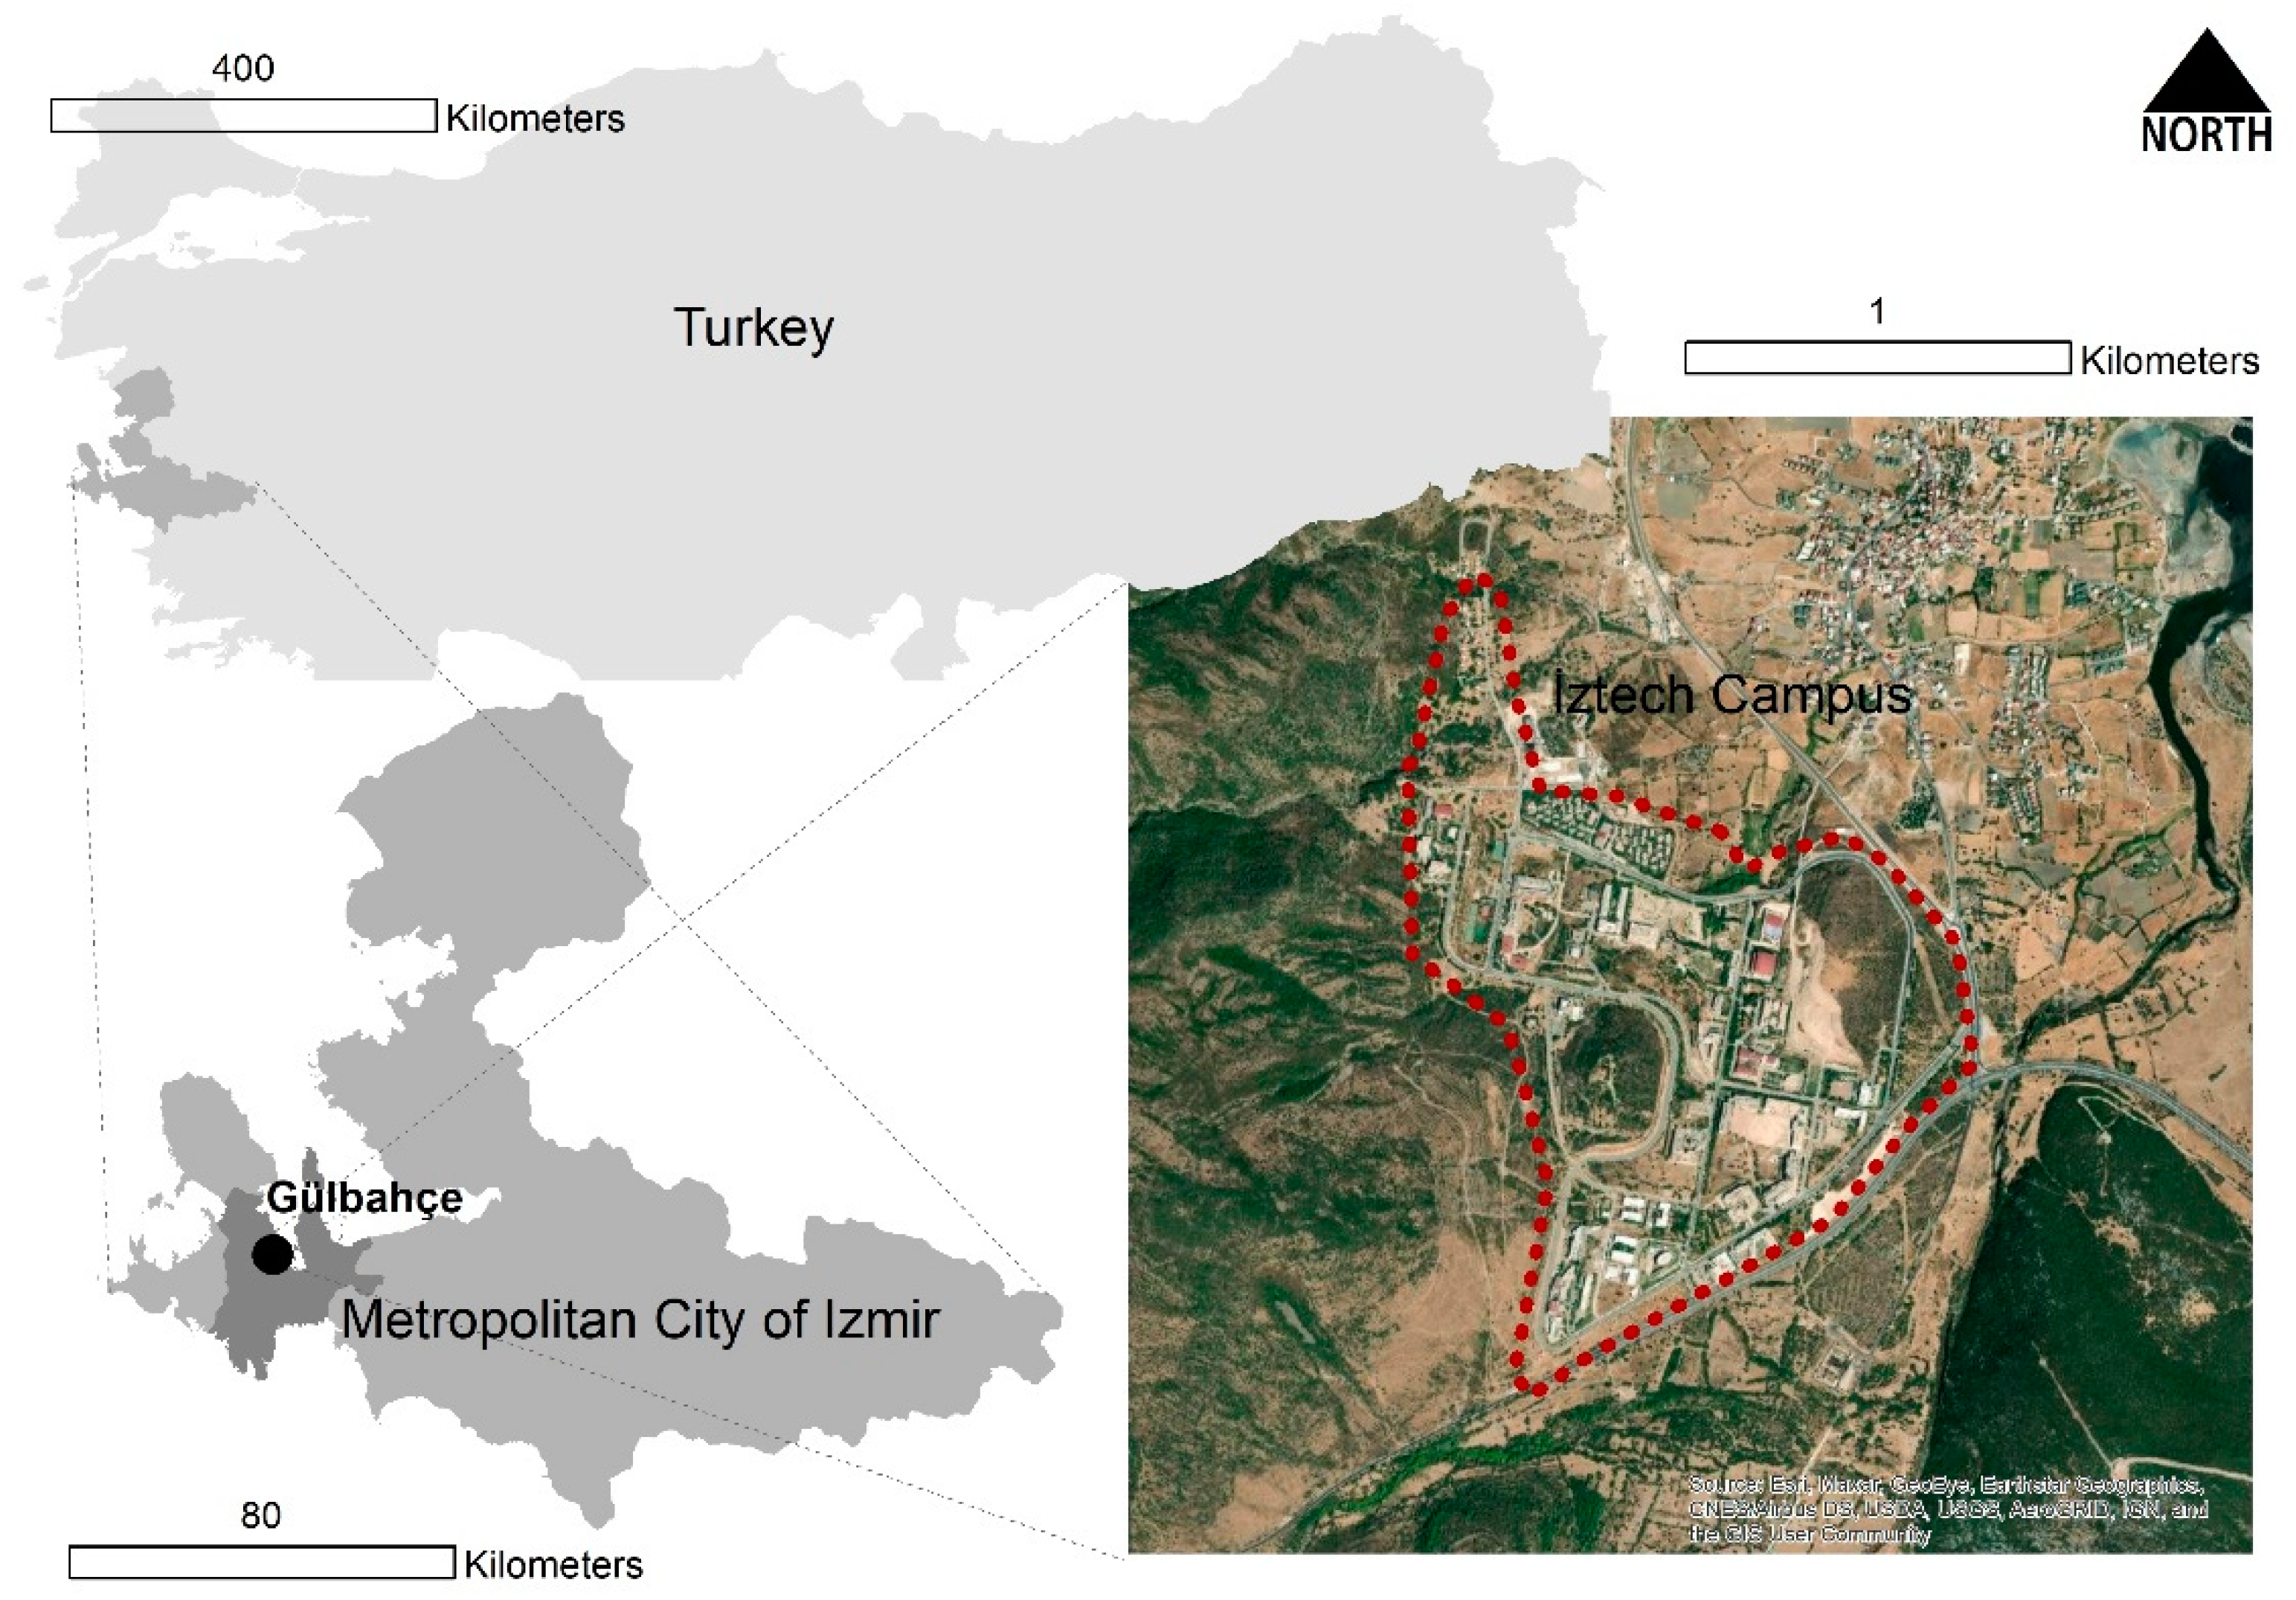
2.1. The Study Site

The Iztech campus currently occupies an area of approximately 151 ha, which is a small portion of the land allocated for the university. The campus is located at an average altitude of 88 m a.s.l. (max altitude 135 m., min altitude 35 m.) on the western part of the Izmir peninsula (see Figure 1) [27,53]. Its exact location is on the eastern margin of the Karaburun promontory, about 45 km from the city of Izmir and near the village of Gulbahce and the bay [54]. The campus counts 158 buildings which were constructed between 1992 and 2021 and is designed around a two-way circular connection road. The campus is accessible by car from two routes, one route that connects the campus to the bay and the second which connects the Izmir-Cesme primary road with the campus. The development of the campus site has taken many years and it is still evolving. New construction sites for new facilities can be seen in various areas of campus today.
The area’s stratigraphy is dominated by a Miocene volcano-sedimentary succession, including several sedimentary and volcanic units developed on top of the basement rocks of the Karaburun Platform and Bornova Flysch Zone [55].
From a landscape point of view the campus is located halfway between the densely vegetated hills of the Gulbahce basin and the flat sedimentary agricultural land of the village. The campus has made a substantial impact on the landscape, creating a barrier to the ecological continuity of the coast. The campus buildings and infrastructure interrupt the seasonal water streams formed by surface flows during the rainy season. These streams, and the natural Mediterranean maquis vegetation, have been interrupted by the campus roads, parking areas, and buildings. Most of the streams have been channelized, and they have lost their original biodiversity, sponge function and ecological integrity.
In this area of the world, which has a strong Mediterranean climatic characterization [23,56], one of the main hazards is the phenomenon of cloudburst rain, which causes flooding and potentially dangerous situations for the population and damage to the settlements [57,58]. Land changes such as the construction of new buildings and roads and the channelization of streams create several landscape equilibrium problems, and an updated and quantifiable land monitoring system is therefore required [59,60].

2.2. Data Collection and Processing

After downloading the original single-band layers from Sentinel-2 our method consisted of a simple processing phase consisting of production of the composite band and calculation of the NDVI for both time thresholds [47,61]. The two NDVI were then superimposed by pixel’s differential spatial analysis and post-processed by the Hotspot technique [62,63,64], which allowed us to identify only the statistically significant NDVI variations on the area.
The methodological process has been initiated by downloading the original Copernicus bands. On the 3 March 2022 we accessed the Copernicus ONDA Dias Catalogue. On the research control panel of the web catalogue we manually selected the western portion of Izmir’s bay and searched for Sentinel-2 L2A Data [47]. Sentinel-2 furnishes multispectral imaging (13 spectral bands spanning from the visible and near-infrared to the shortwave infrared) for land monitoring and delivers high-resolution optical images that range from 10 to 60 m of pixel resolution.
For the year 2021 we selected and downloaded the tile number T35SMC_20210328T085559_10m; for the year 2022 we used tile number T35SMC_20220313T085709_10m. Both tiles are 100% cloud-free, and the images were acquired during the same season (28 March 2021 and 13 March 2022) to avoid any potential bias in the NDVI comparison. NDVI is a seasonal indicator, and its utilization in comparative statistics has to consider the strong influence of the climatic and weather conditions during the acquisition period.
For the processing method we opted for the basic utilization of the ESRI ArcGIS image analysis tool (v. 10.8.1): first we imported the bands 02 Blue, 03 Green, and 04 Red (See Table 1) to the composite band tool and processed these for both years, and then we created the true color images (RGB composite band) of both tiles.
Finally, we resized both images by clipping the original borders of the tiles around the campus area.
Even though the images we used were acquired during the same season (spring) and around the same time of day, we found that the acquisition condition was different between the two colored images. The second acquisition (13 March) was less contrasted and more “flattened” since the light on 13 March and 28 March was different and since the luminosity of the two images was dependent on the humidity and pollution present in the air on those days. Thus, we decided to correct the 2022 RGB multiband raster by smoothly adjusting the contrast (30) and light (12), to gain higher comparability with the 2021 multiband raster. Once corrected, both multiband rasters were employed to calculate the NDVI, simply by adding the Band 8 (Near İnfra-Red) for both years (2021 and 2022). The NDVI tool automatically computes a multispectral image’s normalized difference vegetation index.
To avoid bias in the calculation of differences between the two rasters, we used the NDVI function instead of the Band Arithmetic function. The Band Arithmetic function produces a raster with values between −1.0 and 1.0, and the NDVI function rescales the pixels in a range between 0–255. By using the NDVI function we maintained a positive pixel value that could be compared with a simple subtraction.
The equation used to generate the output is:
NDVI = (B8 − B4)/(B8 + B4) × 100 + 100
where B8 stands for near-infrared band and B4 stands for red band.
The two NDVI were then post-processed by calculating the difference between the pixel values through raster calculator analysis (NDVI 2022—NDVI 2021). Then, to observe the abrupt changes, we employed the Hotspot analysis, thereby avoiding the arbitrary selection of thresholds to consider relevant in calculating the differences (NDVI abrupt changes). Once spatialized, the GİS statistically significant hotspots (abrupt changes) [65,66] were visually checked by a direct survey to observe the sites and identify the soil degradation types that had occurred within the last year.
We chose the Hotspot analysis tool since it is designed to identify statistically-significant clusters of high values (hot spots) and low values (cold spots) by using a confidence level (Gi_Bin) for each spatial feature. The polygons with +/−3 bins reflect statistical significance with a 99% confidence level, thus demonstrating that the concentration of high values in a particular area was not casual.
The Hotspot map helped us understand whether the observed spatial clustering was more concentrated than expected in a random distribution [67,68].
After converting the rasters into polygons, we applied a Hotspot analysis with a 10 m distance band. We then extracted the coldspot (Gi_Bin values −3, 99% statistical significance). In this way we obtained the final spatial localization of statistically significative clusters of abrupt negative changes [69].
As a final rendering procedure, we aggregated the polygons to avoid a pixelated distribution of the futures.
Once the final map had been generated, the NDVI abrupt changes were analyzed by a field survey to gather ground information and discuss potential ecosystem mitigation/compensation strategies.

3. Results

As shown in Figure 2, abrupt changes were recorded diffusely in the campus due to a jeopardized distribution of minor and major new excavation sites, construction areas, and open space design and renovation. Figure 2 represents the RGB images for the years 2021 and 2022, with a comparison of their NDVI indices below. Some differences were directly visible by juxtaposing the pictures, and the NDVI were used to locate and measure abrupt changes empirically.
In Figure 3 and Figure 4 it can be seen that the violet (numbered) areas were extracted from Hotspot analysis while recording a high statistical significance.
We called these hotspots “NDVI abrupt changes” since they represented the small portions of campus land that, according to NDVI analytical comparison, recorded significant decreases in values. Once extracted and analyzed, the selected features decreased the NDVI by about 41% on average. We then concentrated our attention on six selected abrupt change areas:
  • New terraces created in the eastern side of the Faculty of Architecture;
  • The construction site of the new dormitory;
  • New soil remediation area and plantation of trees next to the Faculty of Science;
  • Creation of the road banks along the main drive of the campus;
  • The land erosion process along road near the Rectorate;
  • New construction next to the Electronics and Electrical Engineering Department.
Among the other major and minor interventions on the campus during 2021 and 2022, the six areas selected are the areas that have a greater visual impact on the landscape of the campus. These interventions are part of a broad program for the campus improvement and expansion, and with these areas we provide a clear example of the use of an experimental NDVI monitoring program to establish some mitigation or compensation measures to restore degraded soil.

3.1. Area 1 New Terraces in Front of the Faculty of Architecture

According to NDVI analysis there has been a mean decrease of −52.08 (max variation −68, min variation −37) in this area. These terraces (Figure 5) were created during construction of the adjacent new dormitory (see Figure 6), while moving and replacing excavated soil from the construction site. Replacement of topsoil with new soil and the utilization of these areas as construction material storage created deep topsoil compaction over a few months. The field survey revealed that the terracing system created between October 2021 and March 2022 led to the formation of bare soil that hosts some spontaneous vegetation now in some parts. The areas that are still being used for storage of construction materials are completely unvegetated due to truck and car traffic.
Even though these areas have undergone abrupt changes they represent transitory degradation processes that will vanish once the dormitory construction site ends. A spontaneous process of plant re-colonization by secondary ecological succession will regenerate an initial state of biodiversity which can be accelerated by a sapient reconstruction of the original Mediterranean maquis.

3.2. Area 2–Coonstruction Site of the New Dormitory

According to NDVI analysis the mean decrease in this area has been of −61.14 (max variation −84, min variation −34). This transformation site (see Figure 6) represents the highest soil and landscape impact of the campus projects studied. The new dormitory is built on an extremely vulnerable and delicate part of the campus land. Indeed, the construction site is located on the northern side of the existent public dormitory and it is replacing typical Mediterranean vegetation. The site occupies approximatively 7.5 ha, including building footprint and excavation areas.
In this case, rather than soil compaction and loss of biodiversity, the vast majority of the previously permeable soil has been sealed by concrete and asphalt during an unsustainable urbanization process. Unfortunately, even the orientation of the buildings does not favor the environmental sustainability of this transformation: the main built-up area is located perpendicular to the water stream flow accumulation while generating erosion in the uphill and potential moisture reduction on the soil located downhill, thereby causing biodiversity reduction in the long term. For this specific transformation only ecological compensation measures implemented outside the construction site might possibly equalize the environmental damages caused by the new buildings.

3.3. Area 3–Soil Remediation Area and Plantation of Trees in front of the Faculty of Science

According to NDVI analysis the mean decrease in this area has been of −52.73 (max variation −62, min variation −44). This part of the campus has been used for biodiversity restoration projects, which has led to the new plantation of trees in the central open space in front of the Faculty of Science. Where there was grassland, the soil has been ploughed and prepared for plantation (Figure 7). Unfortunately, trees were planted with lines parallel to the slope direction instead of creating a terraced plantation that could intercept subsurface water flows and reduce run-off while controlling erosion. Nevertheless, this intervention will contribute to achieving higher biodiversity of the campus open space while increasing the canopy and shadowing effects once the plantation reaches maturity.

3.4. Area 4–Banks along the Main Road of Campus

According to NDVI analysis the mean decrease in this area has been of −52.42 (max variation −64, min variation −43). The reconstruction of the road banks is part of a major program to increase pedestrian accessibility to the campus. In this specific area, the northern side of the major road was re-designed and enlarged while the road bank was widened (see Figure 8). The new road bank comprises a compacted bare soil without biodiversity, which replaced a dense spontaneous riparian vegetation that bordered the street in a narrow green strip. Improvement of pedestrian mobility is one of the most important priorities for the IZTECH campus sustainability. Thus, this kind of intervention is made to improve pedestrian mobility in the long term. Nevertheless, this new road bank must be accompanied by the plantation of new autochthonous trees, which can provide shadow and protect the new bank of the road from run-off erosion, create more evapotranspiration and provide shadow for pedestrians.

3.5. Area 5–Erosion along the Rectorate Road

According to NDVI analysis, the mean decrease in this area has been of −50.81 (max variation −60, min variation −32). This area has been subject to two different soil processes: artificial erosion due to excavation and natural erosion on the steep side of the man-made terraces (see Figure 9). In this part of the campus excavation began early in 1992 to create the uphill floodplain for the Rectorate buildings. The natural hill was partially excavated, and the soil was used to level the ground for other building construction on campus. Unfortunately, besides the human-induced erosion, this portion of the campus is also affected by landscape degradation, since the excavation is directly visible from many other viewpoints of the campus. The terraces are composed of a mix of rocks and stones on bare compacted land without vegetation and with low biodiversity. The cessation of excavation, together with some soil consolidation practices, should be considered to re-naturalize these areas.

3.6. Area 6

According to NDVI analysis, the mean decrease in this area has been of −52.97 (max variation −75, min variation −38). This area is similar in some ways to Area 2. Both represent new construction sites, and we can see a non-sustainable process of soil sealing during construction of new buildings, with roads and impermeable materials on the new urbanized blocks (see Figure 10). Here, the original grassland has been deeply excavated and replaced by the concrete foundations of the buildings, with a resultant huge decrease in biodiversity. As in the previous case (the new dormitory), mitigation of the direct impacts caused by the sealing is potentially a way to reduce the environmental impact of this transformation. In addition, some compensation measures of re-vegetation, afforestation or ecological connection in other areas of the campus should be considered, to create an ecological balance for the soil degradation in this area.

3.7. Synthesis of Results

As shown in Table 2 and Figure 11, the boxplot characterization of the pixel-level NDVI difference values in the six areas demonstrates some differences: the maximum impact has been recorded in Areas 2, 6, and 1, which represent cases of sealing, together with compaction. The lowest minimum value was recorded for Area 5 (erosion), while Areas 3 and 4 have the same minimum values (both compaction). The highest average value by far is recorded in Area 2; the new dormitory (sealing) represents the highest impact on the campus in terms of loss of biodiversity.

4. Discussion

The analytical utilization of the NDVI difference can be used to set a short-time monitoring dashboard that can be employed to identify potential compensation measures [70,71]. One of the most common and critical problems of ecological compensation is that there are no objective and analytical methods to estimate the quantity and kind of environmental compensation measures that should be applied to recreate the pre-transformation ecological balance [72]. Ecological compensation has been theorized and applied in many countries [73,74,75]. It may be defined as the creation and restoration of nature to counterbalance the ecological damage caused by soil sealing [76]. Despite the recent attention paid by the environmental planning to use mitigation measures to reduce adverse impacts on natural habitats, it is clear that it is impossible to mitigate the negative effects of soil sealing completely [29]. Therefore, the ecological compensation principle implies that a minimum quantity of biodiversity should be developed aside from the areas directly impacted by the soil degradation. When compensation is defined, the realization of new biodiverse areas should balance the ecological damage, aiming to obtain a ‘no net biodiversity loss’ [77,78].
This auto-produced NDVI method constitutes a pioneering approach to monitoring the biodiversity reduction due to human-induced land alteration processes that cause significant soil degradation. Normally, the quantity and quality of ecological compensation measures rely on the measurement of two different conditions: the ex-ante evaluation of the land characteristic and the ex-post evaluation after the project implementation. Being the empirical evaluation based on the difference between two time series, we can assume that the NDVI loss reflects the change that occurred, considering both the ex-ante characteristics of biodiversity and the ex-post (or ongoing) characteristics of the topsoil.
According to our empirical evaluations, we can classify the soil degradation processes by some numerical characteristics, which helps to measure the impact of biodiversity reduction:
  • The sealing process recorded the maximum NDVI reduction. The maximum decrease in NDVI ranged between −32.9% and −29.4%; besides, the sealing is also characterized by the highest NDVI variance (NDVI absolute difference values range between −37 and −50);
  • The compaction process has a medium impact. The max decrease in NDVI ranges between −24.3% and −26.6%, while the min decrease in NDVI ranges between −14.5% and −17.2%;
  • The erosion process has the lowest impact. The max decrease in NDVI is −23.5%, and the min decrease in NDVI is equal to −12.5%.

4.1. Estimating the Ecological Compensation

Unfortunately, the campus represents a highly fragmented urban landscape, where long distances between densely vegetated spaces and corridors compromise the biodiversity and the thermal comfort for users. Additionally, the ecological fragmentation due to the new transformations reduces the soil’s capacity to mitigate flood risks through enhanced interception and infiltration. New land-use transformations should be designed to maintain a ratio between paved and unpaved surfaces that can absorb, filtrate, and store rainwater while reducing the artificialization of natural vegetated streams that augment erosion and pollution. These problems can be partially mitigated by creating semi-natural vegetated corridors that can connect the landscape elements between the campus’s external and internal areas while creating a continuous green network. The green system can act both by reducing the drainage discharge capacity of the artificial channels and at the same time slowing the infiltration of rainwater into the sewerage systems, thus protecting the living environment of the campus and the bay from flooding and water pollution.
Additionally, green mitigation measures created with new urban transformations can play an important social function in proactively stimulating slow mobility, providing new social aggregation in natural spaces that simultaneously provide multiple Ecosystem Services. Also, designing interconnected green spaces can be inclusive for the students, with both large-scale and smaller-scale interventions at the building scale.
The importance of designing and realizing natural green riparian corridors along the streams or the upstream land can produce many regulative effects beyond the re-introduction of the biodiversity on the campus: they can provide a cooling effect and regulate the microclimatic conditions for many species that need refuge from warming.
Green corridors can also include other micro-interventions, such as permeable streets, bioswales, rain gardens, and planted gardens, providing micro passages and habitat values that support biodiversity and allow biota to move, survive, and propagate.
According to the NDVI empirical measurement, to create an adequate counterbalance to the compaction and erosion processes recorded in areas 1, 3, 4, and 5, new, biodiverse areas of 26.000 sqm should be designed and realized on the campus. This compensation measure aims to introduce more biodiversity to existent open spaces while creating more ecological connectivity. Considering the NDVI recorded index on naturally vegetated areas, the re-introduction into the campus of the typical Mediterranean maquis can guarantee an average increase of the NDVI of 20% while rebalancing the soil degradation caused by erosion and compaction. The new green corridors should be designed as continuous linear green infrastructures according to the principle of landscape ecology. Autoctonus strips of trees, plants, or natural Mediterranean vegetation can be designed in the permeable spaces between the buildings to emphasize green connectivity while achieving a unique network.
The design of these green corridors should include a general planting and growth strategy. The selection of plants and the definition of a suitable open green space depends on climate and lighting conditions, soil conditions, and moisture. A good principle is to select, where possible, more drought-resilient native species. The mitigation potential of plants depends on the water management, growth rate, photosynthesis capacity, shadow capacity, aesthetic value, and contribution to urban wildlife habitat.

4.2. De-Sealing and Greening the Campus

According to the decrease of NDVI due to the sealing process, it is suggested to improve the infiltration capacity (de-sealing) for an additional 32,000 sqm. These de-sealing processes can be enhanced through targeted interventions to improve infiltration, reduce run-off, and increase water retention. New permeable areas should replace the existing sealed areas to improve biodiversity performance and create ecological continuity among the main core natural areas internal and external to the campus while facilitating pedestrian connectivity and slow mobility.
Permeable pavements can substitute traditional asphalt with pervious concrete or interlocking and plastic grid pavers. These solutions are particularly effective in reducing the surface run-off. Besides, over the infiltration process, semi-permeable material allows higher evapotranspiration while filtering and storing rainwater.
Examples of well-designed and realized permeable pavements are normally constituted by a surface-gridded or semi-permeable pavement layer on top of an aggregate stone layer with a filter installed at the bottom. The solution can be adopted on all of the paved parts of the campus: all around the buildings, plazas, and main roads and parking areas.
The two combined solutions ((1) biodiverse areas in green corridors and (2) de-sealing), if applied to a general surface of 58,000 sqm (greening 26,000 sqm and de-sealing 32,000 sqm), should guarantee a general upgrade of the NDVI index in the long term which will range between 37% and 42%, thereby compensating for the negative impacts on campus biodiversity that the recorded soil degradation processes have produced.

4.3. Limits and Potentials

As the NDVI is a seasonal indicator, the exact definition of common threshold values used in different cases is arbitrary and not fixed. With this approach we only wanted to demonstrate that abrupt changes can be identified by an auto-produced environmental diagnosis based on Copernicus services. Therefore, we don’t expect the exact definition of ecological compensation measures elsewhere can be estimated using the same observed trends (−32.9% and −29.4% for sealing, −24.3% and −26.6% for compaction, and −23.5% for erosion).
Even if other authors have already practiced this approach for different scopes, we can confirm that NDVI comparison can be used for a relatively short-time monitoring dashboard aimed at verifying the human-induced changes in the landscape and supporting the decision-making for urban planning. The paper demonstrated the validity of this approach also for minor transformations (in terms of size) and tried to heuristically define the characteristics of the degradation process through threshold analysis. At the same time, this method can pave the way for further studies in other geographical and climatic contexts that can employ a similar process and verify abrupt changes in the soil (estimated by NDVI comparison and Hotspot technique) and determined by field survey.
We also believe that the downloading, processing, and post-processing phases can be automatized by simple GIS operations (ModelBuilder or Python).
Even if we consider the results partial and not definitive, we think this first experimental approach is consistent enough to indicate the enormous potential of Copernicus data utilization for environmental diagnosis, land-use changes, biodiversity monitoring, and soil degradation measurement.

5. Conclusions

In this paper we tried to demonstrate how empirical monitoring of environmental conditions is a prerequisite for applying ecological compensation strategies and projects. Unfortunately, as declared in the introduction, environmental monitoring relies on remote-sensed data produced at too long intervals, thus revealing their inefficiency in developing real-time measures and immediately supporting the urban design decision-making process.
As we have pointed out, land-use change causes significant soil degradation processes, among which sealing is the most irreversible. We decided to establish an experimental methodology to build an auto-produced environmental monitoring dashboard in a relatively small catchment: the Iztech Campus in Gülbahçe Village (Izmir, Turkey). The monitoring dashboard was composed of two timeframes of freely-downloaded Copernicus images, acquired on March 2021 and March 2022. We used the ESRI ArcGIS (ver. 10.8.1) image tools to process the original spectral bands and create a multiband raster colored image and a multiband NDVI. We then used raster statistics to calculate the NDVI differences and visualize the Hotspot areas (abrupt changes).
We discovered that three different soil degradation processes are happening mainly in six transformation areas of the campus. We revealed the efficacy of employing NDVI to detect even small changes in the biophysical composition of topsoil due to different kinds of human actions: excavations, new plantations, building construction, or road expansion.
We then empirically measured which range of NDVI losses are caused by the three different forms of soil degradation: sealing, compaction, and erosion.
Finally, according to our analytical evaluation of the NDVI values found in different parts of the campus, we proposed two different ecological compensation measures. At the same time, we determined the amount (58,000 sqm) and the kind of compensation measure (new biodiverse areas and de-sealing).
The study demonstrated that the method could support the detailed quantification of land-use change impact even in small catchments and aims to provide a fully-replicable GIS decision-making support system that both private and public institutions can use in their application of ecological compensation projects.

Author Contributions

Conceptualization, S.S. and V.T.C.; methodology, S.S.; software, S.S.; validation, S.S.; formal analysis, S.S.; investigation, S.S. and V.T.C.; resources, S.S.; data curation, S.S.; writing—original draft preparation, S.S.; writing—review and editing, S.S. and V.T.C. All authors have read and agreed to the published version of the manuscript.

Funding

This research received no external funding.

Conflicts of Interest

The authors declare no conflict of interest.

References

  1. Panagos, P.; Imeson, A.; Meusburger, K.; Borrelli, P.; Poesen, J.; Alewell, C. Soil Conservation in Europe: Wish or Reality? Land Degrad. Dev. 2016, 27, 1547–1551. [Google Scholar] [CrossRef] [Green Version]
  2. Paleari, S. Is the European Union protecting soil? A critical analysis of Community environmental policy and law. Land Use Policy 2017, 64, 163–173. [Google Scholar] [CrossRef]
  3. Albert, C.; Galler, C.; Hermes, J.; Neuendorf, F.; Von Haaren, C.; Lovett, A. Applying ecosystem services indicators in landscape planning and management: The ES-in-Planning framework. Ecol. Indic. 2016, 61, 100–113. [Google Scholar] [CrossRef]
  4. Inostroza, L.; Hamstead, Z.; Spyra, M.; Qhreshi, S. Beyond urban–rural dichotomies: Measuring urbanisation degrees in central European landscapes using the technomass as an explicit indicator. Ecol. Indic. 2019, 96, 466–476. [Google Scholar] [CrossRef]
  5. Artmann, M. Assessment of soil sealing management responses, strategies, and targets toward ecologically sustainable urban land use management. Ambio 2014, 43, 530–541. [Google Scholar] [CrossRef] [Green Version]
  6. Crossman, N.D.; Bryan, B.A.; King, D. Integration of landscape-scale and site-scale metrics for prioritising investments in natural capital. In Proceedings of the 18th World IMACS Congress and MODSIM09 International Congress on Modelling and Simulation: Interfacing Modelling and Simulation with Mathematical and Computational Sciences, Cairns, Australia, 13–17 July 2009; pp. 2363–2369. [Google Scholar]
  7. Abdelrahman, M.A.E.; Natarajan, A.; Srinivasamurthy, C.A.; Hegde, R. Estimating soil fertility status in physically degraded land using GIS and remote sensing techniques in Chamarajanagar district, Karnataka, India. Egypt. J. Remote Sens. Space Sci. 2016, 19, 95–108. [Google Scholar] [CrossRef] [Green Version]
  8. Lamandé, M.; Greve, M.H.; Schjønning, P. Risk assessment of soil compaction in Europe—Rubber tracks or wheels on machinery. Catena 2018, 167, 353–362. [Google Scholar] [CrossRef]
  9. Ballabio, C.; Panagos, P.; Lugato, E.; Huang, J.H.; Orgiazzi, A.; Jones, A.; Fernández-Ugalde, O.; Borrelli, P.; Montanarella, L. Copper distribution in European topsoils: An assessment based on LUCAS soil survey. Sci. Total Environ. 2018, 636, 282–298. [Google Scholar] [CrossRef]
  10. Brevik, E.C. The potential impact of climate change on soil properties and processes and corresponding influence on food security. Agriculture 2013, 3, 398–417. [Google Scholar] [CrossRef] [Green Version]
  11. De Sy, V.; Schoorl, J.M.; Keesstra, S.D.; Jones, K.E.; Claessens, L. Landslide model performance in a high resolution small-scale landscape. Geomorphology 2013, 190, 73–81. [Google Scholar] [CrossRef] [Green Version]
  12. Ronchi, S.; Salata, S.; Arcidiacono, A.; Piroli, E.; Montanarella, L. Policy instruments for soil protection among the EU member states: A comparative analysis. Land Use Policy 2019, 82, 763–780. [Google Scholar] [CrossRef]
  13. Borgogno-Mondino, E.; Fabietti, G.; Ajmone-Marsan, F. Soil quality and landscape metrics as driving factors in a multi-criteria GIS procedure for peri-urban land use planning. Urban For. Urban Green. 2015, 14, 743–750. [Google Scholar] [CrossRef]
  14. Lin, S.; Wu, R.; Yang, F.; Wang, J.; Wu, W. Spatial trade-offs and synergies among ecosystem services within a global biodiversity hotspot. Ecol. Indic. 2018, 84, 371–381. [Google Scholar] [CrossRef]
  15. Dearing, J.; Acma, B.; Bub, S.; Chambers, F.M.; Chen, X.; Cooper, J.; Crook, D.; Dong, X.H.; Dotterweich, M.; Edwards, M.E.; et al. Social-ecological systems in the Anthropocene: The need for integrating social and biophysical records at regional scales. Anthr. Rev. 2015, 2, 220–246. [Google Scholar] [CrossRef]
  16. McPhearson, T.; Hamstead, Z.A.; Kremer, P. Urban Ecosystem Services for Resilience Planning and Management in New York City. Ambio 2014, 43, 502–515. [Google Scholar] [CrossRef] [PubMed] [Green Version]
  17. Meerow, S.; Woodruff, S.C. Seven Principles of Strong Climate Change Planning Seven Principles of Strong Climate Change Planning. J. Am. Plan. Assoc. 2019, 86, 39–46. [Google Scholar] [CrossRef]
  18. Moser, S.; Meerow, S.; Arnott, J.; Jack-Scott, E. The turbulent world of resilience: Interpretations and themes for transdisciplinary dialogue. Clim. Chang. 2019, 153, 21–40. [Google Scholar] [CrossRef]
  19. Lugato, E.; Bampa, F.; Panagos, P.; Montanarella, L.; Jones, A. Potential carbon sequestration of European arable soils estimated by modelling a comprehensive set of management practices. Glob. Change Biol. 2014, 20, 3557–3567. [Google Scholar] [CrossRef] [Green Version]
  20. White, I.; O’Hare, P. From rhetoric to reality: Which resilience, why resilience, and whose resilience in spatial planning? Environ. Plan. C Gov. Policy 2014, 32, 934–950. [Google Scholar] [CrossRef]
  21. Redman, C.L. Should sustainability and resilience be combined or remain distinct pursuits? Ecol. Soc. 2014, 19, 37. [Google Scholar] [CrossRef] [Green Version]
  22. Zang, S.; Wu, C.; Liu, H.; Na, X. Impact of urbanization on natural ecosystem service values: A comparative study. Environ. Monit. Assess. 2011, 179, 575–588. [Google Scholar] [CrossRef] [PubMed]
  23. Prăvălie, R.; Patriche, C.; Bandoc, G. Quantification of land degradation sensitivity areas in Southern and Central Southeastern Europe. New results based on improving DISMED methodology with new climate data. Catena 2017, 158, 309–320. [Google Scholar] [CrossRef]
  24. Favretto, N.; Stringer, L.C.; Dougill, A.J.; Dallimer, M.; Perkins, J.S.; Reed, M.S.; Atlhopheng, J.R.; Mulale, K. Multi-Criteria Decision Analysis to identify dryland ecosystem service trade-offs under different rangeland land uses. Ecosyst. Serv. 2016, 17, 142–151. [Google Scholar] [CrossRef] [Green Version]
  25. Panagos, P.; Van Liedekerke, M.; Jones, A.; Montanarella, L. European Soil Data Centre: Response to European policy support and public data requirements. Land Use Policy 2012, 29, 329–338. [Google Scholar] [CrossRef]
  26. Lv, Z.-Q.; Dai, F.-Q.; Sun, C. Evaluation of urban sprawl and urban landscape pattern in a rapidly developing region. Environ. Monit. Assess. 2012, 184, 6437–6448. [Google Scholar] [CrossRef] [PubMed]
  27. Coskun Hepcan, C. Quantifying landscape pattern and connectivity in a Mediterranean coastal settlement: The case of the Urla district, Turkey. Environ. Monit. Assess. 2013, 185, 143–155. [Google Scholar] [CrossRef]
  28. Gastineau, P.; Mossay, P.; Taugourdeau, E. Ecological compensation: How much and where? Ecol. Econ. 2021, 190, 107191. [Google Scholar] [CrossRef]
  29. European Commission. Guidelines on Best Practice to Limit, Mitigate or Compensate Soil Sealing; European Commission: Luxembourg, 2012; ISBN 9789279262104. [Google Scholar]
  30. Artmann, M. Urban gray vs. urban green vs. soil protection—Development of a systemic solution to soil sealing management on the example of Germany. Environ. Impact Assess. Rev. 2016, 59, 27–42. [Google Scholar] [CrossRef]
  31. Blicharska, M.; Hedblom, M.; Josefsson, J.; Widenfalk, O.; Ranius, T.; Öckinger, E.; Widenfalk, L.A. Operationalisation of ecological compensation—Obstacles and ways forward. J. Environ. Manag. 2022, 304, 114277. [Google Scholar] [CrossRef]
  32. Guan, X.; Liu, M.; Meng, Y. A comprehensive ecological compensation indicator based on pollution damage—protection bidirectional model for river basin. Ecol. Indic. 2021, 126, 107708. [Google Scholar] [CrossRef]
  33. Gandhi, G.M.; Parthiban, S.; Thummalu, N.; Christy, A. Ndvi: Vegetation Change Detection Using Remote Sensing and Gis—A Case Study of Vellore District. Procedia Comput. Sci. 2015, 57, 1199–1210. [Google Scholar] [CrossRef] [Green Version]
  34. Wei, X.Y.; Xia, J.X. Ecological compensation for large water projects based on ecological footprint theory: A case study in China. Procedia Environ. Sci. 2012, 13, 1338–1345. [Google Scholar] [CrossRef] [Green Version]
  35. Barbosa, B.; Rocha, J.; Costa, H.; Caetano, M. Uncovering Vegetation Changes in the Urban–Rural Interface through Semi-Automatic Methods. Appl. Sci. 2022, 12, 2294. [Google Scholar] [CrossRef]
  36. Clerici, N.; Paracchini, M.L.; Maes, J. Land-cover change dynamics and insights into ecosystem services in European stream riparian zones. Ecohydrol. Hydrobiol. 2014, 14, 107–120. [Google Scholar] [CrossRef]
  37. Michael Griffel, L.; Toba, A.L.; Paudel, R.; Lin, Y.; Hartley, D.S.; Langholtz, M. A multi-criteria land suitability assessment of field allocation decisions for switchgrass. Ecol. Indic. 2022, 136, 108617. [Google Scholar] [CrossRef]
  38. Gómez-Baggethun, E.; Gren, Å.; Barton, D.N.; Langemeyer, J.; McPhearson, T.; O’farrell, P.; Andersson, E.; Hamstead, Z.; Kremer, P. Urban ecosystem services. In Urbanization, Biodiversity and Ecosystem Services: Challenges and Opportunities: A Global Assessment; Springer: Dordrecht, The Netherlands, 2013; pp. 175–251. ISBN 9789400770881. [Google Scholar]
  39. Langemeyer, J.; Gómez-Baggethun, E.; Haase, D.; Scheuer, S.; Elmqvist, T. Bridging the gap between ecosystem service assessments and land-use planning through Multi-Criteria Decision Analysis (MCDA). Environ. Sci. Policy 2016, 62, 45–56. [Google Scholar] [CrossRef]
  40. Ronchi, S.; Salata, S.; Arcidiacono, A. Which urban design parameters provide climate-proof cities? An application of the Urban Cooling InVEST Model in the city of Milan comparing historical planning morphologies. Sustain. Cities Soc. 2020, 67, 102459. [Google Scholar] [CrossRef]
  41. Zardo, L.; Geneletti, D.; Pérez-soba, M.; Eupen, M. Van Estimating the cooling capacity of green infrastructures to support urban planning. Ecosyst. Serv. 2017, 26, 225–235. [Google Scholar] [CrossRef]
  42. Münch, Z.; Gibson, L.; Palmer, A. Monitoring Effects of Land Cover Change on Biophysical Drivers in Rangelands Using Albedo. Land 2019, 8, 33. [Google Scholar] [CrossRef] [Green Version]
  43. Maragno, D.; Dall’omo, C.F.; Pozzer, G.; Musco, F. Multi-risk climate mapping for the adaptation of the venice metropolitan area. Sustainability 2021, 13, 1334. [Google Scholar] [CrossRef]
  44. Gaiotti, F.; Marcuzzo, P.; Belfiore, N.; Lovat, L.; Fornasier, F.; Tomasi, D. Influence of compost addition on soil properties, root growth and vine performances of Vitis vinifera cv Cabernet sauvignon. Sci. Hortic. 2017, 225, 88–95. [Google Scholar] [CrossRef]
  45. Park, J.H.; Cho, G.H. Examining the association between physical characteristics of green space and land Surface temperature: A case study of Ulsan, Korea. Sustainability 2016, 8, 777. [Google Scholar] [CrossRef] [Green Version]
  46. Tanda, G.; Chiarabini, V. Use of multispectral and thermal imagery in precision viticulture. J. Phys. Conf. Ser. 2019, 1224, 012034. [Google Scholar] [CrossRef]
  47. Salata, S. The Utilization of Supervised Classification Sampling for Environmental Monitoring in Turin (Italy). Sustainability 2021, 13, 2494. [Google Scholar] [CrossRef]
  48. Disperati, L.; Virdis, S.G.P. Assessment of land-use and land-cover changes from 1965 to 2014 in Tam Giang-Cau Hai Lagoon, central Vietnam. Appl. Geogr. 2015, 58, 48–64. [Google Scholar] [CrossRef]
  49. Grillenzoni, C. Adaptive spatio-temporal models for satellite ecological data. J. Agric. Biol. Environ. Stat. 2004, 9, 158–180. [Google Scholar] [CrossRef]
  50. Zhang, J.; Niu, J.; Buyantuev, A.; Wu, J. A multilevel analysis of effects of land use policy on land-cover change and local land use decisions. J. Arid Environ. 2014, 108, 19–28. [Google Scholar] [CrossRef]
  51. Velibeyoğlu, K.; Özdemir, S.; Baba, A.; Arsan, Z.D.; Yazdani, H.; Hazar, D.; Kaplan, A.; Boyacı, M.; Kurucu, Y.; Erdoğan, N.; et al. ‘Urla-Çeşme-Karaburun’ Peninsula Sustainable Development Strategy 2014–2023; İZKA (İzmir Development Agency): Izmir, Turkey, 2014.
  52. Caldarice, O.; Salata, S. Ecosystem service assessment in land use planning decreasing territorial vulnerability. A critical exploration of planning problems starting from the land take regulation in piedmont region, Italy. Valori E Valutazioni 2019, 2019, 22. [Google Scholar]
  53. Velibeyoglu, K. Regional Acupuncture for Izmir Peninsula: Creating Capital Web for Creative Eco-Tourism. J. Environ. Prot. Ecol. 2016, 17, 666–674. [Google Scholar]
  54. Salata, S.; Ozkavaf-Senalp, S.; Velibeyoğlu, K.; Elburz, Z. Land Suitability Analysis for Vineyard Cultivation in the Izmir Metropolitan Area. Land 2022, 11, 416. [Google Scholar] [CrossRef]
  55. Uzelli, T.; Baba, A.; Gül Mungan, G.; Dirik, R.K.; Sözbilir, H. Conceptual model of the Gülbahçe geothermal system, Western Anatolia, Turkey: Based on structural and hydrogeochemical data. Geothermics 2017, 68, 67–85. [Google Scholar] [CrossRef]
  56. Grilo, F.; Pinho, P.; Aleixo, C.; Catita, C.; Silva, P.; Lopes, N.; Freitas, C.; Santos-Reis, M.; McPhearson, T.; Branquinho, C. Using green to cool the grey: Modelling the cooling effect of green spaces with a high spatial resolution. Sci. Total Environ. 2020, 724, 138182. [Google Scholar] [CrossRef]
  57. Salata, S.; Arslan, B. Designing with Ecosystem Modelling: The Sponge District Application in İzmir, Turkey. Sustainability 2022, 14, 3420. [Google Scholar] [CrossRef]
  58. Rosenzweig, B.; Ruddell, B.L.; McPhillips, L.; Hobbins, R.; McPhearson, T.; Cheng, Z.; Chang, H.; Kim, Y. Developing knowledge systems for urban resilience to cloudburst rain events. Environ. Sci. Policy 2019, 99, 150–159. [Google Scholar] [CrossRef]
  59. Yu, M.; Yang, Y.; Chen, F.; Zhu, F.; Qu, J.; Zhang, S. Response of agricultural multifunctionality to farmland loss under rapidly urbanizing processes in Yangtze River Delta, China. Sci. Total Environ. 2019, 666, 136645. [Google Scholar] [CrossRef] [PubMed]
  60. Tan, M.; Li, X.; Xie, H.; Lu, C. Urban land expansion and arable land loss in China—A case study of Beijing–Tianjin–Hebei region. Land Use Policy 2005, 22, 187–196. [Google Scholar] [CrossRef]
  61. Salata, S.; Giaimo, C.; Barbieri, C.A.; Ballocca, A.; Scalise, F.; Pantaloni, G. The Utilization of Normalized Difference Vegetation Index to Map Habitat Quality in Turin (Italy). Sustainability 2020, 12, 7751. [Google Scholar] [CrossRef]
  62. Su, S.; Jiang, Z.; Zhang, Q.; Zhang, Y. Transformation of agricultural landscapes under rapid urbanization: A threat to sustainability in Hang-Jia-Hu region, China. Appl. Geogr. 2011, 31, 439–449. [Google Scholar] [CrossRef]
  63. Wang, Y.; Chang, Q.; Fan, P. A framework to integrate multifunctionality analyses into green infrastructure planning. Landsc. Ecol. 2020, 36, 1951–1969. [Google Scholar] [CrossRef]
  64. Palomo, I.; Martín-López, B.; Zorrilla-Miras, P.; García Del Amo, D.; Montes, C. Deliberative mapping of ecosystem services within and around Doñana National Park (SW Spain) in relation to land use change. Reg. Environ. Chang. 2013, 14, 237–251. [Google Scholar] [CrossRef]
  65. Gunderson, L. Ecological and human community resilience in response to natural disasters. Ecol. Soc. 2010, 15, 29. [Google Scholar] [CrossRef] [Green Version]
  66. Allen, C.R.; Angeler, D.G.; Cumming, G.S.; Folke, C.; Twidwell, D.; Uden, D.R. Quantifying spatial resilience. J. Appl. Ecol. 2016, 53, 625–635. [Google Scholar] [CrossRef]
  67. Bertazzon, S.; Johnson, M.; Eccles, K.; Kaplan, G.G. Accounting for spatial effects in land use regression for urban air pollution modeling. Spat. Spatio-Temporal Epidemiol. 2015, 14–15, 9–21. [Google Scholar] [CrossRef] [PubMed] [Green Version]
  68. Switzer, P.; Green, A.A. Min/Max Autocorrelation Factors for Multivariate Spatial Imagery, Technical Report No. 6; Stanford University: Stanford, CA, USA, 1984. [Google Scholar]
  69. Salata, S.; Grillenzoni, C. A spatial evaluation of multifunctional Ecosystem Service networks using Principal Component Analysis: A case of study in Turin, Italy. Ecol. Indic. 2021, 127, 107758. [Google Scholar] [CrossRef]
  70. Meerow, S.; Newell, J.P. Spatial planning for multifunctional green infrastructure: Growing resilience in Detroit. Landsc. Urban Plan. 2017, 159, 62–75. [Google Scholar] [CrossRef]
  71. Pappalardo, V.; La Rosa, D.; Campisano, A.; La Greca, P. The potential of green infrastructure application in urban runoff control for land use planning: A preliminary evaluation from a southern Italy case study. Ecosyst. Serv. 2017, 26, 345–354. [Google Scholar] [CrossRef]
  72. Ronchi, S. Ecosystem Services for Spatial Planning. Innovative Approaches and Challenges for Practical Applications; Green Ener.; Springer International Publishing AG, Part of Springer Nature 2018: Cham, Switzerland, 2018; ISBN 9783319901848. [Google Scholar]
  73. Ernstson, H. The social production of ecosystem services: A framework for studying environmental justice and ecological complexity in urbanized landscapes. Landsc. Urban Plan. 2013, 109, 7–17. [Google Scholar] [CrossRef] [Green Version]
  74. Messerli, P.; Giger, M.; Dwyer, M.B.; Breu, T.; Eckert, S. The geography of large-scale land acquisitions: Analysing socio-ecological patterns of target contexts in the global South. Appl. Geogr. 2014, 53, 449–459. [Google Scholar] [CrossRef]
  75. Salata, S. Ecologically-Compatible Urban Planning: Designing a Healthier Environment, 1st ed.; Emerald Publishing Limited: Bingley, UK, 2019; ISBN 978-1-78973-784-4. [Google Scholar]
  76. European Commission Towards an EU Research and Innovation Policy Agenda for Nature-Based Solutions & Re-Naturing Cities; Publications Office of the European Union: Luxembourg, 2015; ISBN 978-92-79-46051-7.
  77. Lhomme, S.; Serre, D.; Diab, Y.; Laganier, R. Analyzing resilience of urban networks: A preliminary step towards more flood resilient cities. Nat. Hazards Earth Syst. Sci. 2013, 13, 221–230. [Google Scholar] [CrossRef] [Green Version]
  78. European Commission. FUTURE BRIEF: No Net Land Take by 2050? European Commission: Brussels, Belgium, 2016. [Google Scholar]
Figure 1. The area of interest.
Eng 03 00024 g001
Figure 2. Comparison of RGB (a) 2021 and (b) 2022 and NDVI (c) 2021 and (d) 2022.
Eng 03 00024 g002aEng 03 00024 g002b
Figure 3. The final map of NDVI abrupt changes.
Eng 03 00024 g003
Figure 4. The final map of NDVI abrupt changes.
Eng 03 00024 g004
Figure 5. New terraces created in front of the Faculty of Architecture.
Eng 03 00024 g005
Figure 6. The construction site of the new dormitory.
Eng 03 00024 g006
Figure 7. The new soil remediation area and plantation of trees in front of the Faculty of Science.
Eng 03 00024 g007
Figure 8. Creation of banks along the main road of the campus.
Eng 03 00024 g008
Figure 9. Erosion along the Rectorate Road.
Eng 03 00024 g009
Figure 10. New construction next to the Electronics and Electrical Engineering Department.
Eng 03 00024 g010
Figure 11. New construction next to the Electronics and Electrical Engineering Department.
Eng 03 00024 g011
Table 1. Band’s characteristics.
Sentinel 2A BandsCentral Wavelength (nm)Bandwidth (nm)
Band 2–Blue492.466
Band 3–Green559.836
Band 4–Red664.631
Band 8–NIR832.8106
Table 2. Synthesis of the Areas description.
Area NumberDescriptionNDVI Change
Area 1New terraces created in front of the Faculty of Architecture−52.08 (max variation −68, min variation −37)
Area 2New construction site for the dormitory−61.14 (max variation −84, min variation −34)
Area 3New soil remediation and the plantation of trees in front of the Department of Biology−52.73 (max variation −62, min variation −44)
Area 4Creation of the road banks on the main road of campus−52.42 (max variation −64, min variation −43)
Area 5Erosion along the Rectorate Road−50.81 (max variation −60, min variation −32)
Area 6New constructions next to the Electronic and Electrical Engineer Department−52.97 (max variation −75, min variation −38)
Publisher’s Note: MDPI stays neutral with regard to jurisdictional claims in published maps and institutional affiliations.

