1. Introduction
Modern hydraulic unit (HU) diagnostic systems are equipped with multiple sensors (from 50 up to 300 pcs) which regularly analyze equipment operation data. As with any rotating unit, vibration monitoring plays a significant role in the diagnosis. Unlike other types of non-destructive control, vibration monitoring allows the rotating unit state monitoring directly during operation and not only during equipment shutdowns. The vibration state determines the reliability of the HU operation to a large extent. Increased vibration results in accelerated wear of the critical components and premature failure of the HU [
1,
2]. Vibration, as an integral response of the system to an external impact, together with a number of technological parameters, is an objective indicator of the presence of faults or discrepancies in the operation of the equipment. Therefore, HU vibration monitoring is now an integral part of the safe operation of most HPPs [
3,
4].
Vibration monitoring of the HU provides continuous or periodic measurement of the vibration state, its conversion, processing, recording, archiving, comparison of measured values with threshold values, tracking and qualitative analysis of trends in the changing of vibration parameters, splitting vibration signals into frequency components, generation of warning and alarm signals. Controlled vibration parameters are considered to be:
the absolute vibrations of the stationary parts of the unit (thrust and guide bearing housings, the hydro turbine cover, the spider, the hydro generator stator’s steel structures);
the relative vibrations of rotating elements (usually shaft vibrations near guide bearings).
The measured value can be vibration displacement, vibration velocity, or vibration acceleration. Changes in the status of the hydroelectric unit can be seen from changes in the vibration signals. Vibrations are quantified by comparing with thresholds defined by regulatory documentation [
5,
6,
7,
8,
9], operation experience and manufacturers’ recommendations.
Some fault recognition algorithms based on vibration monitoring data have now been successfully implemented in many hydropower plants operation practice [
10,
11,
12,
13,
14,
15], allowing the detection of a series of dangerous faults:
deviations in the operation of the turbine regulator;
weakening of support structure fasteners;
gap geometry distortion;
shaft line defects;
weakening of the flange joints;
deterioration of kinematics;
modification of the imbalances of mechanical, hydraulic and electromagnetic origin;
excitation of eigenfrequencies, as well as approaching resonant zones, etc.
The data collected by the vibration monitoring system serve as initial information for the diagnostic system, whose main objective is making a diagnosis (HU technical condition assessment). The diagnostic system aims at providing maintenance according to the actual technical condition of the HU, taking into account changes in the energy sector, prevention of industrial accidents and downtimes, lifetime increase, minimization of negative factors affecting equipment operating modes, as well as optimization of operating costs. The diagnostic system objectives (in terms of vibration parameter processing) also include:
interpretation of measurements from the vibration monitoring system;
identification of defects (discrepancies, faults);
identification of the correlation between controlled vibration characteristics and process variables taking daily, seasonal, annual changes into account;
determining the causes of changes in vibrations;
The diagnostic system should also allow trend analysis (short-term and long-term) for each monitored vibration parameter. In case of significant changes, even if the parameter remains in the acceptable value field, the reasons for such changes should be investigated, because unexplained changes may be associated with the beginning critical HU components’ destruction. However, at present, in existing diagnostic systems this function is not generally automated, and finding the causes of changes implies contacting an expert.
Usually, only a small part of the monitoring system data collected is used to diagnose the technical condition of the hydraulic unit, mainly information on the component’s temperature status, change in the gaps between the rotating and stationary parts of the HU, and integral characteristics of absolute and relative vibrations in support structures [
5,
6,
7,
8,
9].
Trends in recent years in the development of monitoring and diagnostic systems for hydraulic units are the expansion of the hardware base and the introduction of digital technologies (for example, Big Data, Machine Learning, Artificial Neural Networks algorithms) for processing the increasing flow of monitoring data [
16,
17,
18,
19], when much less attention is paid to creating new diagnostic rules (new defect recognition algorithms). The systems currently operating at HPPs are essentially monitoring systems with separate diagnostic functions. They have been successful in protecting the unit against critical faults, in generating warning and alarm signals, and in detecting some faults at the qualitative level. However, it is too early to fully diagnose the unit based on the data collected by the monitoring system, for the following main reasons:
the diagnosis is mainly qualitative: presence or absence of imbalance, increased vibration in a specific zone, unfavourable cavitation conditions etc.;
no quantitative force impact effects on equipment, which may in the future make it possible to assess when a defect appears, its danger and development pace, and to predict possible faults in the operation of the hydraulic unit or the time it takes to be in need of repairs long before a warning or alarm signal is generated;
insufficient efficiency in finding faults and defects: HU emergency stops occur [
20] or defects are found during equipment repairs (not predicted by the diagnostic system); this is due to the difficulty in extracting important informative components from the total vibration signal;
inability to identify a number of defects at an early stage of development: often the vibration monitoring system detects a defect only when there are significant changes in the vibration state of the unit, and the size of the defect is already almost critical (immediate stop and long and expensive repairs required);
lack of understanding of the impact of operation on components of equipment (insufficient analysis of the influence of the operation conditions on the values of the control parameters and their change trends);
insufficient consideration of individual characteristics of the hydraulic unit (vibration thresholds are often assumed to be the same for different units or even for different types of units);
lack of information analysis on transient operating modes that play a significant role in the performance and lifetime of an HU.
Relying solely on vibration characteristics, it may be noted that the volume of data from the vibration monitoring system is much larger than what is required to assess the vibration state of the unit in accordance with regulations and currently established criteria. The rest of the pieces of the vibration state monitoring data remain without application in the archives, being often unstructured and unavailable for further analysis. While this article does not purport to cover all factors and all features of monitoring and diagnostic systems, it reflects on some aspects. It offers additional possibilities in the transition from monitoring to full HU diagnostic, referring to examples of analysis of the dynamics of the HU shaft by means of vector diagrams.
2. Object of Research
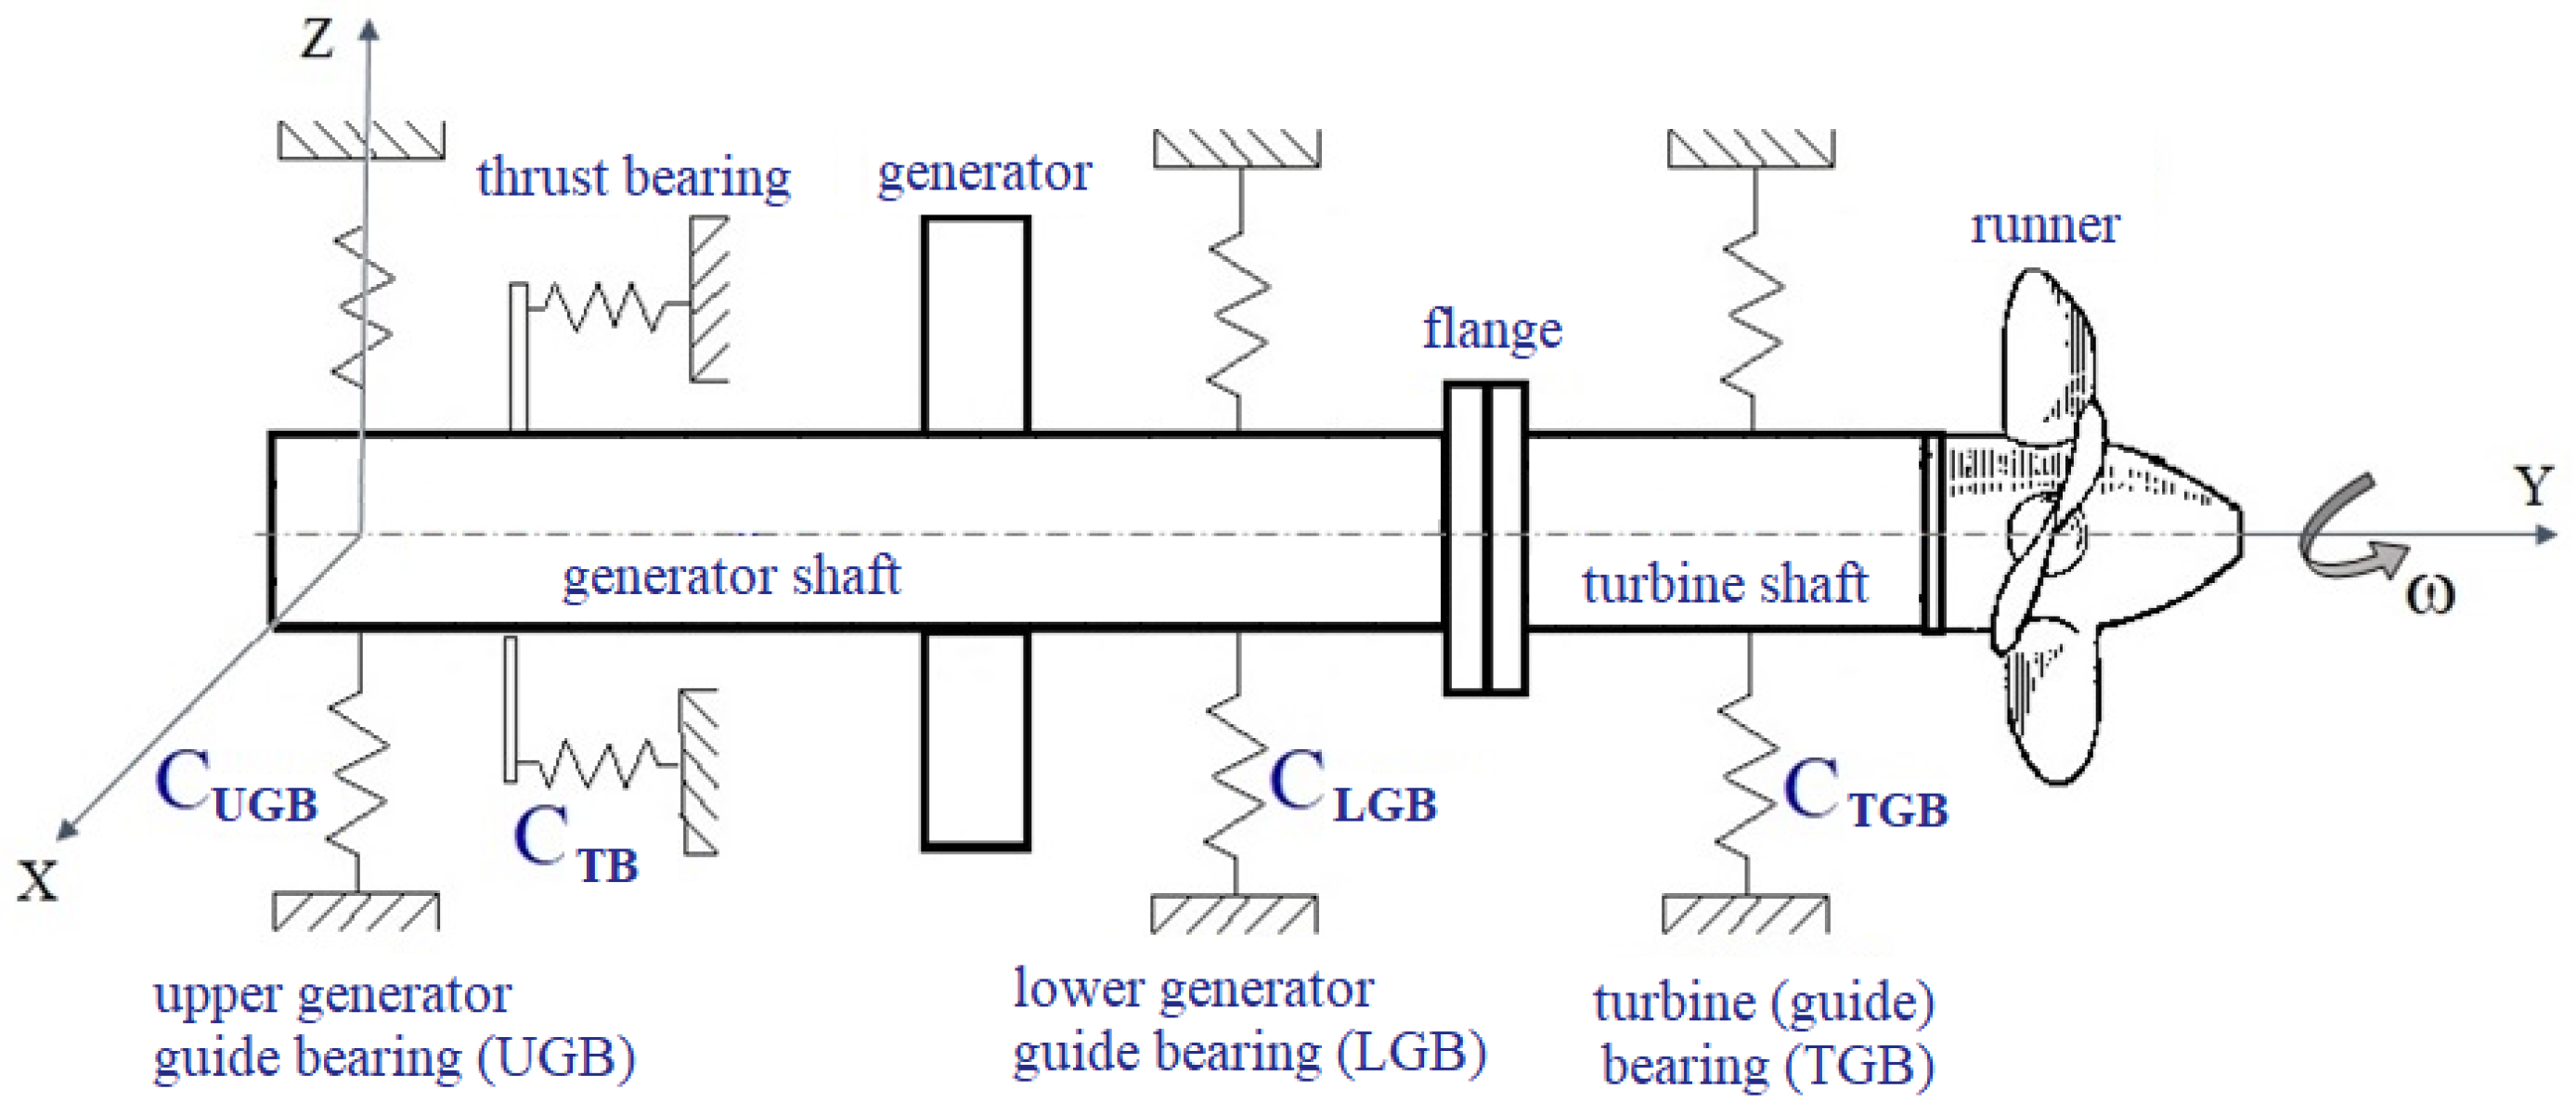
The object of research is a vertical three-point hydraulic unit, installed at an HPP in Russia. The HPP’s head is about 30 m. The unit is equipped with a Kaplan turbine with a nominal capacity of about 80 MW. Kaplan turbine power control is achieved by rotating guide vanes as well as rotating hydraulic runner (HR) blades about its axis. This allows the efficient use of the watercourse, maintaining high efficiency in almost the whole operating range. The HU shaft speed is about 83 rpm. A hydraulic runner has seven blades, approximately 7 m in diameter. The maximum HR blade rotation angle is 35°. The unit’s shaft line consists of a turbine shaft and a generator shaft, firmly connected by a flange joint. The diameter of the turbine shaft along the bearing is 1.23 m. The guide vanes’ quantity is 32. This unit is selected as an example, all conclusions of this article may be extended to other powerful vertical HUs with HR diameters above 5 m, for which the influence of individual characteristics is most pronounced.
Figure 1 shows the HU structural design. The structural design reads: C
TB—thrust bearing (TB) rigidity, C
UGB, C
LGB, C
TGB are the rigidities of the upper generator guide bearing (UGB), the lower generator guide bearing (LGB) and the turbine (guide) bearing (TGB), respectively. Each bearing’s rigidity consists of bearing housing rigidity and bearing liner rigidity, the latter being of crucial importance. For further calculations, the following bearing liner rigidity values were adopted, previously calculated experimentally for the reviewed unit: UGB—0.3·10
6 N/m, LGB—0.5·10
6 N/m, TGB—0.3·10
6 N/m.
3. Vector Diagram Method
The aim is to obtain information on actual operating loads towards the unit shaft and support structures, taking into account existing geometry parameter imperfections (shape distortion of rotor, stator and generator air gap, hydraulic runner, runner chamber and chamber-to-blade gap). For this purpose, the analysis of the amplitude spectrum of the relative vibrations of the generator and turbine shafts is carried out near the guide bearings (UGB, LGB и TGB) specifying the amplitude and the 1st harmonic’s phase. The relative shaft vibration sensors are installed near each bearing in two mutually perpendicular directions: upstream–downstream (US–DS) and left bank–right bank (LB–RB). In accordance with Russian regulations [
8,
9], the normalized relative vibration parameter is the range of vibration displacement (doubled amplitude) averaged over several rotations.
The 1st harmonic usually contributes the most to the total vibration state. Therefore, much determines the force impact on the unit. Most vibration monitoring systems, including old ones, allow the identification of a 1st harmonic with oscillation phase separation. Oscillation phase is important for further analysis because it allows moving on from scalar values (total level of relative vibration) to vector values (amplitudes/phase couple on the phase plane).
The analysis of the spectrum of the relative vibration 1st harmonic is performed on the characteristic operating modes of the unit:
- (1)
run-out from the speed-no-load mode without excitation (free HU rotation before stopping);
- (2)
speed-no-load with no excitation (SNLNE) with nominal rotating speed Nnom;
- (3)
speed-no-load with excitation (SNLWE) at nominal shaft rotation speed;
- (4)
low power parallel to mains operation mode—10–15% of the nominal value Nnom (here taken as 10% of Nnom);
- (5)
medium power parallel to mains operation mode—40–60% of the nominal value Nnom (here taken as 50% of Nnom);
- (6)
high power generator’s parallel to mains operation mode—75–90% of the nominal value Nnom (here taken as 85% of Nnom);
- (7)
full power generator’s parallel to mains operation mode—100% of the nominal value Nnom;
In run-out mode, after distributor closure, the unit is freely rotating at insignificant speed (less than 20 rpm) and not subject to any external effects of hydraulic, mechanical or electromagnetic origin. During run-out, no external forces are applied to the unit, the vibration state is determined only by the geometry of the shaft and the individual characteristics of the HU. This mode is taken as a ‘zero position’ and serves as a reference point for the analysis of all other modes. The force impact on the components of the unit in the remaining modes reveals itself by changing the value and phase of the 1st harmonic relative to the corresponding values in the run-out mode. From the increments of the vibration displacement vectors, the corresponding force impacts on the shaft of the unit can be determined during the transition from one mode to another, and subsequently the load on the HU guide bearings can be determined, their performance and the repairs time needed can also be assessed.
In speed-no-load with no excitation (SNLNE) mode, only centrifugal forces, determined by available mechanical imbalance and speed, are applied towards the HU. Hydraulic forces are not significant and may not be taken into account at this stage, and no electromagnetic force effects are present. The mechanical imbalance is created by the unevenness of the mass distribution in the circumference and manifests itself in the massive parts of the HU (generator rotor, hydraulic runner) in the form of the periodic result force of the rotational frequency. The resulting mechanical force on the hydraulic runner and on the generator rotor, together with the values of bearing rigidities, determines the vibration displacement of the shaft near guide bearings. This displacement is recorded by the vibration monitoring system for two mutually perpendicular directions US–DS and LB–RB.
During the unit’s speed-no-load with excitation (SNLWE) in addition to mechanical forces, electromagnetic fields begin their influence, determined by the electromagnetic imbalance, the eccentricity of the rotor position relative to the generator stator, rotor shape distortion, as well as deformation of the stator and the generator air gap. Consequently, there is an additional resulting force on the generator rotor that has an electromagnetic origin. This force also manifests itself in a periodic impact on HU elements. The cumulative effect of mechanical and electromagnetic imbalance is reflected in the recorded vibration displacement of the shaft near the guide bearings in SNLWE mode.
In parallel to mains operation modes at different power, the hydraulic load from the flow-through path is supplemented. The additional resulting hydraulic force arises as a result of hydraulic imbalance of the hydraulic runner: technological deviations in the grid of the bladed system, imperfections in the fixed part of the flow-through path, misalignment between the axis of the hydraulic runner and the axis of the stator of the hydraulic turbine, distortions of the chamber-to-blade gap geometry, and so on. The hydraulic force, as well as the mechanical and electromagnetic force, creates periodic effects on the supporting structures of the HU. Vibration sensors fix this contribution to the total vibration response in the given modes.
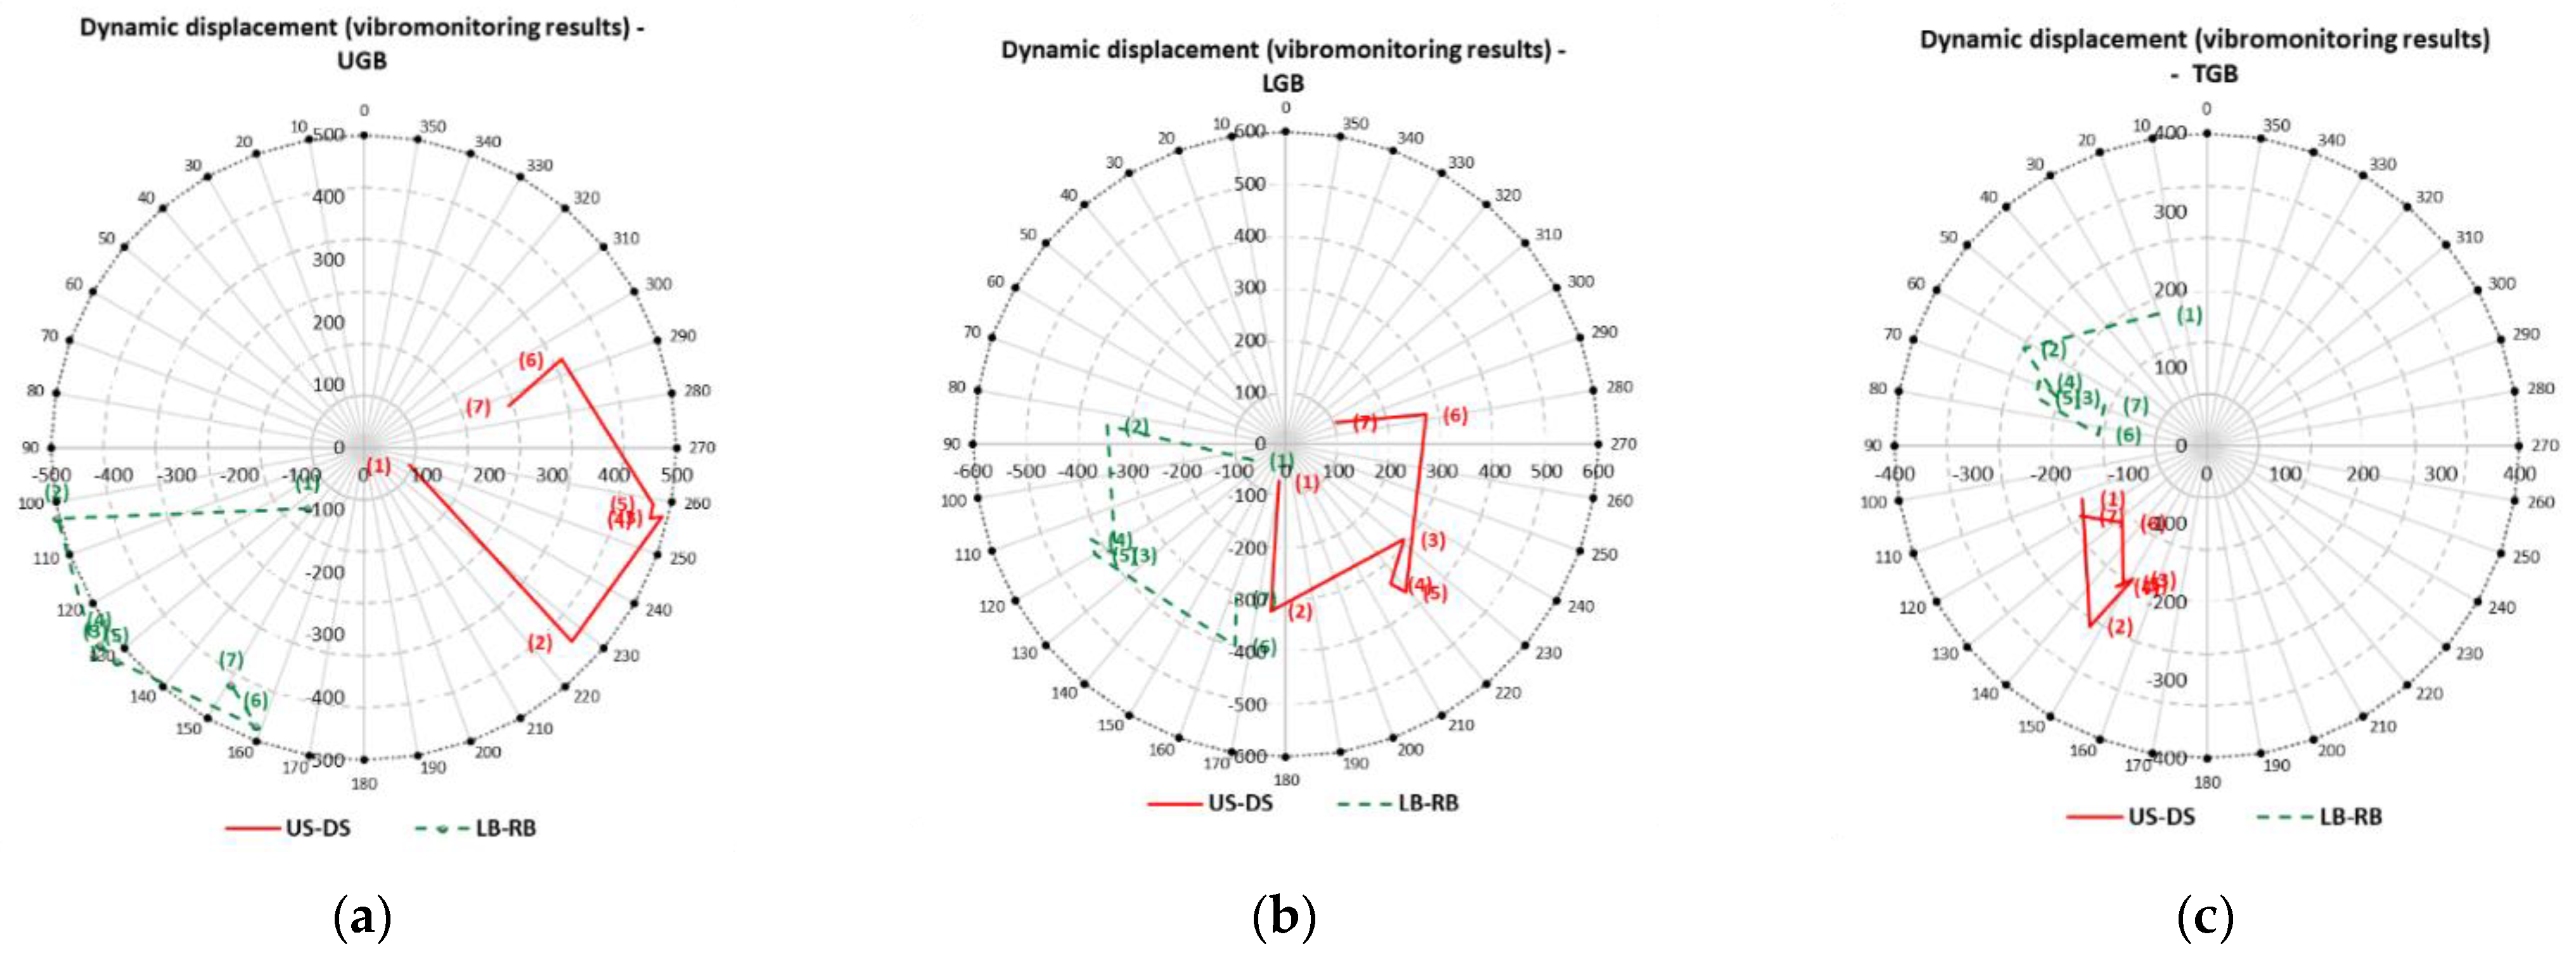
The method of the vector diagrams consists of constructing a broken-line graph on a phase plane, reflecting the dynamic displacement of the shaft in different operating modes according to the data received from the vibration monitoring system. In this case, the vibration displacements (ranges—doubled amplitude) near the three guide bearings (UGB, LGB и TGB) are considered in two mutually perpendicular directions, US-DS and LB-RB. Each point in the diagram is the end of the vector corresponding to the mode with that number. The start of the vector is at the origin. The length of the vector corresponds to the range of the 1st harmonic of the vibration displacement, the rotation of the vector is determined by the phase of oscillation of the 1st harmonic. The vector represents the position of a point on the surface of the shaft close to a specified guide bearing for a given mode in a specified direction. The change in mode leads to a change in the point position and a vector change. The difference vector between the final and initial position of the vectors on the diagram during the change in mode (vector increment) is proportional to the force impact generated by a change in modes. The proportionality coefficient is the value of the liner rigidity of the bearing, near which the vibration displacements are measured. The values of rigidities are presented in
Section 2. The modulus and phase of the vector increment are calculated by vector algebra methods.
The points are sequentially placed on the diagram, which are corresponding to all HU operating modes considered. The lines connect the points and show the variation in the vector when changing from one mode to another. The result is a visual representation of the dynamic displacement of the shaft during operation. Phase plane boundaries (maximum value among the axles) correspond to the threshold values recommended by the manufacturer for the unit: 500 μm for UGB, 600 μm for LGB, 400 μm for TGB.
As opposed to the normative approach [
5,
6,
7,
8,
9], which regulates the assessment of only the total level of relative vibrations and some frequency constituents in order to determine the permissibility or impermissibility of prolonged operation of the HU in a given mode, the vector diagram method provides much more useful information for technical diagnosis.
4. Results
Table 1 gives an example of HU vibration monitoring system data recorded for a specific time: amplitudes and phases of vibration displacement of the 1st harmonic for each of the two mutually perpendicular directions, US–DS and LB–RB, for each of the three guide bearings, UGB, LGB and TGB.
Figure 2 shows vector diagrams of dynamic shaft displacements near guide bearings UGB, LGB and TGB, charted from
Table 1 data for each of the two directions US-DS and LB-RB (source data of the vibration monitoring). The point number in the diagram corresponds to the mode number.
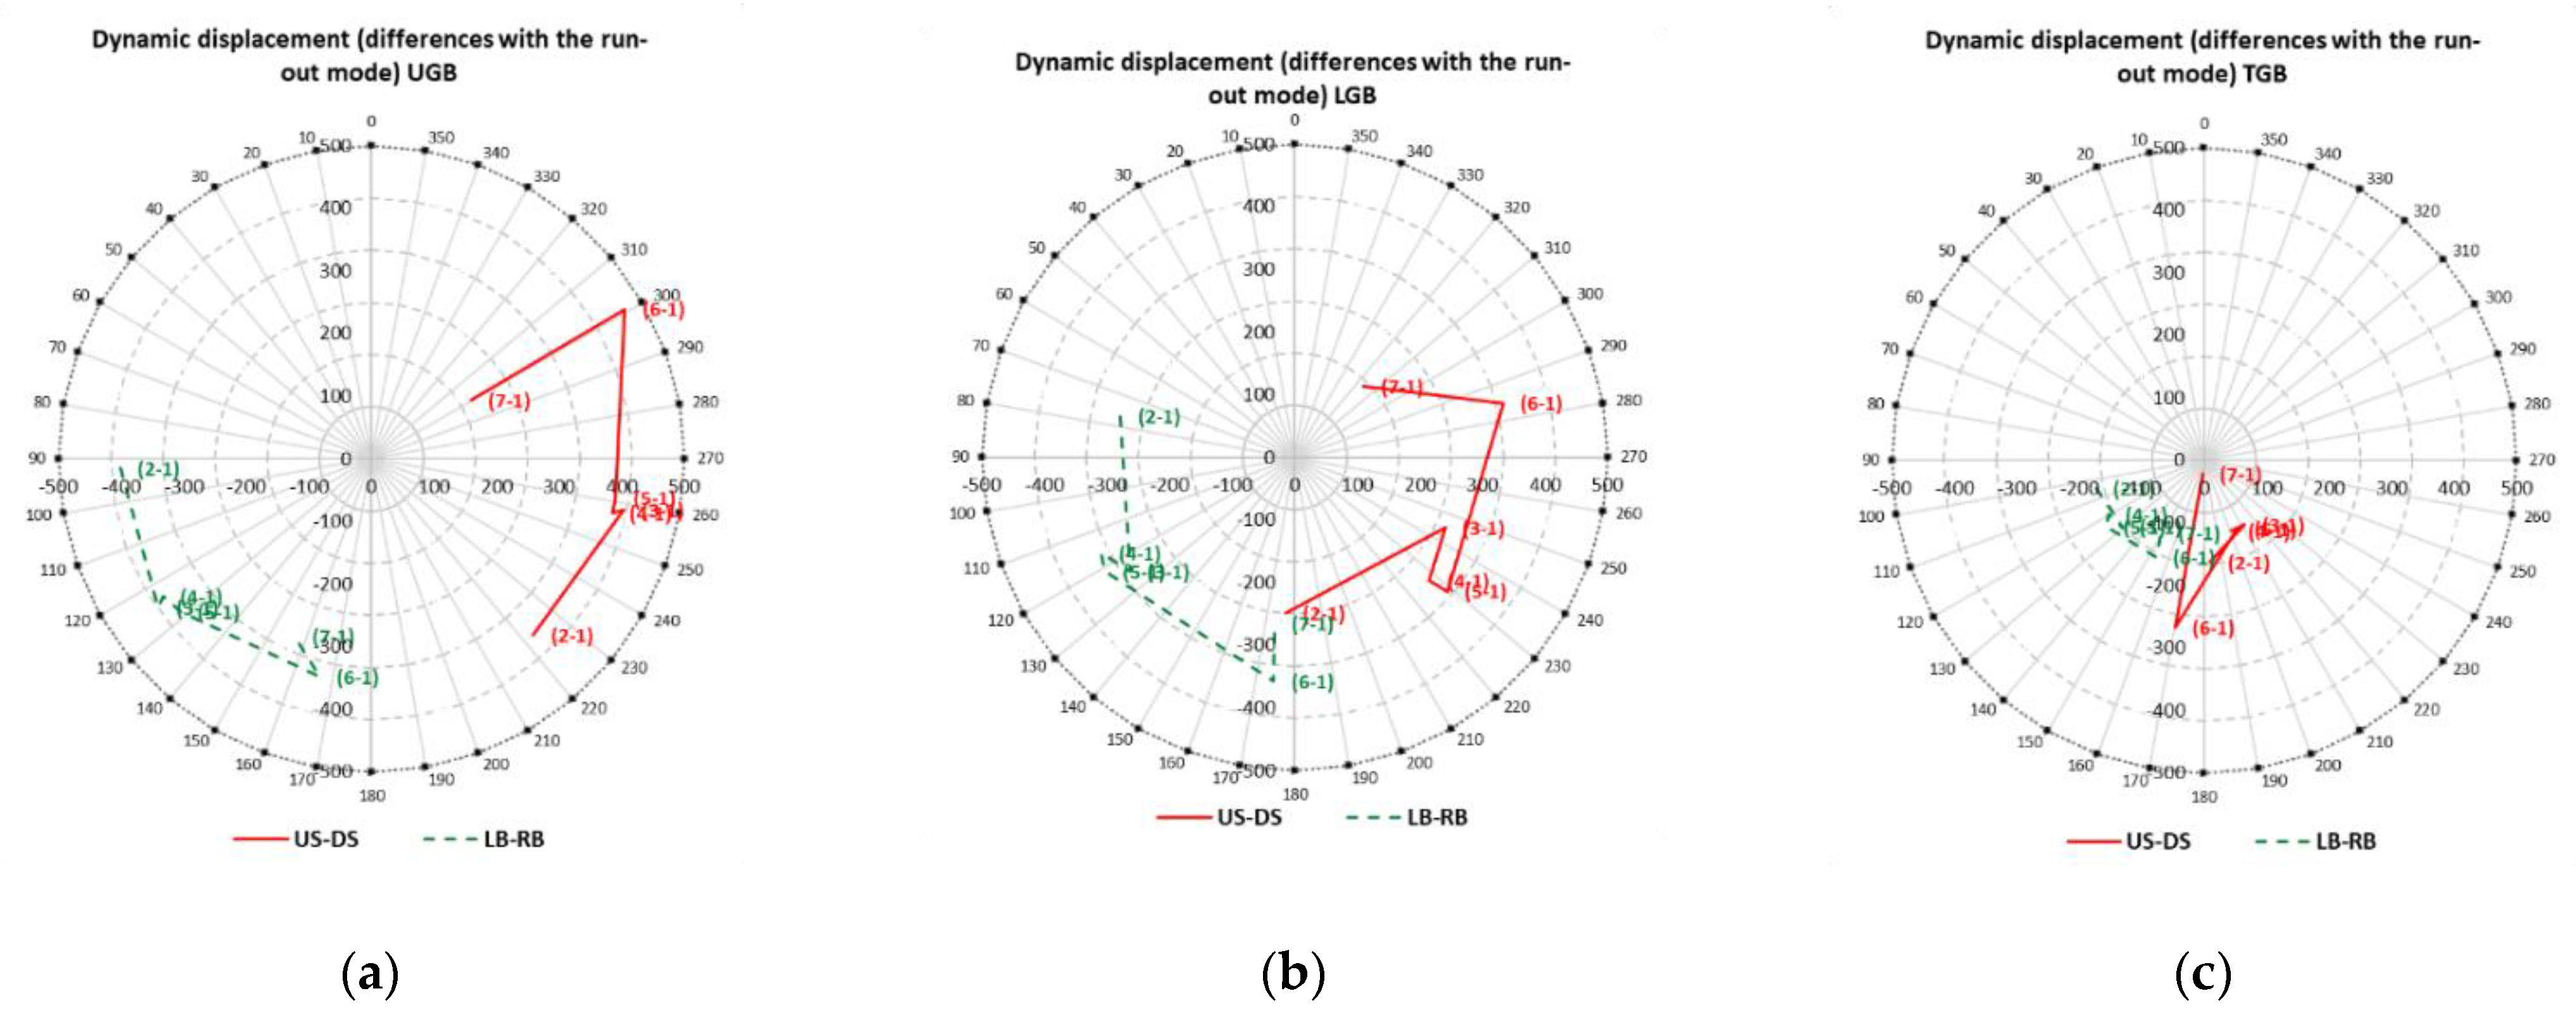
Table 2,
Table 3 and
Figure 3, show the results of the vibration experiment data processing, presented in
Table 1: the vector increment of the 1st harmonic in a given mode relative to run-out, and the increment from external forces of mechanical, hydraulic and electromagnetic origin (force increments). The point numbers in the diagrams are represented by the difference between the initial mode and the run-out mode. Force increments are the vector differences between the respective modes: mechanical—between the SNL
NE mode and run-out, electromagnetic—between the SNL
WE and SNL
NE, hydraulic—between operating conditions at the appropriate power mode and SNL
WE. Separation of force factors by nature of origin makes it easier to determine the cause of increased vibrations than total vibration displacement recording.
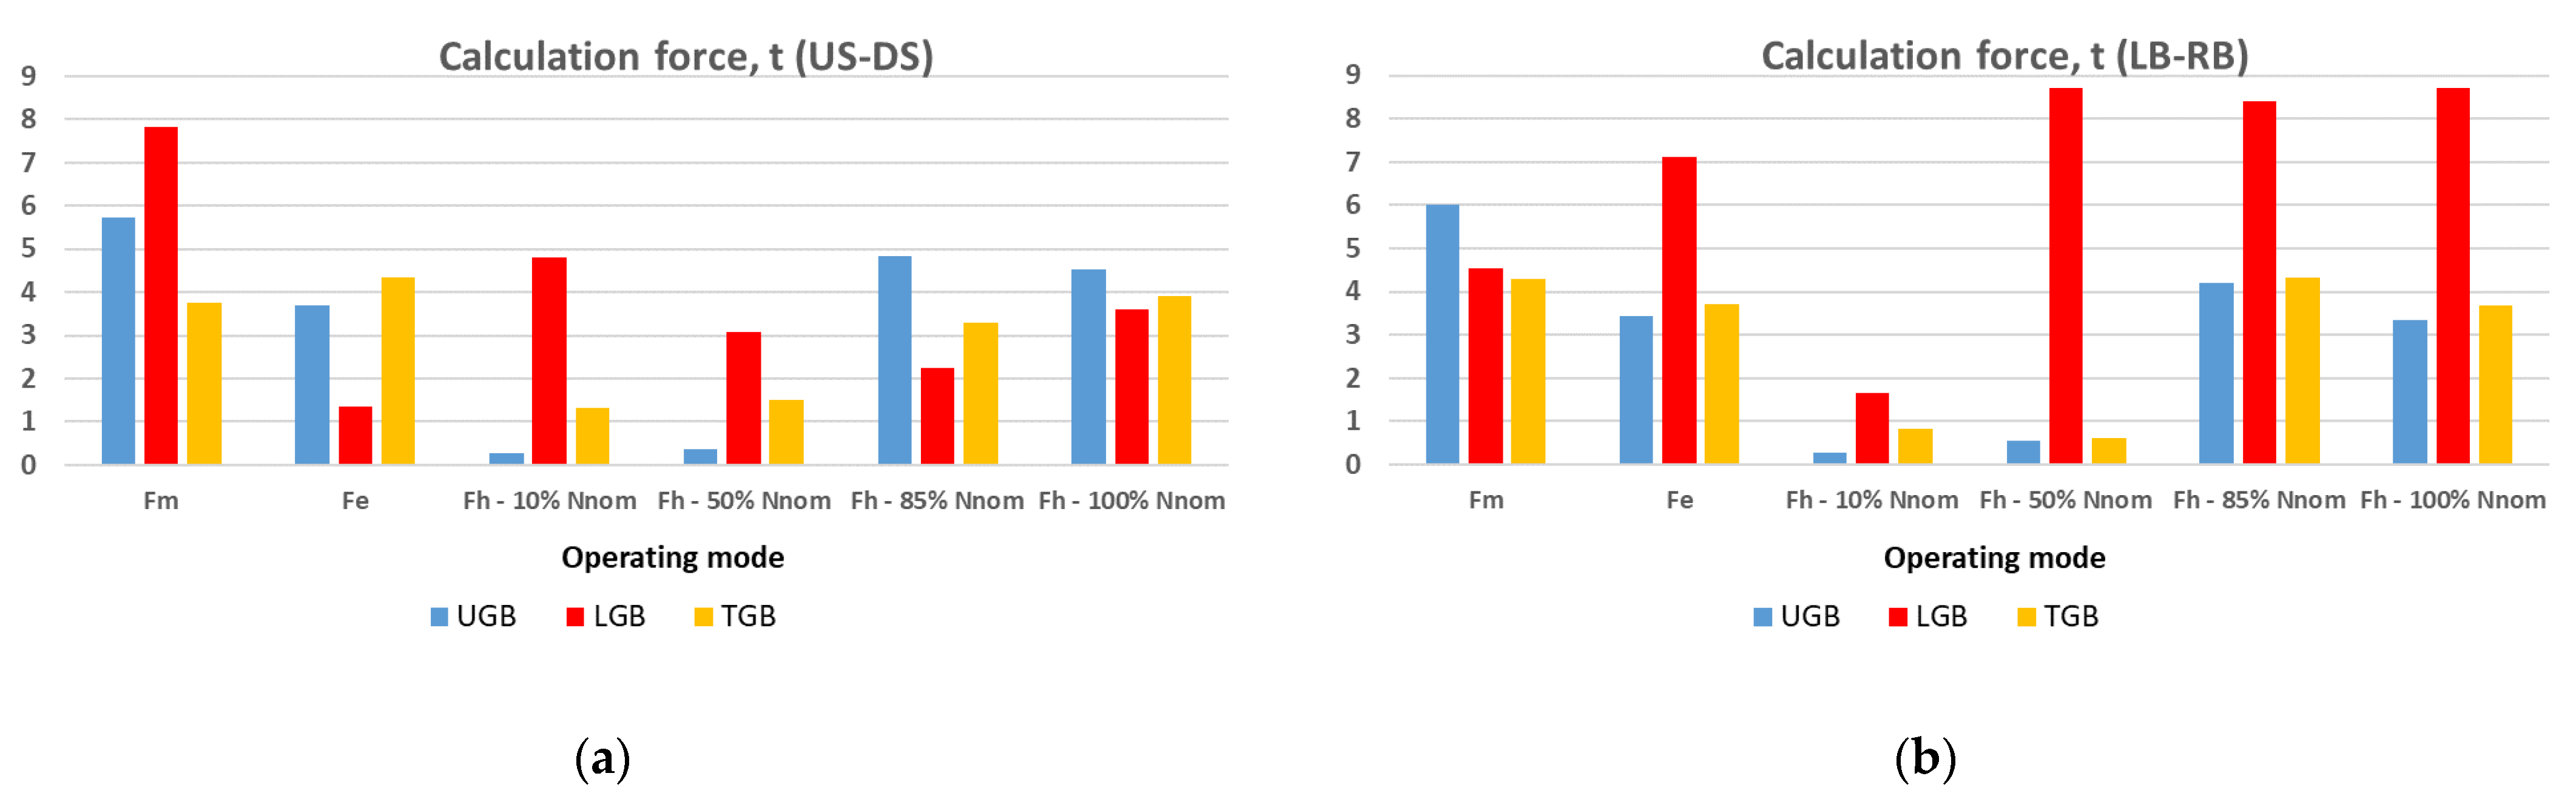
Table 4 and
Figure 4 show the forces of mechanical, electromagnetic and hydraulic origin calculation results; these forces being applied to both directions on the supporting structures of the unit near the guide bearings in different operating modes. The load values are the product of the calculated force increments and the corresponding rigidities of the bearing liners.
5. Discussion
Vector diagrams illustrate the dynamic behaviour of the shaft when changing operating modes. Switching from run-out mode (1) to SNL
NE mode (2) shall occur strictly by the radius, because the level of relative vibration of the shaft is driven by mechanical imbalance. In
Figure 2, this condition is well met only for LGB in the US–DS direction. Deviation of the vector chart trajectory from the radius (phase shift) indicates system instability, for example, tension weakening in the contact area or rotating parts fastening or loosening, or other imbalance mass offset.
Inclusion into mains, switching mode (2) to mode (3), causes a regular phase jump and a corresponding change in vector direction. The variation in the vector indicates the magnitude of the emerging electromagnetic forces. In
Figure 2, the vector module for LGB and UGB changes insignificantly, as the phase changes approximately the same for both directions: US–DS and LB–RB. The TGB vector module changes significantly for both directions, as the phase changes insignificantly, the electromagnetic forces partially balance the available mechanical imbalance.
Switching from run-out mode (3) to operation on (4) ÷ (7) power modes with a gradual increase in the flow of water through the unit coincides with the appearance and growth of hydraulic effects. Modes (4) and (5) of low and medium power (10% and 50% of N
nom) are associated with flux instability in the flow part of the unit, expressed as small shifts in amplitude, as well as in phase without pronounced movement trend. Further power increase (transition to high-power mode (6)—85% of N
nom) leads to stabilization of processes and an increase in hydraulic force on the hydraulic runner. The vector rotates, indicating a change in the distribution of hydraulic forces in the flow section. In
Figure 2, for all values except LGB in the LB–RB direction, the vector module is reduced by the partial balancing of mechanical and electromagnetic forces.
In the last phase of the transition from high-power mode (6) to full power mode (7), a vector jump occurs again (phase changes on
Figure 2), which seems to be linked to changes in flow conditions at maximum power modes. Furthermore, for all bearings, the end of the vector is shifted to the center, therefore, at maximum power, the hydraulic load balances the mechanical and electromagnetic imbalances to a maximum extent. It should be noted that this jump is not observed for all HUs and is more an individual characteristic of the units of this HPP than a characteristic of all units of any type.
The presented method of vector diagrams makes it possible to analyze the ratio of forces acting on a hydraulic unit in addition to the nature of shaft displacements. The magnitude of the force can be used to indicate internal stresses in the hydroelectric units and, using the known mathematical tools, to proceed to assess stress–strain state and remaining lifetime, that is, to plan properly the time needed for necessary repairs. This possibility can be automated and implemented in diagnostic systems in the form of a periodic report on the actual load of the unit’s support joints.
The results presented in
Table 3,
Table 4 and
Figure 4 show that, for the unit in question, the forces of mechanic (Fm) and electromagnetic (Fe) origin are quite different for the directions US–DS and LB–RB. Especially visible is the difference for LGB. The main reason for this is probably the large deviations in the generator rotor and generator stator geometry: the presence of eccentricity and ovality, as well as the asymmetry of the generator air gap. Different sensitivities of LGB and UGB to uneven loads along the directions can be explained by differences in the rigidity of their liners.
Figure 2 and
Figure 3 clearly show that for TGB in both directions, the mechanical imbalance is largely balanced by the hydraulic imbalance: final vector amplitude in mode (7) is close to the initial vector amplitude at point (1), although the vector itself is rotated. In practice, this means that, near the nominal operating mode, the low level of relative shaft vibrations is not an indication of a good technical state of the unit or of the absence of significant force impacts on its joints, but of the presence of a couple of forces counterbalancing each other. As a result, the impact of these forces will lead to premature defects, which cannot be predicted on the basis of a normative analysis of relative shaft vibrations alone. The influence of this pair of forces can also be seen on the generator bearings in the direction US–DS, where the spin up line in speed-no-load mode (from mode (1) to mode (2)) and power build-up mode at greater energy consumption mode (from mode (5) to mode (6)) are almost parallel, as the transition to mode (7) moves the end of the vector even closer to the center, but in a different direction.
Figure 4 presents the histograms of actual force values of different origin without their direction. It can be seen that LGB is under increased loads in the direction of LB–RB in almost all operating modes, including at high-power modes. At the same time, the total level of relative vibration on the LGB in all modes is not more than 400 μm, which is much lower than the manufacturer’s recommended limits (600 μm).
A similar analysis by vibration monitoring can be carried out to assess the unit’s history of operation, the degree of loading of its components according to operating modes, and to compare the pre- and post-repair state of the HU. Based on the analysis described, new diagnostic rules can be developed that take into account not only the total level of relative vibrations but also the actual loads level.
The automation of the proposed algorithm for calculating actual loads on HU key components opens up wide possibilities on express-assessment of the actual technical state of the unit without stopping it, based on vector diagrams identifying problem areas and forecasts of the dates and size of repairs required. If information on phases for higher harmonics is available in the monitoring system, using the technology mentioned above, the influence of factors can be estimated, which manifest themselves on the second, the third, etc., rotating frequencies. The diagnosis can also be clarified based on the analysis of the 1st harmonic.
6. Conclusions
As opposed to the normative approach, which regulates the assessment of only the total level of relative vibrations and some frequency constituents in order to determine the permissibility or impermissibility of a given operating mode, the vector diagram method provides much more useful information for technical diagnosis while installation of additional sensors or accessories is not required. The monitoring system has already collected all the information necessary for analysis.
An example of data on the relative vibrations of the unit shaft shows the possibilities of qualitative and quantitative analysis by the vector diagram method showing the dynamic displacement of the shaft at transitions from one operating mode to another. The vector algebra methods help calculate the increments of vectors and the corresponding force increments proportional to the loads involved when operating modes change. Furthermore, the components formed by each type of load are distinguished from the total vibration signal, i.e., the total force impact is resolved into the mechanical, electromagnetic and hydraulic load according to the direction of action thereof. The example of a powerful three-point HU shows that vibration-safe modes do not always indicate that the unit is not subject to significant loads. It is possible that there are couples of forces whose actions partially counterbalance each other, but at the same time adversely affect the overall load of the HU components and result in an accelerated lifetime exhaustion.
The proposed approach makes it possible to estimate the stability/instability of the system on the basis of changes in the vector, identify trends of deterioration or balancing problems before the monitored parameters exceed the thresholds. The calculation of force impacts using the vector diagram method allows further evaluation of the stress-deformation state of the HU elements and remaining lifetime forecast by actual data and actual operating modes, as well as allowing the prediction of possible deterioration in equipment operation long before a warning or alarm signal is generated by the diagnostic system.
In the future, it is possible to formulate new diagnostic rules based on vector diagrams, to be introduced into diagnostic systems to improve their performance without expanding the hardware base.


