Article

Seismic Performance Evaluation of Low-Rise Reinforced Concrete Framed Buildings with Ready-to-Use Guidelines (RUD-NBC 205:2024) in Nepal

by
Jhabindra Poudel
1,*,
Prashidha Khatiwada
2 and
Subash Adhikari
3
1
Structural Engineering Department, School of Engineering and Technology, Asian Institute of Technology, Pathum Thani 12120, Thailand
2
Department of Infrastructure Engineering, The University of Melbourne, Melbourne, VIC 3010, Australia
3
Department of Civil and Structural Engineering, Charles Darwin University, Casuarina, NT 0810, Australia
*
Author to whom correspondence should be addressed.
CivilEng 2025, 6(3), 50; https://doi.org/10.3390/civileng6030050
Submission received: 10 July 2025 / Revised: 9 September 2025 / Accepted: 16 September 2025 / Published: 18 September 2025

Abstract

Earthquakes remain among the most destructive natural hazards, causing severe loss of life and property in seismically active regions such as Nepal. Major events such as the 1934 Nepal–Bihar earthquake (Mw 8.2), the 2015 Gorkha earthquake (Mw 7.8), and the 2023 Jajarkot earthquake (ML 6.4) have repeatedly exposed the vulnerability of Nepal’s built environment. In response, the Ready-to-Use Detailing (RUD) guideline (NBC 205:2024) was introduced to provide standardized structural detailing for low-rise reinforced concrete buildings without masonry infill, particularly for use in areas where access to professional engineering services is limited. This study was motivated by the need to critically assess the structural performance of buildings designed according to such rule-of-thumb detailing, which is widely applied through owner–builder practices. Nonlinear pushover analyses were carried out using finite element modelling for typical configurations on soil types C and D, under peak ground accelerations of 0.25 g, 0.30 g, 0.35 g, and 0.40 g. The response spectrum from NBC 105:2020 was adopted to determine performance points. The analysis focused on global response, capacity curves, storey drift, and hinge formation to evaluate structural resilience. The maximum story drift for the linear static analysis is found to be 0.56% and 0.86% for peak ground acceleration of 0.40 g, for both three and four-storied buildings. Also, from non-linear static analysis, it is found that almost all hinges formed in the beams and columns are in the Immediate Occupancy (IO) level. The findings suggest that the RUD guidelines are capable of providing adequate seismic performance for low-rise reinforced concrete buildings, given that the recommended material quality and construction standards are satisfied.

1. Introduction

Earthquakes are among the most destructive natural catastrophes, capable of causing significant loss of life and property. Nepal, located in South Asia, which is about 900 km in the east-west (EW) direction and 200 km long in the north-south (NS) direction, bordered by China and India, is prone to seismic activity caused by plate movement along the Himalayan region, resulting in numerous faults throughout the nation. The Himalayan series is one of the world’s most seismically active regions because of the faulting between the subducting Indian plate and the overriding Eurasian plate to the north. The convergence of the Indian plate occurs at a rate of 45 mm/year towards the Eurasian plate [1]. As a result of this tectonic movement, Nepal is one of the most seismically active regions in the world, assessed as two-thirds portion of the Himalayas has the potential to produce mega earthquakes [2]. Globally ranked among the eleven most earthquake-vulnerable countries [3], Nepal faces substantial seismic risk due to the concentration of its settlements along the Himalayan megathrust fault. Numerous seismic disasters, including the devastating 1934 Nepal-Bihar earthquake (Mw 8.2), caused significant damage and casualties in the eastern part of Nepal as well as in the Kathmandu valley [4]. Furthermore, the 25th April 2015 earthquake (Mw 7.8) along the Himalayan front was caused by a low angle thrust faulting mechanism at 8.2 km focal depth, resulting in significant devastation, particularly in the Kathmandu valley and neighboring districts, with a human loss of over 9000 lives, and severe infrastructure damage [1,5,6]. These recurring catastrophes emphasized the urgent necessity of developing and enforcing updated seismic design codes, leading to the initiation of the Nepal National Building Code (NBC) project in 1994.
Following the 2015 earthquake, Nepal revised its seismic design provisions, updating the Nepal National Building Code [7], in the year 2020. The updated version of the Nepal National Building Code [8] is currently being utilized by several municipalities. However, there are still a significant number of municipalities that continue to allow the use of the previous building code (NBC 105:1994) [9]. Furthermore, for up to three-storey reinforced concrete frame buildings with brick masonry infill that are frequently constructed in Nepal, the Mandatory Rules of Thumb (MRT-NBC 205:1994) on the prescriptive design of the Nepal building code recommends certain dimensions and details regarding the structural and nonstructural elements [10]. These MRT provisions, while accessible for owner–builder practices, lacked alignment with modern seismic detailing standards, underscoring the ongoing challenge of ensuring consistent and reliable seismic safety across Nepal’s diverse building stock.
Meanwhile, on 3 November 2023, another strong earthquake struck Jajarkot, Rukum, and the surrounding 11 districts in the western part of Nepal, followed by many aftershocks that had a devastating effect on the lives and livelihoods of the people in one of the most impoverished areas of Nepal. A total of 153 persons have died, and 35,321 households have had their houses damaged, which are not livable now [11]. After this earthquake, the Nepalese government expedited the updating of the guidelines, which had been commenced in 1994, revised as a draft in 2012, and again updated in 2024 [12]. The purpose of this update is to mitigate the risk of future earthquake-induced losses by promoting safer construction practices and reducing structural collapse and casualties. Achieving this goal requires not only the implementation of revised provisions in new construction but also the systematic evaluation of the seismic performance of both new and existing buildings.
The evolution of earthquake disasters, seismic design codes, and mandatory rule-of-thumb (MRT) guidelines in Nepal is illustrated in Figure 1. Following the 1988 Udayapur earthquake, the Government of Nepal enacted NBC 105 and NBC 205 in 1994. NBC 105 became Nepal’s first formal seismic design code, while NBC 205 provided simplified “rules of thumb” for reinforced concrete buildings, prescribing element dimensions and reinforcement details for footings, beams, columns, and slabs. NBC 205 underwent a draft revision in 2012, which introduced minor improvements, including upgraded detailing provisions and an increase in the standard concrete grade from 15 MPa to 20 MPa. More recently, both NBC 105 and NBC 205 were substantially revised in 2020 and 2024, respectively, drawing lessons from the 2015 Gorkha and 2023 Jajarkot earthquakes.
The latest version, NBC 205:2024, was developed in alignment with NBC 105:2020 and provides a more comprehensive framework for structural detailing. It enhances member dimensions and reinforcement specifications, with explicit consideration of seismic zones and soil conditions to improve building safety. Nevertheless, NBC 205:2024 retains its role as a simplified “Ready-to-Use” guideline, designed primarily for owner–builder projects in contexts where professional engineers are not available. It focuses on standardised, repeatable building configurations and incorporates simplified modelling assumptions, such as neglecting masonry infill stiffness. While this approach avoids modelling complications (e.g., frame stiffening, soft-storey or short-column effects, altered inter-storey drift, and irregular seismic behaviour), it still provides practical and replicable guidance for low-rise reinforced concrete construction. As this paper focuses on the RUD guidelines, the effect of masonry infills has been intentionally excluded. However, different micro- and macro-modelling techniques [13,14]—such as diagonal compression-only truss elements—are available in the literature to explicitly capture the effects of masonry infills.
Numerous studies were conducted to evaluate the seismic performance of existing structures [14,15,16,17,18,19] in which nonlinear pushover analysis and time history analysis were done to evaluate the global responses as well as the performance of the structures. Further, the study of Poudel [20] focused on performance evaluation and retrofit of MRT-based structures. Three different consecutive models based on NBC 205:1994 and 2012 (MRT guidelines) and NBC 105:2020 were developed and analyzed in PERFORM 3D V8.0.0 software. The load-carrying capacity and beam-column moment capacity ratio were assessed. The analysis result indicated that the buildings constructed in accordance with MRT guidelines have inadequate moment carrying capacity, and the authors recommended retrofitting techniques to enhance seismic resilience. Similarly, Bento et al. [21] performed nonlinear static procedures, evaluated and compared the response of two typologies of reinforced concrete buildings with the utilization of method as prescribed by ATC-40 [22] and FEMA 273 [23]. According to their findings, nonlinear static analysis is more appropriate for low-rise and high frequency structures i.e., for the structures that vibrate primarily in the fundamental mode. Moreover, Bhalkikar et al. [24] proposed a novel technique using the pattern of hinge formation in the structure subjected to monotonic loading to quantify the damage of RC structures. Regression analysis was utilized in their study to examine the relationship between the damage and the hinge pattern using an energy-based damage index model, with the number of hinges formed in each damage state serving as an independent variable and the damage index as a dependent variable.
Even after the revision of NBC 105 in 2020, NBC 205 has continued to be widely used in many municipalities of Nepal. Although NBC 205 was extensively adopted for residential buildings, particularly those up to three storeys, it did not fully comply with the provisions of NBC 105:2020 [8], thereby necessitating an update to strengthen seismic safety. This update was released in 2024 and is now being gradually implemented across municipalities. Nevertheless, a notable research gap remains, as very few studies have evaluated the seismic performance of buildings designed in accordance with the latest Ready-to-Use Detailing (RUD) guidelines (NBC 205:2024). The lack of empirical and analytical evidence leaves uncertainty regarding the effectiveness of the updated provisions in improving structural safety under seismic loading. To address this gap, this study evaluates the seismic performance of structures designed following NBC 205:2024. Nonlinear static analysis was performed on models without infill masonry, as recommended by the guidelines, using ETABS Version 20 [25]. The pushover capacity was assessed in terms of base shear and roof displacement, while overall seismic performance was evaluated using the ATC-40 [22] capacity spectrum method, with the performance point employed to establish the relationship between seismic demand and structural capacity.
The remainder of this paper is structured as follows: Section 2 provides an overview of the recently updated NBC 205:2024 guidelines. Section 3 describes the selected case study buildings that comply with these provisions. Section 4 outlines the reinforcement details and structural member sizes. Section 5 and Section 6 present the nonlinear modelling and analysis procedure. Finally, Section 7 and Section 8 discuss the results, conclusions, and potential directions for future research.

2. Overview of NBC 205:2024

Over the past three decades, there has been a significant proliferation of reinforced concrete (RC) frame buildings in the urban and semi-urban areas of Nepal. Many of these buildings have been constructed under the guidance of mid-level technicians and masons, often with minimal professional structural design input, making them highly vulnerable to earthquakes with a credible likelihood of occurrence in Nepal. Despite the use of modern materials, these buildings could pose a major risk to life in future seismic events. To address this issue, and following the update of NBC 105 in 2020, the guideline previously titled Mandatory Rules of Thumb for Reinforced Concrete Buildings Without Masonry Walls (NBC 205:1994), which was first revised in 2012, has been further revised and published in 2024 as the Ready-To-Use Detailing (RUD) Guideline for Low-Rise Reinforced Concrete Buildings without masonry infill.
This latest version supersedes all earlier editions and aligns with the updated seismic design provisions in NBC 105:2020 to ensure consistency with current standards. The guideline aims to improve the structural quality of new RC buildings by providing standardised structural detailing for low-rise reinforced concrete (RC) buildings without masonry infill, particularly in areas where professional engineering services are limited. It applies to buildings classified under Category C of the Building Act 2055 [26]. This category typically includes buildings with a plinth area of less than 92.93 m2, up to three storeys plus a staircase cover (total height not exceeding 12 m), and a structural span of up to 4.5 m. Its primary purpose is to regulate construction in municipalities and rural municipalities where professional engineers and senior technicians are not readily available, ensuring that buildings constructed under the supervision of mid-level technicians (sub-engineers) meet minimum seismic safety standards to reduce potential loss of life due to structural failure. To this end, the guideline offers ready-to-use dimensions and detailing for both structural and non-structural elements of ordinary residential RC frame buildings, which are commonly constructed by owner–builders in Nepal. It further specifies the sizes of structural members and reinforcement requirements for soil types C and D, as defined in NBC 105:2020, covering seismic demands ranging from 0.25 g to 0.40 g. In addition, site selection and investigation can be carried out using the simple Dropping Weight Method to estimate allowable soil bearing capacity. In this method, the 1.5 m depth pit is excavated, a stacked unit of four full-size standard bricks on top of each other, tied by strings, is dropped from a height of 1.5 m at three different locations, and the depression in the pit is measured by using a ruler. The soil bearing capacity is evaluated based on the depression as illustrated in NBC 205:2024.
For construction materials, all structural concrete should achieve a compressive strength of 20 N/mm2 (M20) with a nominal mix ratio of 1:1.5:3, and reinforcement bars should have a yield strength of 500 N/mm2 (preferably Fe500D) for both longitudinal and transverse reinforcement. The RUD Guideline provides standardized designs and detailing for all structural components, ensuring consistency with NBC 105:2020 for buildings located in seismic zones with site subsoil categories C and D. Although such buildings can also be designed using conventional engineering design standards, they must still comply with NBC 105:2020. Overall, the simplified design procedures aim to save design time and enable owner-builders to adopt appropriate detailing practices, thereby enhancing the seismic resilience of low-rise RC buildings in Nepal.

3. Case Study Buildings

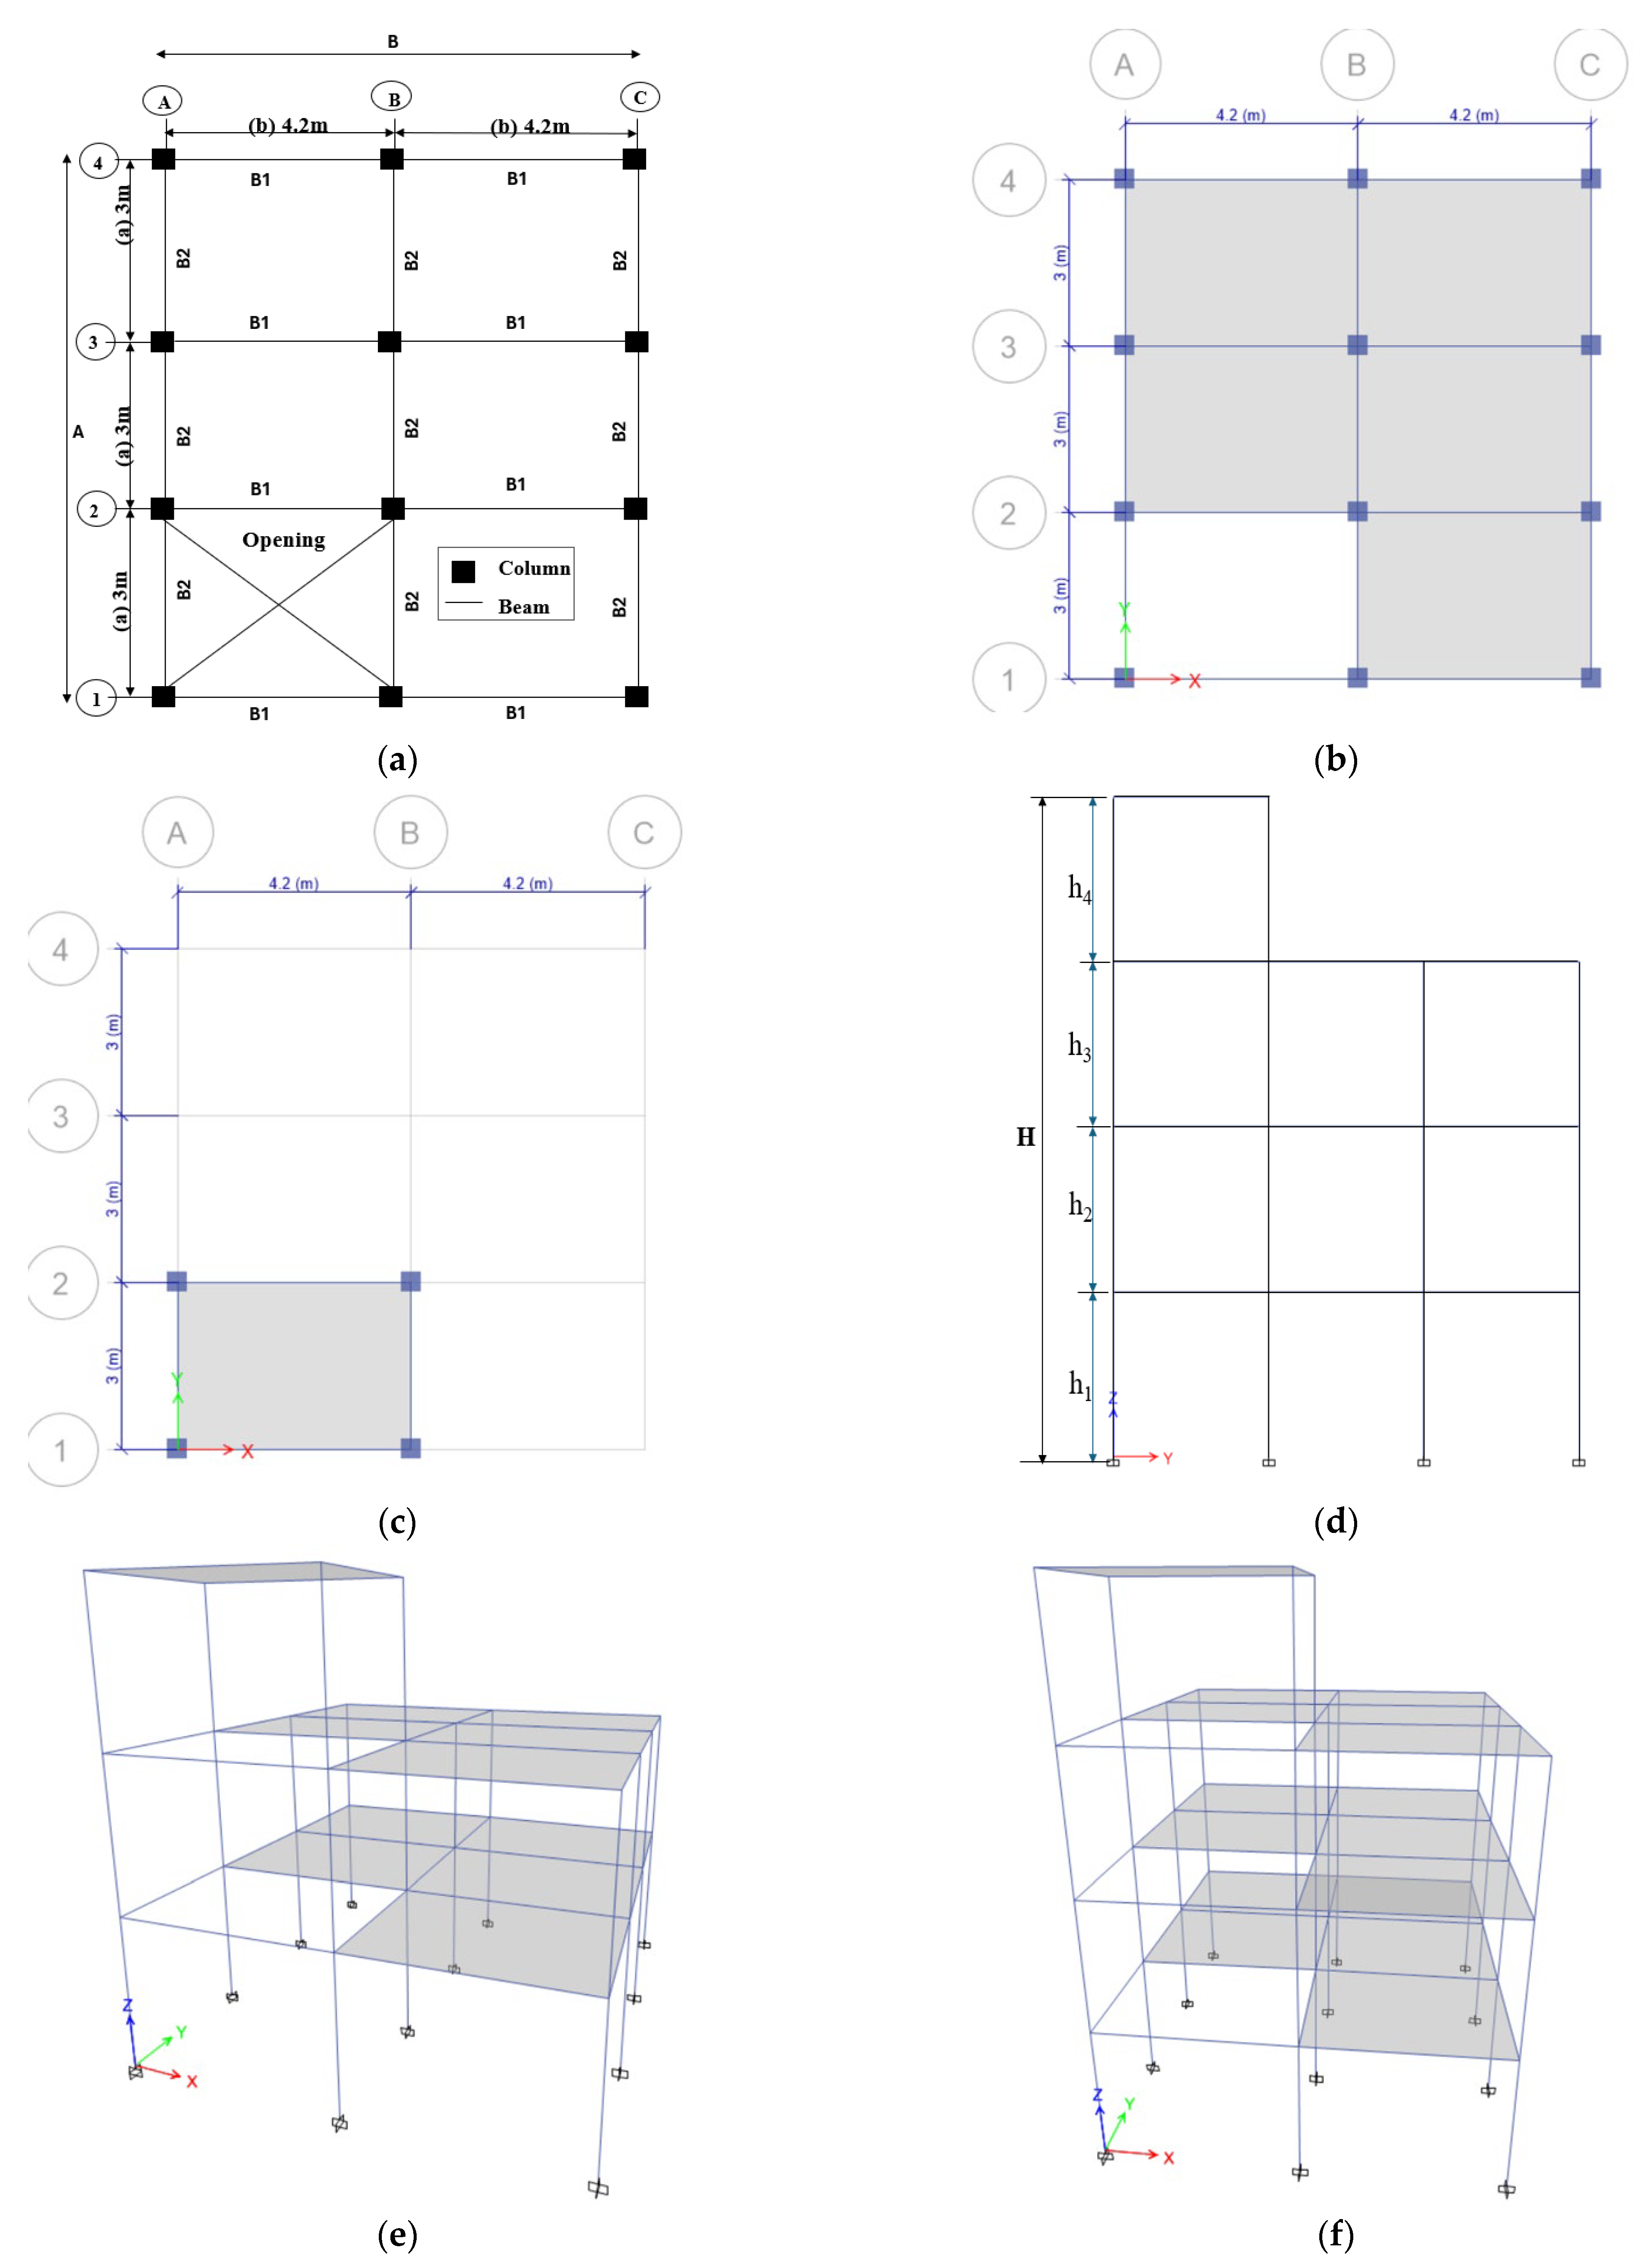
In this study, the case study buildings were selected according to the RUD guidelines for both 2-storey and 3-storey plus staircase cover in both, which can be termed as 3-storey and 4-storey buildings in this study. The building plan indicated in Figure 2a illustrates the symbolic representation of case study buildings that comply with the RUD guidelines. Similarly, Figure 2b–f indicate the typical plans, elevations, and three-dimensional views of the studied buildings, which consist of 10 different models for soil types C and D with seismic demands varying from 0.25 g to 0.40 g. Table 1 depicts the important parameters considered in the guidelines, which were incorporated in this study. In Table 1, A represents the maximum horizontal length of building; B represents maximum horizontal width of building; H represents height of building above the lateral restraint imposed by the ground; a and b represent maximum grid length of building in x and y direction; and h1, h2, h3, h4 represent floor height of building for first, second, third, and fourth floor, respectively. The effect of masonry infill was ignored as per the recommendation of the RUD guideline.

4. Structural Member Sizes and Reinforcement Details

The analysis and design of such buildings were done based on the New National Building Code of Nepal (NBC 105: 2020), and presented the design output in this guideline. For different seismic demands, ranging from 0.25 g to 0.40 g for Soil types C and D, all the primary sectional dimensions and reinforcement demand for beams and columns after the analysis and design as per RUD recommendations are taken into consideration for this study and are presented in Table A1, Table A2, Table A3 and Table A4. The slab thickness was taken as 125 mm, considering elastic thin shell elements with the assumption that they will remain elastic under the loading conditions. Similarly, the staircase waist slab was mentioned as 150 mm thick.

5. Nonlinear Modelling Approach

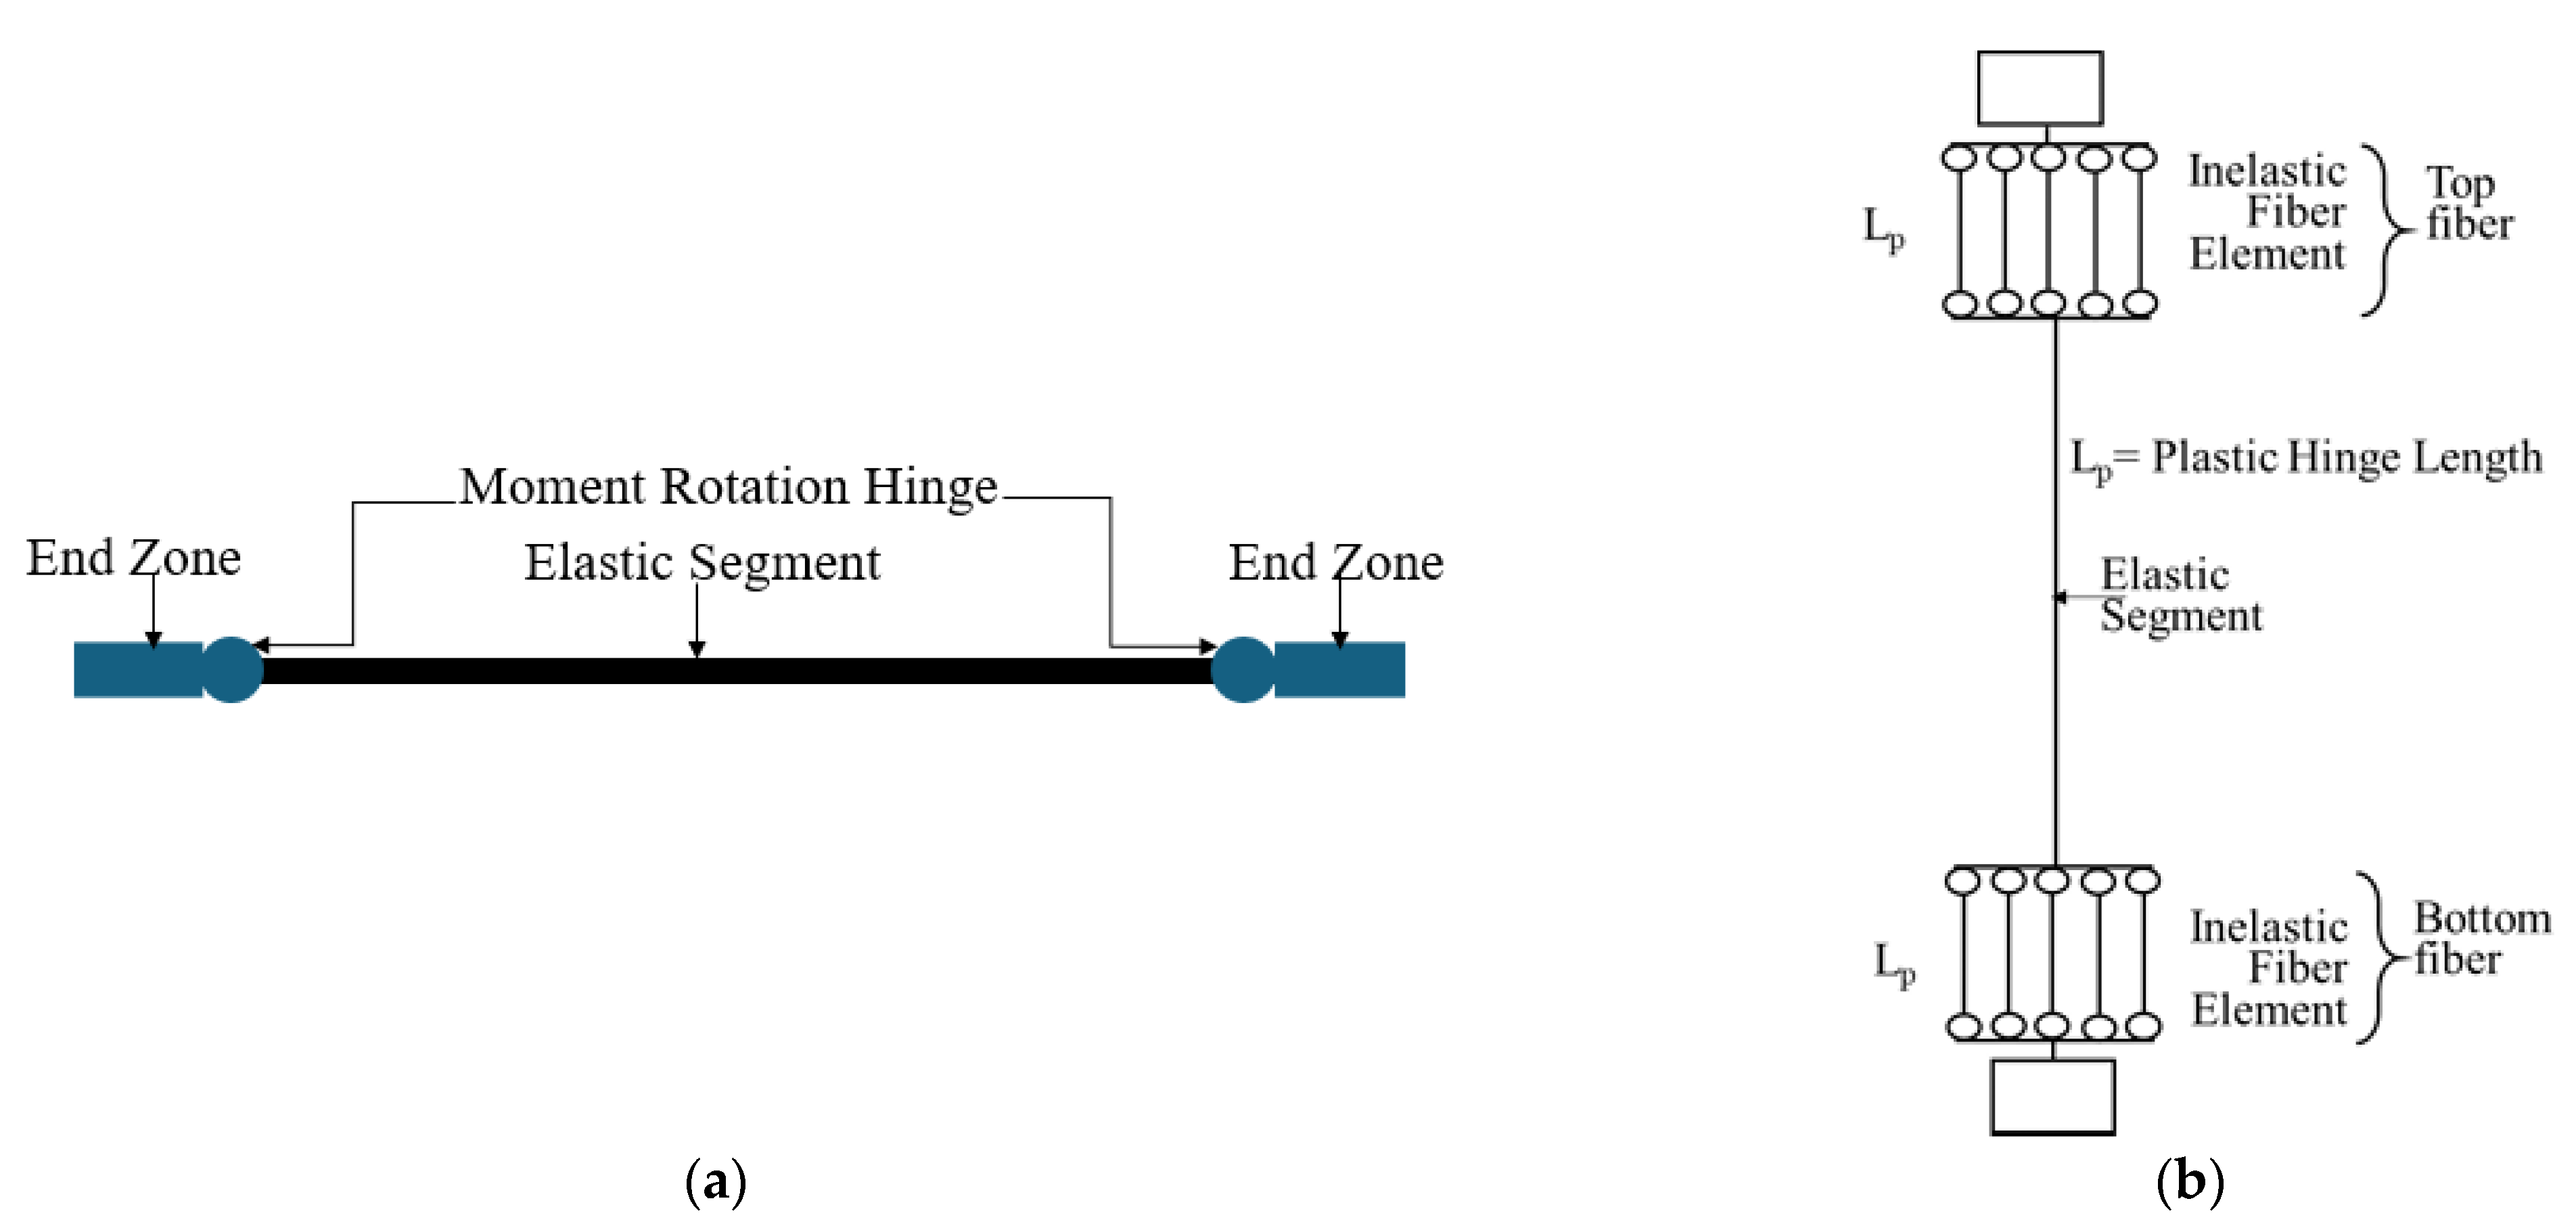
The nonlinear behavior of beams and columns, particularly those located in the plastic hinge zone, was the primary focus of the analysis. To represent this behavior, plastic hinges were positioned at the ends of beams and columns. This assignment was based on the moment–curvature and shear deformation responses of the cross sections. The remaining lengths of the beams and columns were modeled as linear elastic components with uncracked flexural stiffness in addition to the hinges allocated to each end. Figure 3a,b depict the location of hinges assigned to the beam and column elements. Beams usually have relatively low axial forces and are bent in only one plane, about the cross-section’s strong axis. Hence, it is not necessary to account for P-M interaction, biaxial bending, and biaxial shear. For the beams, the plastic hinge was modeled using a moment rotation hinge since the beams are horizontal line elements that primarily fail in the flexural moment (M3). The longitudinal and transverse reinforcement presented in Table A3 and Table A4 was used to determine the moment capacity for the beams, and the American Society of Civil Engineers (ASCE) [27] is utilized for the calculation of moment hinge rotation. While for columns, the P-M interaction was taken into consideration because of the high axial forces. Additionally, as columns typically bend in both directions, biaxial shear and bending was also considered. Therefore, the column section in the plastic zone was modeled with separate fibers of confined, unconfined concrete and steel fibers to capture the P-M2-M3 interaction. As indicated in Figure 3, moment–rotation hinges were assigned to the beam elements, while inelastic fibre hinges were assigned to the column members at both ends, with the hinge length determined accordingly. Numerous studies have shown that the length of fiber hinges can be determined based on the cross-sectional geometry, size, and yield strength of the reinforcement bars. In this study, the equation proposed by Paulay and Priestley [28] is used for the evaluation of plastic hinge length and is given in Equation (1), which has been shown to be accurate for beams and columns in low-rise buildings [28].
L p = 0.08 L + 0.022 d b   f y   M P a
where Lp is plastic hinge length in mm, L is the length of the member in mm, db is the size of the reinforcement bar in mm, and fy is the steel yield stress in MPa.
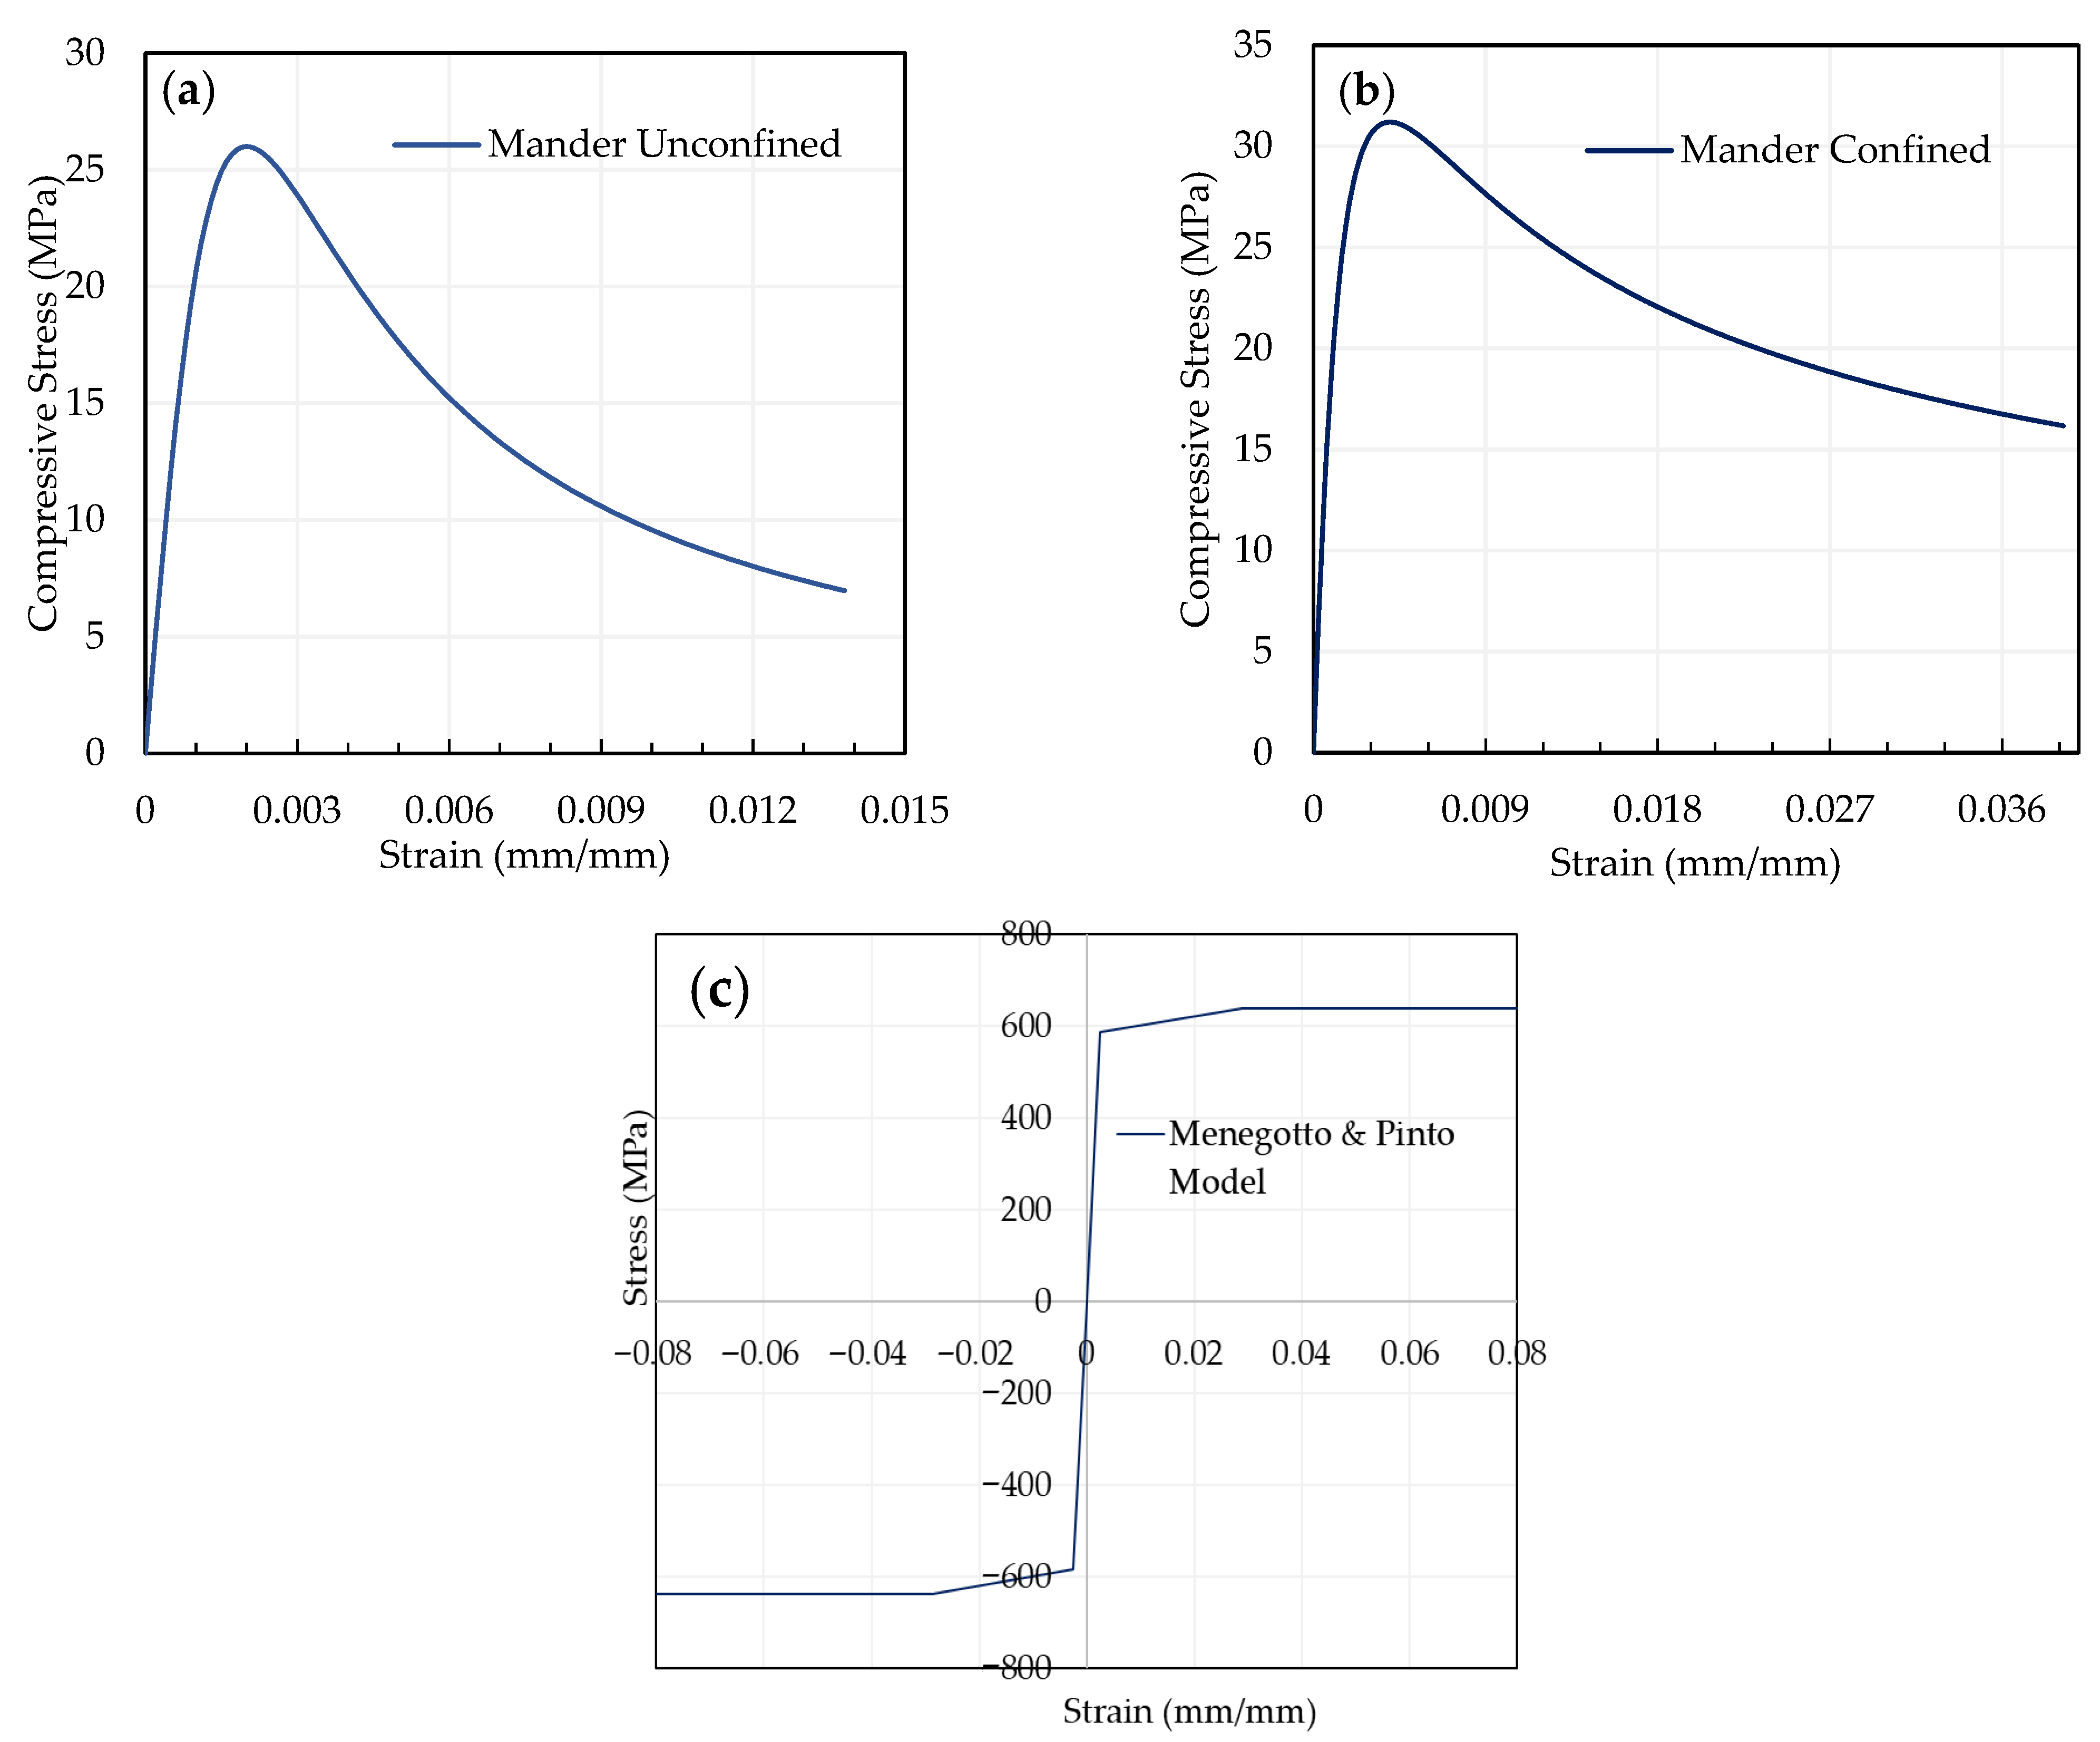
The Mander concrete stress–strain models for confined and unconfined concrete [29] were adopted to capture the nonlinear behaviour of concrete, while the Menegotto–Pinto model [30] was used to represent the stress–strain response of steel reinforcement. To simulate the steel fiber, a non-degrading type hysteretic model with strain hardening and without strength loss was used. Post-yield stiffness in this investigation is defined as 1.2% of the elastic stiffness. Similar values were also adopted by [31,32] in their study to evaluate the hysteretic energy. The consecutive material models for steel and concrete adopted in this study are shown in Figure 4.
The overall modeling approach is summarized in Table 2 and the nonlinear modeling and the pushover analysis were performed by using the CSI application: ETABS.
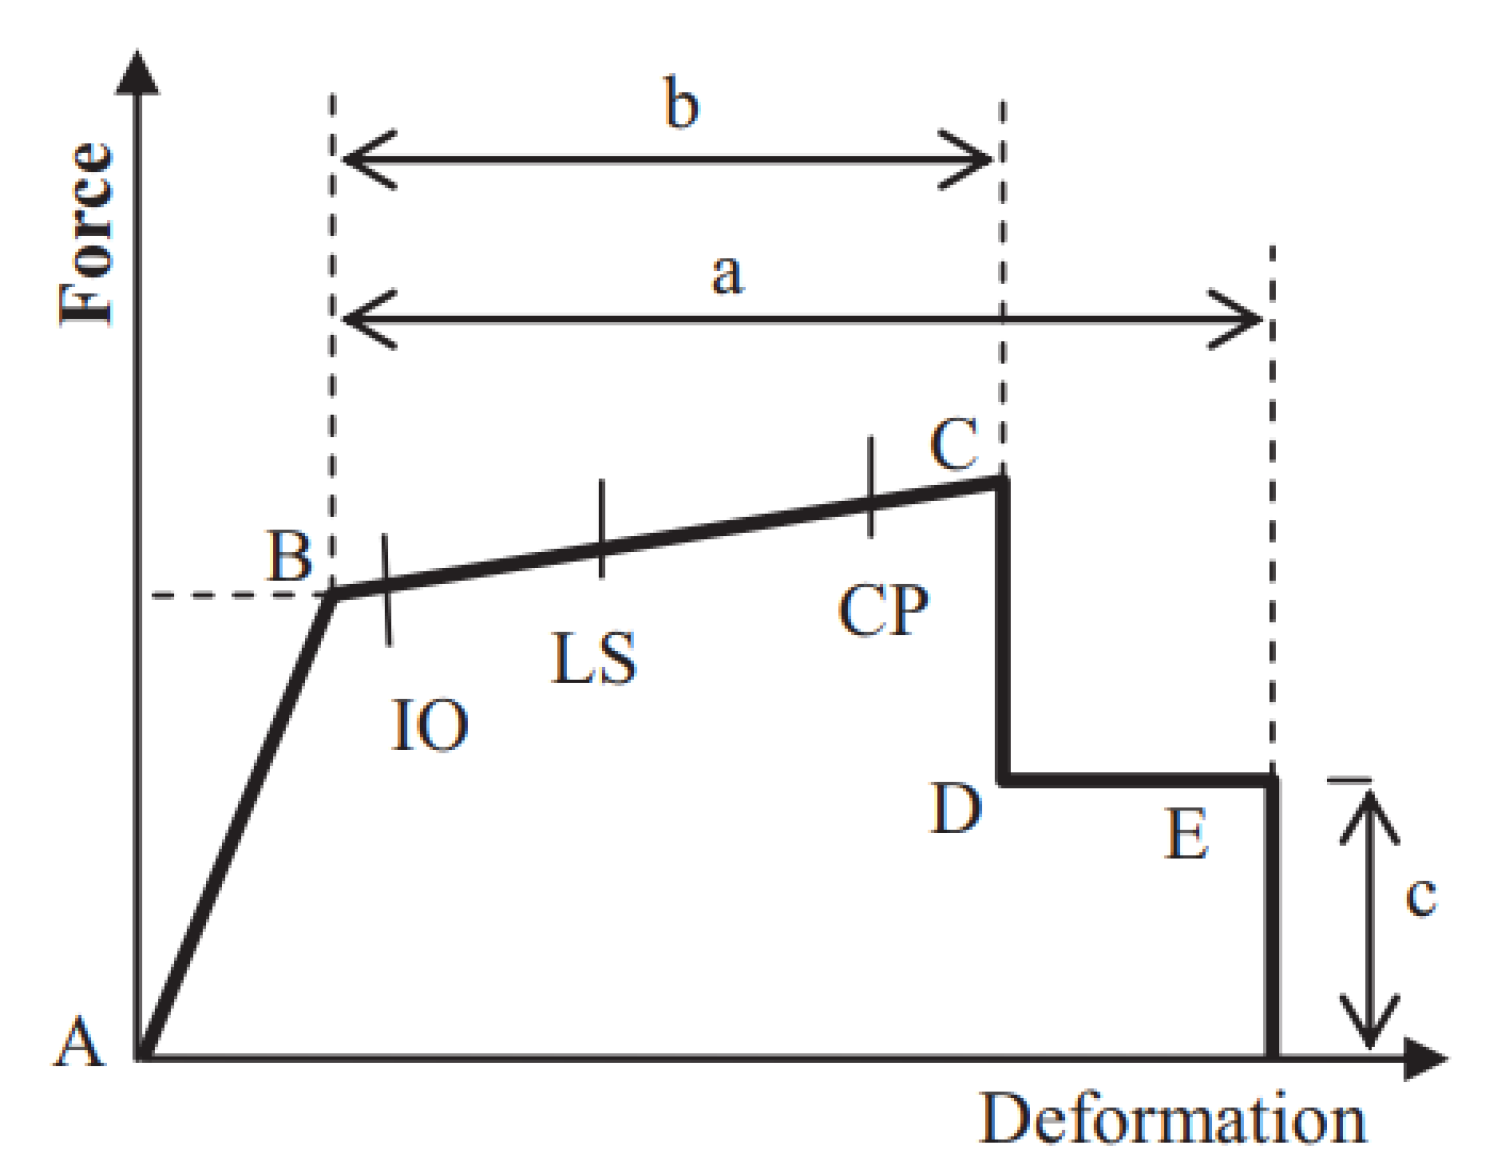
The force-displacement curve for plastic hinge is shown in Figure 5. Point A is the condition of the unloaded state, Point A to B is the linear slope implying elastic structural behavior, Point B indicates the starting of the yielding of the member and Point C represents the ultimate value and strength degradation occurs, Point D corresponds to the residual strength and is limited to 20% of the yield strength and the eventual collapse of the structure is beyond the point E. The behavior from point B to point C is inelastic and can be categorized under these performance levels. The acceptance criteria for plastic rotation of beams according to ASCE 41-17 [27] are 0.005 radians for the immediate occupancy (IO) level, 0.02 radians for the life safety (LS) level, and 0.04 radians for the collapse prevention (CP) level. Similarly, for the columns, the plastic rotation is 0.003 radians, 0.01 radians, and 0.035 radians for IO, LS, and CP, respectively.
The seismic performance of the proposed study buildings was evaluated in terms of seismic capacity, base shear, and performance point. In this study, the seismic response of the bare frame is evaluated using design-level earthquakes, which means the structure is designed to withstand an earthquake having a 475-year return period, i.e.,10% probability of exceedance over 50 years.

6. Nonlinear Static Pushover Analysis

Although nonlinear dynamic analysis is generally regarded as the most accurate method for predicting seismic behaviour, its application is often limited by complexity, uncertainties in structural properties, difficulties in selecting appropriate ground motions, and significant computational demands. As a result, nonlinear static pushover analysis is widely adopted in practice due to its relative simplicity and lower computational requirements [33]. This method allows progressive tracking of structural yielding under incremental lateral loading until the target displacement is achieved. Its effectiveness in estimating the seismic response of both new and existing buildings has been validated in numerous studies [34].
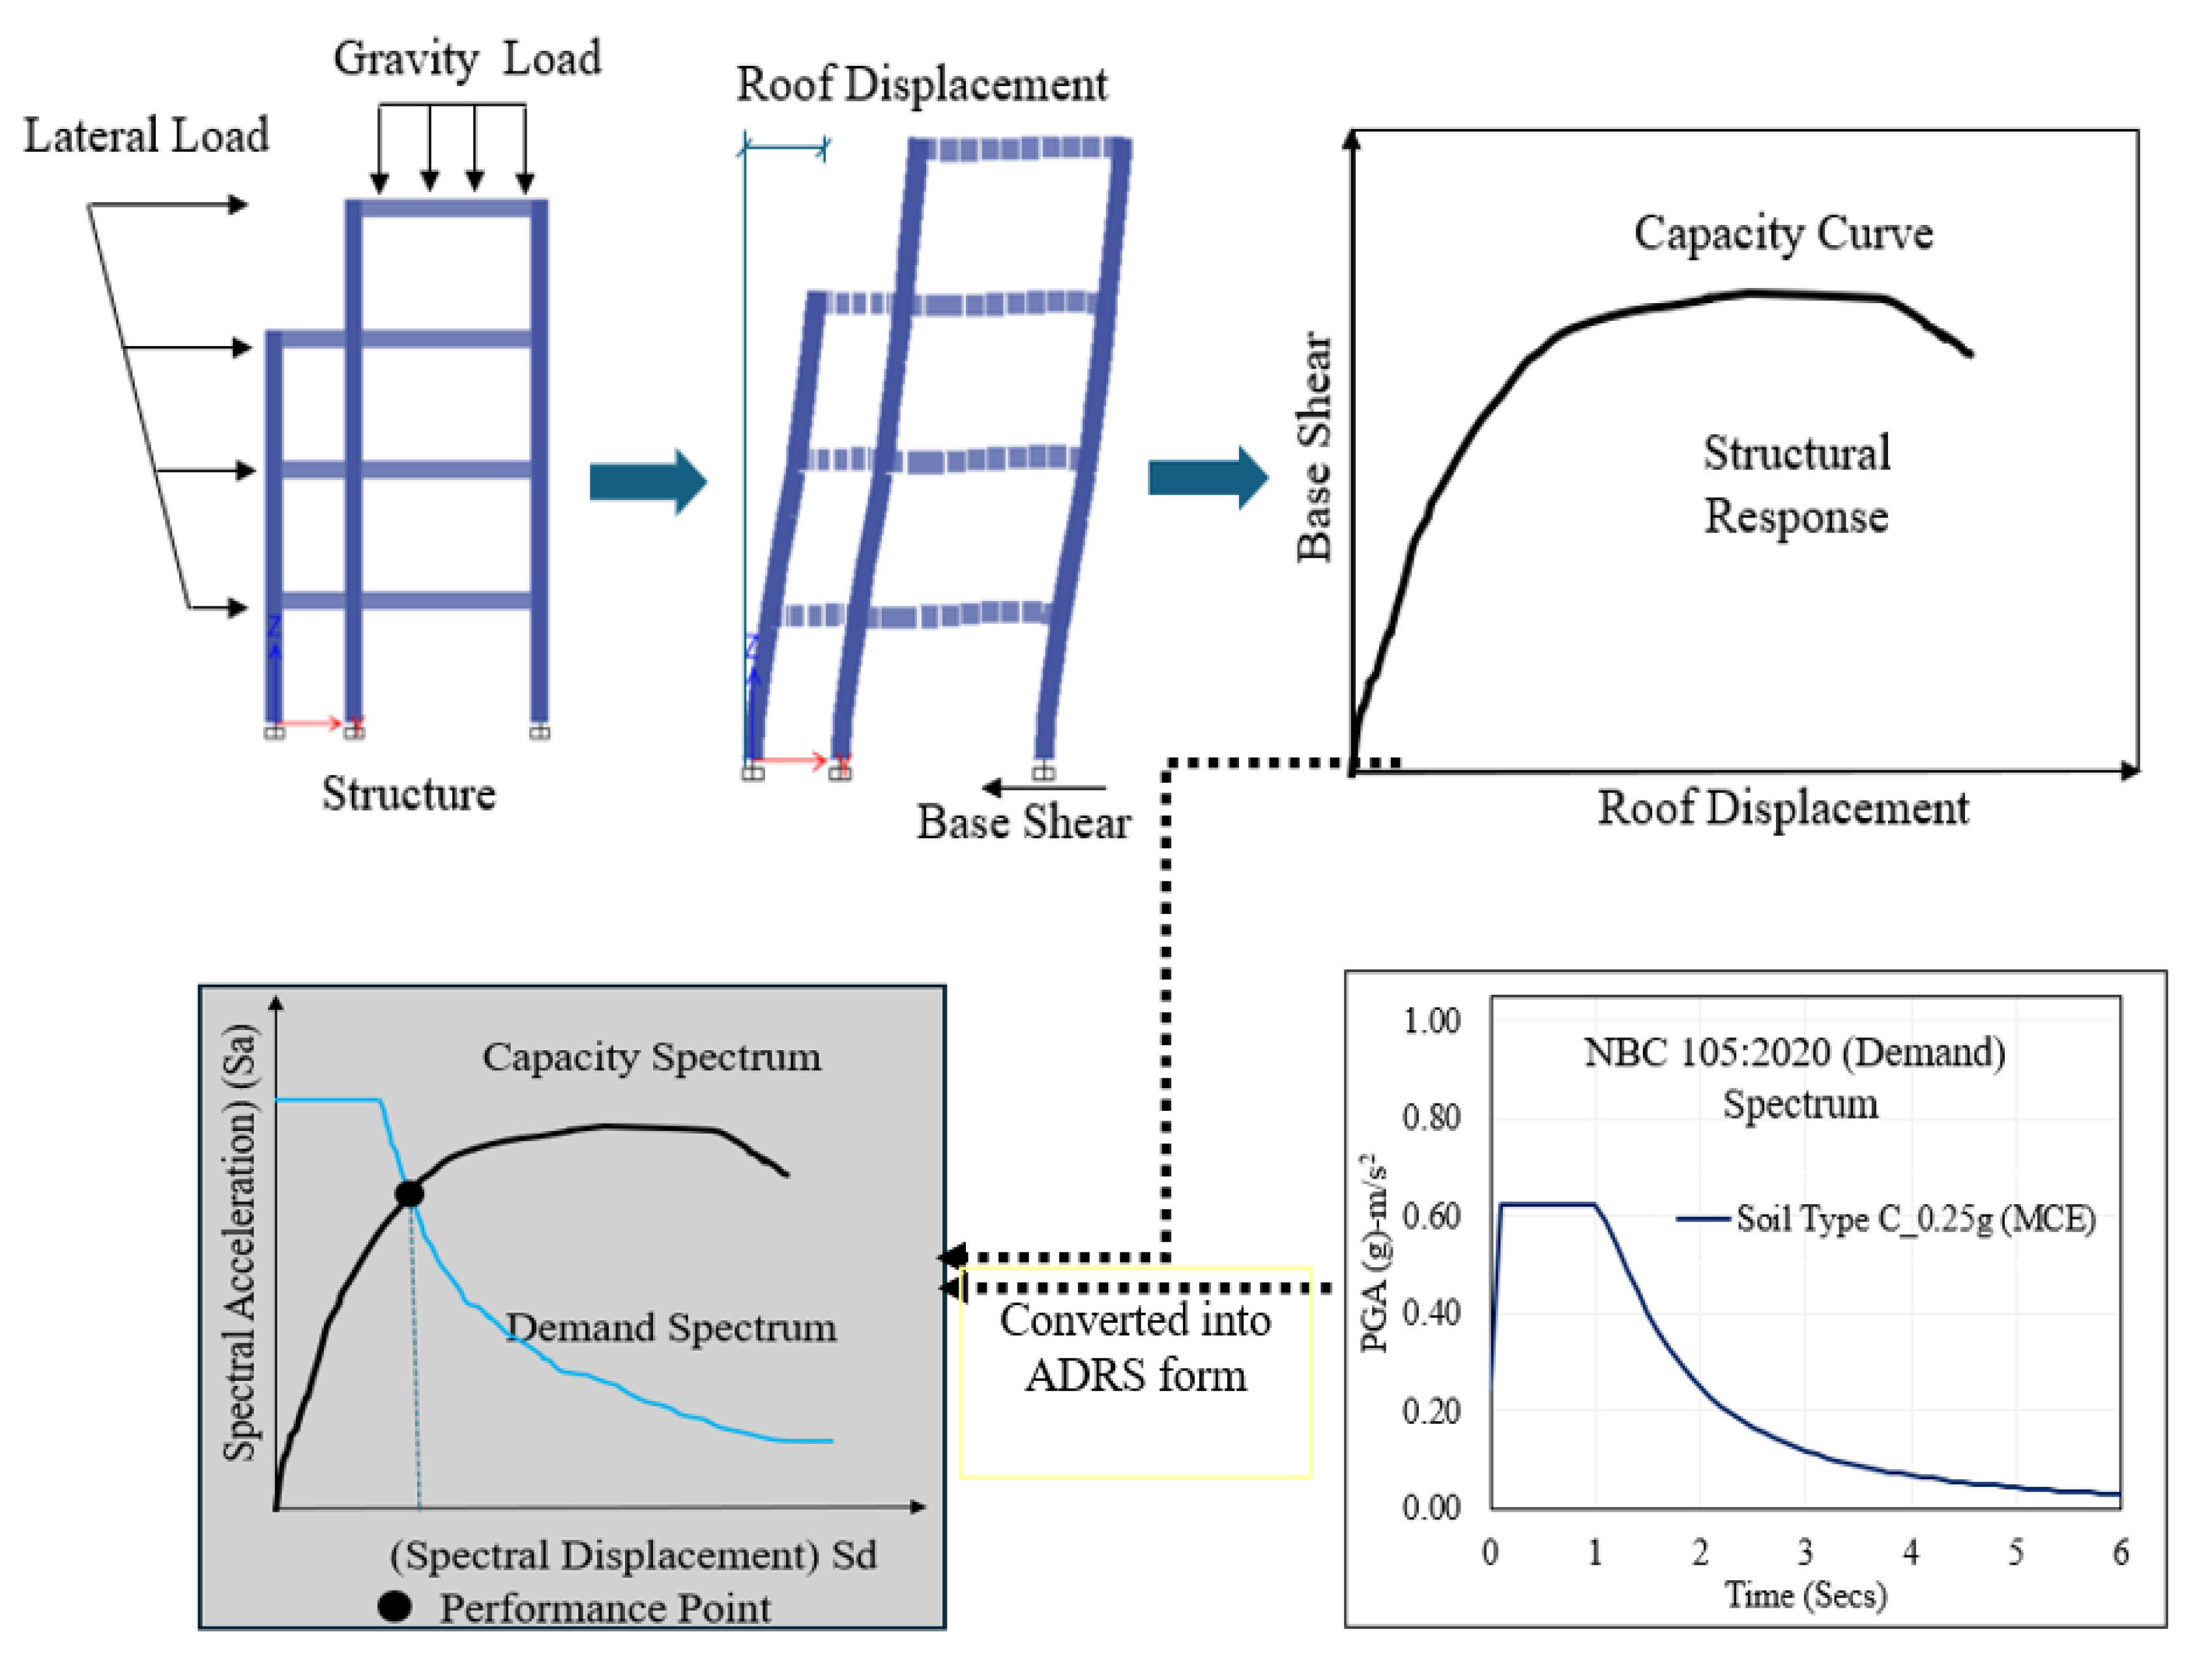
For pushover analysis, the nonlinear material properties of all structural components must first be rigorously defined. Following the development of the nonlinear model, the analysis can be executed using either user-defined hinge properties calibrated to the specific structural system or the default hinge libraries provided in widely used finite element software such as SAP2000, ETABS, and comparable platforms. These hinge definitions are typically based on established guidelines, including FEMA-440 [35], ASCE 41-17 [27], and ATC-40 guidelines [22], which employ the capacity spectrum approach originally proposed by Freeman and collaborators [36]. In this study, both moment and fiber hinge have their hinge properties manually evaluated and assigned in the models. Figure 6 shows the general process for predicting the structure’s performance point by using nonlinear static analysis. The pushover curve is converted into a capacity spectrum after it has been obtained. A demand spectrum can then be created from the general response spectrum in the form of an acceleration displacement response spectrum (ADRS) format [37]. The structure’s performance point, as depicted in Figure 6, is where capacity and the demand spectrum intersect. The overall capacity depends on the deformation and strength capacities of individual components in the structure, and this pushover capacity approximates how the structure responds when its elastic limits are exceeded. The performance levels can be established as per ATC-40 (1996) [22], FEMA 440 [35], and FEMA 356 [38], and to demonstrate the realistic seismic performance of the structures that adhere to the structure’s inelastic deformation.
Although pushover analysis is a widely used tool for evaluating seismic performance, its reliability decreases for certain building types. A single load pattern may not be sufficient to describe, in particular, irregular structures or vertical discontinuities and torsionally sensitive buildings with asymmetric stiffness or mass distribution. Higher mode effects and coupled torsional responses may be crucial in these situations, and non-linear time history analysis is typically more suitable. While this study does not focus on those structural configurations, it is crucial to understand that conclusions from pushover analysis should be applied cautiously to structures that are extremely irregular or sensitive to torsion.

7. Results and Discussions

7.1. Seismic Demand

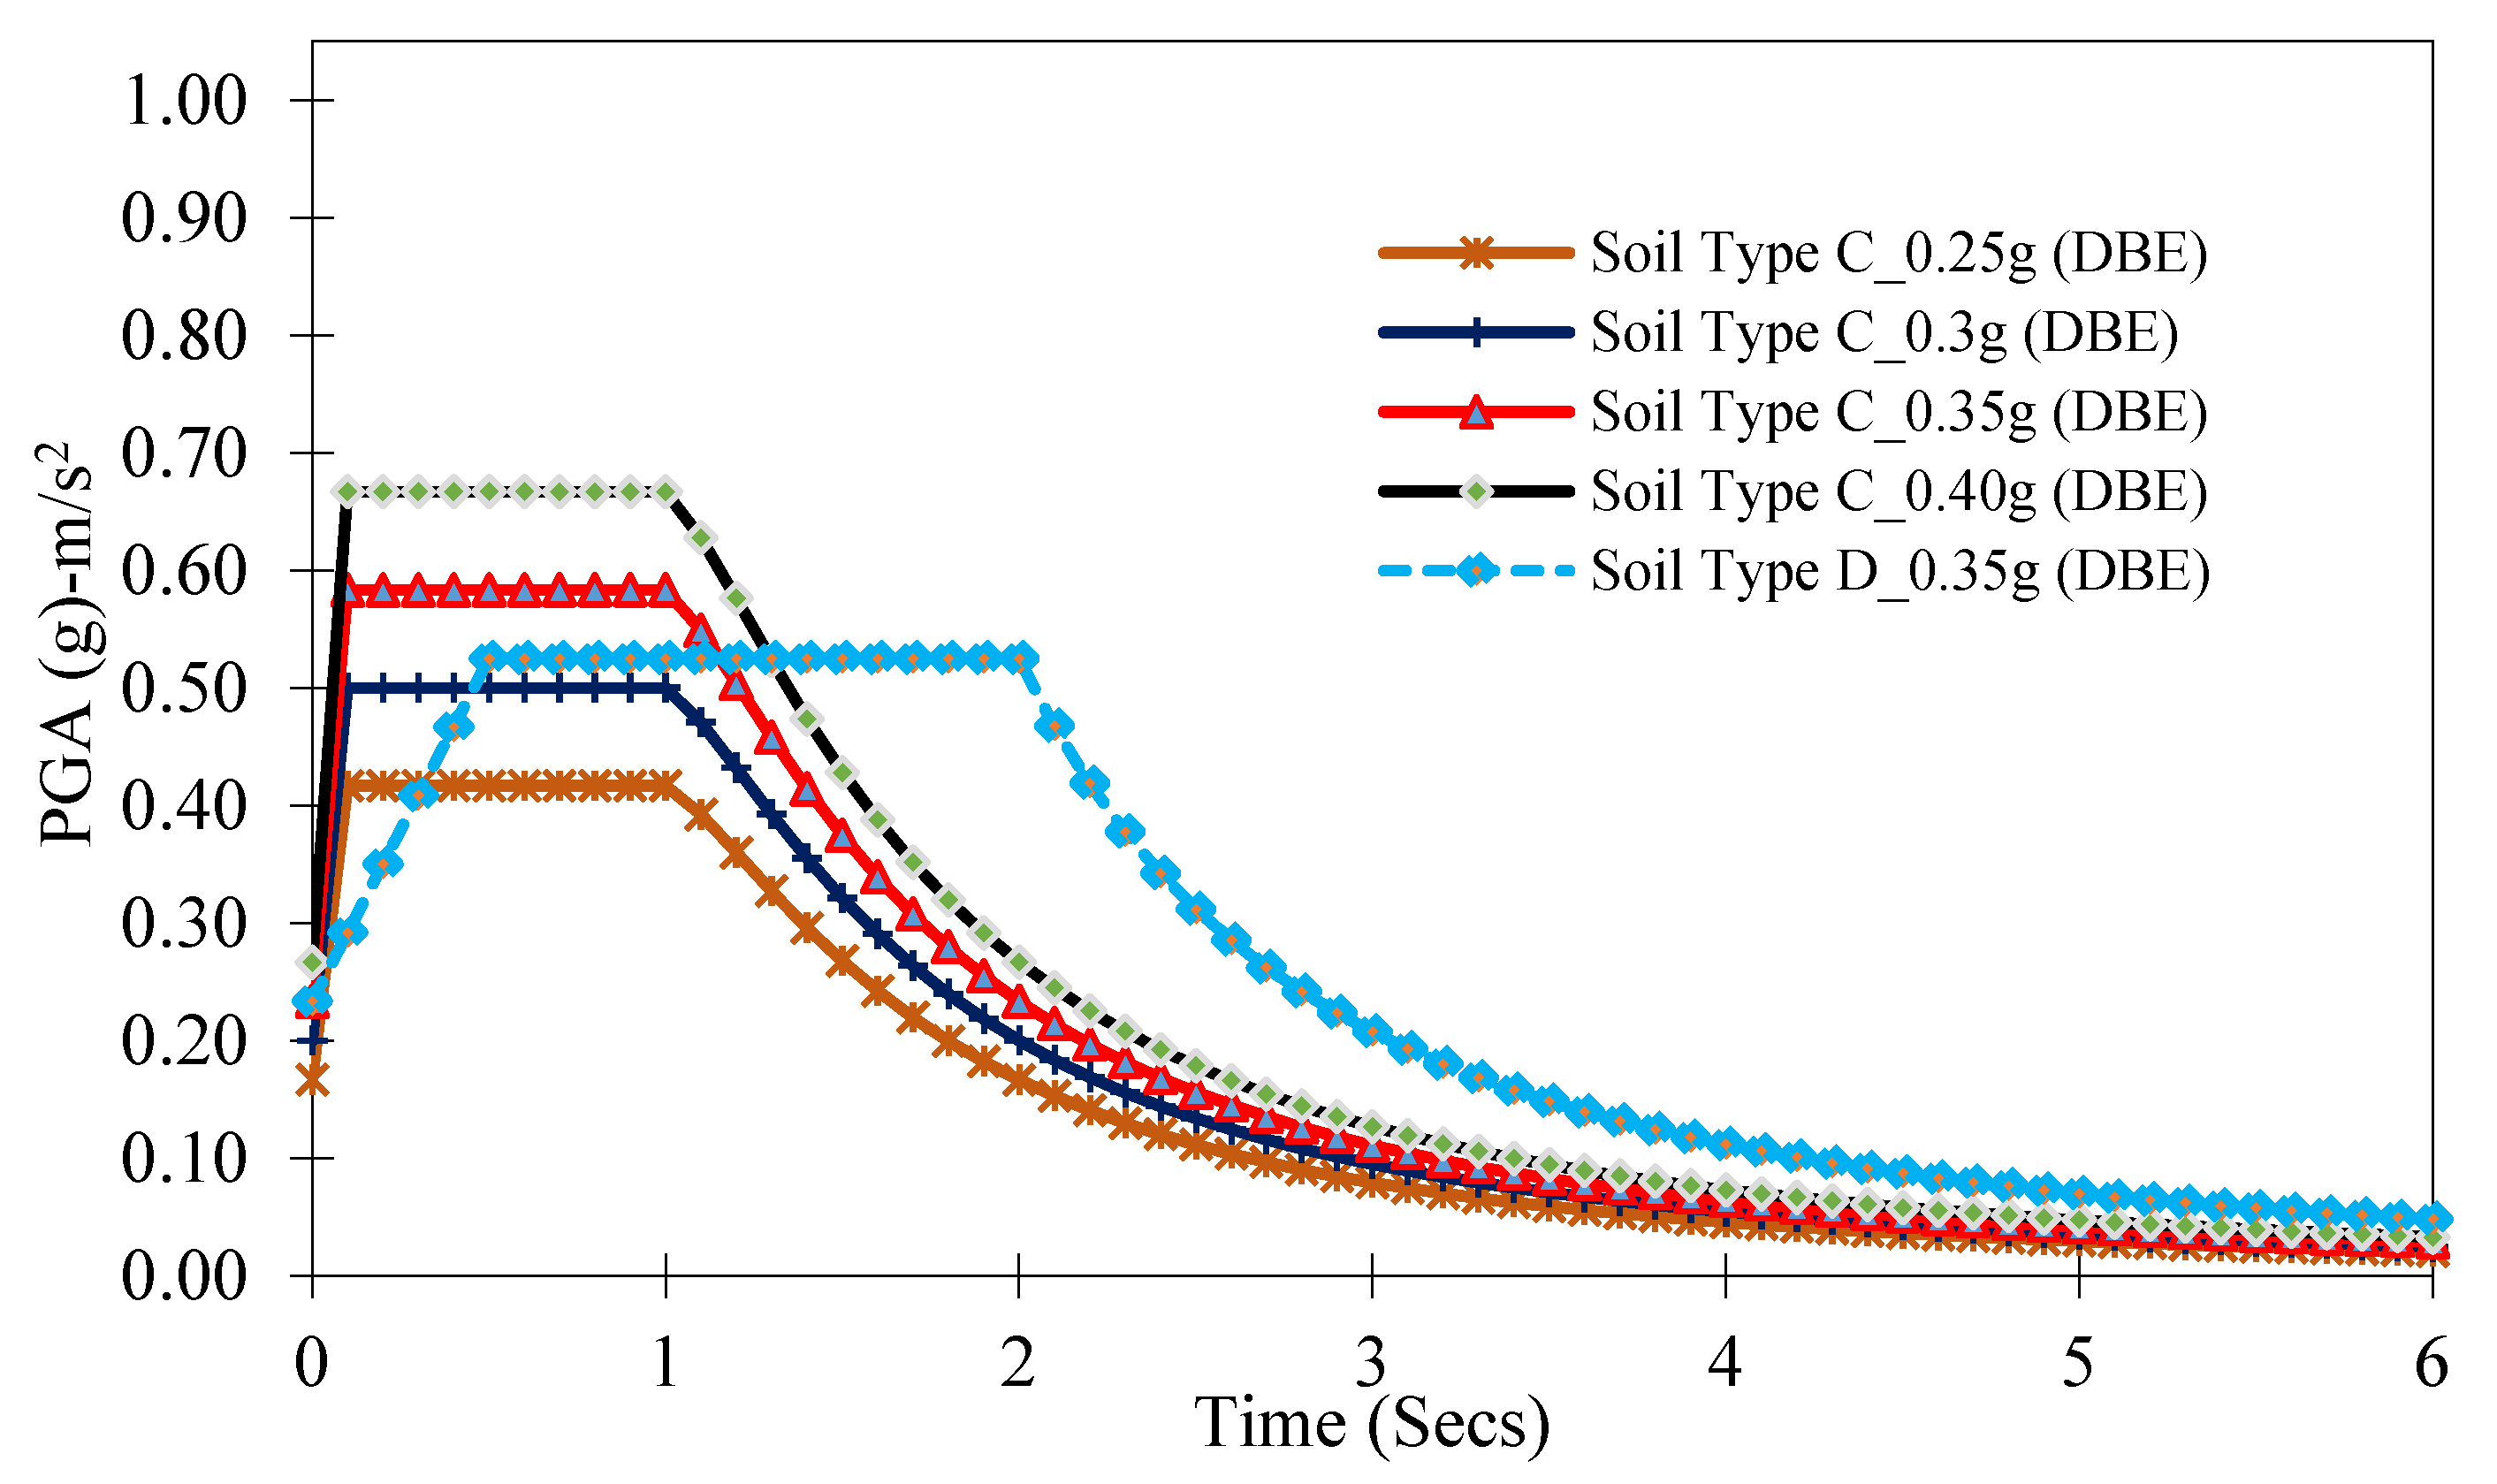
The response spectra were selected based on soil types C and D with different seismic demands (Z): 0.25 g, 0.30 g, 0.35 g, and 0.40 g for soil type C, and 0.35 g for soil type D, as prescribed in NBC 105:2020 and illustrated in Figure 7. The Over-strength factor (Ωu) for the ultimate limit state, which accounts for the extra reserve strength that is inherently present in structures, has been adopted from NBC 105:2020 for an appropriate structural system. This value is 1.5 for a reinforced concrete moment-resisting frame. Further, the target spectrum as presented in Figure 7 is obtained by dividing the elastic site spectra C(T) by the ULS overstrength factor (ῼu) as mentioned in the NBC 105:2020 “Scaling of ground motion” clause 9.3.2.2. The elastic site spectra C(T) is given by Equation (2):
C T = Ch T Z I
where Ch(T) denotes the spectral shape factor, Z is the seismic zone factor, and I represents the importance factor.

7.2. Pushover Capacity

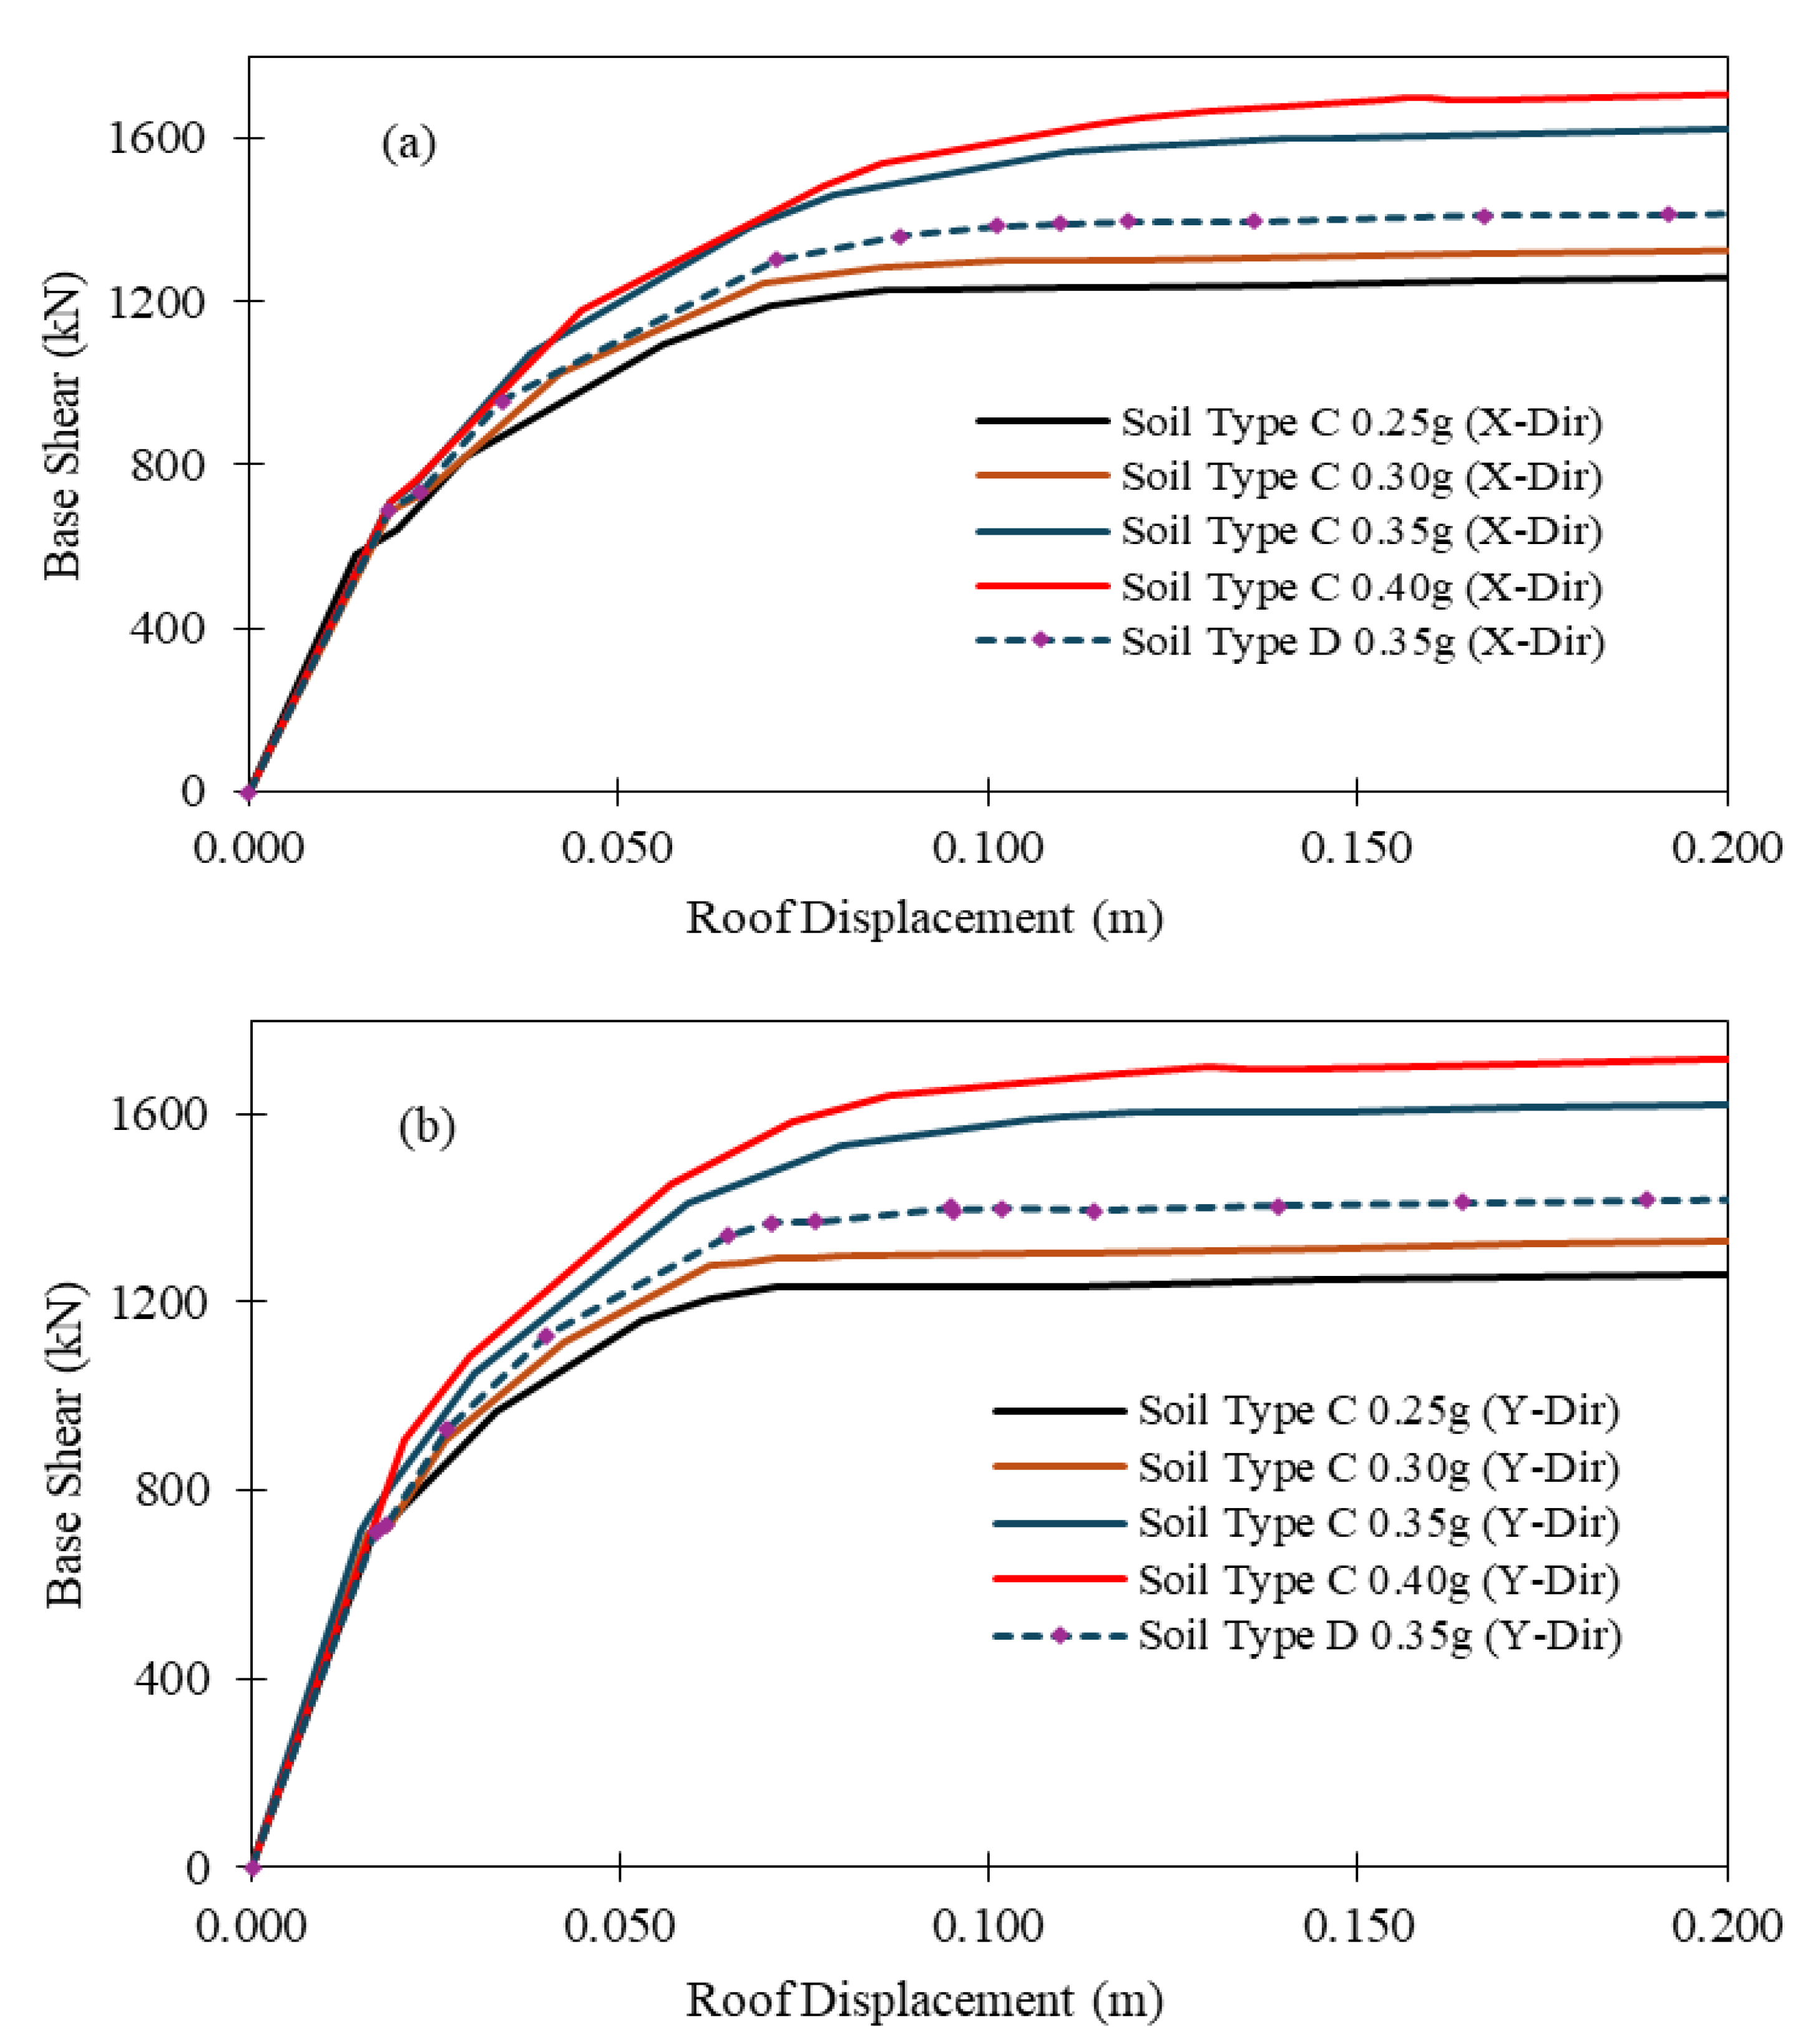
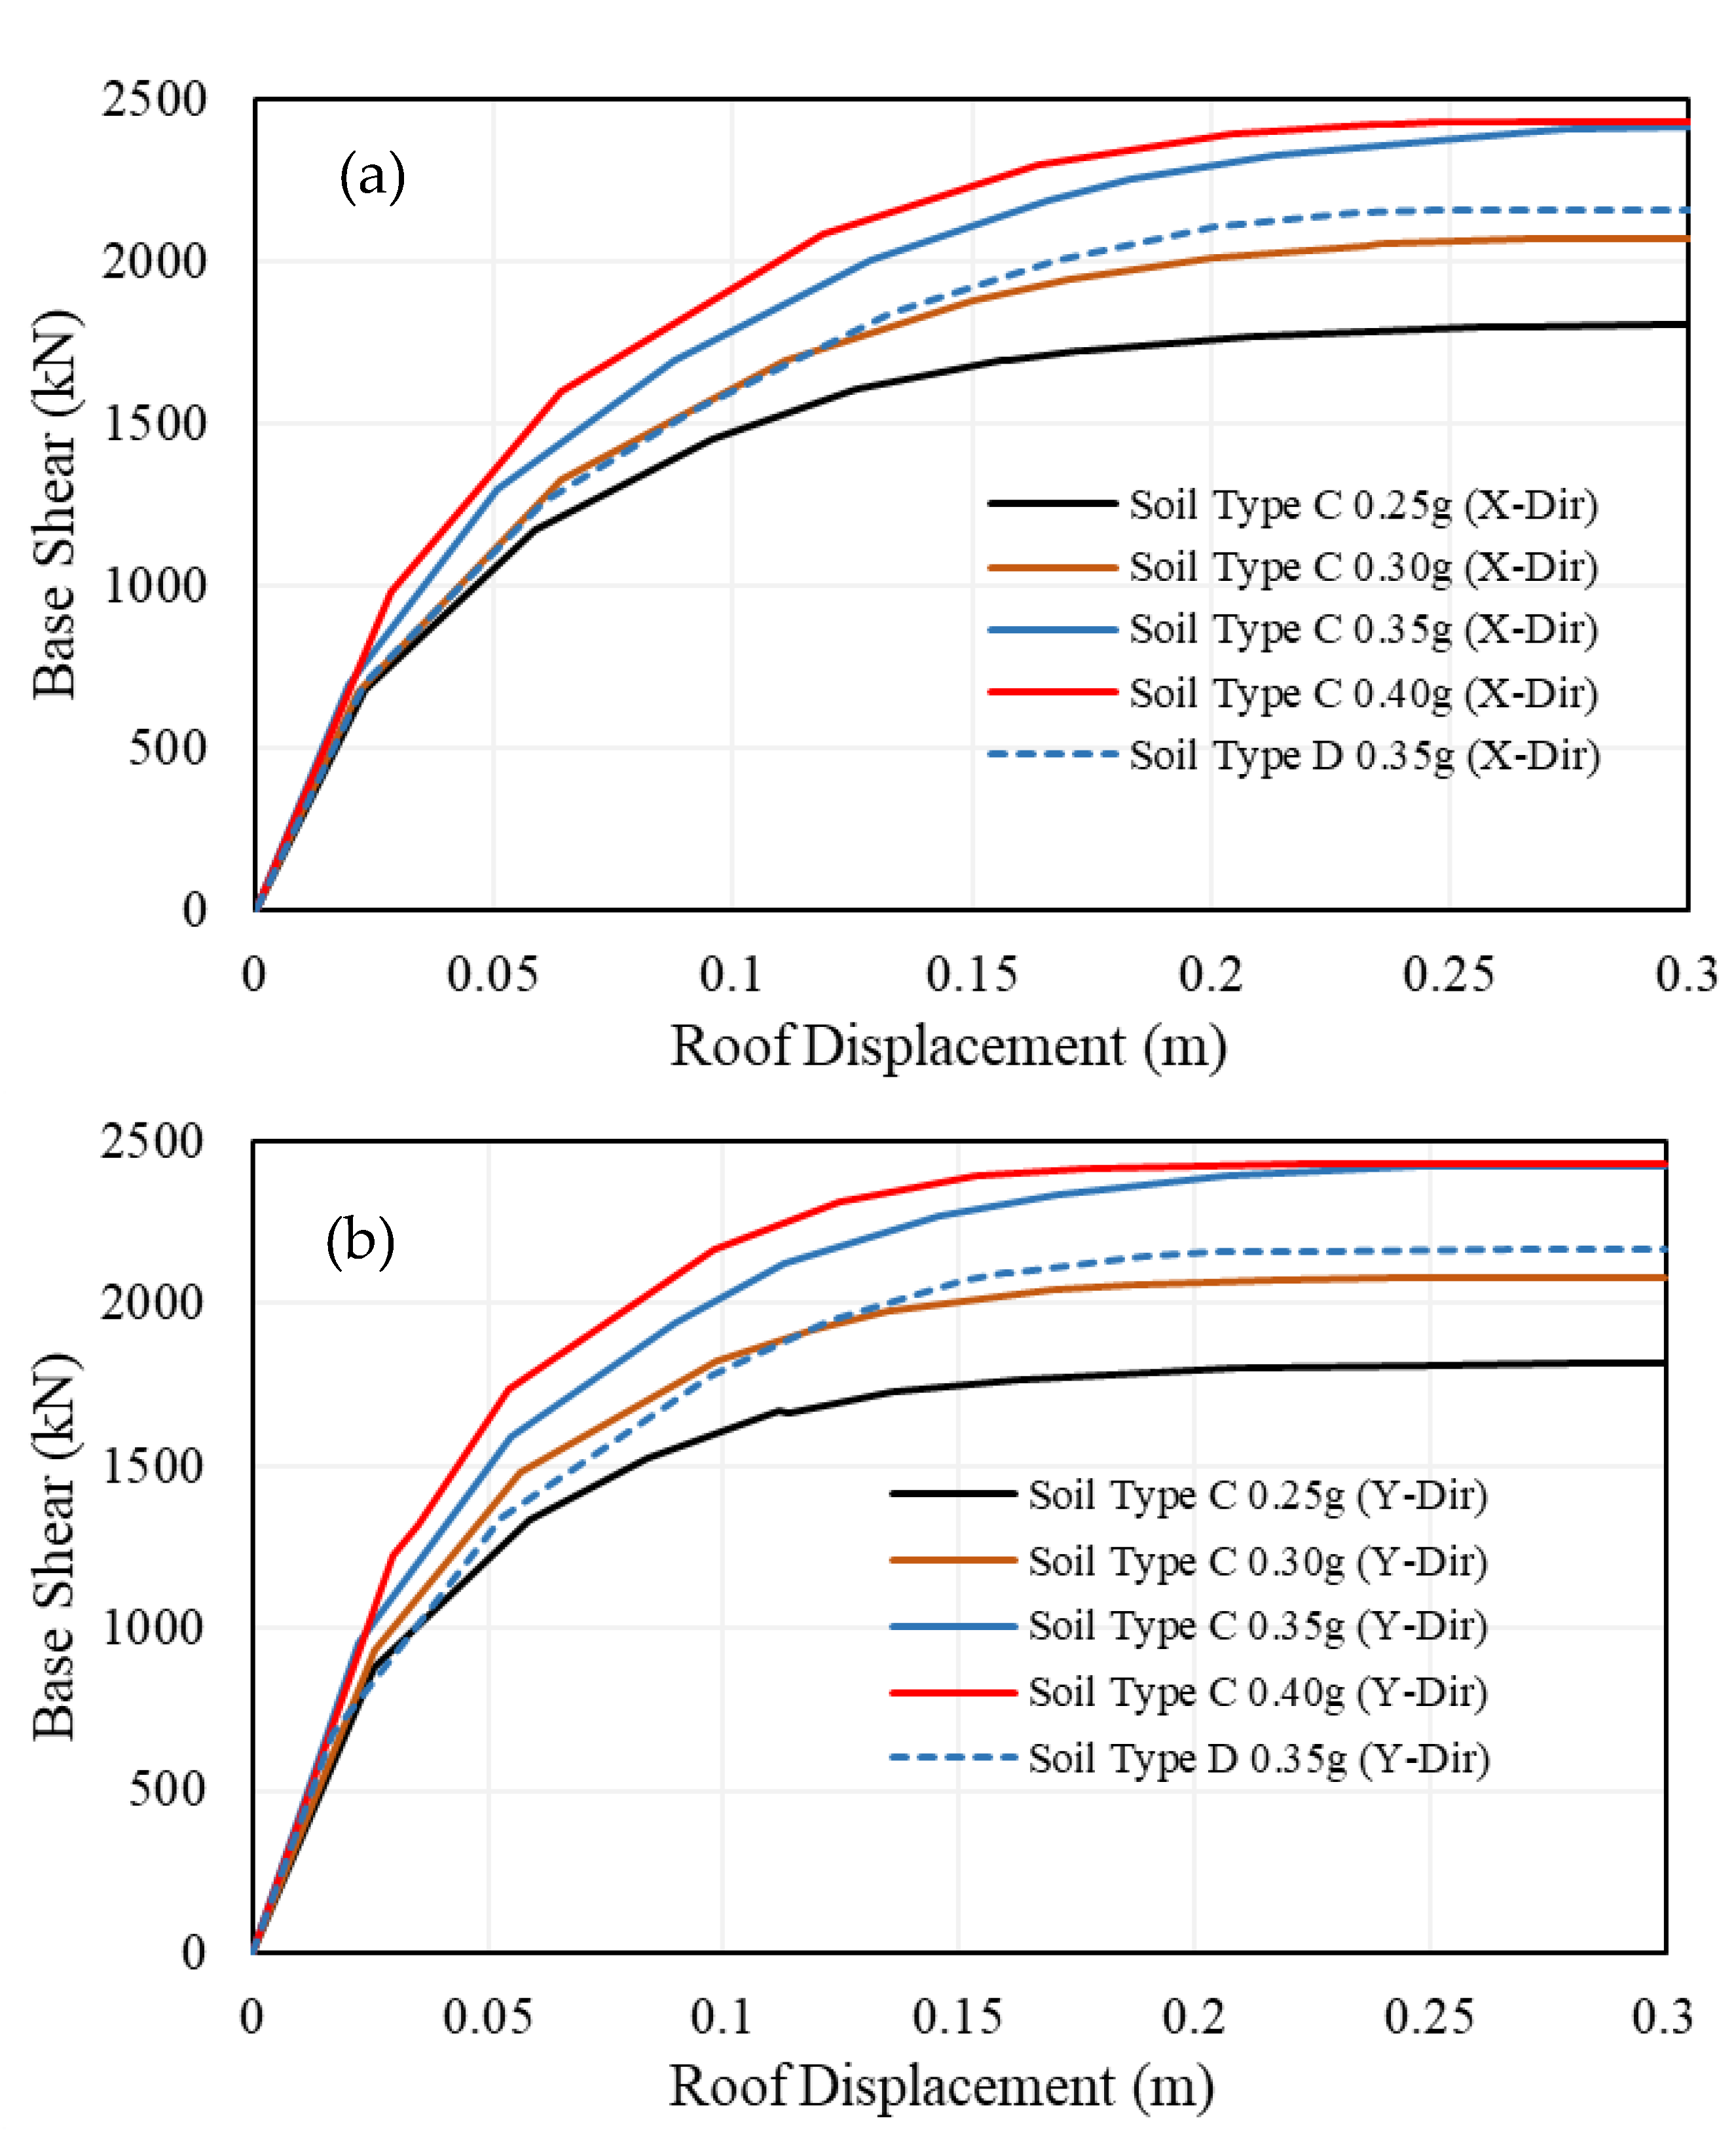
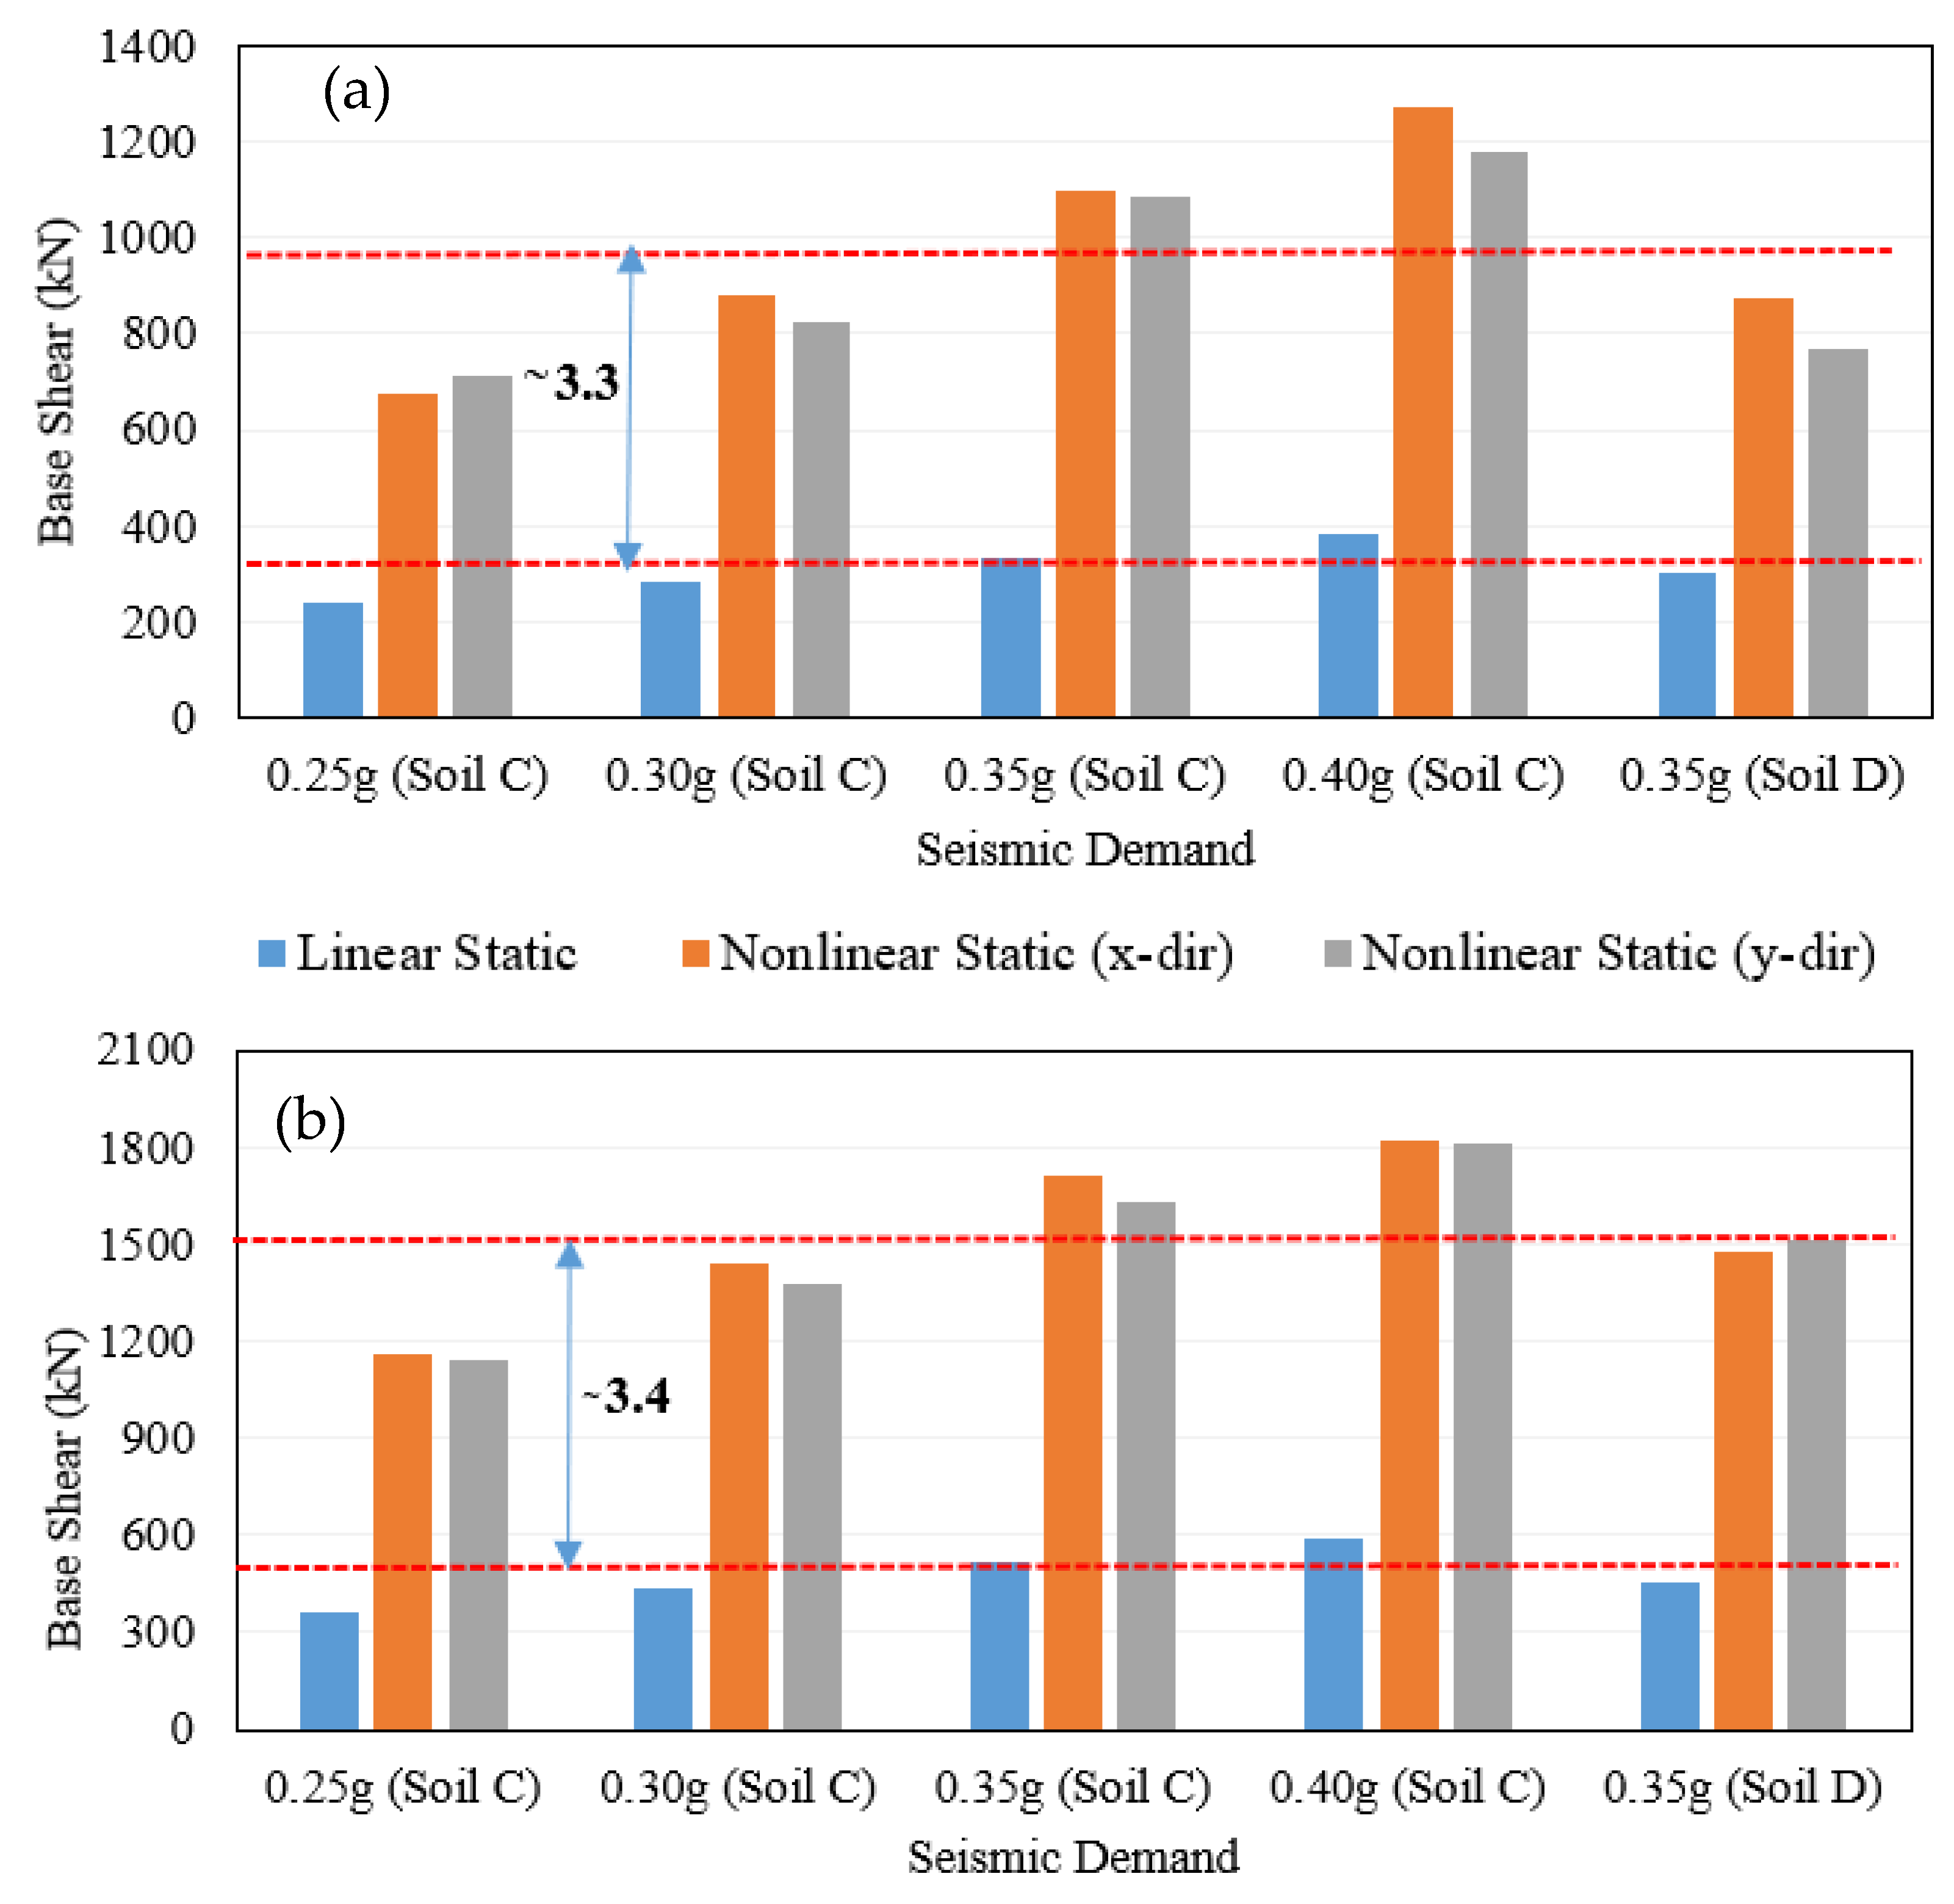
After defining the pushover load cases and assigning the target displacement in accordance with ATC-40 guidelines, incremental lateral loads are applied to the structure. The structure is then subjected to a displacement-controlled lateral loading procedure until the target displacement is reached. The resulting pushover capacity, determined using ETABS, is represented by the pushover curve, which plots base shear against roof displacement, as shown in Figure 8 and Figure 9. This analysis was performed for seismic demands ranging from 0.25 g to 0.40 g for soil type C and 0.35 g for soil type D for both the three-storey and four-storey buildings. The base shear, which is obtained after the pushover analysis in both 3 and 4-storey buildings, is approximately 3.3 and 3.4 times the design base shear, which is illustrated in Figure 10. As seen in the figure, the ultimate load-carrying capacity of the structure increases with the seismic demand because these structures were analyzed and designed accordingly, except for the seismic demand of 0.35 g for soil type D in which it is characterized as a very soft soil representing Kathmandu basin. These curves illustrate the overall stiffness and ductility of the framed structure and indicate the mechanism, load level, and deflection of the structure at which failure occurs. In both situations, the lateral displacement increases as the slope of the pushover bends steadily decreases. This is a result of plastic hinges gradually forming in the beams and columns of the entire structure.

7.3. Performance Point and Hinge Status

The performance point is defined as the intersection of the capacity curve and the demand curve, with both expressed in Acceleration-Displacement Response Spectrum (ADRS) format. The performance point for all pushover curves in both directions was determined using the FEMA-440 method [35], as summarized in Table 3 and Table 4. The results indicate that the buildings exhibit better performance at lower spectral acceleration levels, with a minimal number of plastic hinges forming in both directions, demonstrating that the designed structures are capable of withstanding earthquakes with a 10% probability of exceedance during their design life (DBE-level events). The distribution of hinges at the performance point is presented in Table 3 and Table 4 for x and y directions of motion, respectively, showing that for the range of seismic demands considered, most hinges remain in their initial state or have just begun to form. For the three-storey and four-storey buildings, which have a total of 132 and 190 hinges respectively, approximately 98–100% of the hinges remain within the Immediate Occupancy (A–IO) performance level, with only 1% to 2% reaching the Life Safety (IO–LS) level. Since the majority of hinges for seismic demands between 0.25 g and 0.40 g remain within the Immediate Occupancy range, the buildings are expected to resist moderate earthquakes (DBE level) without significant structural damage.

7.4. Storey Drift

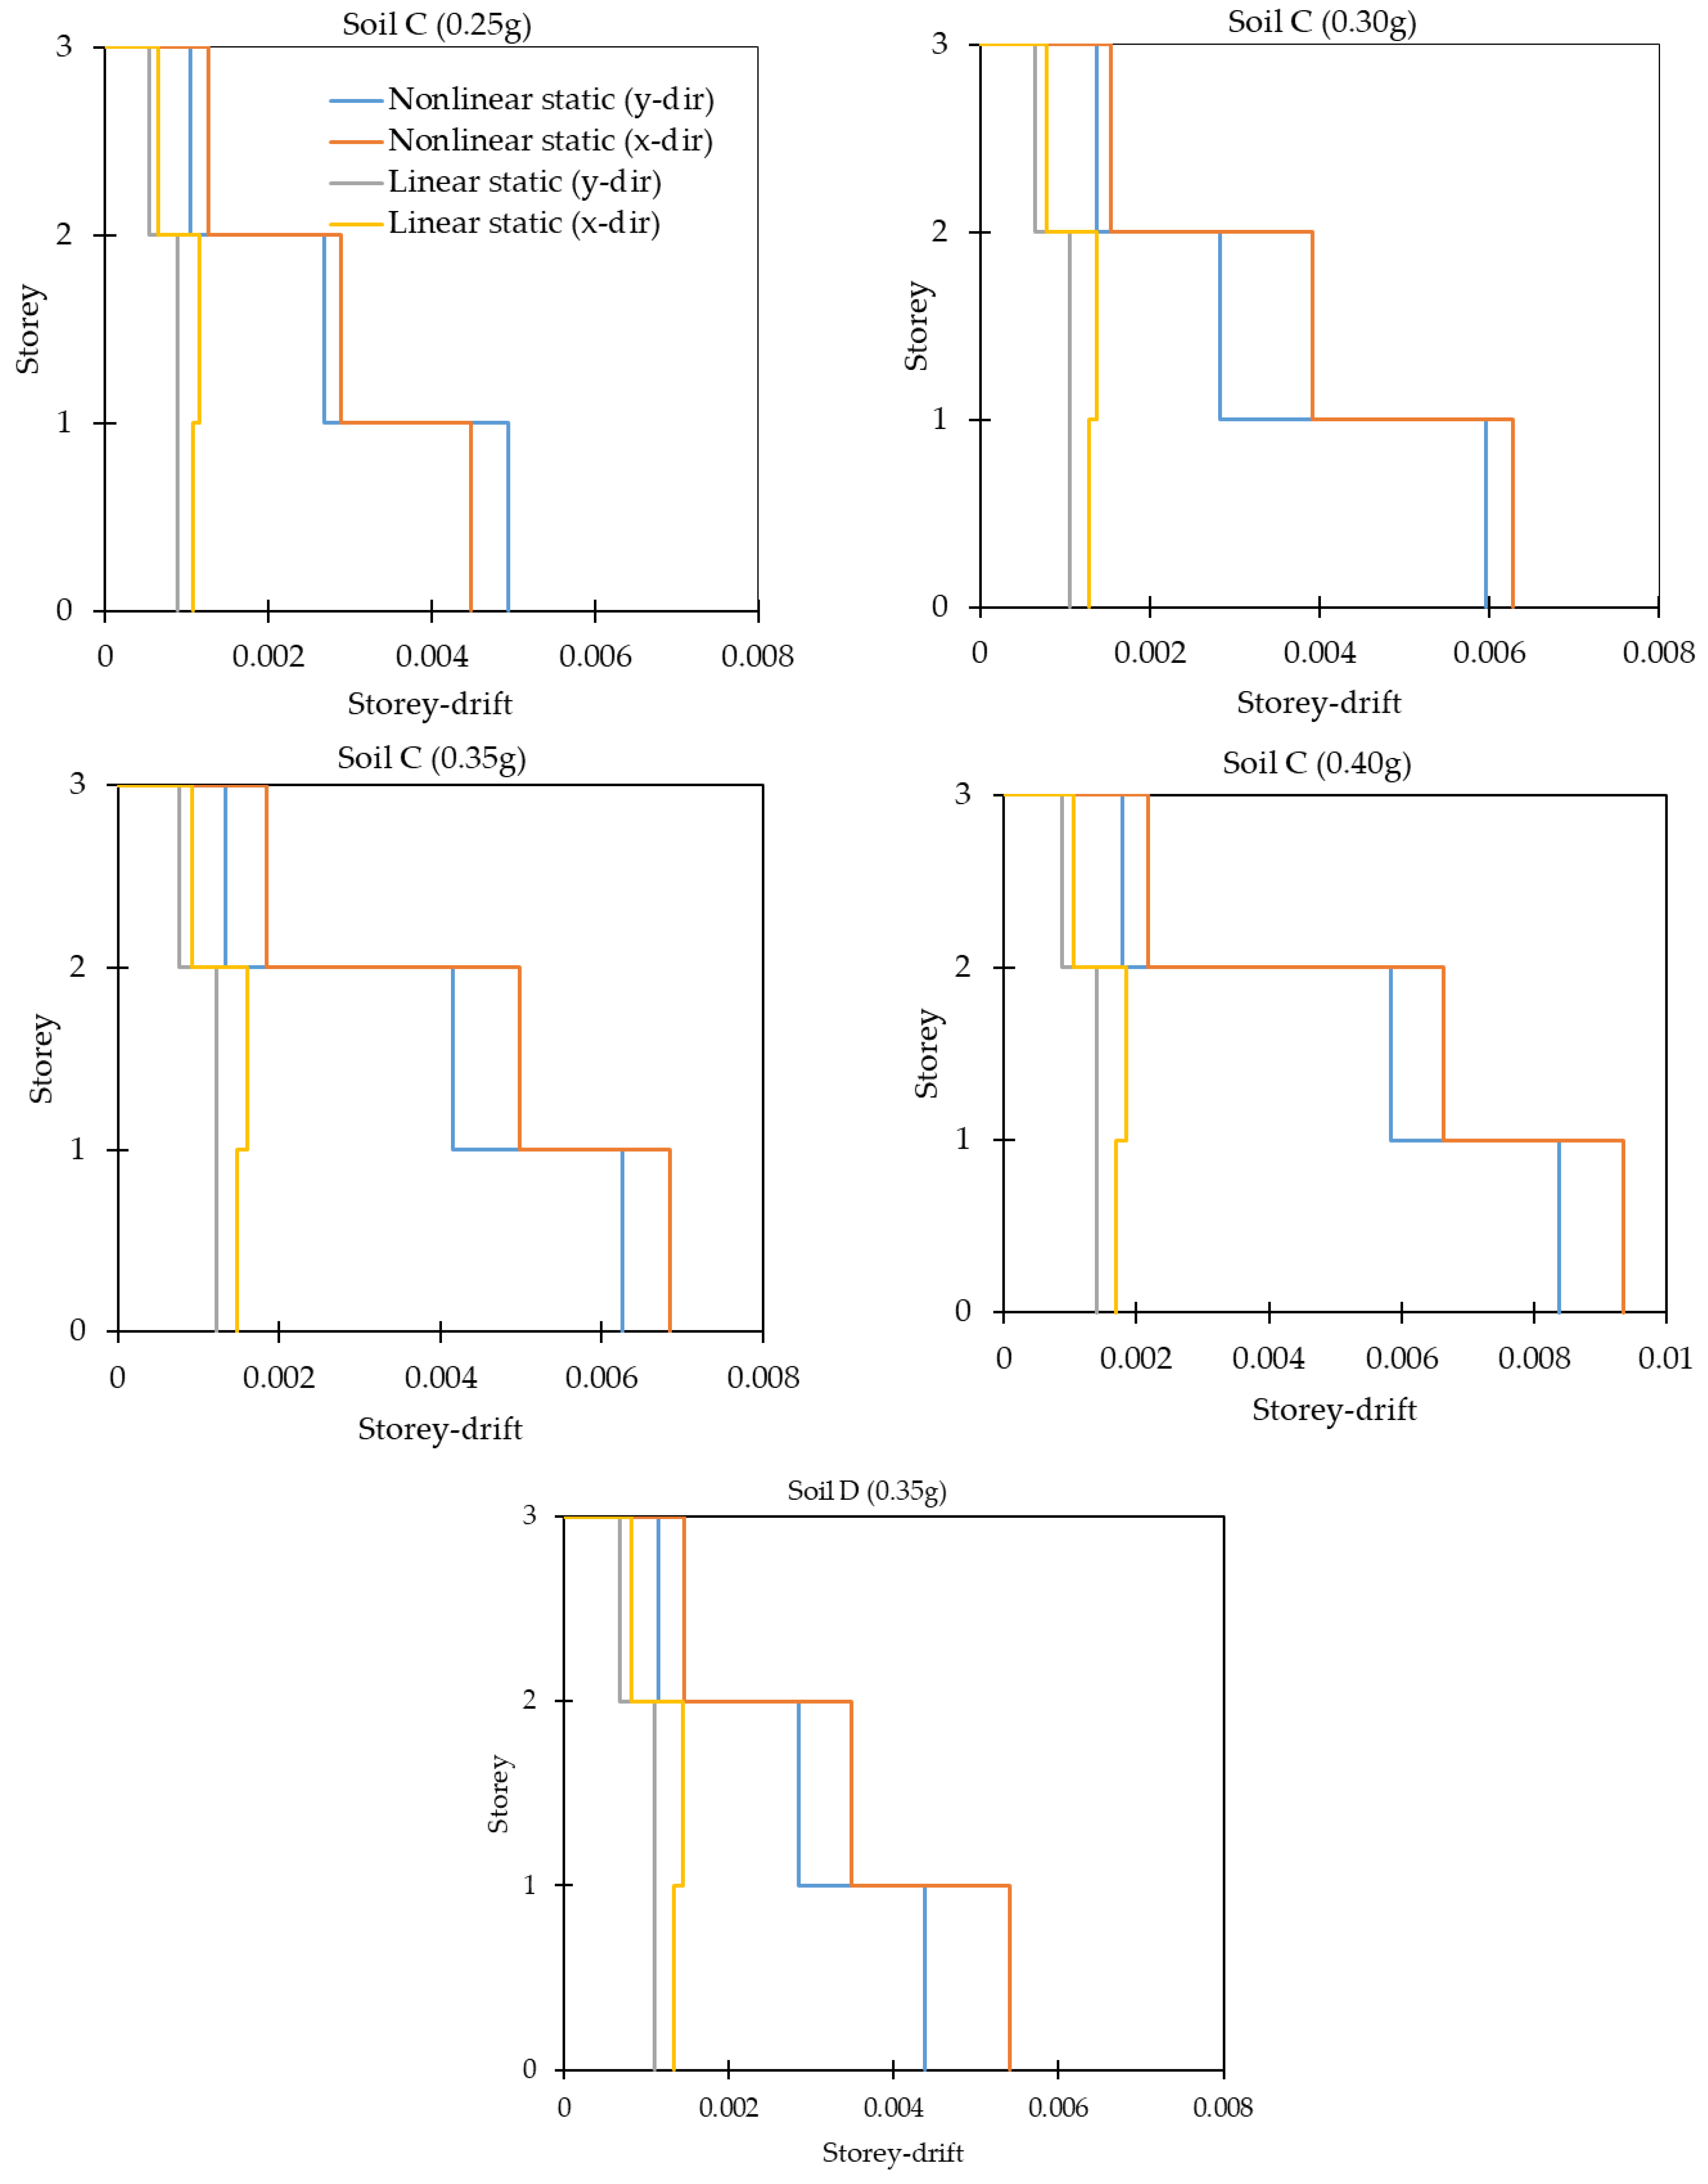
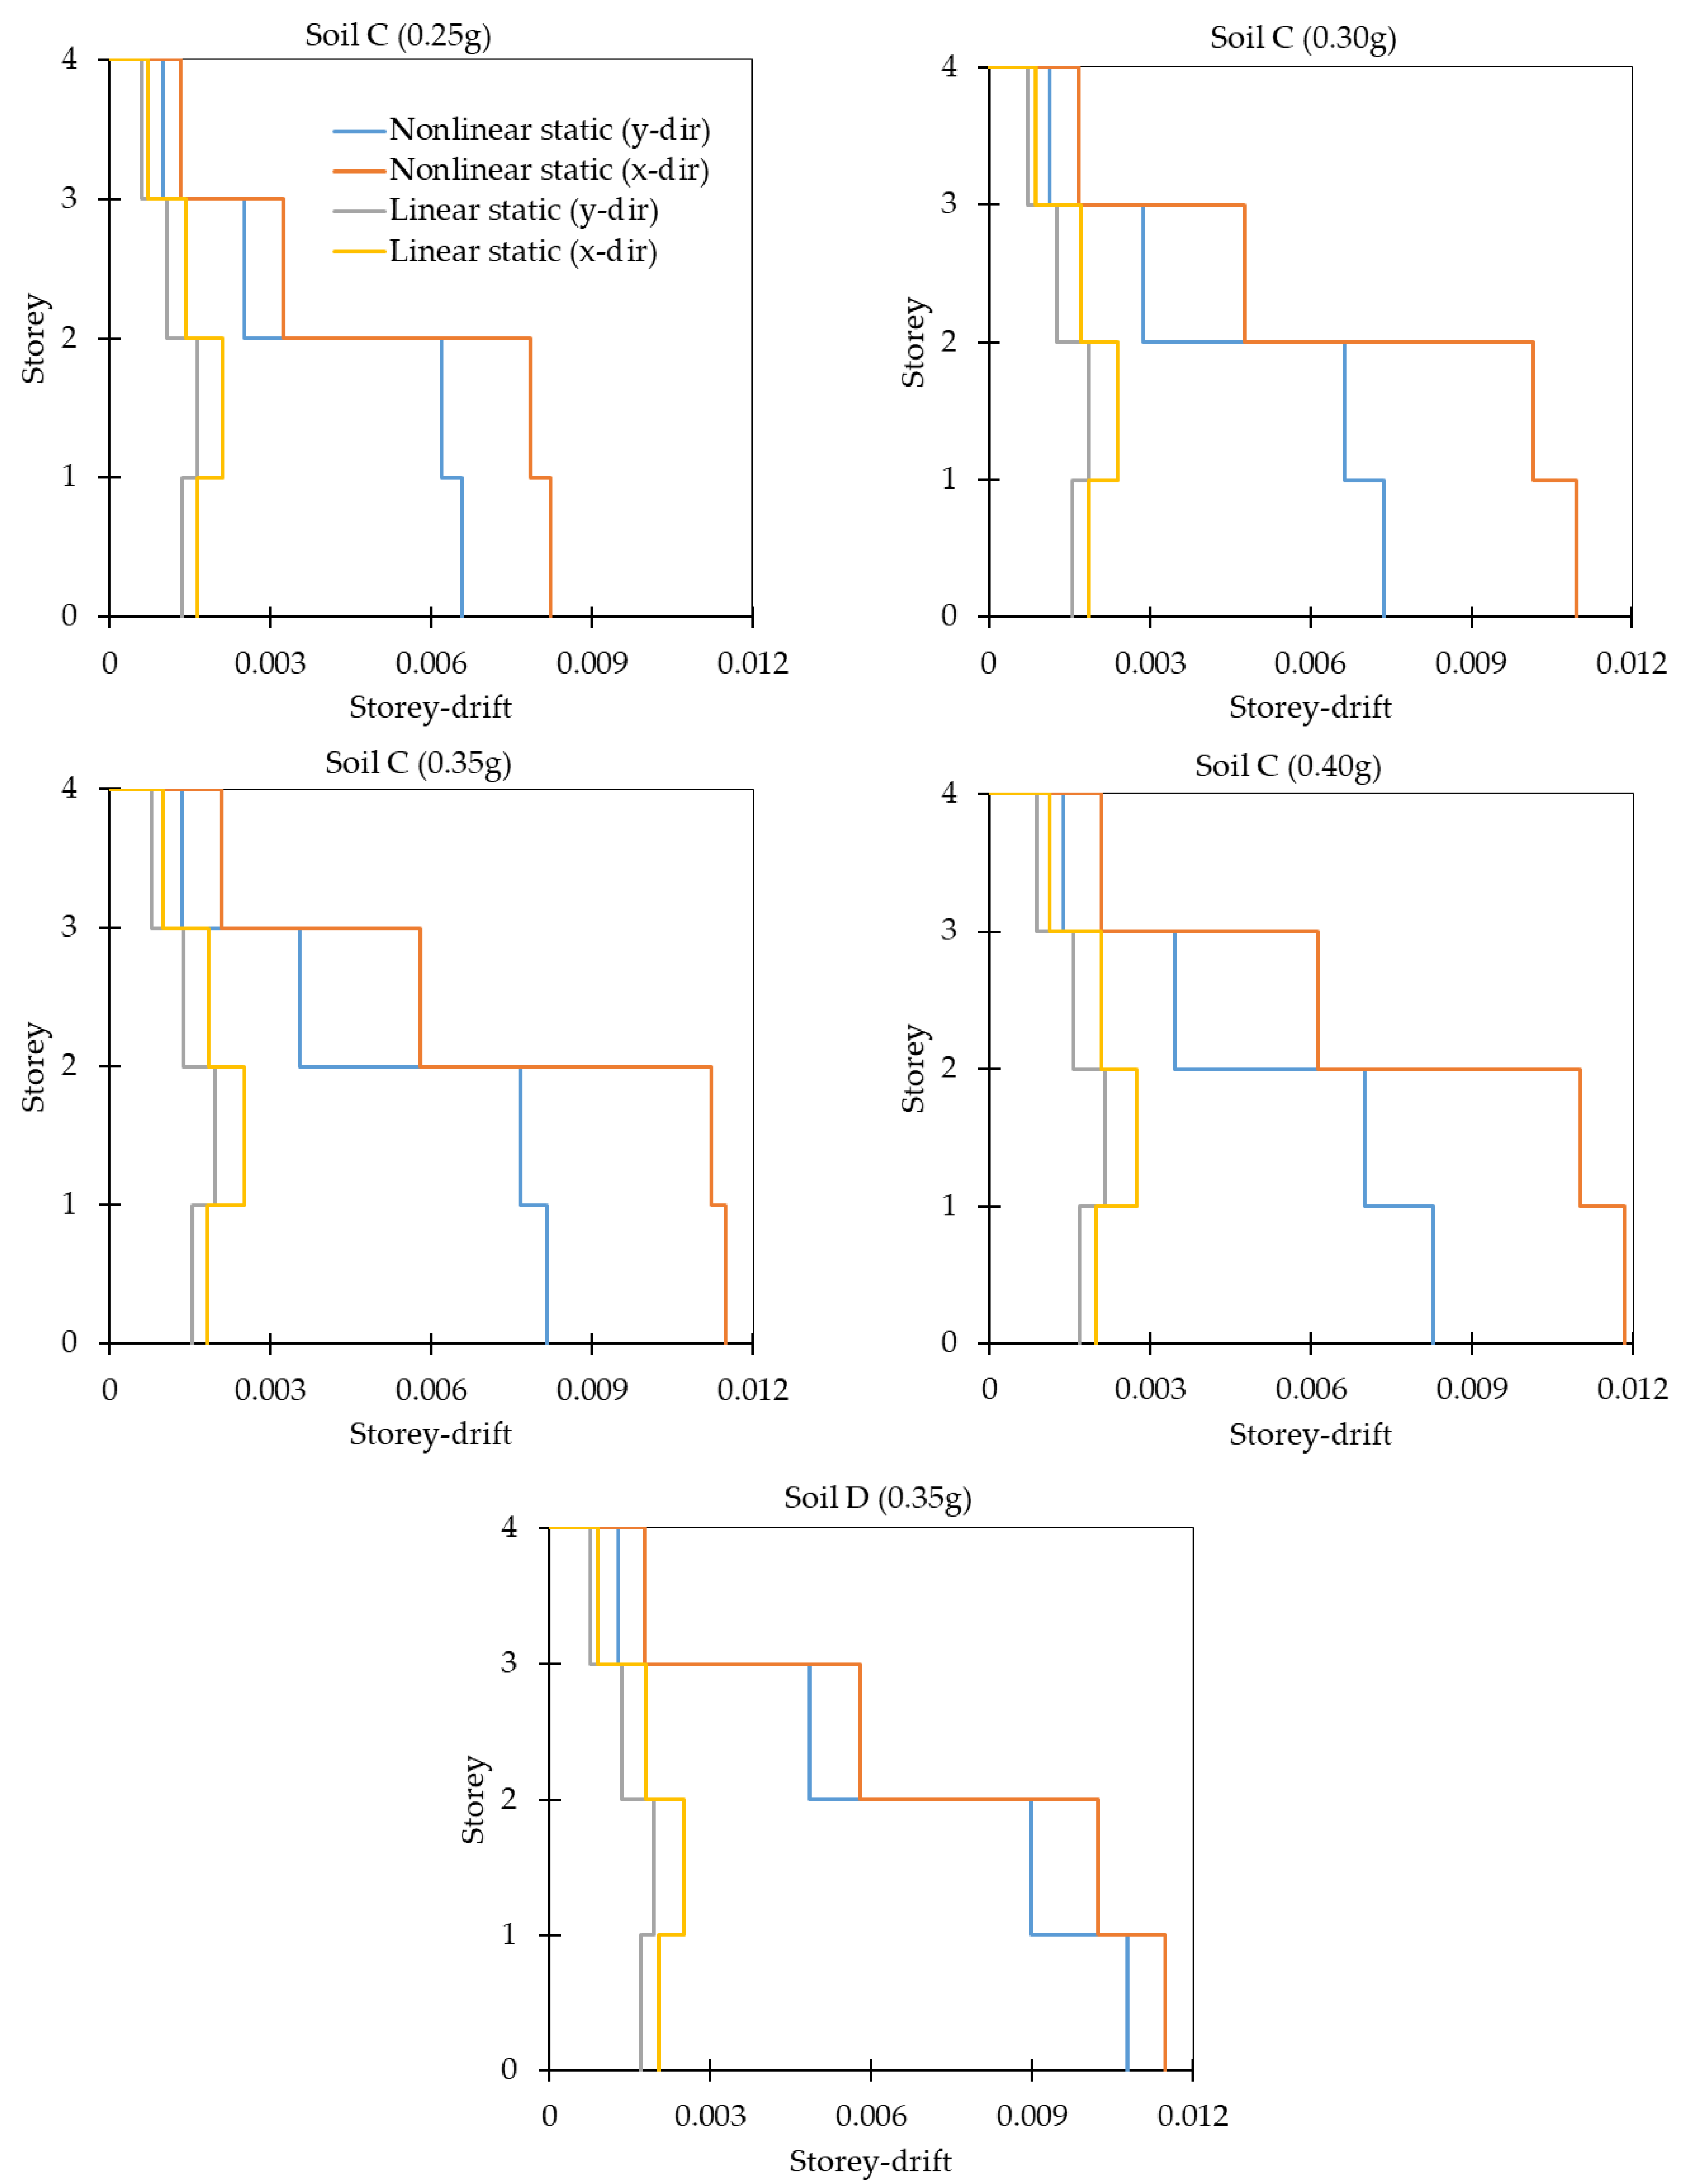
Storey drift is a critical measure of overall structural deformation and serves as an initial check in both linear and nonlinear analyses. If the storey drift is within acceptable limits, further analysis and design calculations can proceed. Figure 11 and Figure 12 illustrate the detailed distribution of inter-storey drift for the three-storey and four-storey buildings, respectively, comparing the results of linear static and nonlinear static analyses for soil types C and D. As shown in Figure 11 and Figure 12, the maximum inter-storey drift for both analysis methods occurs at the first storey, consistent with observations reported by [21]. According to NBC 105:2024, the allowable inter-storey drift limit for linear analysis is 2.5%, as specified in Clauses 5.6.1.1 and 5.6.3. The observed maximum drifts for the three-storey building are 0.32%, 0.42%, 0.50%, 0.56%, and 0.44% for seismic demands of 0.25 g, 0.30 g, 0.35 g, 0.40 g (soil type C), and 0.35 g (soil type D), respectively. For the four-storey building, the corresponding drifts are 0.64%, 0.75%, 0.79%, 0.86%, and 0.77%. These values are well within the prescribed limit, indicating that the buildings meet the drift requirements for the considered seismic demands.

7.5. Hinge Formation

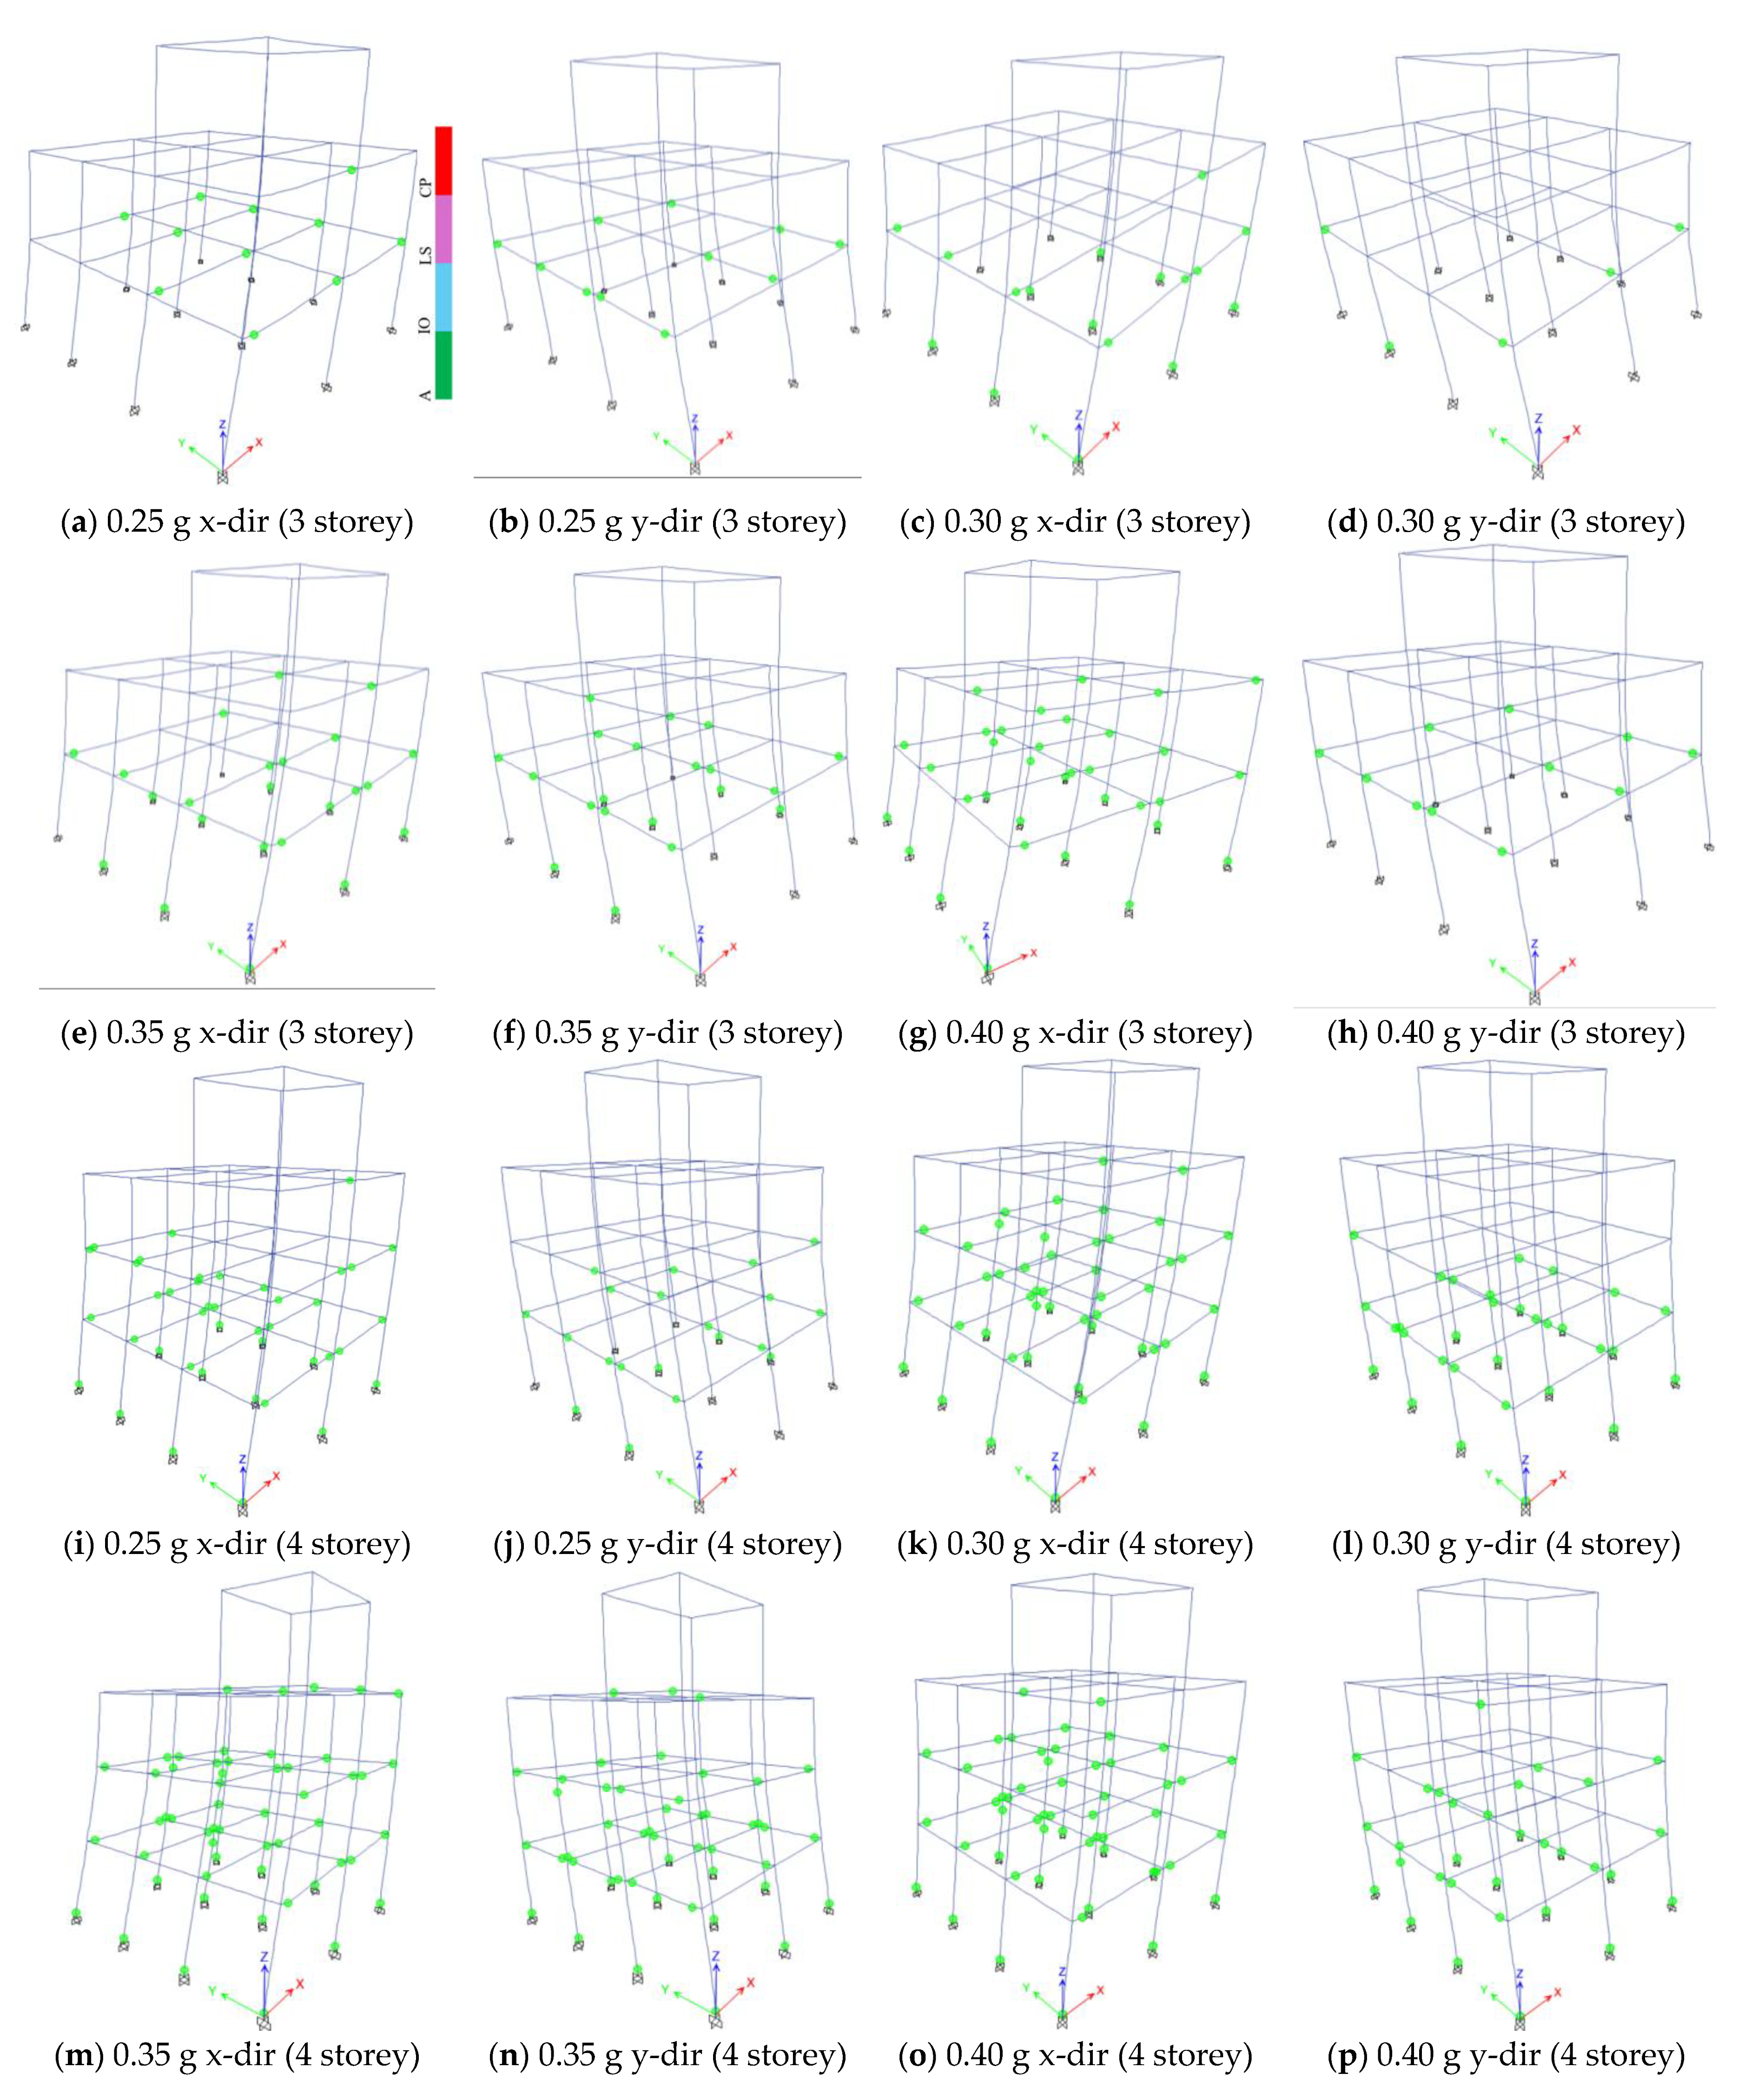
The formation of plastic hinges for all 10 building models in X and Y directions at different storey levels is shown in Figure 13 and Figure 14. These figures demonstrate that the upper storeys remain within the elastic range, with no plastic hinges forming, while plastic hinge formation initiates in the structural members of the lower storeys and gradually propagates upwards. Although all hinges remain within A–IO performance level, the results indicate that hinges first form in the beams of the lower storeys, followed by the lower columns. This pattern reflects limited structural damage across all seismic demands considered. For seismic demands of 0.25 g and 0.30 g for soil type C and 0.35 g for soil type D, hinge formation is primarily concentrated in the beams of the first storey. For higher seismic demands of 0.35 g and 0.40 g for soil type C, hinges predominantly form in the first-storey beams, followed by the second-storey beams and the bases of columns, as illustrated in Figure 13 and Figure 14. As most plastic hinges developed in the beam elements, the strong column–weak beam design philosophy was satisfied, thereby reducing the likelihood of progressive collapse during seismic events.

8. Conclusions

This study evaluated the seismic performance of buildings designed in accordance with the Ready-to-Use Detailing (RUD) guidelines. Equivalent static and nonlinear pushover analyses were carried out using the displacement coefficient method (FEMA-440) in ETABS software. The seismic base shear, storey drift, capacity curves, and hinge formation were compared and assessed. The key conclusions are as follows:
  • Almost all the hinges formed in the beam and column elements remain within the Immediate Occupancy (A–IO) performance level, with hinges initially forming in the lower-storey beams before propagating to the lower-storey columns. This pattern aligns with the strong column–weak beam design philosophy, which effectively prevents progressive structural failure.
  • The base shear ratios of 3.30 and 3.40 for linear and non-linear static analysis indicate that the buildings sustain higher base shear than elastic base shear demand, demonstrating that buildings possess additional strength beyond codal provision, but it should be noticed that higher base shear does not ensure satisfactory seismic performance. Other parameters like deformation, ductility, etc., need to be evaluated to ensure proper seismic safety of the structure, which is not the current scope of this work.
  • Linear static analysis for soil type C with a seismic demand of 0.40 g indicates that the maximum inter-storey drift reaches 0.56% for the three-storey building and 0.86% for the four-storey building, representing the highest drift values among the demands considered. This suggests that structural stiffness could be optimised through adjustments to beam and column sizes. Nonetheless, to fully verify seismic performance, a detailed nonlinear time history analysis (NLTHA) is recommended.
  • The performance point was determined using the code response spectrum specified in NBC 105:2020 for design-level earthquakes with a 10% probability of exceedance in 50 years (corresponding to a 475-year return period). Based on this study, buildings constructed in accordance with the RUD guidelines may be expected to withstand design-level earthquakes, provided that appropriate quality control measures are enforced during construction, proper seismic detailing is implemented as per the prevailing guidelines, high-quality construction materials are used, technical supervision is ensured, and trained masons are engaged throughout the construction phase.
For more reliable prediction of seismic performance, future research should consider conducting detailed non-linear time history analyses using a large set of ground motions with varied characteristics to capture dynamic behaviour more accurately and evaluate energy dissipation capacity more comprehensively. For RUD guidelines to be successful, strong emphasis should be placed on quality control and site monitoring. It is recommended that the government authorities, municipalities, and other professional institutions establish such a mechanism to ensure proper inspection of construction materials, reinforcement detailing, and workmanship with their necessary site supervision and inspection. Without such inspection, the envisioned safety and resilience of the RUD guidelines cannot be assured, and the risk of poor seismic performance by the constructed buildings remains high.

Author Contributions

Conceptualization, software, investigation, writing, original draft preparation, formal analysis, data curation, validation: J.P.; original draft preparation, review and editing, investigation, methodology: P.K.; original draft preparation, review and editing: S.A. All authors have read and agreed to the published version of the manuscript.

Funding

This research received no external funding.

Data Availability Statement

The authors confirm that the data supporting the findings of this study are available within the article.

Conflicts of Interest

All authors confirm no known financial interests or personal relationships that might be perceived as influencing the research presented in this paper.

Appendix A. Column and Beam Reinforcement Details

Table A1. Column reinforcement details for a two-storey plus staircase cover (3-storey, Փ denotes the diameter of reinforcement bars in mm).
SNSoil Type Seismic Zone Factor (g)Column Reinforcement Details for Two Storey Plus Staircase Cover (3-Storey)
StoreySize (mm)CornerFace InteriorStaircaseStirrups
1C0.25Ground Floor350 × 3504–16Փ + 4–12Փ4–16Փ + 4–12Փ4–16Փ + 4–12Փ4–16Փ + 4–12Փ8Փ@75/125 mm c/c
First Floor350 × 3504–16Փ + 4–12Փ4–16Փ + 4–12Փ4–16Փ + 4–12Փ4–16Փ + 4–12Փ
Staircase Cover350 × 350 4–16Փ + 4–12Փ
2C0.30Ground Floor350 × 3508–16Փ4–16Փ + 4–12Փ4–16Փ + 4–12Փ4–16Փ + 4–12Փ
First Floor350 × 3504–16Փ + 4–12Փ4–16Փ + 4–12Փ4–16Փ + 4–12Փ4–16Փ + 4–12Փ
Staircase Cover350 × 350 4–16Փ + 4–12Փ
3C0.35Ground Floor350 × 3504–20Փ + 4–16Փ4–16Փ + 4–12Փ4–16Փ + 4–12Փ4–20Փ + 4–16Փ
First Floor350 × 3508–16Փ4–16Փ + 4–12Փ4–16Փ + 4–12Փ8–16Փ
Staircase Cover350 × 350 4–16Փ + 4–12Փ
4C0.40Ground Floor350 × 3504–20Փ + 4–16Փ8–16Փ4–16Փ + 4–12Փ4–20Փ + 4–16Փ
First Floor350 × 3508–16Փ4–16Փ + 4–12Փ4–16Փ + 4–12Փ8–16Փ
Staircase Cover350 × 350 4–16Փ + 4–12Փ
5D0.35Ground Floor350 × 3508–16Փ4–16Փ + 4–12Փ4–16Փ + 4–12Փ8–16Փ
First Floor350 × 3504–16Փ + 4–12Փ4–16Փ + 4–12Փ4–16Փ + 4–12Փ4–16Փ + 4–12Փ
Staircase Cover350 × 350 4–16Փ + 4–12Փ
Table A2. Column reinforcement details for a three-storey building plus staircase cover (4-storey), there are 4 columns around the staircase of size 400 × 400, Փ denotes the diameter of reinforcement bars in mm.
SNSoil Type Seismic Zone Factor (g)Column Reinforcement Details for Three Storey Plus Staircase Cover (4-Storey)
StoreySize (mm)CornerFace InteriorStaircaseStirrups
1C0.25Ground Floor350 × 3504–20Փ + 4–16Փ8–16Փ4–16Փ + 4–12Փ4–20Փ + 4–16Փ8Փ@75/125 mm
First Floor350 × 3504–16Փ + 4–12Փ4–16Փ + 4–12Փ4–16Փ + 4–12Փ8–16Փ
Second Floor350 × 3504–16Փ + 4–12Փ4–16Փ + 4–12Փ4–16Փ + 4–12Փ4–16Փ + 4–12Փ
Staircase Cover350 × 350 4–16Փ + 4–12Փ
2C0.30Ground Floor350 × 3504–20Փ + 4–16Փ4–20Փ + 4–16Փ8–16Փ8-20Փ
First Floor350 × 3508–16Փ8–16Փ4–16Փ + 4–12Փ4–20Փ + 4–16Փ
Second Floor350 × 3504–16Փ + 4–12Փ4–16Փ + 4–12Փ4–16Փ + 4–12Փ8–16Փ
Staircase Cover350 × 350 4–16Փ + 4–12Փ
3C0.35Ground Floor350 × 350/400 × 4008-20Փ4–20Փ + 4–16Փ4–20Փ + 4–16Փ4–20Փ + 8–16Փ
First Floor350 × 350/400 × 4004–20Փ + 4–16Փ8–16Փ8–16Փ12-16Փ
Second Floor350 × 350/400 × 4008–16Փ4–16Փ + 4–12Փ4–16Փ + 4–12Փ8–16Փ + 4–12Փ
Staircase Cover350 × 350/400 × 400 4–16Փ + 8-12Փ
4C0.40Ground Floor350 × 350/400 × 4008-20Փ4–20Փ + 4–16Փ4–20Փ + 4–16Փ4–20Փ + 8–16Փ
First Floor350 × 350/400 × 4004–20Փ + 4–16Փ4–20Փ + 4–16Փ4–20Փ + 4–16Փ12-16Փ
Second Floor350 × 350/400 × 4008–16Փ8–16Փ8–16Փ8–16Փ + 4–12Փ
Staircase Cover350 × 350/400 × 400 4–16Փ + 8-12Փ
5D0.35Ground Floor350 × 3508-20Փ4–20Փ + 4–16Փ4–20Փ + 4–16Փ8-20Փ
First Floor350 × 3504–20Փ + 4–16Փ8–16Փ8–16Փ4–20Փ + 4–16Փ
Second Floor350 × 3508–16Փ4–16Փ + 4–12Փ4–16Փ + 4–12Փ8–16Փ
Staircase Cover350 × 350 4–16Փ + 4–12Փ
Table A3. Beam reinforcement details for two-storey buildings plus staircase cover (3-storey), Փ denotes the diameter of reinforcement bars in mm.
SNSoil Type Seismic Zone Factor (g)Beam Reinforcement Details for Two Storey Plus Staircase Cover (3-Storey)Stirrups
StoreyBeam Type (B1-Span up to 3 m and B2-Span 3 to 4.5 m)Beam Size (mm)FaceRebar Combination at Left End/Right EndRebar Combination at Middqle
Through Bar (TH)Extra Bar (EX)Through Bar (TH)
1C0.25First FloorB1 & B2250 × 355Top & Bottom3–12Փ 3–12Փ8Փ(Fe500) − (3Legged) @ 100 mm/150 mm c/c
Second FloorB1 & B2250 × 355Top & Bottom3–12Փ 3–12Փ
Staircase CoverB1 & B2250 × 355Top & Bottom3–12Փ 3–12Փ
2C0.30First FloorB1 & B2250 × 355Top3–12Փ2–12Փ3–12Փ
Bottom3–12Փ 3–12Փ
Second FloorB1 & B2250 × 355Top & Bottom3–12Փ 3–12Փ
Staircase CoverB1 & B2250 × 355Top & Bottom3–12Փ 3–12Փ
3C & D0.35First FloorB1 & B2250 × 355Top 3–12Փ2–12Փ3–12Փ
Bottom3–12Փ 3–12Փ
Second FloorB1 & B2250 × 355Top & Bottom3–12Փ 3–12Փ
Staircase CoverB1 & B2250 × 355Top & Bottom3–12Փ 3–12Փ
4C0.40First FloorB1 250 × 355Top & Bottom3–12Փ2–12Փ3–12Փ
B2250 × 355Top3–12Փ2–12Փ3–12Փ
Bottom3–12Փ 3–12Փ
Second FloorB1 & B2250 × 355Top & Bottom3–12Փ 3–12Փ
Staircase CoverB1 & B2250 × 355Top & Bottom3–12Փ 3–12Փ
Table A4. Beam reinforcement details for three-storey buildings plus staircase cover (4-storey), Փ denotes the diameter of reinforcement bars in mm.
SNSoil Type Seismic Zone Factor (g)Beam Reinforcement Details for Three Storey Plus Staircase Cover (4-Storey)Stirrups
StoreyBeam Type (B1-Span up to 3 m and B2-Span 3 to 4.5 m)Beam Size (mm)FaceRebar Combination at Left End/Right EndRebar Combination at Middle
Through Bar (TH)Extra Bar (EX)Through Bar (TH)
1C0.25FirstB1250 × 355Top & Bottom3–12Փ2–12Փ3–12Փ8Փ(Fe500)-(3Legged) @ 100mm/150mm c/c
B2250 × 355Top3–12Փ2–12Փ
Bottom3–12Փ 3–12Փ
SecondB1250 × 355Top3–12Փ2–12Փ3–12Փ
Bottom
B2250 × 355Top 3–12Փ2–12Փ
Bottom3–12Փ 3–12Փ
ThirdB1 & B2250 × 355Top & Bottom3–12Փ 3–12Փ
Staircase CoverB1 & B2250 × 355Top & Bottom3–12Փ 3–12Փ
2C0.30FirstB1250 × 380Top3–12Փ3–12Փ3–12Փ8Փ(Fe500)-(3Legged) @ 100mm/150mm c/c
Bottom3–12Փ2–12Փ
B2250 × 380Top3–12Փ2–12Փ
Bottom3–12Փ 3–12Փ
Second B1250x × 355Top & Bottom3–12Փ2–12Փ3–12Փ
B2250 × 355Top & Bottom3–12Փ2–12Փ
ThirdB1 & B2250 × 355Top3–12Փ 3–12Փ
Bottom3–12Փ 3–12Փ
Staircase CoverB1 & B2250 × 355Top & Bottom3–12Փ 3–12Փ
3C0.35First B1250 × 380Top3–12Փ3–12Փ3–12Փ8Փ(Fe500)-(3Legged) @ 100mm/150mm c/c
Bottom3–12Փ2–12Փ
B2250 × 380Top3–12Փ3–12Փ
Bottom3–12Փ 3–12Փ
Second B1250 × 355Top & Bottom3–12Փ2–12Փ3–12Փ
B2250 × 355Top3–12Փ2–12Փ
Bottom3–12Փ 3–12Փ
ThirdB1 & B2250 × 355Top & Bottom3–12Փ 3–12Փ
Staircase CoverB1 & B2250 × 355Top & Bottom3–12Փ 3–12Փ
4C0.40FirstB1300 × 380Top & Bottom4–12Փ4–12Փ3–12Փ8Փ(Fe500)-(4Legged) @ 100mm/150mm c/c
B2300 × 380Top4–12Փ4–12Փ
Bottom4–12Փ2–12Փ3–12Փ
Second FloorB1250 × 355Top3–12Փ3–12Փ3–12Փ8Փ(Fe500)-(3Legged) @ 100mm/150mm c/c
Bottom3–12Փ2–12Փ
B2250 × 355Top3–12Փ3–12Փ
Bottom3–12Փ 3–12Փ
ThirdB1250 × 355Top3–12Փ2–12Փ3–12Փ
Bottom3–12Փ
B1 Top3–12Փ2–12Փ
Bottom3–12Փ 3–12Փ
Staircase CoverB1 & B2250 × 355Top & Bottom3–12Փ 3–12Փ
5D0.35FirstB1250 × 380Top3–12Փ3–12Փ3–12Փ8Փ(Fe500)-(3Legged) @ 100mm/150mm c/c
Bottom3–12Փ2–12Փ
B2250 × 380Top3–12Փ2–12Փ
Bottom3–12Փ 3–12Փ
SecondB1250 × 355Top & Bottom3–12Փ2–12Փ3–12Փ
B2250 × 355Top3–12Փ2–12Փ
Bottom3–12Փ 3–12Փ
ThirdB1 & B2250 × 355Top & Bottom3–12Փ 3–12Փ
Staircase CoverB1 & B2250 × 355Top & Bottom3–12Փ 3–12Փ

References

  1. Government of Nepal National Reconstruction Authority (NRA). Repair and Retrofitting for RCC Structures; NRA: Kathmandu, Nepal, 2017. [Google Scholar]
  2. National Society for Earthquake Technology–Nepal (NSET). Seismic Vulnerability Evaluation Guideline for Private and Public Buildings; NSET: Kathmandu, Nepal, 2009. [Google Scholar]
  3. Government of Nepal. Nepal First Nationally Determined Contribution (NDC); Government of Nepal: Kathmandu, Nepal, 2020; Available online: https://unfccc.int/sites/default/files/NDC/2022-06/Nepal%20First%20NDC.pdf (accessed on 24 January 2020).
  4. Rastogi, B. Nepal earthquake of 2015. Curr. Sci. 2015, 109, 1–3. [Google Scholar]
  5. Khatakho, R.; Gautam, D.; Chaulagain, H. Multi-hazard risk assessment of Kathmandu Valley, Nepal. Sustainability 2021, 13, 5369. [Google Scholar] [CrossRef]
  6. Chaulagain, H.; Gautam, D.; Rodrigues, H. Revisiting major historical earthquakes in Nepal: Overview of 1833, 1934, 1980, 1988, 2011, and 2015 seismic events. In Earthquakes and Their Impact on Society; Elsevier: Amsterdam, The Netherlands, 2018; pp. 171–200. [Google Scholar]
  7. Department of Urban Development and Building Construction (DUDBC). Nepal National Building Code: NBC 105, Seismic Design of Buildings in Nepal; DUDBC: Kathmandu, Nepal, 1994. [Google Scholar]
  8. Department of Urban Development and Building Construction (DUDBC). Nepal National Building Code: NBC 105, Seismic Design of Buildings in Nepal; DUDBC: Kathmandu, Nepal, 2020; Available online: http://dudbc.gov.np (accessed on 24 December 2020).
  9. Sapkota, A.; Sapkota, B.; Poudel, J.; Giri, S. Comparative study on the seismic performance of a typical low-rise building in Nepal using different seismic codes. Asian J. Civ. Eng. 2024, 25, 4373–4394. [Google Scholar] [CrossRef]
  10. Pradhan, S.; Li, Y.; Sanada, Y. Seismic performance evaluation and risk assessment of typical reinforced concrete frame buildings with masonry infill and conventional vertical extension in Nepal. Bull. Earthq. Eng. 2022, 20, 821–846. [Google Scholar] [CrossRef]
  11. Nepal Development Research Institute (NDRI). Situation Report: Jajarkot Earthquake 22-2023-11; NDRI: Kathmandu, Nepal, 2023; Available online: https://www.ndri.org.np/index.php/post/jajarkot-earthquake-situation-report (accessed on 15 June 2025).
  12. Department of Urban Development and Building Construction (DUDBC). Nepal National Building Code: NBC 205, Ready-to-Use Detailing Guideline for Low-Rise Reinforced Concrete Buildings without Masonry Infill; DUDBC: Kathmandu, Nepal, 2024. [Google Scholar]
  13. Mucedero, G.; Perrone, D.; Monteiro, R. Nonlinear static characterisation of masonry-infilled RC building portfolios accounting for variability of infill properties. Bull. Earthq. Eng. 2021, 19, 2597–2641. [Google Scholar] [CrossRef]
  14. Mucedero, G.; Perrone, D.; Monteiro, R. Seismic risk assessment of masonry-infilled RC building portfolios: Impact of variability in the infill properties. Bull. Earthq. Eng. 2023, 21, 957–995. [Google Scholar] [CrossRef]
  15. Chaulagain, H.; Rodrigues, H.; Jara, J.; Spacone, E.; Varum, H. Seismic response of current RC buildings in Nepal: A comparative analysis of different design/construction practices. Eng. Struct. 2013, 49, 284–294. [Google Scholar] [CrossRef]
  16. Bhusal, B.; Pradhananga, A.; Paudel, S.; Najam, F.A. Evaluating and strengthening low-rise reinforced concrete buildings constructed in Nepal. Structures 2024, 63, 106388. [Google Scholar] [CrossRef]
  17. Poudel, S.; Sapkota, A.; Sapkota, B.; Giri, S. Seismic Performance Evaluation of an Existing Reinforced Concrete Moment Frame Building with Retrofitted Columns: A Case Study. In Proceedings of the 3rd International Conference on Earthquake Engineering and Post Disaster Reconstruction Planning, Bhaktapur, Nepal, 17–19 October 2023. Available online: https://www.researchgate.net/publication/375059681_Seismic_Performance_Evaluation_of_an_Existing_Reinforced_Concrete_Moment_Frame_Building_with_Retrofitted_Columns_A_Case_Study (accessed on 26 June 2025).
  18. Khatiwada, P.; Hu, Y.; Lam, N.; Menegon, S.J. Nonlinear dynamic analyses utilising macro-models of reinforced concrete building structures and site-specific accelerograms. CivilEng 2023, 4, 881–900. [Google Scholar] [CrossRef]
  19. Khatiwada, P. Estimation of Earthquake-Induced Damage in Reinforced Concrete Buildings at the Urban Scale: A Joint Disciplinary Approach. Ph.D. Thesis, The University of Melbourne, Melbourne, Australia, 2025. [Google Scholar]
  20. Poudel, S. Performance evaluation and retrofit of existing masonry structures. In Proceedings of the IFEME 2019; Atlantis Press: Paris, France, 2023. [Google Scholar] [CrossRef]
  21. Bento, R.; Falcao, S.; Rodrigues, F. Nonlinear static procedures in performance-based seismic design. In Proceedings of the 13th World Conference on Earthquake Engineering, Vancouver, BC, Canada, 1–6 August 2004. [Google Scholar]
  22. Applied Technology Council (ATC). ATC-40: Seismic Evaluation and Retrofit of Concrete Buildings; ATC: Redwood City, CA, USA, 1996. [Google Scholar]
  23. Federal Emergency Management Agency. NEHRP Guidelines for the Seismic Rehabilitation of Buildings, FEMA 273; Federal Emergency Management Agency: Washington, DC, USA, 1997. [Google Scholar]
  24. Bhalkikar, A.; Ramancharla, P.K. Quantification of damage using hinge pattern in RC moment resisting frame buildings. In Proceedings of the 17th Symposium on Earthquake Engineering (SEE-17), IIT Roorkee, Roorkee, India, 20–22 December 2020. [Google Scholar]
  25. CSI. ETABS: Integrated Building Design Software, version 20; Computers and Structures, Inc.: Berkeley, CA, USA, 2023. [Google Scholar]
  26. The Building Act, 2055. 1998, Volume 18, pp. 1–12. Available online: https://www.iibh.org/kijun/pdf/Nepal_01_Building_Act_1998.pdf (accessed on 9 July 2025).
  27. American Society of Civil Engineers (ASCE). Seismic Evaluation and Retrofit of Existing Buildings; ASCE: Reston, VA, USA, 2017. [Google Scholar]
  28. Paulay, T.; Priestley, M.N. Seismic Design of Reinforced Concrete and Masonry Buildings; Wiley: New York, NY, USA, 1992. [Google Scholar]
  29. Mander, J.B.; Priestley, M.J.N.; Park, R. Theoretical stress–strain model for confined concrete. J. Struct. Eng. 1988, 114, 1804–1826. [Google Scholar] [CrossRef]
  30. Menegotto, M.; Pinto, P.E. Method of analysis for cyclically loaded RC plane frames including changes in geometry and non-elastic behaviour of elements under combined normal force and bending. In Proceedings of the IABSE Symposium on Resistance and Ultimate Deformability of Structures Acted on by Well-Defined Repeated Loads; IABSE: Zurich, Switzerland, 1973; pp. 15–22. [Google Scholar]
  31. Poudel, J.; Najam, F.A.; Anwar, N. Hysteretic energy evaluation of typical low-rise reinforced concrete frame buildings in Nepal. J. Build. Pathol. Rehabil. 2025, 10, 669. [Google Scholar] [CrossRef]
  32. Poudel, J. Quantitative Assessment of Dissipated Energy from the Structural Components for Mid-Rise Building Under Several Ground Motions. Master’s Thesis, Asian Institute of Technology, Pathum Thani, Thailand, 2021. [Google Scholar] [CrossRef]
  33. Powell, G.H. Nonlinear Analysis and Performance Assessment for 3D Structures. Comput. Struct. 2006, 84, 36–52. [Google Scholar]
  34. Aschheim, M. Seismic Design Based on the Yield Displacement. Earthq. Spectra 2002, 18, 581–600. [Google Scholar] [CrossRef]
  35. Applied Technology Council (ATC). FEMA 440: Improvement of Nonlinear Static Seismic Analysis Procedures; ATC: Washington, DC, USA, 2005. [Google Scholar]
  36. Comartin, C.D.; Niewiarowski, R.W.; Freeman, S.A.; Turner, F.M. Seismic evaluation and retrofit of concrete buildings: A practical overview of the ATC-40 document. Earthq. Spectra 2000, 16, 241–261. [Google Scholar] [CrossRef]
  37. Chopra, A.K. Dynamics of Structures: Theory and Applications to Earthquake Engineering; Prentice Hall: Upper Saddle River, NJ, USA, 2012. [Google Scholar]
  38. American Society of Civil Engineers (ASCE). Prestandard and Commentary for the Seismic Rehabilitation of Buildings, FEMA 356; Federal Emergency Management Agency: Washington, DC, USA, 2000. [Google Scholar]
Figure 1. History of seismic design codes of Nepal.
Civileng 06 00050 g001
Figure 2. Studied buildings (a) symbolic representation, (b,c) typical plans, (d) elevation, (e) three-dimensional view for two-storey plus staircase cover (3-storey), and (f) three-dimensional view for three-storey plus staircase cover (4-storey).
Civileng 06 00050 g002
Figure 3. Hinges definition (a) moment rotation hinge assigned to the beam (b) fiber hinges assigned to the column.
Civileng 06 00050 g003
Figure 4. Stress-strain curves for materials (a) unconfined concrete, (b) confined concrete, and (c) Reinforcement bar.
Civileng 06 00050 g004
Figure 5. Force-displacement curve for plastic hinge.
Civileng 06 00050 g005
Figure 6. Procedure for nonlinear pushover analysis to find the performance point for the buildings.
Civileng 06 00050 g006
Figure 7. Response Spectra for Design Basis Earthquake (DBE) outlined in NBC 105:2020.
Civileng 06 00050 g007
Figure 8. Pushover plots for (a) 3-storey x-direction, (b) 3-storey y-direction.
Civileng 06 00050 g008
Figure 9. Pushover plots for (a) 4-storey x-direction, (b) 4-storey y-direction.
Civileng 06 00050 g009
Figure 10. Base Shear for linear and nonlinear static analysis (a) 3-storey (b) 4-storey.
Civileng 06 00050 g010
Figure 11. Storey drift in three storey buildings for DBE level earthquake for linear and nonlinear static analysis.
Civileng 06 00050 g011
Figure 12. Storey drift in four-storey buildings for DBE level earthquake for linear and nonlinear static analysis.
Civileng 06 00050 g012
Figure 13. Hinge patterns of 3 and 4 storey building for seismic demand 0.25 g, 0.30 g, 0.35 g, and 0.40 g for Soil C.
Civileng 06 00050 g013
Figure 14. Hinge patterns of a 3 and 4 storey building for seismic demand 0.35 g for Soil D.
Civileng 06 00050 g014
Table 1. Geometric parameters incorporated for the selection of buildings as per NBC 205:2024 [12].
Symbol Description
A3 × B
a × b13.50 m2
a, b4.5 m
a, b2.1 m
A or B6 bays
A or B2 bays
H12 m or 3 stories (whichever is less)
h4=2.4 m (h1 ≤ h2 ≤ h3)
Table 2. Modeling approach for structural members.
MembersModeling Approach
BeamConcentrated plastic hinge modeling at both ends (Moment-Rotation)
ColumnFiber section modeling with finite hinge length
SlabThin shell elastic element
FoundationFixed support
Beam Column JointsRigid
Table 3. Performance Point and Hinge Status for DBE level earthquake in x-direction.
Soil TypeBuildingSeismic Demand (PGA)Performance Point (x-Direction)A-IOIO-LSLS-CP>CPTotal
Base Shear (kN)Roof Disp. (m)No%No%No%No%
C2 story plus staircase Cover0.25 g675.9690.021132100000000132
C0.30 g882.3400.034132100000000132
C0.35 g1094.8300.04013098220000132
C0.40 g1273.1690.05513098220000132
D0.35 g876.2300.030132100000000132
 
C3 story plus staircase Cover0.25 g1158.5600.058190100000000190
C0.30 g1435.4900.078190100000000190
C0.35 g1714.4230.09018899210000190
C0.40 g1821.3050.08918899210000190
D0.35 g1479.9800.08518899210000190
Table 4. Performance Point and Hinge Status for DBE level earthquake in y-direction.
Soil TypeBuildingSeismic Demand (PGA)Performance Point (y-Direction)A-IOIO-LSLS-CP>CPTotal
Base Shear (kN)Roof Disp. (m)No%No%No%No%
C2 story plus staircase Cover0.25 g711.5230.016132100000000132
C0.30 g824.6520.023132100000000132
C0.35 g1087.9270.03413098220000132
C0.40 g1181.0090.03713098220000132
D0.35 g767.3600.019132100000000132
 
C3 story plus staircase Cover0.25 g1137.4520.044190100000000190
C0.30 g1372.6100.051190100000000190
C0.35 g1626.8700.05818899210000190
C0.40 g1809.9640.06218999110000190
D0.35 g1509.0840.07018899210000190
Disclaimer/Publisher’s Note: The statements, opinions and data contained in all publications are solely those of the individual author(s) and contributor(s) and not of MDPI and/or the editor(s). MDPI and/or the editor(s) disclaim responsibility for any injury to people or property resulting from any ideas, methods, instructions or products referred to in the content.