Article

Experimental Study of the Effectiveness of Strengthening Reinforced Concrete Slabs with Thermally Prestressed Reinforcement

Chair of Concrete Structures, Ruhr University Bochum, 44801 Bochum, Germany
*
Author to whom correspondence should be addressed.
CivilEng 2025, 6(3), 49; https://doi.org/10.3390/civileng6030049
Submission received: 23 July 2025 / Revised: 29 August 2025 / Accepted: 9 September 2025 / Published: 13 September 2025

Abstract

Conventional strengthening measures for existing structures are usually not effective for the self-weight, which accounts for around 70% of the total load in reinforced concrete structures. Therefore, their effect on the overall load-bearing capacity is low. A self-weight-effective alternative for flexural strengthening is the thermal prestressing of additional reinforcement installed on the structure. In this method, reinforcing bars are slotted into the tensile zone, embedded in filler material, and tempered from the outside. They are thermally stretched, and once cooling starts, the bond with the hardened filler prevents re-deformation. The induced prestressing force counteracts dead loads and relieves the tensile zone, making the additional bars effective for the self-weight. In this paper, the effectiveness of the strengthening method is experimentally investigated in the serviceability and the ultimate limit states. Experiments involve strengthening a reinforced concrete beam under load by a thermally prestressed additional bar. Moreover, two reference tests are made to evaluate the method. An unstrengthened beam characterizes the lower capacity limit. Another beam with the same reinforcement amount as the strengthened one, but completely installed at casting, serves as the upper benchmark. All beams are loaded until bending failure. The strengthening method is assessed by means of the load-bearing behavior, deflection, crack development, and the strains in the initial as well as the added reinforcement. The results demonstrate the effectiveness of the strengthening method. The thermally prestressed bar achieves an effective pre-strain of approximately. 0.4‰ by heating at about 70 °C. The induced prestressing force and associated compression reduce tensile cracks by approx. 45% and increase stiffness. The strengthened beam reaches the maximum load of the upper benchmark, but with about 33% less deflection. The filler, which also expands thermally, generates an additional prestressing force that is effective up to about 20% of the load capacity. Beyond this, the filler begins to crack and its effect decreases, but the pre-strain in the reinforcing bar remains until maximum load.

1. Introduction

The strengthening of existing reinforced concrete structures is becoming increasingly important worldwide [1,2,3]. Durability issues, increasing service requirements, and normative adjustments often lead to deficits in the load-bearing capacity and serviceability of existing structures, thereby restricting their ongoing use [4,5,6]. Typical deficiencies are excessive deflections [7,8], which impair the use, or exceedance of permissible crack widths [9,10,11] and associated durability problems. Problems usually occur in service well below the maximum load-bearing capacity [12]. Compared to replacements, strengthening load-bearing structures aims to restore functionality while conserving resources, offering considerable ecological and economic advantages [13].
Conventional methods for strengthening the flexural load-bearing capacity [14,15,16,17], such as bonded steel or CFRP lamellae [18,19,20,21,22,23,24], which are externally applied to the tension zone, and slotted reinforcing bars [25,26], which are embedded in grooves cut into the existing concrete to enhance tensile resistance Another approach is the addition of concrete layers to increase the compression zone [27,28,29,30,31]. While these approaches increase the flexural capacity against external loads, they do not improve the structural response to the self-weight of the construction [32]. As this generally accounts for around 70% of the total load in reinforced concrete slabs [33], the effectiveness of these methods is limited. Existing cracks or deflections due to the self-weight are not mitigated by the measures. Neither before cracking nor below a certain curvature or deflection, the strains from dead load are transferred to the strengthening elements. This inevitably involves restrictions in terms of serviceability.
As a remedy, the thermal prestressing of subsequently added reinforcement is presented here [34]. The method combines the slotting of additional reinforcement with systematic temperature induction [35]. Figure 1 shows an illustrative application of the method on a concrete slab (a, b) with the tensile zone at the bottom (at the span of single- or multi-span beams) and on a balcony slab (c) with the tensile zone at the top (cantilever). The bars with the cross-sectional area A s , which are slotted into the tensile zone and embedded in filler material, are specifically tempered from the outside to thermally stretch them by ε s . The aim is to match the strain ε s 0 of the initial reinforcement with the cross-section area A s 0 , which results from the self-weight of the structure ( ε s = ε s 0 ). Once the heat supply is stopped and cooling starts, the bond with the filler material, which has hardened in the meantime, prevents the bars from re-deforming. This induces a prestressing force F P T , counteracting the stresses from self-weight, relieving the tensile zone, reducing deflection, and mitigating crack widths by applying pressure to the cross-section. Thus, the added reinforcement is completely effective on the self-weight. As long as it remains uncracked, the thermally expanded filler provides another benefit since it also provides some prestress after cooling and increases the method’s effectiveness, especially on the serviceability level. Moreover, the interaction between bar, filler material, and surrounding concrete through bond is decisive for ensuring the transfer of forces and the long-term effectiveness of the method, which has been investigated separately in [36].
For typical concrete slabs with self-weight percentages of approx. 70% of the characteristic total load, an average mechanical strain ε s 0 = 0.6‰ occurs in the initial reinforcement at the span when linearizing the parabolic moment curve from the self-weight. Assuming the coefficient of thermal expansion to be α T = 10 5 1/K (steel), the added bar must be heated by Δ T = 60 °C so that ε s = α T · Δ T     ε s 0 applies [34]. Assuming an initial temperature of 20 °C, the reinforcement in the slot must be heated to 80 °C. Clearly, the heat input must be limited to the slot. Heating the entire cross-section reduces the effectiveness, since without any temperature difference between the initial and added reinforcements, the prestressing effect is lost.
The effect of thermal prestressing can generally be determined as a function of the induced temperature difference using a calculation model according to [34], both with and without considering the effect of the filler material in tension.
While prestressing is a well-established concept, its application in strengthening existing structures is technically complex and rarely feasible. To address this, the present study develops thermal prestressing of subsequently added reinforcement as an alternative variant that enables a simplified and self-weight-effective use of the prestressing principle. The effectiveness of the method is experimentally investigated in the serviceability (SLS) and ultimate limit states (ULS) by strengthening a reinforced concrete beam under load with a thermally prestressed additional bar. Moreover, two reference tests are made to evaluate the method. An unstrengthened beam ( A s 0 ) characterizes the lower capacity limit. Another beam with the same reinforcement amount as the strengthened one, but installed already at casting ( A s 0 + A s ), serves as the upper benchmark. All three beams are subjected to displacement-controlled loading until bending failure. The strengthening method is assessed by means of the load-bearing behavior, deflection, crack development, and the strains in the initial as well as the added reinforcement. Chapter 2 introduces the test setup and execution. The test results are presented in Chapter 3. They are compared with the results obtained from numerical computation (Chapter 4) and with the reference beams (Chapter 5) and discussed in Chapter 6. The main conclusions of this article are summarized in Chapter 7.

2. Experimental Investigations

2.1. Key Performance Indicators and Experimental Campaign

The aim of the experimental campaign is to investigate the effectiveness of the described strengthening method for prestressing subsequently added reinforcement at serviceability and ultimate limit states. The key is the impact of thermal prestressing on the load-bearing capacity, the deformations, the crack widths, and the strains in initial and additional reinforcing bars. The campaign (Table 1) comprises two reference tests (beams no. 1 and 3) and a thermally prestressed member (no. 2). In the latter, a reinforced concrete beam is first built with two Ø16 reinforcing bars in the flexural tensile zone. Then a third bar Ø16 is installed into a slot and thermally prestressed. The two reference members initially contain two (lower reference, no. 1) or three bars (upper reference, no. 3) with otherwise identical boundary conditions. For visualization the results are color-coded (lines in Table 1): blue and green are assigned to the references, while red and black indicate the thermally strengthened member. The aim is to fully activate the added bar for the structural self-weight through tempering. Accordingly, the maximum deflection u m a x , maximum load-bearing capacity F m a x And crack development w of beam no. 3 are the key performance indicators of the thermally strengthened beam no. 2 (with u m a x (2) ≤ u m a x (3), F m a x (2) ≥ F m a x (3), w(2) ≤ w(3)) while a significant improvement compared to beam no. 1 is expected, which is characterized by u m a x (1) > u m a x (2), F m a x (1) < F m a x (2), w(1) > w(2).

2.2. Materials

All beams are made from normal-strength concrete (NSC) of class C30/37, which represents a typical concrete strength for existing structures and therefore ensures the practical relevance of the tests. The slot of the prestressed member is filled with a high-strength concrete (HPC) based on the binder Nanodur Compound 5941 right after the bar is installed. The HPC reaches a compressive strength > 100 MPa [37]. Ref. [36] shows that this HPC develops its strength without pre-storage time very quickly when subjected to rapid tempering and without any relevant damage effects due to secondary ettringite formation [38], which is particularly relevant for ensuring durability. The maximum bond strength of approx. 65% is reached after just 4 h [36]. Long-term deformations due to creep and shrinkage, which reduce the applied prestressing force with time, are low with this HPC and are further reduced by a heat treatment [36,39]. In the fresh state, the HPC has a thermal conductivity λ of approx. 4.5 W/(mK) [40], which is significantly higher than that of the surrounding normal concrete and therefore promotes efficient heat transfer to the embedded reinforcement. Table 2 shows the mix designs of both concretes.
In each beam, 2 or 3 reinforcing bars (B500A Ø16, Table 2) are installed in the tensile zone of the cross-section (Figure 2). No stirrups are provided, as shear failure has been excluded by calculation.

2.3. Test Setup and Execution

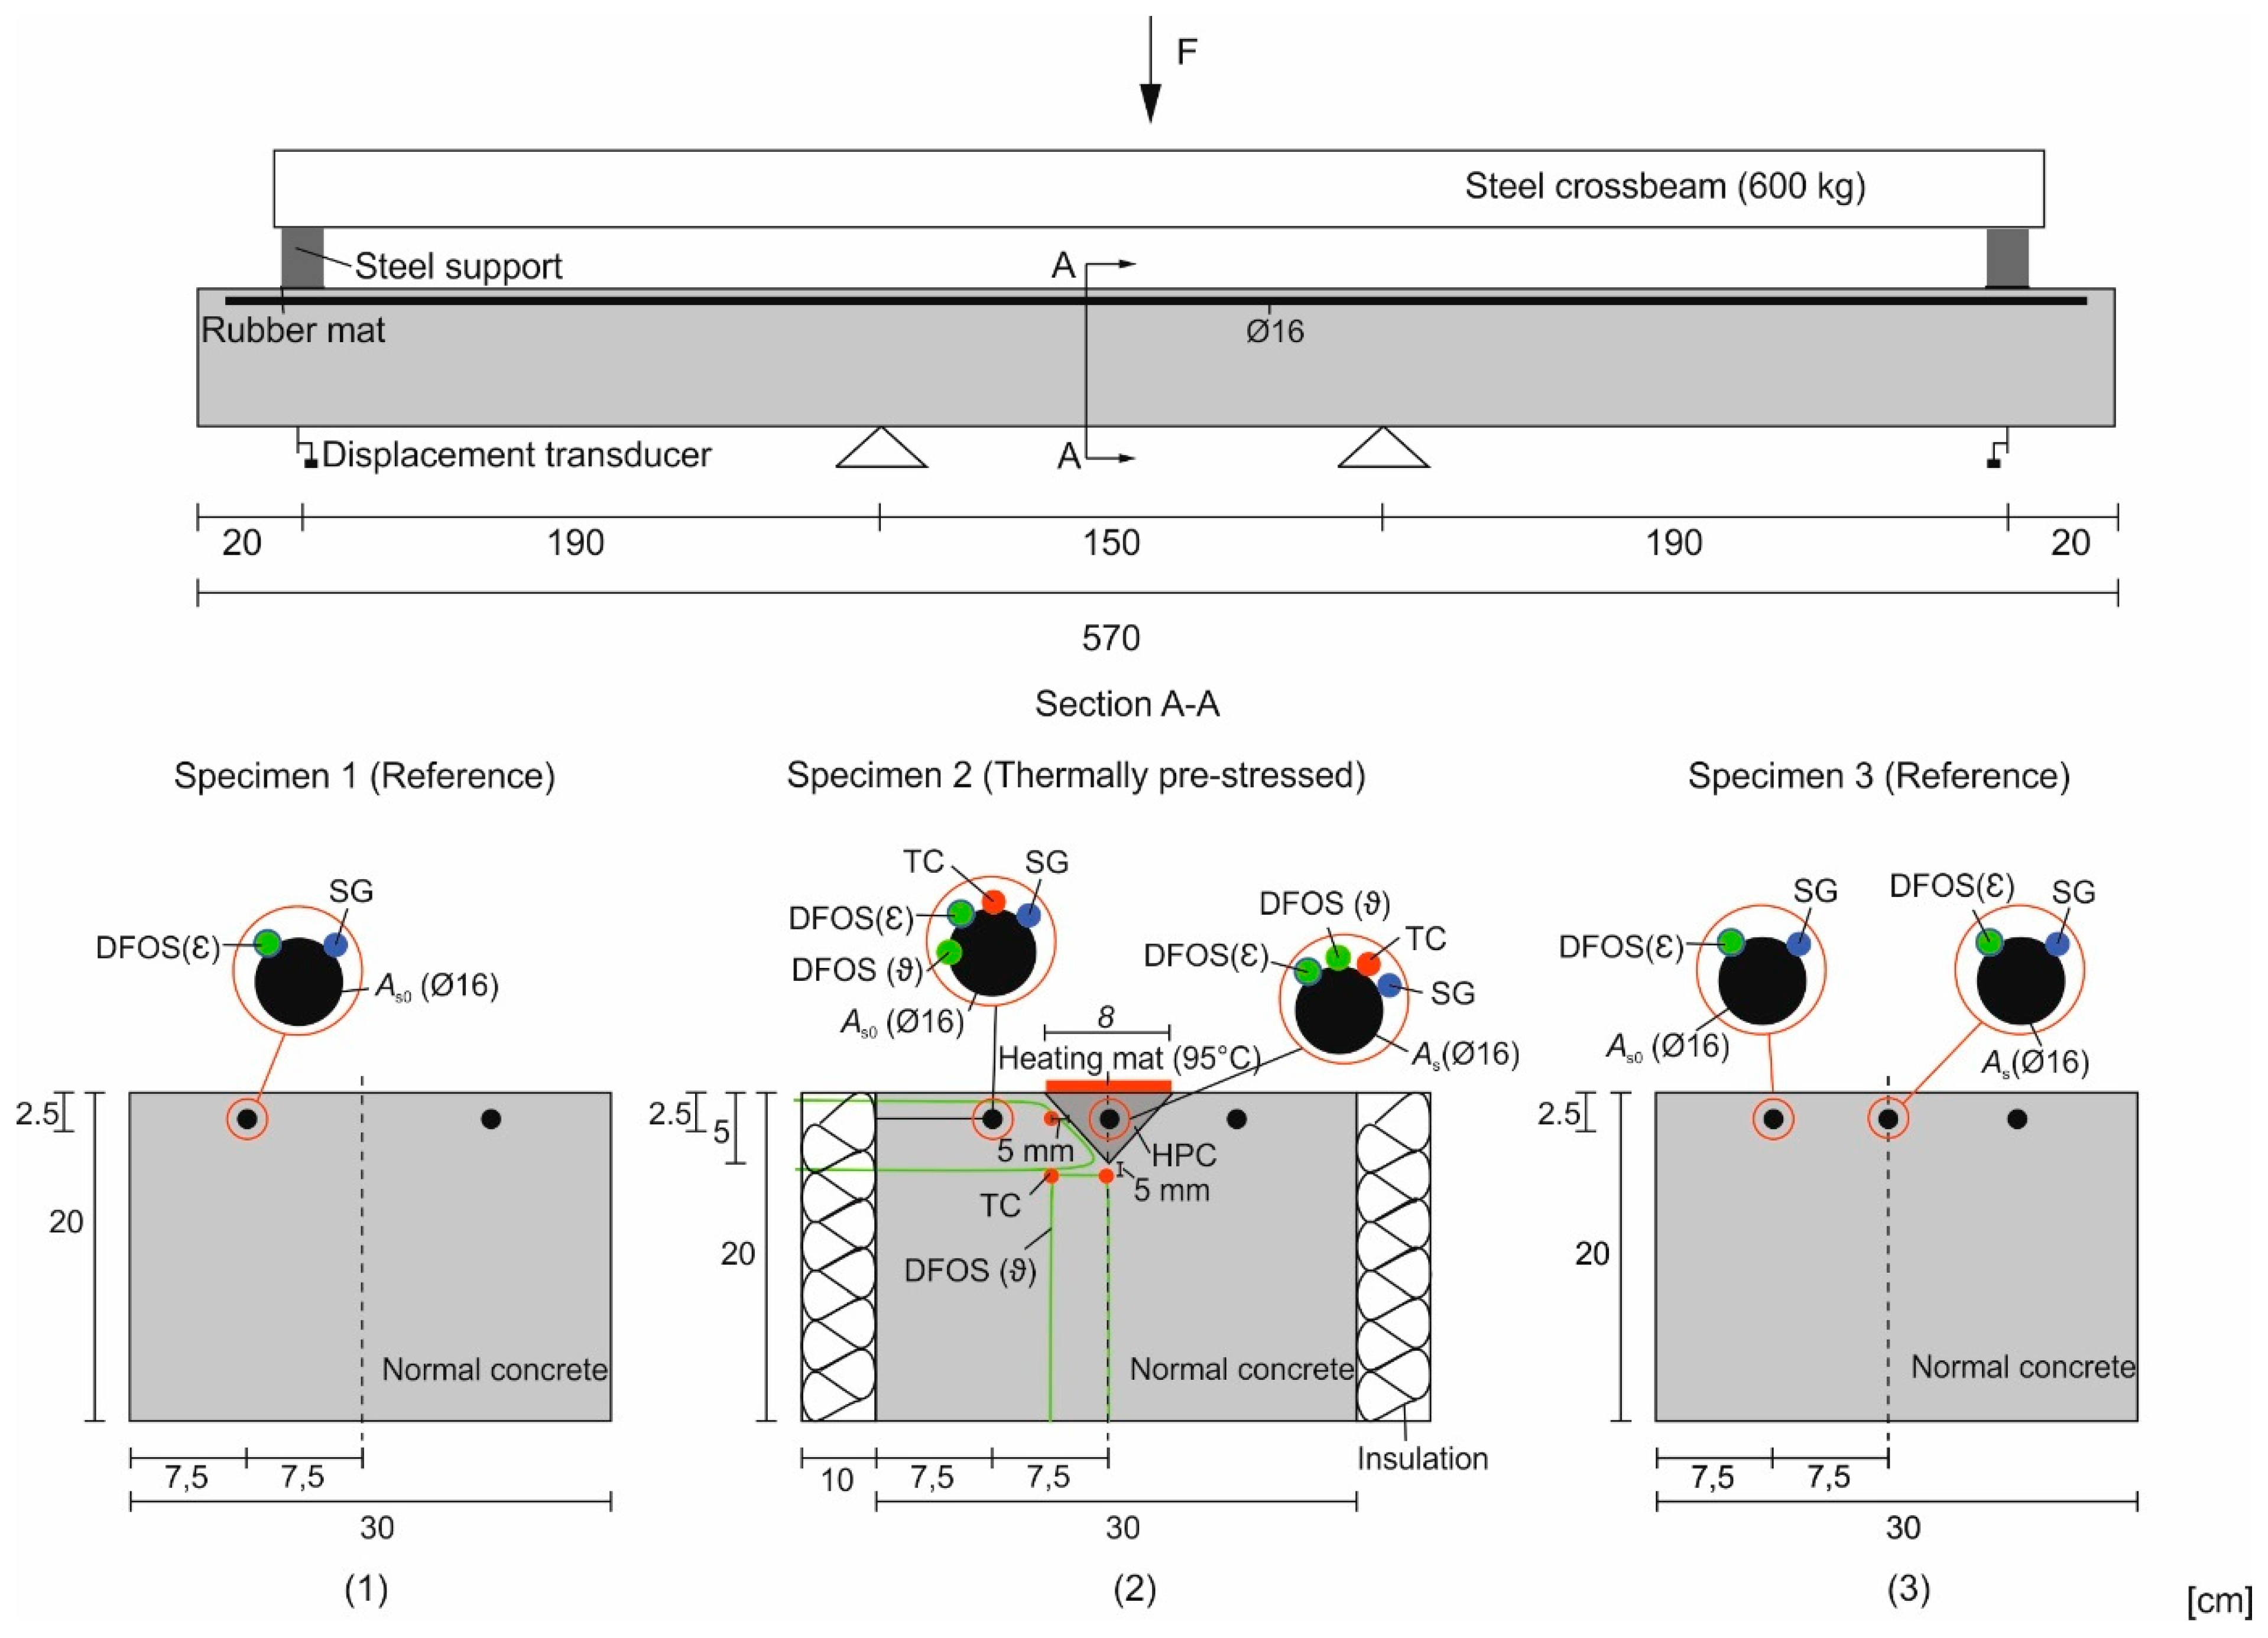
The test setup with the geometric dimensions and the measurement technology used on the three beams is shown in Figure 2. All beams have the same dimensions l/w/h = 570/30/20 cm. They are subjected to four-point bending, where the load is applied to the cantilevers at the sides. Support is provided by a floating and a fixed support, which are 1.5 m apart. This leaves 2.1 m long cantilevers on both sides. The load is transferred via a steel crossbeam, which rests at a 20 cm distance from the beam’s end. The self-weight and the additional load of the crossbeam induce an approximately constant negative bending moment between the supports, with the tensile zone at the top. The deflection during loading is recorded with displacement transducers at load application at the crossbeams.
As said, the reference beams no. 1 and no. 3 (Figure 2) are initially reinforced with 2 or 3 bars Ø16 at 15 or 7.5 cm from each other and 7.5 cm from the sideway edges. The distance of the bars (barycenter) from the upper edge is d 1 = 2.5 cm. For reasons of symmetry, the measuring equipment is only arranged on one lateral (no. 1) or one lateral and the central reinforcing bar (no. 3). At the middle of the beam (l/2) and at the two-thirds points (2/3∙l, l/3), the strain is measured with strain gauges (SG). Fiber optic sensors are attached along the bars for quasi-continuous strain measurement, DFOS( ε ) [41,42,43,44]. The glass fibers DFOS( ε ) are glued into a groove and bonded with the adhesive “Polytec PT AC2411”. Thus, they always experience the same strain as the bar [45]. In principle, the DFOS record thermal and mechanical strain changes in parallel. Due to the constant temperatures during the tests, only mechanical strain changes are recorded, and no temperature compensation must be used. The temperature development in the test specimen is also measured using glass fiber sensors DFOS( ϑ ), which are mechanically decoupled by being laid in a capillary.
In the thermally pre-stressed beam no. 2, the side faces are insulated with 10 cm thick polystyrene panels ( λ = 0.04 W/mK). This is to mimic the symmetric thermal boundary condition or the heat propagation in continuous slabs. Freely, heat can only be emitted down and upwards. Initially, beam no. 2 is reinforced as the lower reference no. 1. For strengthening, another bar Ø16 ( A s ) is put into a triangular slot at center with height h′ = 5 cm and width b′ = 8 cm. (Experimental and numerical) preliminary investigations on the influence of the slot shape, with the same temperature control, have shown that higher temperature differences between the bar in the slot and the concrete around are achieved with triangular than with rectangular or semi-circular shapes [46]. The slot is finally 530 cm long, thus shortened by 20 cm on both sides regarding the total beam length. The bar is 525 cm long and positioned in the middle of the slot with an edge distance which corresponds to the vertical position of the initial bars ( d 1 = 2.5 cm). For bonding, the slot is filled with the HPC according to Table 2 and then tempered.
A silicone heating mat with the same dimensions as the slit surface (8*530 cm) is used to temper the slit [47]. The heating mat is controlled to a target temperature of 95 °C. Due to heat dissipation from the slot into the surrounding concrete and the distance between the heating mat and the added bar, a temperature of the heating mat itself of >80 °C is required to reach the target temperature of the bar of 80 °C [40]. The mat is operated by a two-point control system, which switches between on and off once the target temperature is reached, thereby keeping the temperature constant during the heating process. A heat-resistant Hostaphan foil (PET-based, t = 0.05 mm) is placed between the mat and the liquid concrete to protect the mat.
The measuring devices and their position on the bars correspond to the reference tests. On top, thermocouples (TC) and fiber optic sensors for temperature measurement (DFOS(ϑ)) are placed near the strain sensors (SG and DFOS(ε)). The DFOS(ϑ) are decoupled from the mechanical strain, guiding it in capillaries. This yields purely thermal strain changes, from which the temperature change can be derived. Measuring temperature and strain at the same location enables us to separate mechanical and thermal strain components [48]. In section A-A at midspan (Figure 2), the temperature distribution is also recorded with three TCs near the slot and two DFOS(ϑ) distributed over the cross-section (Figure 2, no. 1). Two TCs run 4 cm horizontally offset from the center of the cross-section at the level of the added bar, or 5 mm below the slot. The third TC is centered 5 mm below the slot. In the same section, a first DFOS(ϑ) always runs at about 5 mm, first parallel to the top surface, then parallel to the slot face, and finally horizontally back to the edge of the beam at the vertical level of the slot’s tip. At the transitions, the fiber is bent with a radius r = 1 or 2 cm. A second DFOS(ϑ) runs vertically along the cross-section axis and is returned at 4 cm from it. In between the fiber runs horizontally, 5 mm below the slot. At transitions, it is bent with r = 1 cm. All measuring devices record data with a frequency of f = 1/10 Hz.
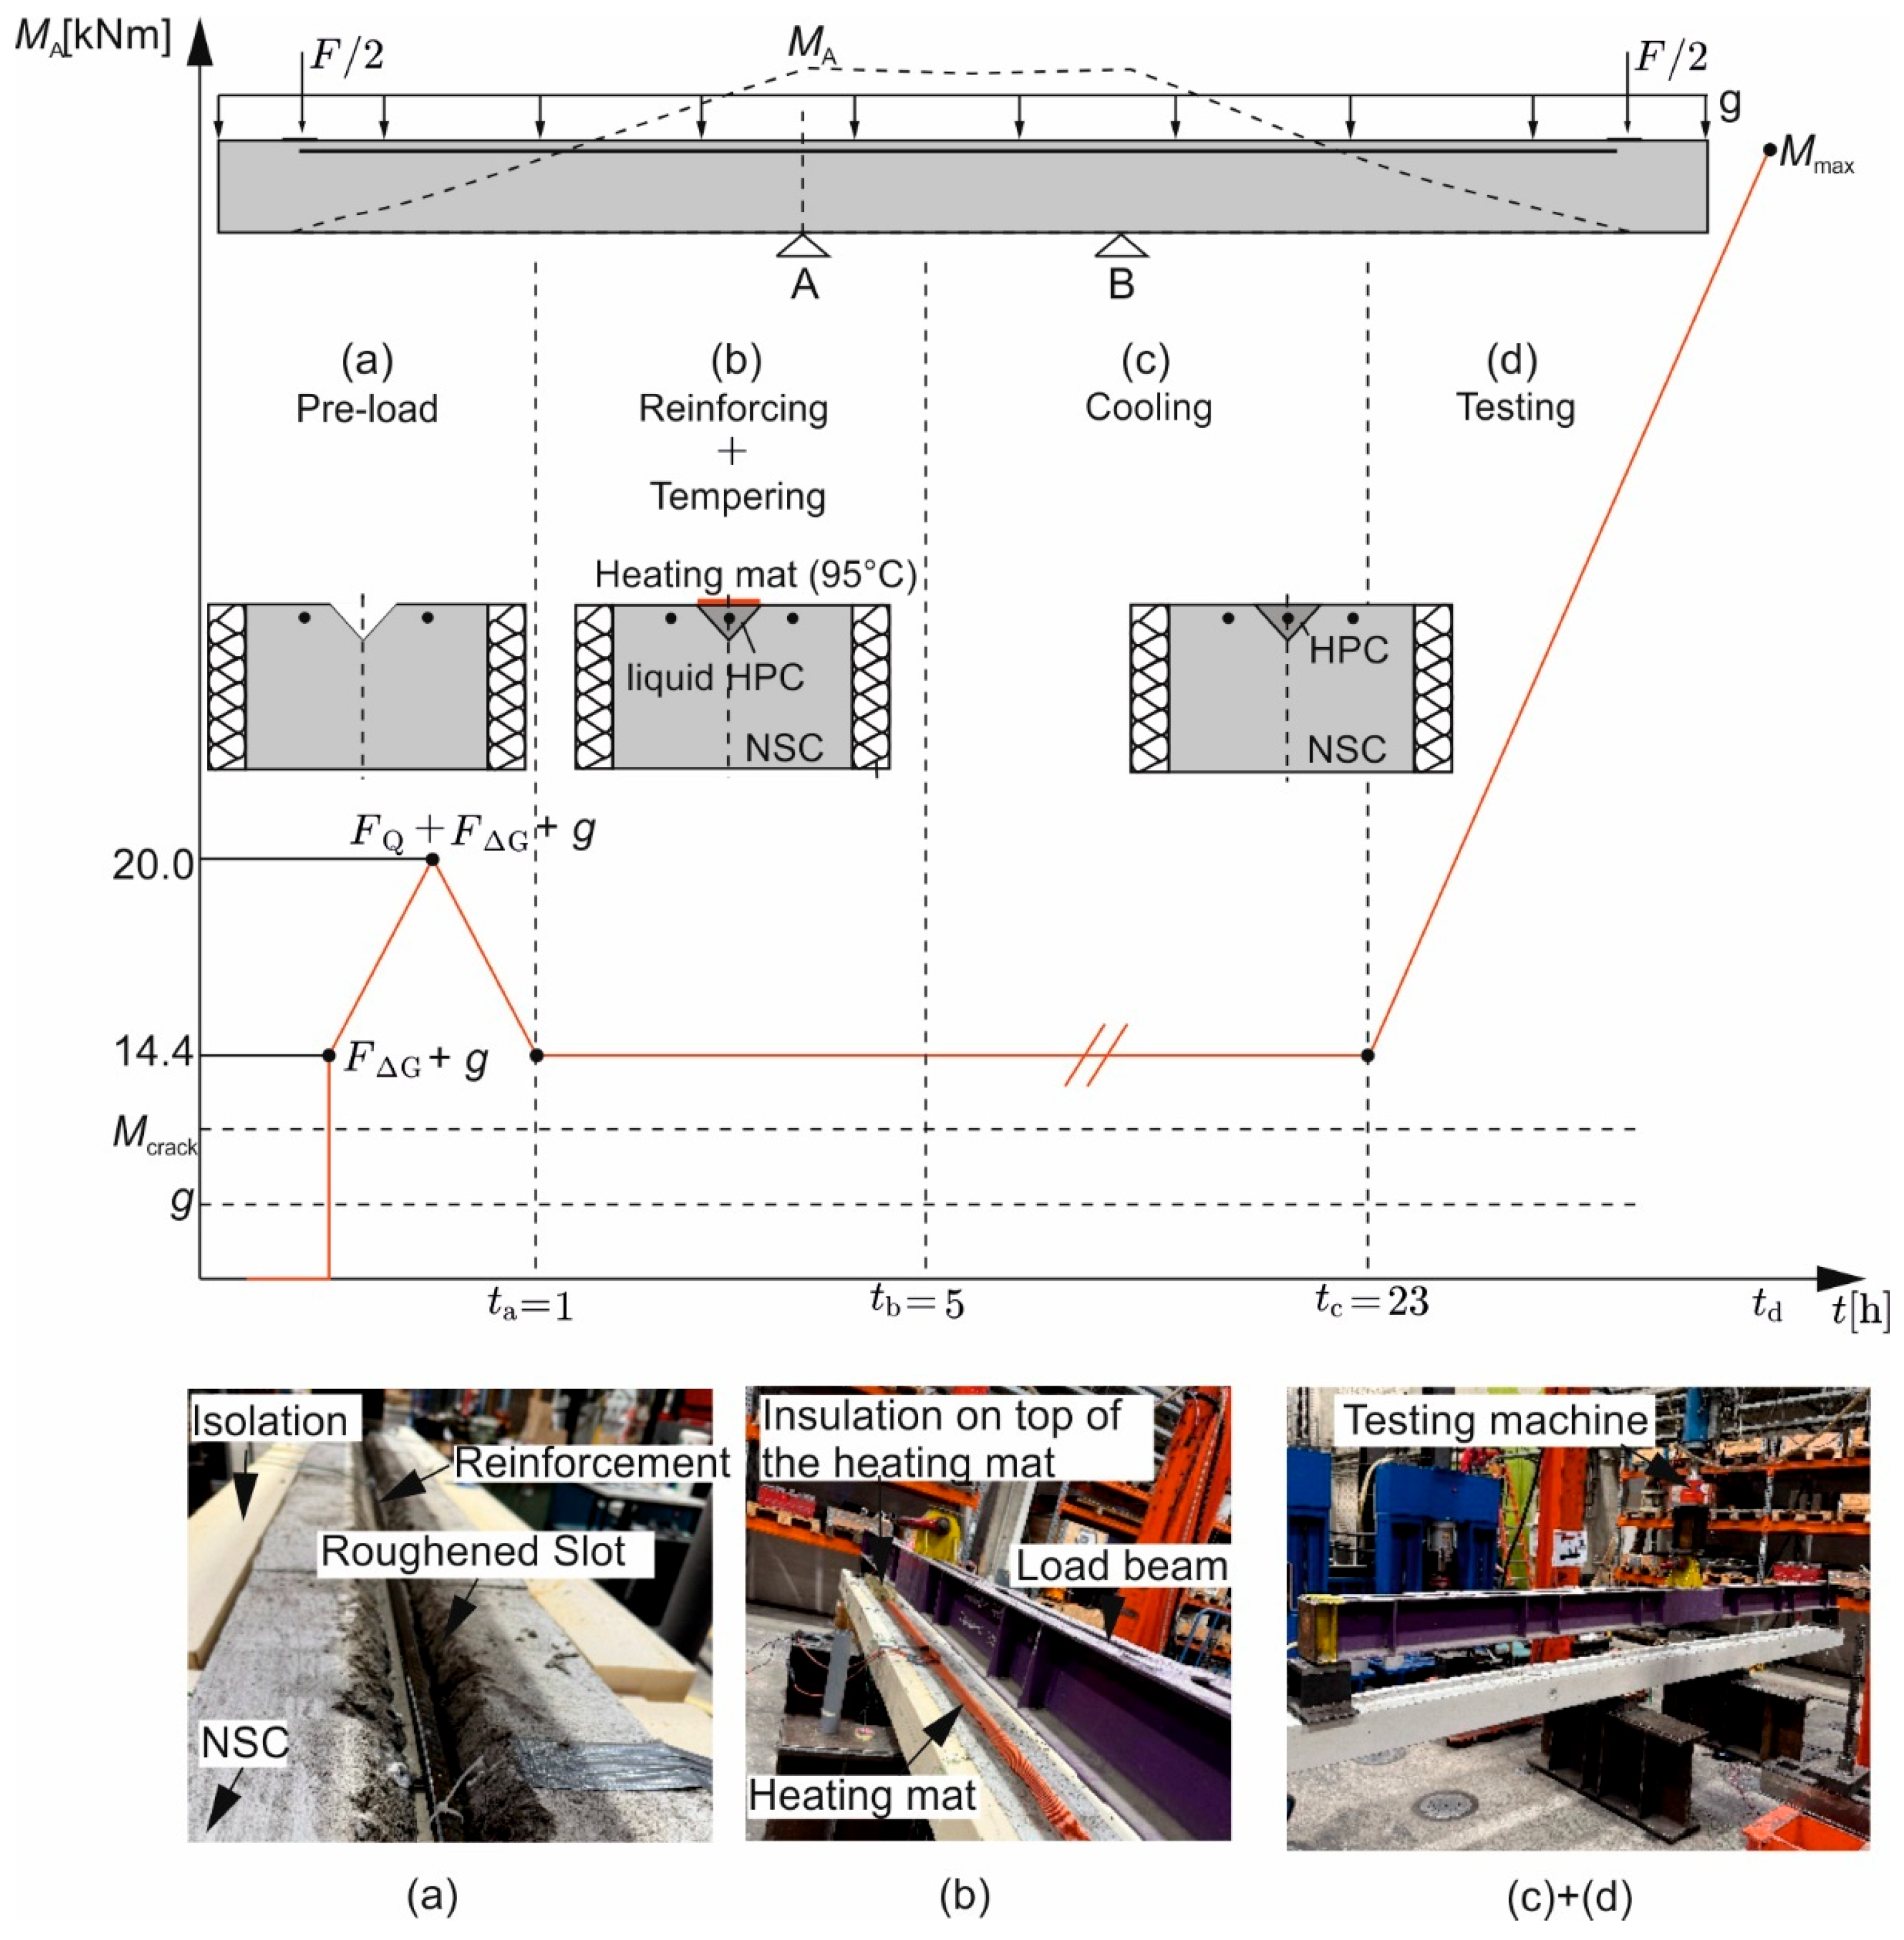
Figure 3 shows the main steps of testing the thermally prestressed beam, comprising heating and strengthening as well as the associated loads. The latter slot is spared with polystyrene during casting. A retarder is applied to its surfaces, which, after 24 h, are roughened to the grain size according to the requirements in [49].
In practice, it can be assumed that the cross-section is cracked with just the structure’s self-weight, without any live loads, acting at the time of strengthening. Recognizing this, ε s 0 = 0.6‰ is assumed for the impressed strain of the initial reinforcing steel. As outlined in Section 1, this corresponds to about the average mechanical strain due to characteristic self-weight (approx. 70% of the total load) of common single-span concrete slabs. On the chosen static system, the self-weight yields a constant maximum negative moment between the supports A and B ( M A ( g ) = M B ( g ) = 3.3   k N m ). This is increased by the self-weight of the crossbeams ( F Δ g = 6   k N ) applied through the cantilevers, which yields another constant contribution M A   ( g + F Δ g ) = 14.4   k N m > 1.3 · M c r a c k . Computing M c r a c k = 5.8   k N m , a completed crack pattern can be expected. At this load level, an initial strain of ε s 0 = 0.6‰ is induced and verified by measurements with SG and DFOS. In step (a), the beam is subjected to a pre-load induced by the test stand, FQ = 2.95 kN, which gives an associated bending moment M A   ( g + F Δ g + F Q ) = 20 kNm that equals about 3.4 · M R i s s . Before strengthening starts at t a = 1 h the pre-load is removed again. In step (b), the bar is placed in the roughened slot and then filled with the HPC. Finally, the slot is tempered for 4 h to tb = 5 h with the heating mat. The results in [36] show that the HPC is sufficiently hardened after 4 h to transfer the bond forces from thermal prestressing. Longer tempering times have no benefit with respect to hardening and a reduction in bond creep [36]. Full contact between the mat and the still liquid HPC raises the effectiveness of heating. The top face of the mat is insulated with rock wool pressed down by weights [40]. After hardening (tb = 5 h), the heat supply is stopped and the member cools down completely; meanwhile, the thermal prestress builds up. After another 18 h, at time t c = 23 h, the load is increased until failure ( F m a x ). It is increased displacement-controlled at a rate of 0.5 mm/min until M m a x is reached at t d .
The whole process is shortened for the reference beams no. 1 and 3. The preload in step (a), the strengthening in step (b), and the time component (step (c)) are completely omitted. After the initial loading from self-weight and crossbeams F g + Δ g is applied, the load is increased directly until failure.

3. Experimental Results

3.1. Strain in the Basic Reinforcement Due to Self-Weight at the Time of Strengthening

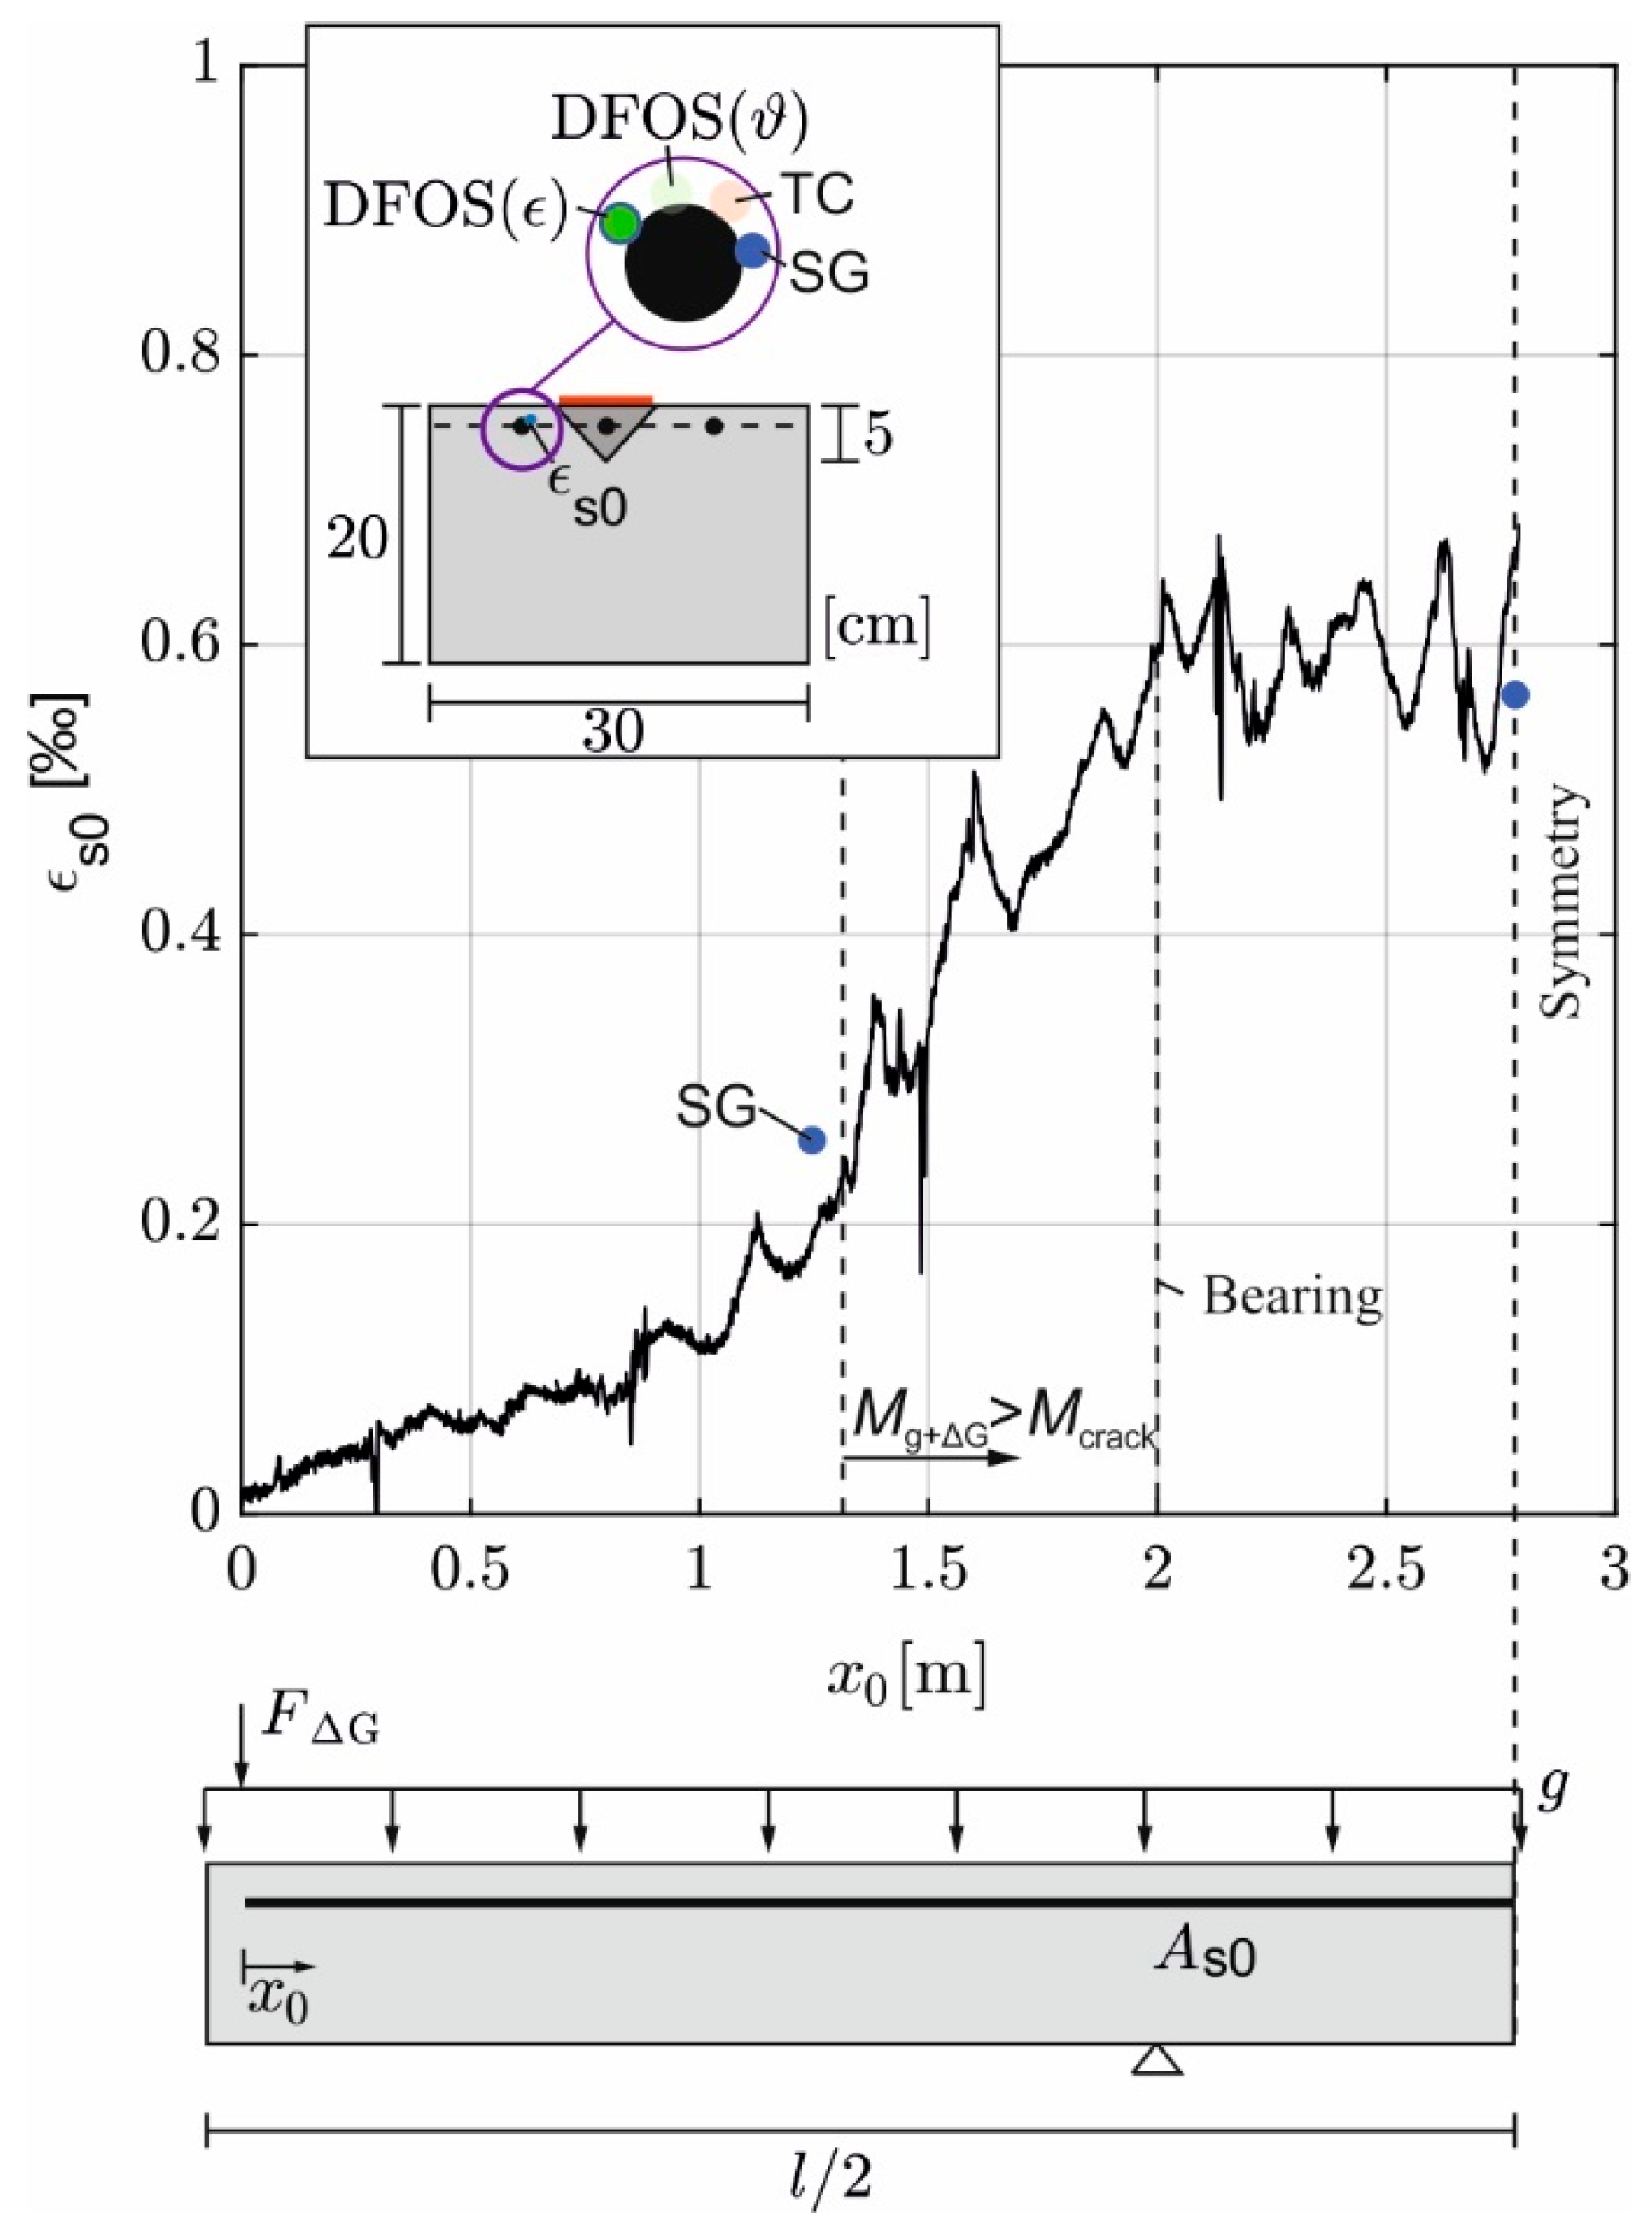
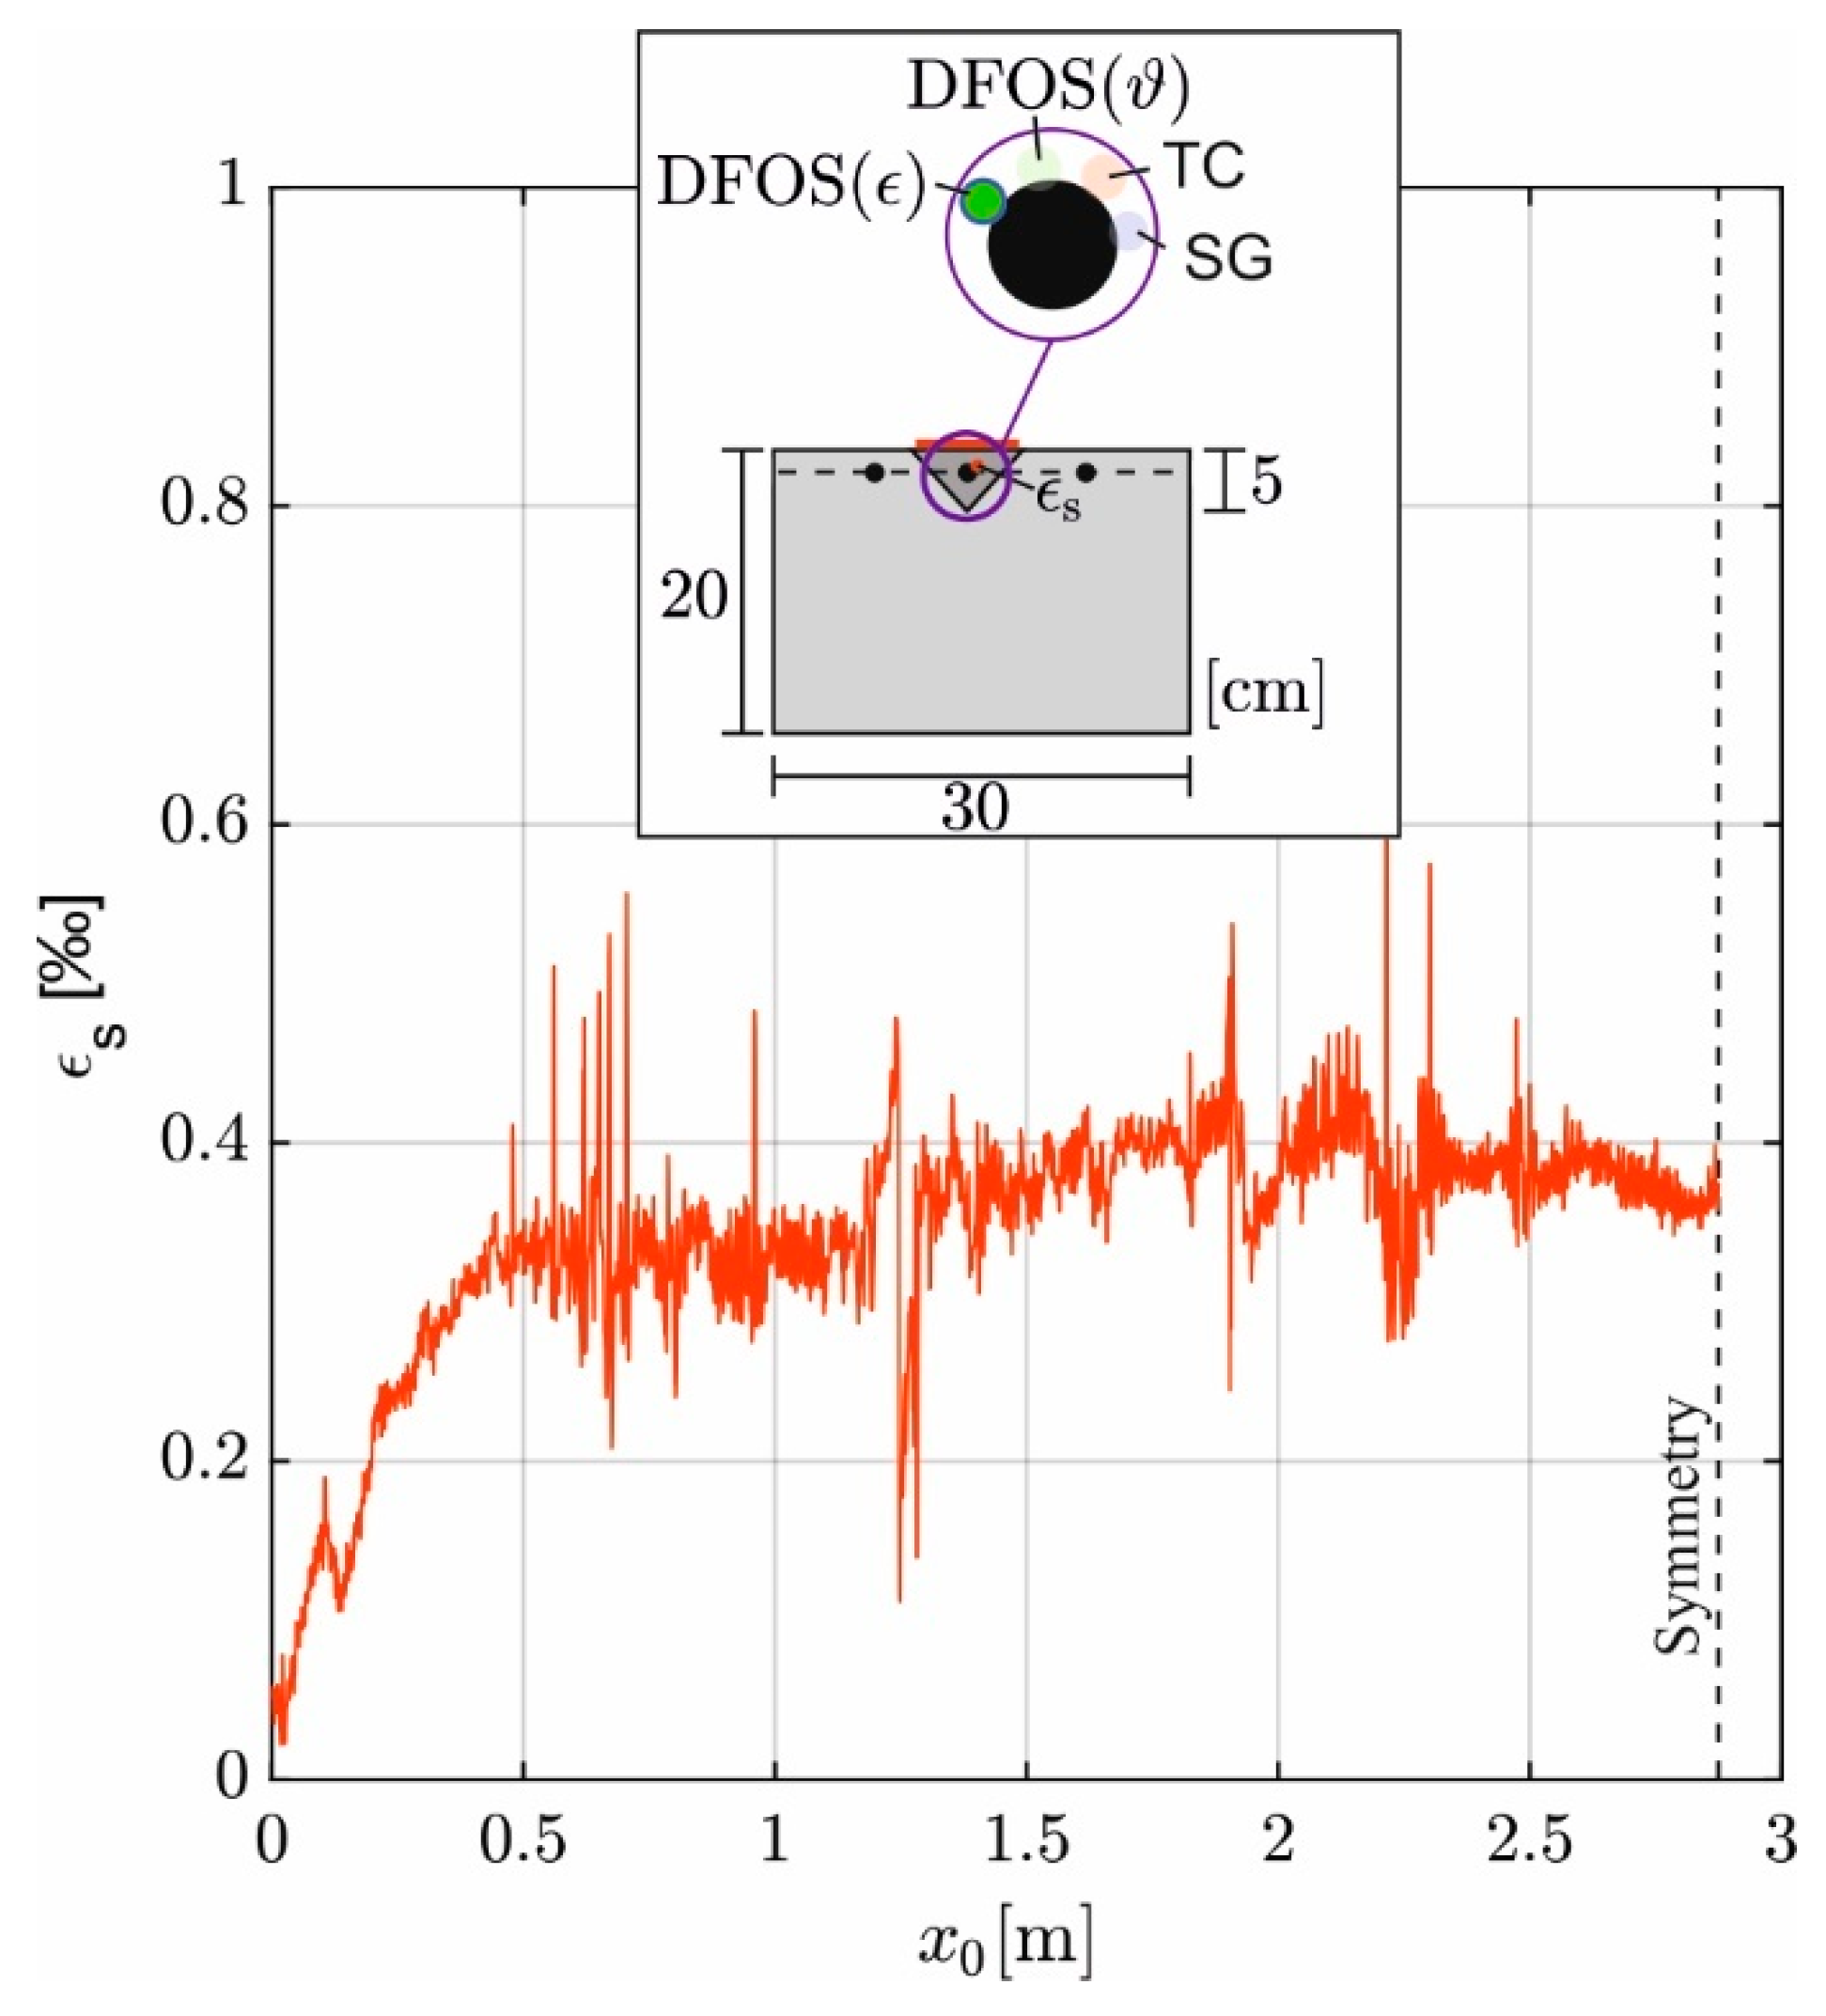
The initial strain in the basic reinforcement due to g + Δ g at time ( t a ) is denoted ε s 0 . Figure 4 shows it along the bar. The running coordinate of the DFOS(ε) data starts at the load application. The local positions of the SG are highlighted, too. Due to symmetry in loading and strain, just half the beam is shown. The initial strain increases almost linear from load application up to x 0 = 1.4 m. From here, the bending moment M g + Δ g exceeds the cracking moment M c r a c k = 5.8   k N m and the member turns to the cracked state. The strain increases hyperlinear. But between the supports, the strain remains approximately constant at about 0.6‰, which corresponds to the expected strain in concrete slabs due to self-weight. The punctual strains at the SGs confirm the data.

3.2. Thermal and Mechanical Strains in the Added Reinforcing Bar

The added reinforcing bar experiences strains just through heating ( t a to t b ). Only when the heat supply is stopped and the meantime hardened filler material prevents the bar from shortening, mechanical strain increases until the beam has completely cooled, meanwhile the thermal strain decreases again.
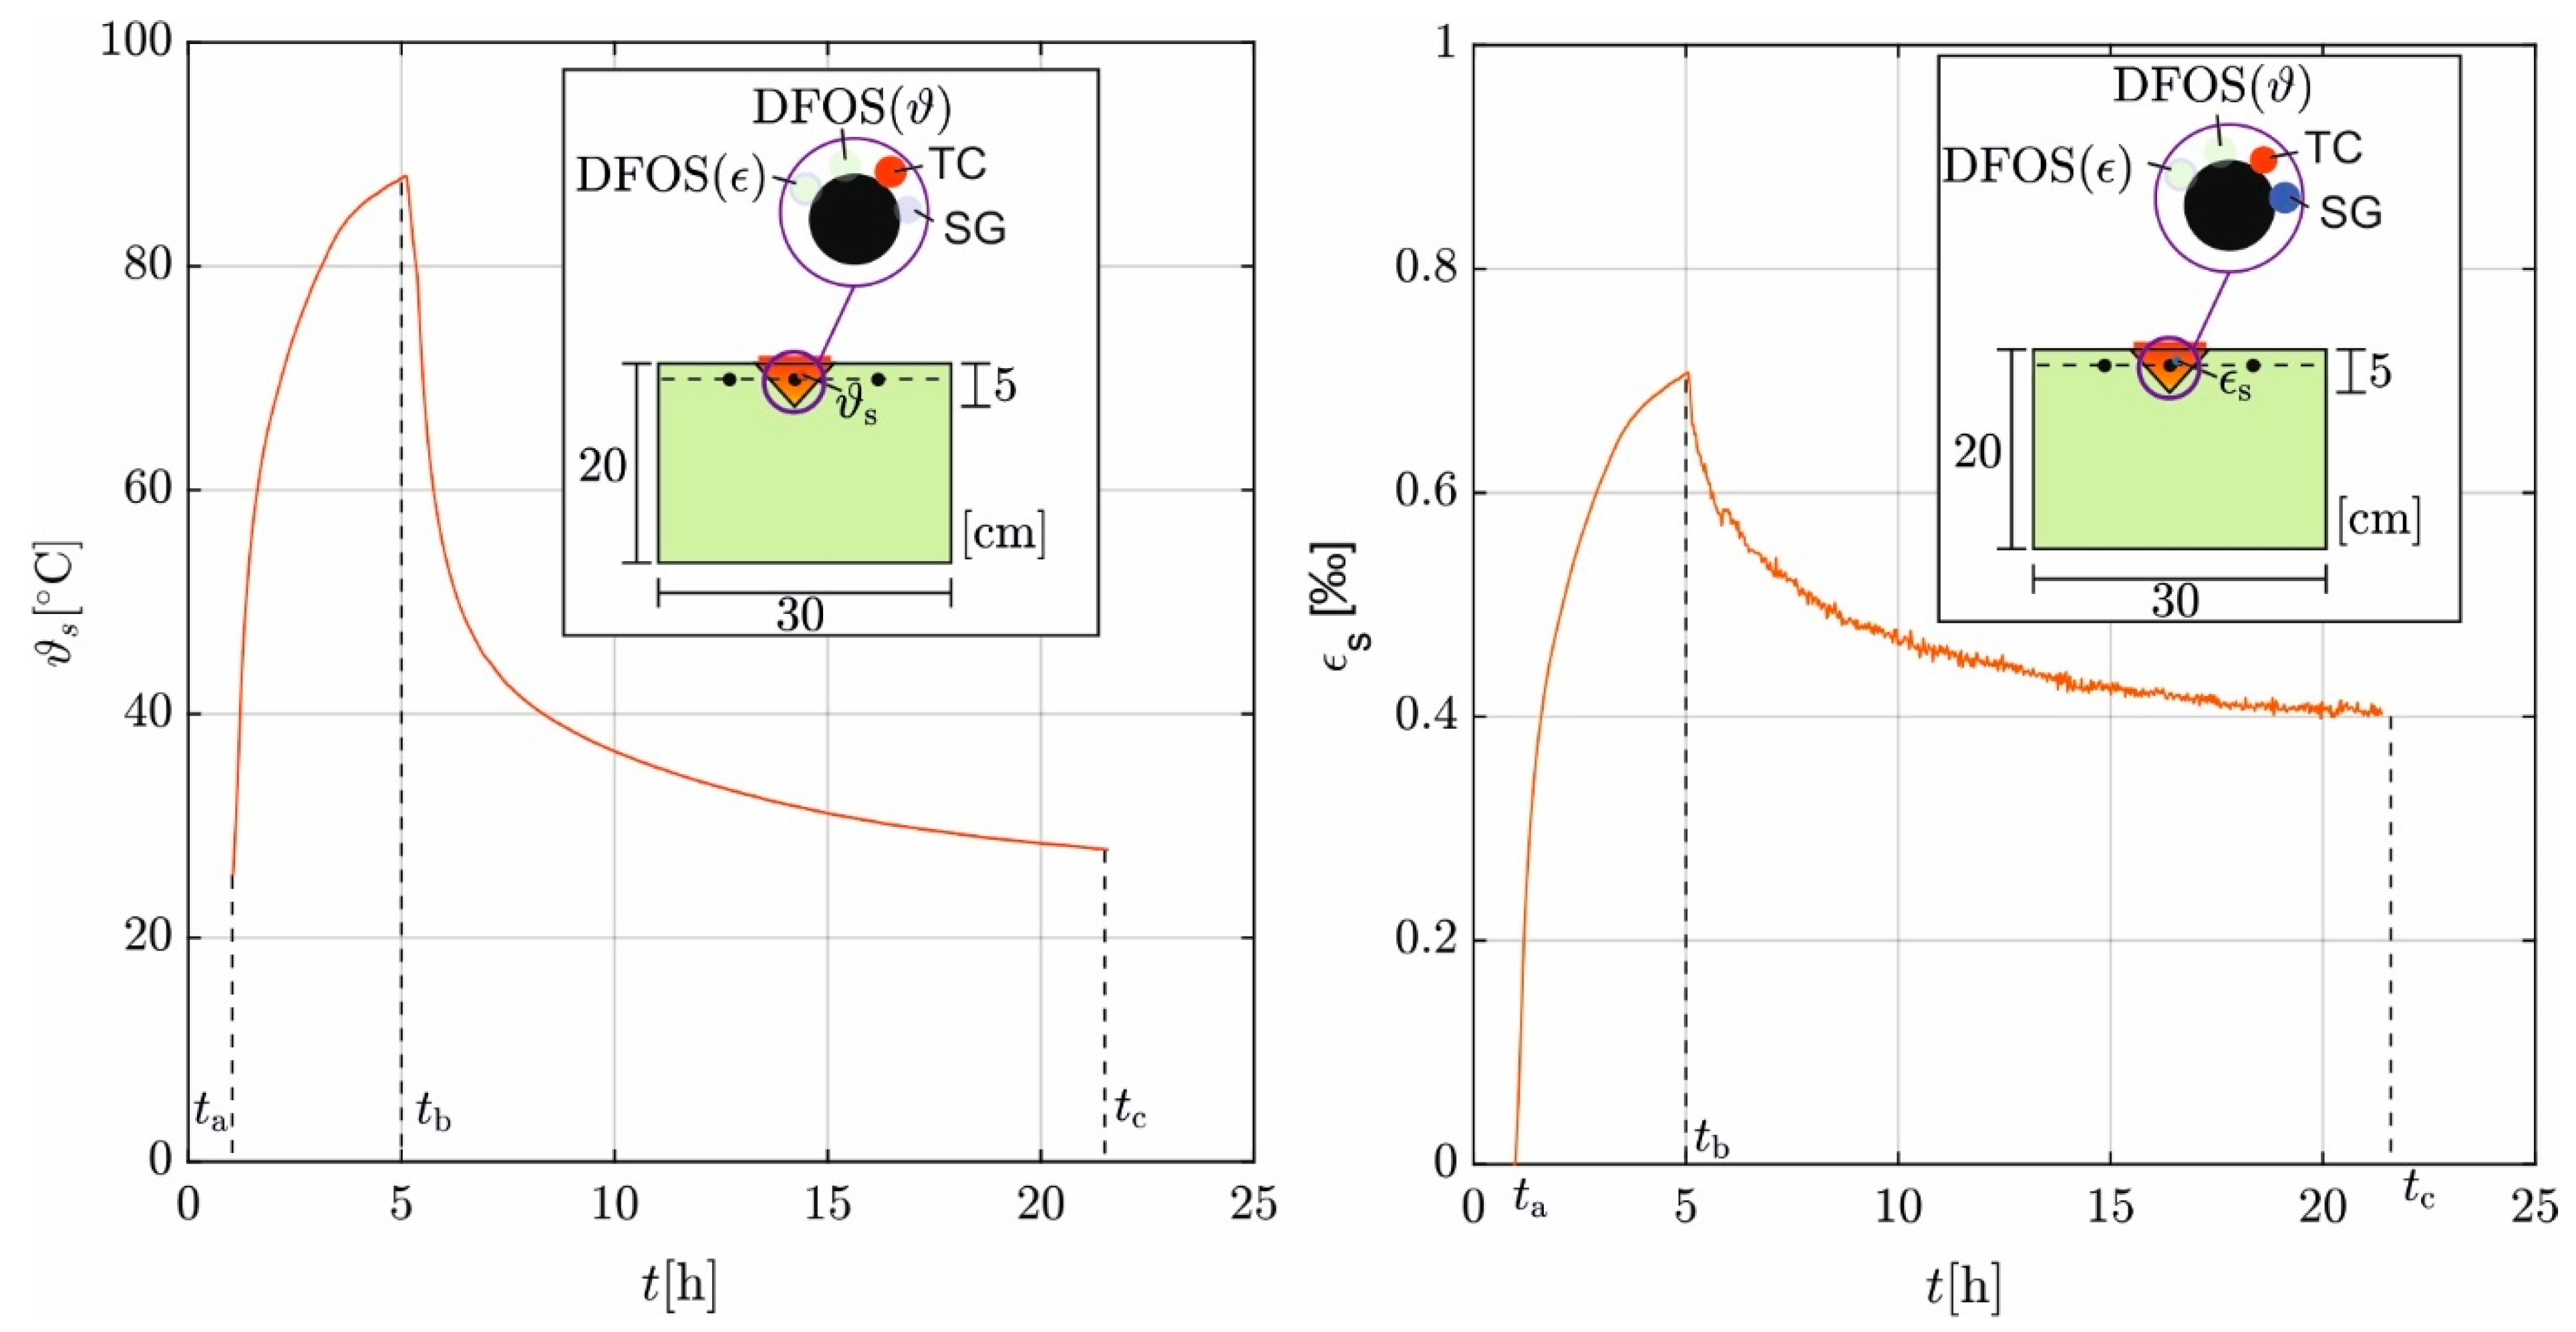
On the left, Figure 5 presents the temperature development on the added bar at center ϑ s up to t c using TC data. Due to heating, the temperature rises steeply from t a = 1 h at first. After 2 h the course becomes increasingly flatter until it reaches its maximum of 87 °C at t b = 5 h. When the heat supply is stopped ( t b ), the temperature drops and reaches its initial value of about 22 °C after approx. 23 h ( t c ) again.
The associated development of strains ε s (t) from SG data is shown in Figure 5, right. Both the bar and the bonded SG itself experience thermal expansion due to heating and the associated rise in temperature. It is important to note that the SG only records the difference in expansion through the different thermal expansion coefficients of the gauge ( α T , S G ) and reinforcing steel ( α T , s ) . The rise in temperature Δ ϑ s (t) stretches the bar by α T , s Δ ϑ s (t), while at the same time, the gauge experiences an elongation of α T , S G Δ ϑ s (t). The difference between the two strains is recorded by the SG (Equation (1)). In addition, it records mechanically induced strain changes ε s , M , which are measured directly. The total record is ε s , S G (t).
ε s , S G ( t ) = α T , s · Δ ϑ s ( t ) α T , S G · Δ ϑ s ( t ) + ε s , M
Δ ϑ s (t) is known from the temperature measurement (Figure 5, left) while α T , S G is directly taken from the product data sheet of the SG ( α T , S G = 10.8 10 6 1/K). Since ε s , M is zero during heating t < 5   h , α T , s can be determined by rearranging Equation (1). Averaged over t = [1, 5 ] h, α T , S equals 11.0 10 6 1/K. This enables to calculate of the thermal expansion of the bar ( α T , S · Δ ϑ s (t)). For t > 5   h , ε s , M is not zero, but can be separated from the thermal strains ε s , T using Equation (1). The strain of the added bar ε s (t) is thus calculated as follows:
ε s ( t ) = α T , S   ·   Δ ϑ s ( t ) ) for   t 5   h   ( thermal ) α T , S   ·   Δ ϑ s ( t ) ) + ε s , M for   t > 5   h   ( thermal + mechanical )
After t = 5 h, the strain in the added bar reaches its maximum of 0.7‰ due to heating. When heating is stopped ( t b ), it cools down and the thermal expansion decreases. From the strain at the time of hardening of the filler material, its re-deformation is prevented by the bond with the HPC. The residual thermal strain ε s , T remains in the bar as mechanical strain ε s , M . Beyond that point, the strain just drops slightly due to composite creep [32]. At t c , when the bar is completely cooled, ε_s is about 0.4‰. The results indicate that the concrete is already hardened after approximately one hour of heating (t = 2 h), and further temperature increases did not contribute much.
On half the symmetrical beam, the strain ε s in the added bar over its length x0 at t c is shown in Figure 6. At the end of the cantilever (x0 = 0) ε s is about 0.08‰ and increases almost linearly up to x0 = 0.5 m to approx. 0.40‰. This is due to the length required to re-anchor the thermal prestress and to the heat dissipating through the end faces, which causes an approx. 20 °C lower bar temperature there. By contrast, in the middle of the cross-section ε s ≈ 0.40‰ is nearly constant.

4. Computational Model for Thermally Prestressed Reinforcement

A computational model has been derived in [34] to determine the effective thermal prestress of added reinforcing bars and the resulting static impact. Controlled heating of the slot increases the temperature in the liquid filler material and bar, and with a certain time delay, also in the surrounding concrete. The temperature induces individual thermal strains in all parts of the cross-section. To determine its distribution, 2D numerical computation of temperature fields is employed [50] since the experimental strains are just recorded on some particular locations via DFOS( ϑ ) and TC (cf. Figure 2). The cross-section is discretized with 1600 finite quad elements (40 × 40 elements) for a temperature field analysis performed in Excel. But the triangular shape of the slot and the round bar inside are discretized much finer with element lengths of 4 mm. Thereby, the size of the elements increases towards the non-heated edges. Material specific parameters like bulk density ρ = [2200 (NSC), 2300 (HPC), 7800 (steel)] kg/m3, thermal conductivity λ = [1.65 (NSC), 4.5 (HPC), 50 (steel)] W/(mK) and specific heat capacity c = [1000 (NSC), 1400 (HPC), 450 (steel)] J/(kgK) are associated with the elements [26].
In the model the external heat source is represented by a heat flow supplied from outside across the width of the slot. The applied heat flow was determined from the measurements carried out during the experiment. There is no heat exchange on the sides of the cross-section, which idealizes thermal insulation. At the top and bottom, heat is exchanged with the environment (assumption 20 °C) by radiation and convection. The time step for the temperature calculation is limited by the material parameters and the element size and is set to Δt = 0.8 s [51].
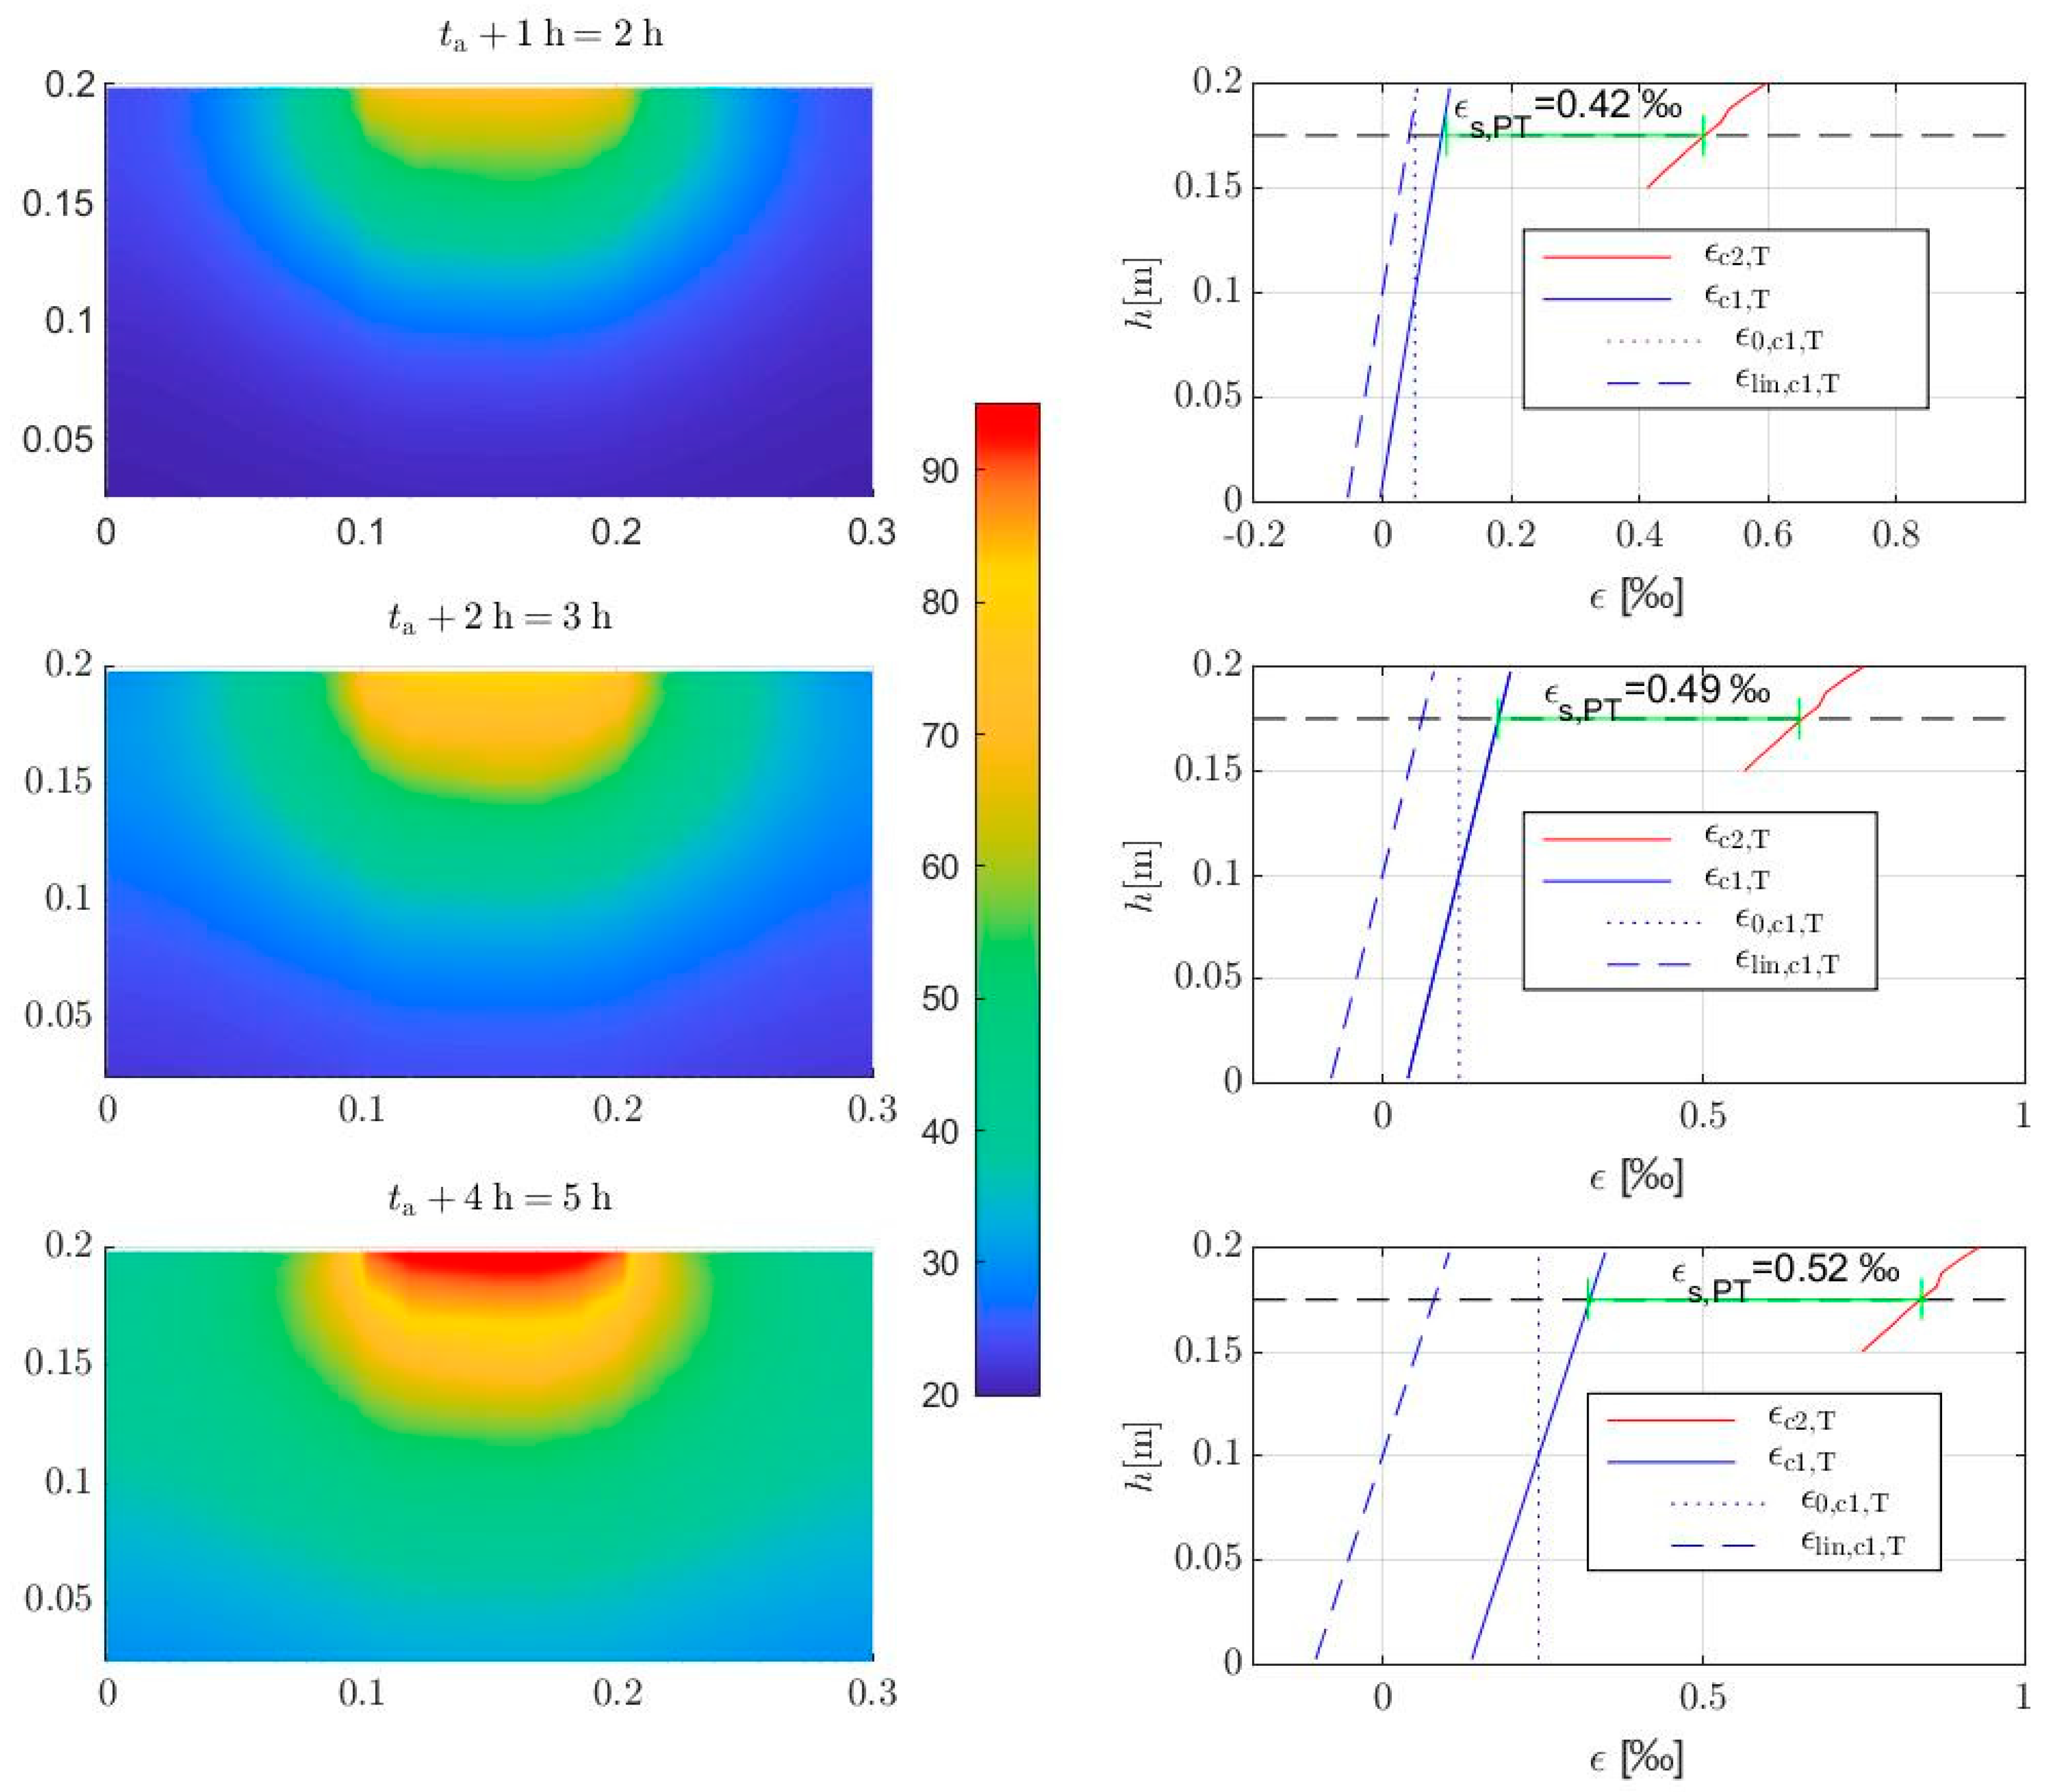
On the left, Figure 7 shows the calculated temperature distributions in the cross-section at the times t = t a + [1, 2, 4] h, with warm regions highlighted in red and unheated regions in blue. The starting point is a constant temperature field with an initial temperature of 22 °C, at t = ta = 1 h. At t = 2 h, the slot (HPC) has heated up to a constant temperature of about 65 °C. The surrounding NSC experiences only a slight increase in temperature. With increasing tempering time, the temperature in the slot rises to 93 °C, while at the same time, the heat is more spread in the NSC. The comparison of the numerical and experimental temperatures measured at various points in the experiment shows an average deviation of 1.9 °C or approx. 4%. Thus, the following evaluations use the results of the numerical temperature field calculation.
The thermal strains ε are calculated from the temperature changes Δ ϑ of each element multiplied with α T . Due to the symmetry of the temperature distribution in the x-direction and recalling Bernoulli’s hypothesis, a lamella model is used [52]. The lamella heights are chosen to be the same as the element heights of the grid for temperature field computation. For transfer to the lamella model, the temperature changes per row are converted into a mean temperature change Δ ϑ ¯ , from which the associated thermal expansion ( ε = Δ ϑ ¯ · α T ) is calculated. The obtained non-linear strain distribution over the height is broken down into a constant ( ε c 1,0 ) and a linear component ( ε c 1 , l i n ( z ) ) as well as a non-linear residual. The portion of the total strain that activates internal forces is ε c 1 z = ε c 1,0 + ε c 1 , l i n ( z ) . The non-linear residual just imposes a constraint into the cross-section and is thus not considered further. In liquid HPC, the strain adjusts itself freely. The strain in each lamella of the HPC results directly from the mean temperature change around the slot. For the added bar, constant thermal strain ε s is assumed to correspond to the temperature change in its center of gravity.
The linearized thermal strains from the temperature distribution of the initial cross-section and the supplemented reinforcement are shown in Figure 8 (right). The prestress effective strain of the added bar ε s , P T results from the strain difference between the bar ( ε s ) and the concrete in the corresponding lamella at the height of the bar ( ε c 1 ( z = 17.5   c m ) ). At t = 2 h ε s equals 0.50‰. The corresponding concrete strain ε c 1 ( z = 17.5   c m ) due to heat propagation reduces the effective strain is reduced to ε s , P T = 0.42‰. However, the temperature of the bar rises with the duration of heating and thus also ε s . Due to its mass and low thermal conductivity, the concrete heats up much more slowly and thus so do the strains, too. ε s , P T increases for t = 3 and 5 h to 0.49‰ and 0.52‰, respectively.
Decisive for the prestress is the temperature distribution at the time at which the filler material is hardened enough to bear the bond-induced forces. The results on the right of Figure 5 suggest a time of approx. 1 h of heating (t = 2 h). Then, the deviation between the calculated pre-strain and the imposed strain measured in the experiment is <5% (cf. Figure 5, right), with a thermal strain of about 0.40‰ in the experiment and 0.42‰ in the model.
Once heating is stopped (t = 5 h), cooling induces strain ε s , P T or an equivalent prestressing force F s which is obtained from Equation (3) by multiplying the strain by the cross-sectional area of the bar A s and the Young’s modulus of steel E s .
F s = ε s , P T · A s · E s
Analog to the principle of mechanical prestress F s induces an axial compressive force N P T and a bending moment M P T = N P T · z P T due to the distance of the added bar to the barycenter of the cross-section [26]. Both counteract the external loads and relieve the cross-section.
On top of the reinforcement, the thermally stretched filler material imposes another contribution to the prestress. The effective thermal strain of the filler material ε c , P T results lamella-wise from the strain difference to the NSC on the same height (Figure 7). Weighted by the area of the individual lamellas, it is transferred into a mean strain in the slot. The corresponding prestressing force F c 2 is calculated analog to Equation (3), depending on the net cross-sectional area of the slot A c 2 and the modulus of elasticity of the HPC E c 2 according to Equation (4).
F c 2 = ε c , P T · A c 2 · E c 2
Thus, F c 2 increases N P T and M P T . However, it must be carefully considered that the slot is in the tensile zone, and if the tensile strength of the HPC is once exceeded, the stiffness decreases due to cracking. F c 2 should therefore not be used in the ULS, or only to a limited extent.

5. Comparison of the Results of the Thermally Prestressed and the Reference Beams

5.1. Relation of Load and Deflection

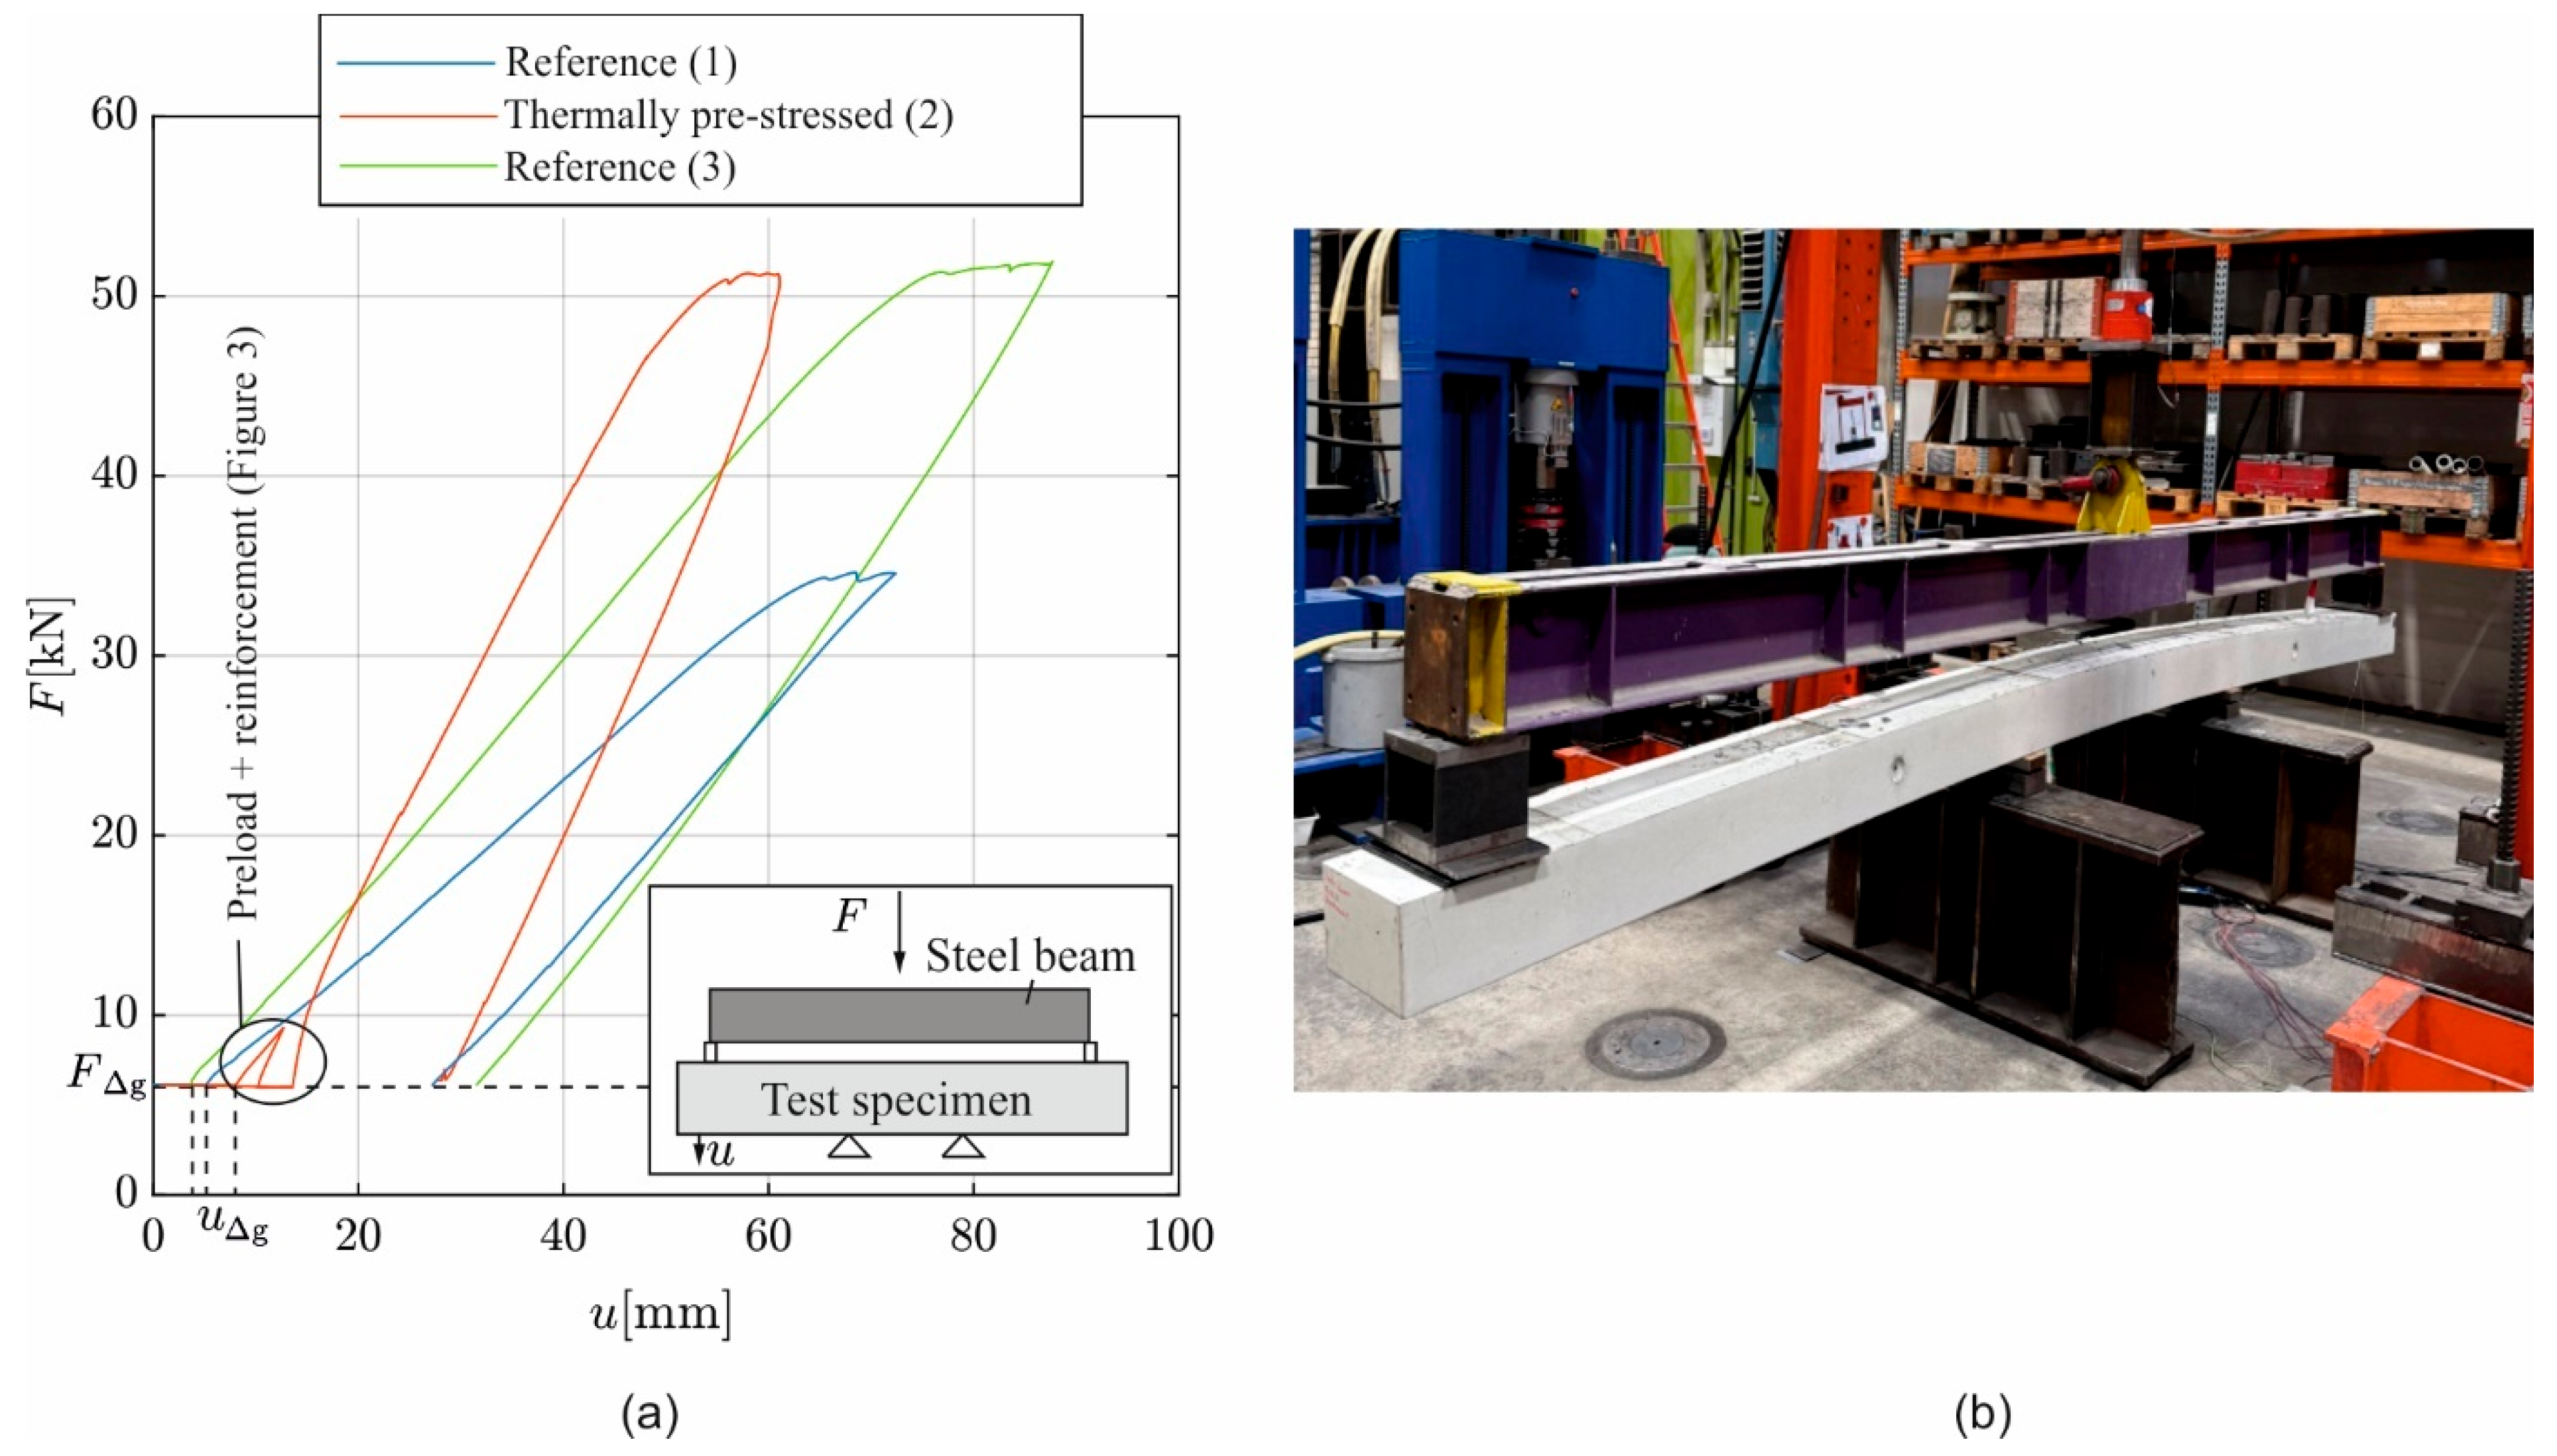
The stiffness of the strengthening measure compared to the reference beams is assessed on the load–deflection diagrams in Figure 8. The force F induces downward deflection u to the cantilever arms, which is recorded on both sides with displacement transducers. Because of symmetry, these deflections are averaged to draw the load–displacement diagrams shown.
As expected, the beam (no. 3) and the strengthened one (no. 2) achieve approximately the same maximum load. Due to its lower reinforcement, the beam (no. 1) remains below. It also has the lowest stiffness, followed by the beam (no. 3), as is seen from the inclination of the loading branches. That of the strengthened beam runs even steeper. Due to duration and sequence of the strengthening process (cf. Figure 3), the load–deflection curve of the strengthened beam starts later, i.e., shifted or with a deformation lead, but at the same load level ( F Δ g ). Likewise, the load–deflection curves of the two reference beams already have a (small) offset to each other due to the lower reinforcement of beam no. 1.
Just placing the steel crossbeams of the weight F Δ g / 2 = 3 kN on each cantilever generates another deflection u Δ g This is greatest for the thermally prestressed beam due to the reduced cross-section caused by the triangular slot and its reduced bending stiffness. E I y . It is even greater than for the less reinforced beam (no. 1). Moreover, before strengthening, beam no. 2 is initially preloaded by the force F Q once (Figure 8, left). The induced deflection is not completely reversible, and even increases during strengthening due to creep at constant loading. Accordingly, it is significantly greater at t c than in the reference beams, which are loaded directly.

5.2. Comparison of the Strain Development in Thermally Prestressed and Initial Reinforcement

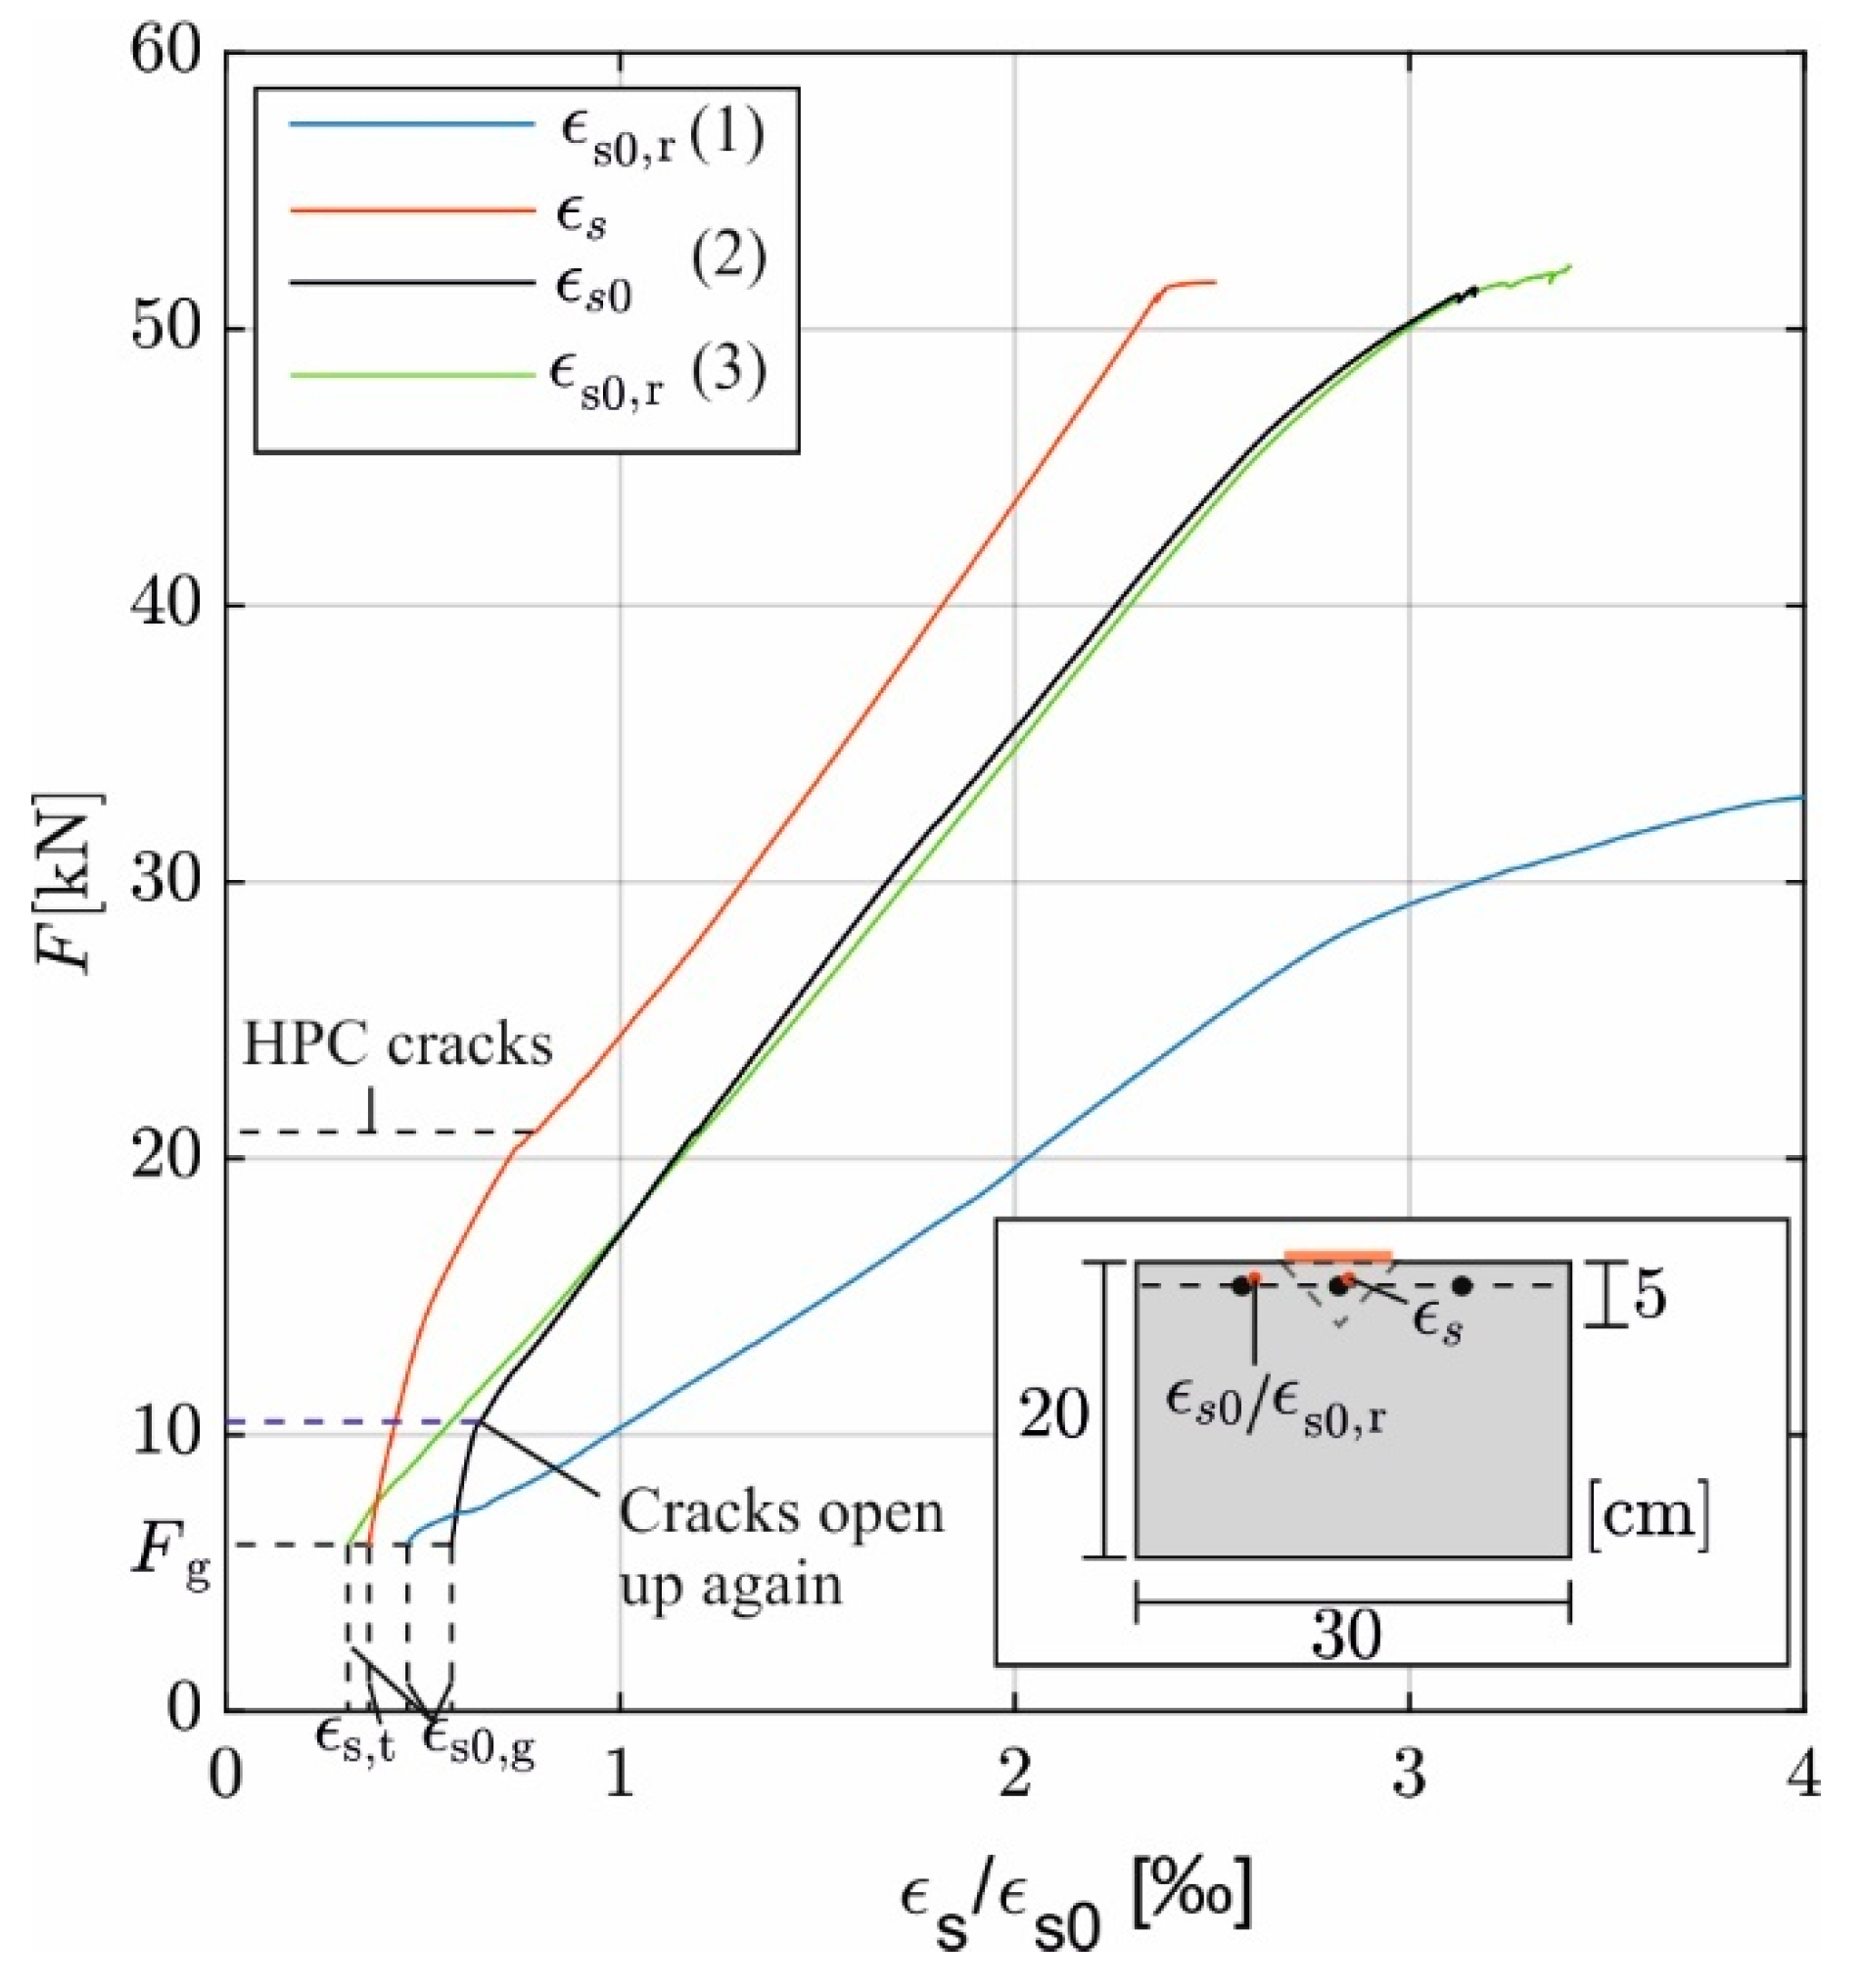
The aim of the strengthening method is to join the added bar and the initial cross-section and participate equally in the load transfer. Figure 9 shows the strain development of reinforcing bars in the three beams due to load increase. This is exemplified in the added ( ε s ) and an initial bar ( ε s 0 ) for the thermally prestressed beam and in each of the references on a lateral initial bar ( ε s 0 , r (3), ε s 0 , r (1)). At t c , the initial bars exhibit the strain due to self-weight ε s 0 , g from g + F Δ g while the added bar exhibits just the thermal strain ε s , t . With increasing load F, the strain in all bars also increases, whereby initially, until the onset of cracking, both ε s 0 and ε s increase considerably slower than ε s 0 , r (3) and ε s 0 , r (1).
As a result of thermal prestressing, the cross-section is compressed and the cracks in the concrete are partially closed. In addition to the reinforcement, the concrete in the tensile zone thus contributes to load transfer (state I). In the reference beams, which are already cracked due to F Δ g , the concrete in the tensile zone does not contribute, and tensile stresses induced by F are borne by the reinforcement (state II). Not below a total load of F = 10 kN, the cracks in the thermally prestressed beam do open again, and the beam switches to state II. Then, ε s 0 und ε s 0 , r (3) increase equally. Due to its higher tensile strength, the HPC first cracks at F = 21 kN. Then the steel strains in the bar therein also increase, and ε s rises parallel to ε s 0 and ε s 0 , r (3).
In all three beams, the reinforcement starts yielding when the maximum load is reached, and the steel strains increase quickly. This indicates them striving towards ductile bending failure.

6. Discussion

6.1. Impact of Thermal Prestressing on Cracking of Concrete

The thermal prestressing relieves the tensile zone of the cross-section and creates compression, which influences the formation of cracks in the concrete. At t b , the concrete is cracked between the supports due to g + F Δ g + F Q . In the cracks, the reinforcement bears all tensile forces. Between the cracks, the concrete contributes, and the flexural tensile force is distributed between the concrete and the reinforcement (tension stiffening). Accordingly, the formation of cracks leads to strain peaks in the reinforcement, which can be detected by the quasi-continuous strain measurement using DFOS. Even more, according to [48], the associated crack widths w can be derived from the strain peaks. Since each measuring point on the glass fiber is assigned a position in the beam, the positions of the cracks are also known.
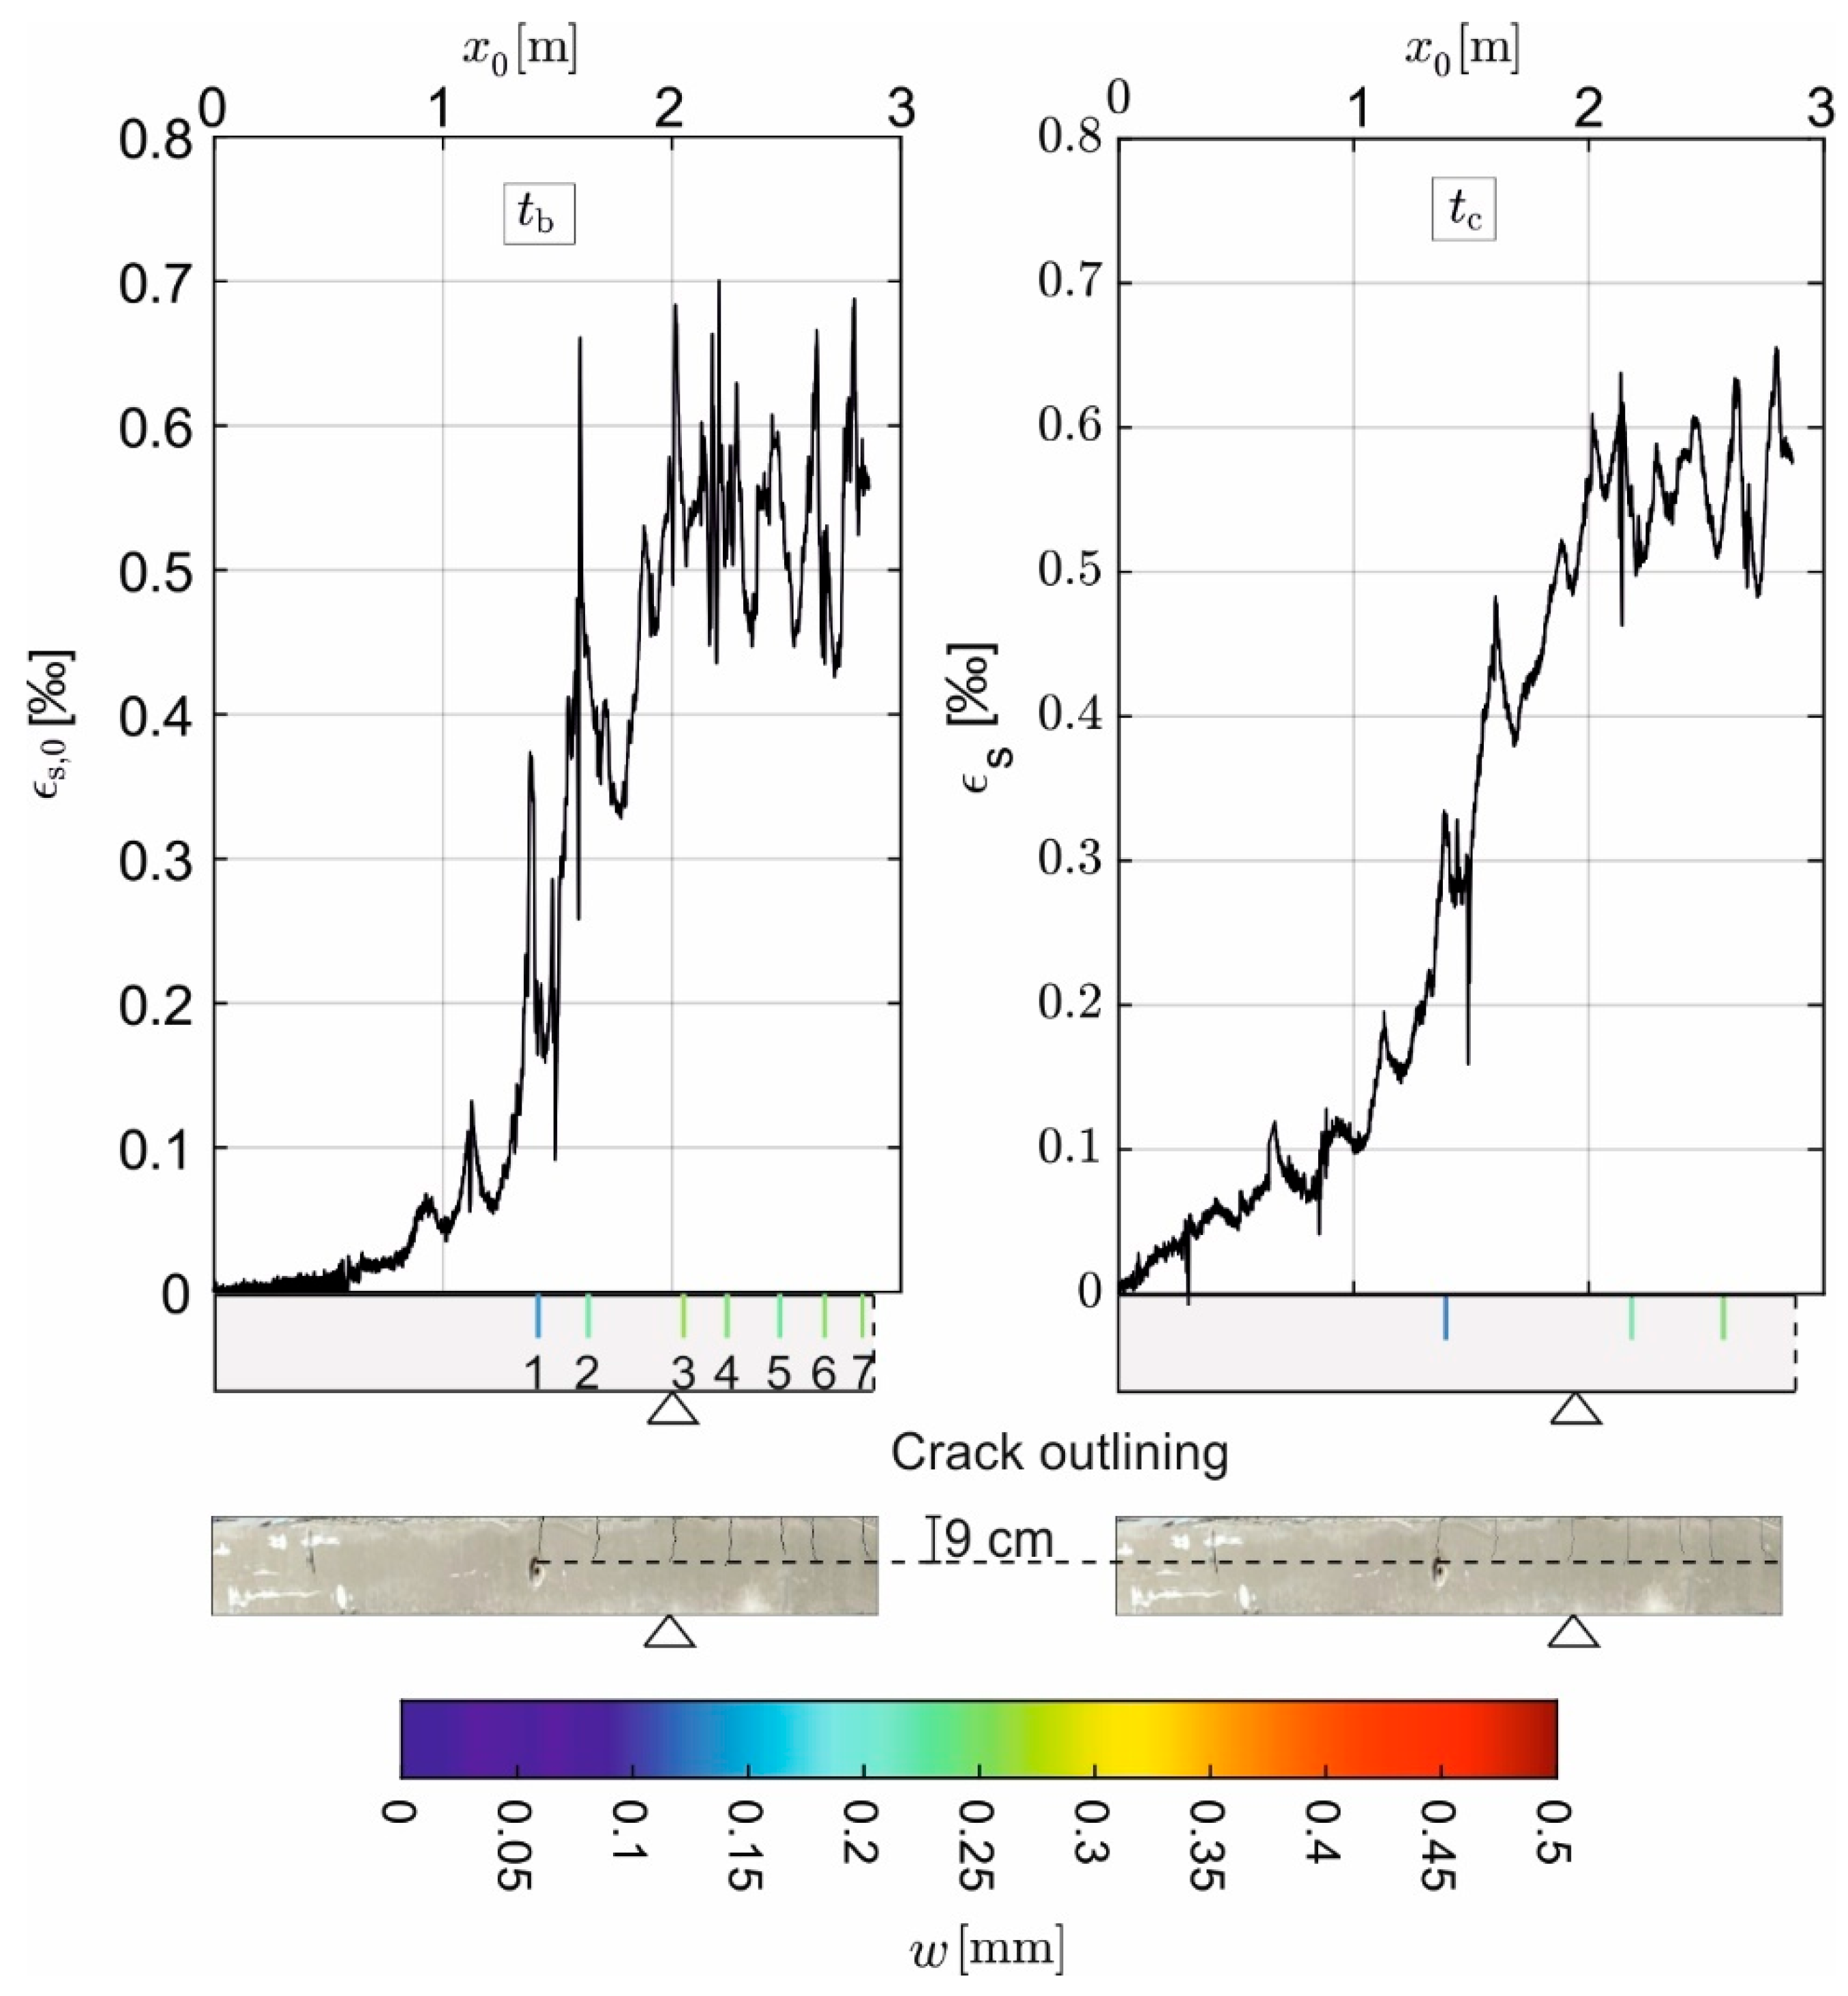
Figure 10 compares the distribution of ε s 0 over the bar length x 0 of half the beam at t b (left) and t c (right). The cracks in position and width derived from the strain according to [53] are color-coded below: blue corresponds to small and red to large, calculated crack widths at the level of the reinforcement. To validate the results, the cracks were marked and photographed on the corresponding beam surface at both times (Figure 10 (bottom)). The position of the cracks and their width were recorded using a crack map (accuracy 1/10 mm) and measuring tape (crack mapping). Both are compared with the DFOS results in Table 3. There is a high degree of agreement between the two methods.
When strengthening and cooling are finished at t c , the thermal prestress induces compression into the cross-section. Consequently, the crack widths and thus also the strain peaks in ε s 0 decrease (Figure 10 (left)). Small strain peaks are increasingly superimposed by scatter in the measurement signal and can no longer be clearly identified as cracks. Crack widths < 0.1 mm are therefore no longer detectable when evaluating DFOS data. Compared to t b the number of detected cracks is reduced from 7 to 3 at t c . Although the cracks not detectable from the DFOS data are still visible on the surface, the width measured with the tape has clearly decreased, too (Table 3).
Figure 11 shows the crack pattern of the three beams at F m a x ( t d ). On the left, only few yet wide cracks are visible in beam no. 1 with only two reinforcing bars. The thermally prestressed beam no. 2 at the center and the other reference no. 3 with 3 bars show many much thinner cracks. For both references, the cracks are approx. 16 cm deep. For the thermally prestressed beam, however, the cracks end at about 10 cm depth. This results from the lower utilization of the tensile zone due to thermal prestressing.

6.2. Comparison of the Measured and Numerically Predicted Mechanical Strain in the Reinforcement

The mechanical impact of thermal prestressing can be calculated by the model according to [34]. The axial force N P T and the corresponding bending moment M P T induced by the prestress counteract the external forces from the applied loads F and thus relieve the tensile zone. The corresponding strain distribution in the cross-section can thus be calculated by iterating the strain plane until the equilibrium of internal (index R) and external forces (index E) according to Equations (5) and (6) is found.
! N E = N P T = N R
! M E = M F M P T = M R
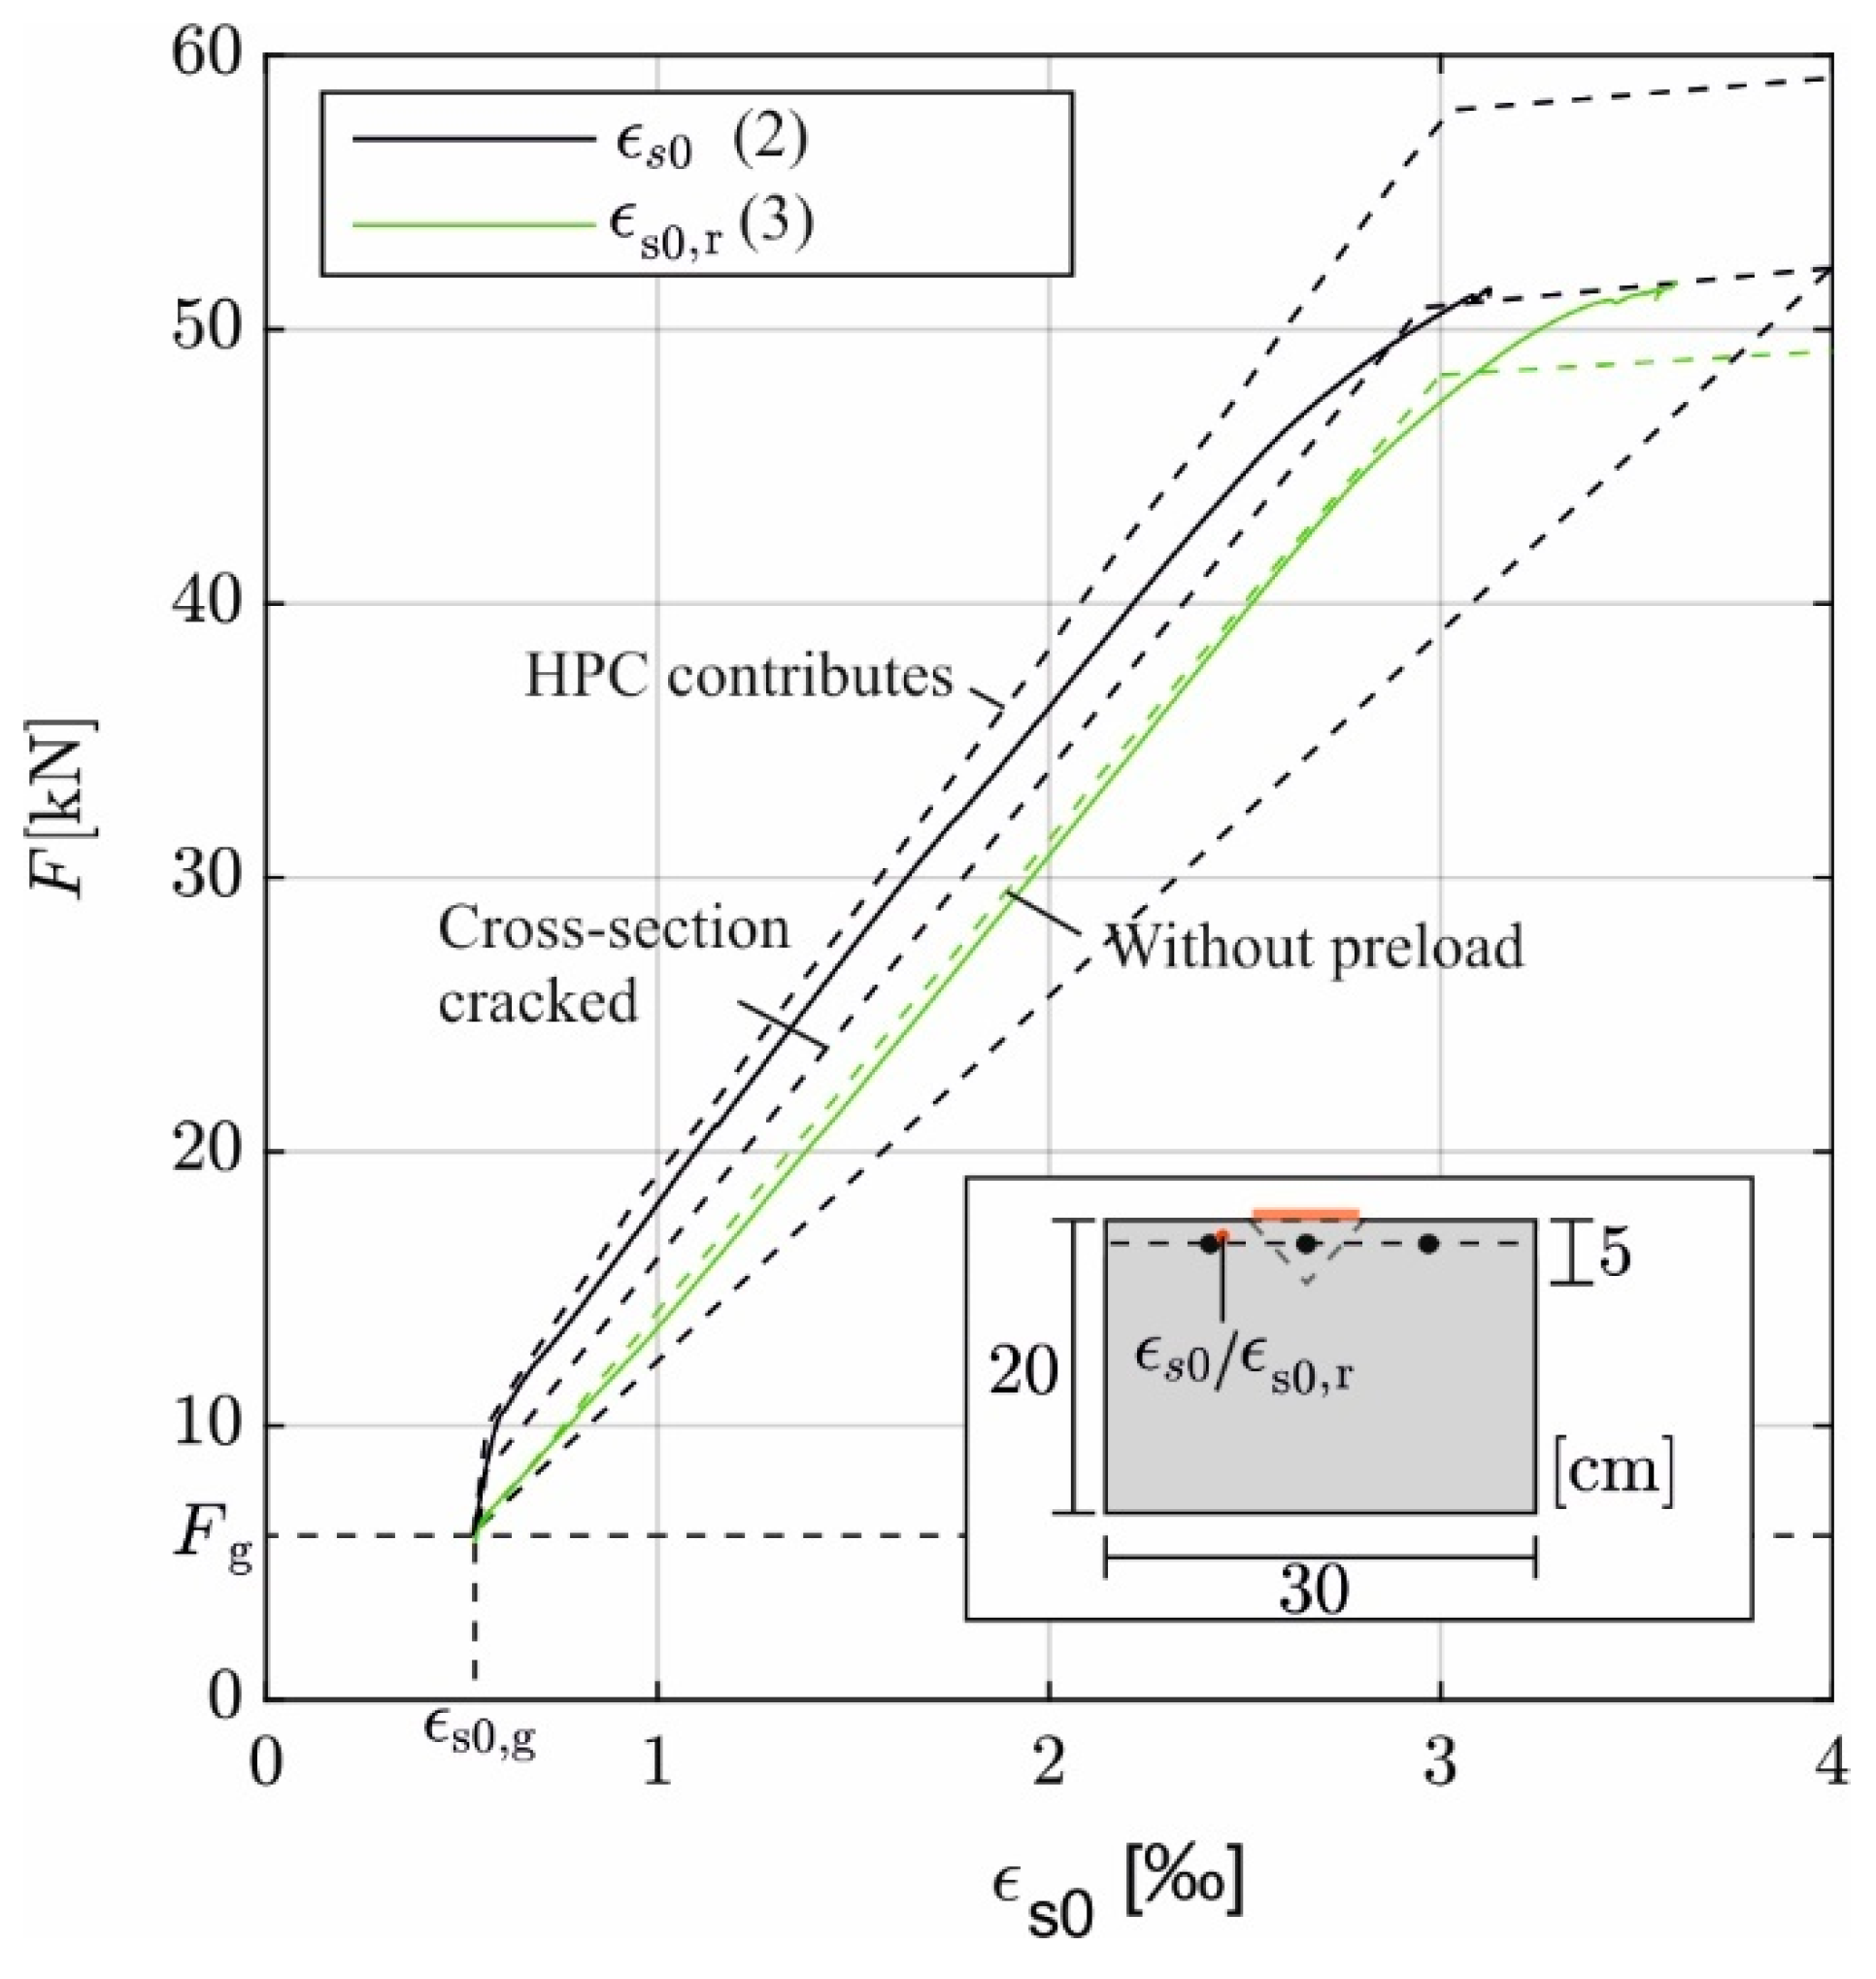
From the temperature distribution at the time at which the filler material is sufficiently hardened to transfer the forces from prestressing (cf. Chapter 3.1.2, after 2 h heat treatment), Equations (3) and (4) yield F s = 16.9 kN and F c 2 = 30.3 kN for the prestressing force in the reinforcing bar ( E s = 210,000 MPa) and the HPC ( E c = 45.000 MPa), respectively. Thus, the expected strain in the initial reinforcement ε s 0 can be calculated iteratively with Equations (5) and (6) of the calculation model in [26] and three different cases: with (“HPC contributes”) and without F c 2 (“HPC cracked”) as well as without any prestressing contribution.
Figure 12 displays the calculated (dashed) and measured (solid) strains on beams no. 2 (prestressed) and no. 3 (upper reference) versus the load. Until yielding of the reinforcement, the computed curve without prestress coincides with the upper reference ε s 0 , r (3). Considering a contribution of HPC to the prestress, the calculated value follows the measured curve up to F = 10 kN (≈0.2* F m a x ). Above that level, the measured curve approaches the one associated with (“HPC cracked”), which is finally reached at F m a x . This shows that the prestressing effect of the HPC is fully effective at lower load levels. Even at service load level (0.3 bis 0.6 · F m a x ), more than 90% of the HPC’s effect is still there. Just beyond that level, the effect decreases significantly. When the reinforcement finally starts to yield, just F s remains effective.

6.3. Effectiveness of Strengthening in ULS and SLS

Strengthening with thermally prestressed additional reinforcement has a positive effect on the load-bearing capacity and the serviceability. This is supported by comparing the maximum loads, deflections, and mean crack widths in the tests according to Table 4. The maximum capacity in the test equals that of the upper reference (beam no. 3) reinforced with three bars from the beginning and is significantly higher than that of beam no. 1, reinforced with two bars only. This means that the added bar is fully effective in the ULS.
At SLS, the thermally prestressed beam even represents an improvement on the upper reference. The deflection at F m a x is approx. 33% lower and even more pronounced for lower load levels (see Figure 8). Moreover, the cracks in the tensile zone are closed due to thermal prestressing. The average width of the cracks recorded using DFOS (Figure 10) is 0.22 mm before ( t b ) and 0.12 mm after strengthening ( t c ), which corresponds to an improvement of approx. 45%. When strengthened, the average crack width is approx. 34% smaller than that of the upper reference at the same load.
The present study focused on the short-term structural response. Long-term effects, such as creep, were investigated in [36]. However, in the cracked state, the filler material is not expected to creep significantly, so that its influence on prestress losses can be considered minor. Nevertheless, further studies on long-term behavior and durability remain necessary to confirm this assumption.

7. Conclusions

This paper investigated the effectiveness of strengthening reinforced concrete members with thermally prestressed post-installed reinforcement. Different from other techniques, this method is effective against the self-weight, which often accounts for the major part of loads on concrete structures. The main findings are as follows:
  • The reinforcing bar could be thermally stretched by 0.4‰ through heating with mats at about 80 °C. Once the filler material is hardened, the new bar is bonded to the concrete and is jointly effective against increasing loads. Internal stresses are equally distributed to all reinforcing bars. The maximum load is virtually the same as that of the not-strengthened reference. Thus, strengthening is fully effective in ULS.
  • Thermal prestressing significantly increases the stiffness of the beam. At the same maximum load, the deflection is approx. 33% lower than in the not-strengthened reference. Moreover, the crack depths at maximum load are significantly lower than in the reference, which is attributed to a lower utilization of the tensile zone.
  • Inherently, prestressing the filler material also creates another benefit. Comparison of computational and measuring results with and without prestress proves that its contribution is fully effective up to 20% of the maximum load. With further load increase, it starts cracking, and the prestressing effect is mitigated. However, at serviceability load level or up to approx. 0.6 F m a x , the beneficial prestressing effect is still over 90% effective. But finally, at maximum load, just the thermally stretched bar remains effective.
  • Subsequent thermal prestressing induces pressure into the cross-section, which partially closes existing cracks. After strengthening, the crack widths in the test are reduced by 45% on average.
The method is not limited to slabs but can, in principle, be applied to any structural members with high self-weight and flexural deficiencies. However, the present investigations were restricted to applications from the top side of beams. For practical use, an execution from the underside of structural members will have to be developed and validated. Since the filler material used is self-compacting, such an application on the underside of slabs or beams appears feasible, but still requires further investigation.

Author Contributions

Investigation, Y.S.; Supervision and investigation, D.S. and P.M. All authors have read and agreed to the published version of the manuscript.

Funding

This research was funded by the German Research Foundation (DFG) for its financial support of the project with grant number 458161128.

Data Availability Statement

Data are contained within the article.

Conflicts of Interest

The authors declare no conflict of interest.

References

  1. Täljsten, B. FRP strengthening of concrete structures: New inventions and applications. Prog. Struct. Eng. Maths 2004, 6, 162–172. [Google Scholar] [CrossRef]
  2. Wu, C.; Li, V.C. CFRP-ECC hybrid for strengthening of the concrete structures. Compos. Struct. 2017, 178, 372–382. [Google Scholar] [CrossRef]
  3. Chen, Y.; Davalos, J.F.; Ray, I.; Kim, H.-Y. Accelerated aging tests for evaluations of durability performance of FRP reinforcing bars for concrete structures. Compos. Struct. 2007, 78, 101–111. [Google Scholar] [CrossRef]
  4. Huang, Y.; Grünewald, S.; Schlangen, E.; Luković, M. Strengthening of concrete structures with ultra high performance fiber reinforced concrete (UHPFRC): A critical review. Constr. Build. Mater. 2022, 336, 127398. [Google Scholar] [CrossRef]
  5. Siddika, A.; Mamun, M.A.A.; Ferdous, W.; Alyousef, R. Performances, challenges and opportunities in strengthening reinforced concrete structures by using FRPs—A state-of-the-art review. Eng. Fail. Anal. 2020, 111, 104480. [Google Scholar] [CrossRef]
  6. Zhu, Y.; Zhang, Y.; Hussein, H.H.; Chen, G. Flexural strengthening of reinforced concrete beams or slabs using ultra-high performance concrete (UHPC): A state of the art review. Eng. Struct. 2020, 205, 110035. [Google Scholar] [CrossRef]
  7. Gribniak, V.; Cervenka, V.; Kaklauskas, G. Deflection prediction of reinforced concrete beams by design codes and computer simulation. Eng. Struct. 2013, 56, 2175–2186. [Google Scholar] [CrossRef]
  8. Yu, Y.; Lee, S.; Cho, J.-Y. Deflection of reinforced concrete beam under low-velocity impact loads. Int. J. Impact Eng. 2021, 154, 103878. [Google Scholar] [CrossRef]
  9. Mishra, M.; Lourenço, P.B.; Ramana, G.V. Structural health monitoring of civil engineering structures by using the internet of things: A review. J. Build. Eng. 2022, 48, 103954. [Google Scholar] [CrossRef]
  10. van der Esch, A.; Wolfs, R.; Fennis, S.; Roosen, M.; Wijte, S. Categorization of formulas for calculation of crack width and spacing in reinforced concrete elements. Struct. Concr. 2024, 25, 32–48. [Google Scholar] [CrossRef]
  11. Jędrzejewska, A.; Zych, M.; Kanavaris, F.; Chen, F.; Ito, S.; Torrenti, J.M.; Schlicke, D.; Asamoto, S.; Azenha, M. Standardized models for cracking due to restraint of imposed strains—The state of the art. Struct. Concr. 2023, 24, 5388–5405. [Google Scholar] [CrossRef]
  12. Chai, L.-J.; Guo, L.-P.; Chen, B.; Sun, P.-Y.; Ding, C.; Liu, Z.-C.; Wang, L.-Y.; Wang, Y.-K. Design method of serviceability limit states of BFRP bar reinforced ecological high ductility concrete beam: Experimental and theoretical analysis. Structures 2022, 40, 855–865. [Google Scholar] [CrossRef]
  13. El Kechebour, B.; Zeloum, H. Choice between Retrofitting and Reconstruction of Buildings in Reinforced Concrete after an Earthquake. AMR 2015, 1119, 736–740. [Google Scholar] [CrossRef]
  14. Saeed, F.H.; Hejazi, F.; Rashid, R.S.M. Strengthening of reinforced concrete slabs using carbon fiber reinforced polymers rods and concrete jacket with a mechanical anchorage system. Constr. Build. Mater. 2024, 440, 137464. [Google Scholar] [CrossRef]
  15. Khaled, E.; Hassan, A.; Mahmoud, M.H.; El-Shafiey, T.F. Flexural behaviour of reinforced concrete slabs strengthened with textile-reinforced strain-hardening cementitious composites subjected to post-strengthening corrosion. Eng. Struct. 2025, 329, 119822. [Google Scholar] [CrossRef]
  16. Al-Yousuf, A.; Al-Kamaki, Y.S.S.; Lateef, H.A.; Ali, Y.A.; Assi, L.N.; Kareem, R.S.; Dekhn, H.C. The Behavior of Reinforced Concrete Slabs Strengthened by Different Patterns and Percentages of Carbon Fiber-Reinforced Polymer (CFRP) Plate. Constr. Mater. 2025, 5, 24. [Google Scholar] [CrossRef]
  17. Hamdy, A.E.; Abdalla, H.A.; Abdelhamed, G.D.; Elansary, A.A. Experimental and numerical behavior of strengthened reinforced concrete slabs. J. Eng. Appl. Sci. 2025, 72, 38. [Google Scholar] [CrossRef]
  18. Su, R.; Zhu, Y. Experimental and numerical studies of external steel plate strengthened reinforced concrete coupling beams. Eng. Struct. 2005, 27, 1537–1550. [Google Scholar] [CrossRef]
  19. Su, R.; Siu, W.H.; Smith, S.T. Effects of bolt–plate arrangements on steel plate strengthened reinforced concrete beams. Eng. Struct. 2010, 32, 1769–1778. [Google Scholar] [CrossRef]
  20. Barnes, R.A.; Baglin, P.S.; Mays, G.C.; Subedi, N.K. External steel plate systems for the shear strengthening of reinforced concrete beams. Eng. Struct. 2001, 23, 1162–1176. [Google Scholar] [CrossRef]
  21. Ghobarah, A.; El-Attar, M.; Aly, N.M. Evaluation of retrofit strategies for reinforced concrete columns. Eng. Struct. 2000, 22, 490–501. [Google Scholar] [CrossRef]
  22. Zhang, Z.; Li, W.; Guo, X.; Sun, Q.; Tian, P.; Wu, Y. Development of theoretical model for predicting flexural behavior of GFRP reinforced concrete beams with CFRP grid-reinforced ECC. Struct. Concr. 2024, 25, 583–602. [Google Scholar] [CrossRef]
  23. Szczepański, K.; Kotynia, R. Bending moments redistribution in two-span reinforced concrete beams reinforced with FRP bars based on collected data research. Struct. Concr. 2024, 25, 1076–1091. [Google Scholar] [CrossRef]
  24. Abd elaziz, S.; Khalil, E.; Hadhoud, H. Strengthining of Reinforced Concrete Slabs Using Carbon Fiber Polymers. JES. J. Eng. Sci. 2023, 51, 242–254. [Google Scholar] [CrossRef]
  25. Feix, J.; Lechner, J. A new Post-Installed Reinforcement System to Extend Life Time of Existing Structures as Contribution to Sustainability. Ce Papers 2023, 6, 981–989. [Google Scholar] [CrossRef]
  26. Randl, N.; Kunz, J. Post-installed reinforcement connections at ultimate and serviceability limit states. Struct. Concr. 2014, 15, 563–574. [Google Scholar] [CrossRef]
  27. Zhu, Y.; Zhang, Y.; Hussein, H.H.; Chen, G. Numerical modeling for damaged reinforced concrete slab strengthened by ultra-high performance concrete (UHPC) layer. Eng. Struct. 2020, 209, 110031. [Google Scholar] [CrossRef]
  28. Yang, J.; Chen, R.; Zhang, Z.; Zou, Y.; Zhou, J.; Xia, J. Experimental study on the ultimate bearing capacity of damaged RC arches strengthened with ultra-high performance concrete. Eng. Struct. 2023, 279, 115611. [Google Scholar] [CrossRef]
  29. Ahmed, F.B.; Biswas, R.K.; Sen, D.; Tasnim, S. Flexural and Shear Strengthening of Reinforced-Concrete Beams with Ultra-High-Performance Concrete (UHPC). Constr. Mater. 2024, 4, 468–492. [Google Scholar] [CrossRef]
  30. Saeed, F.H.; Hejazi, F. A Comprehensive Review of Retrofitted Reinforced Concrete Members Utilizing Ultra-High-Performance Fiber-Reinforced Concrete. Materials 2025, 18, 945. [Google Scholar] [CrossRef]
  31. Roh, Y.-J.; Kim, H.; Yune, D.-Y.; Eom, T.-S.; Kang, S.-M.; Kim, S.-H. Existing reinforced concrete slab strengthening by reinforced spray mortar and shear connectors. Eng. Struct. 2025, 343, 121030. [Google Scholar] [CrossRef]
  32. Ivanyi, G.; Buschmeyer, W. Reinforcement of prestressed concrete bridges with steel plates—Application criteria. Beton-Und Stahlbetonbau 1992, 87, 265–271. [Google Scholar] [CrossRef]
  33. Bierbrauer, K. Zur Ermittlung der Tragfähigkeit bestehender Brücken aus Stahlbeton: Abschätzung der Bewehrungsmengen. Beton-Und Stahlbetonbau 2005, 100, 13–16. [Google Scholar] [CrossRef]
  34. Schwarz, Y.; Sanio, D.; Mark, P. Calculation model for thermal pre-stressing of subsequentlyadded reinforcement. Beton-Und Stahlbetonbau 2024, 119, 894–907. [Google Scholar] [CrossRef]
  35. Löschmann, J.; Clauß, F.; Mark, P. Strengthening of reinforced concrete structures with temperature induction. Beton-Und Stahlbetonbau 2020, 115, 746–757. [Google Scholar] [CrossRef]
  36. Schwarz, Y.; Sanio, D.; Mark, P. Influence of heat treatment on the bond creep of high-strength concrete. Beton-Und Stahlbetonbau 2024, 119, 253–264. [Google Scholar] [CrossRef]
  37. Hoppe, J.; Schwarz, Y.; Stindt, J.; Forman, P.; Sanio, D.; Mark, P. Prozessbegleitende Ableitung mechanischer Eigenschaften hochfester Betone bei Schnellfertigung. Beton-Und Stahlbetonbau 2024, 119, 798–809. [Google Scholar] [CrossRef]
  38. Stindt, J.; Kempf, L.-A.; Forman, P.; Breitenbücher, R.; Mark, P. DEF of high-performance concrete with rapid, non-standard heat-treatment. Case Stud. Constr. Mater. 2023, 19, e02289. [Google Scholar] [CrossRef]
  39. Stindt, J.; Forman, P.; Mark, P. Influence of Rapid Heat Treatment on the Shrinkage and Strength of High-Performance Concrete. Materials 2021, 14, 4102. [Google Scholar] [CrossRef]
  40. Schwarz, Y.; Ratke, D.; Sanio, D.; Meurer, T.; Mark, P. An Experimental Method to Capture the Thermal Conductivity Coefficient of Fine-Grained. Materials 2024, 17, 2115. [Google Scholar] [CrossRef]
  41. Zdanowicz, K.; Gebauer, D.; Koschemann, M.; Speck, K.; Steinbock, O.; Beckmann, B.; Marx, S. Distributed fiber optic sensors for measuring strains of concrete, steel, and textile reinforcement: Possible fields of application. Struct. Concr. 2022, 23, 3367–3382. [Google Scholar] [CrossRef]
  42. Siwowski, T.; Rajchel, M.; Howiacki, T.; Sieńko, R.; Bednarski, Ł. Distributed fibre optic sensors in FRP composite bridge monitoring: Validation through proof load tests. Eng. Struct. 2021, 246, 113057. [Google Scholar] [CrossRef]
  43. Zhao, L.; Tang, F.; Li, G.; Lin, Z.; Li, H.-N. Crack monitoring of tension members with distributed fiber optic sensor considering substrate strain redistribution and coating/fiber interfacial slip. Eng. Struct. 2024, 300, 117267. [Google Scholar] [CrossRef]
  44. Woods, J.E.; Lau, D.T.; Bao, X.; Li, W. Measuring strain fields in FRP strengthened RC shear walls using a distributed fiber optic sensor. Eng. Struct. 2017, 152, 359–369. [Google Scholar] [CrossRef]
  45. Konertz, D.; Löschmann, J.; Clauß, F.; Mark, P. Faseroptische Messung von Dehnungs- und Temperaturfeldern. Bauingenieur 2019, 94, 292–300. [Google Scholar] [CrossRef]
  46. Schwarz, Y.; Ratke, D.; Sanio, D.; Meurer, T.; Mark, P. Thermal prestressing of subsequently slotted reinforcement—Experimental and numerical development and optimization of an induction method. Struct. Concr. 2025, 1–16. [Google Scholar] [CrossRef]
  47. Clauß, F.; Löschmann, J.; Ahrens, M.A.; Mark, P. Temperature induction into RC structures. Beton- Und Stahlbetonbau 2021, 116, 539–550. [Google Scholar] [CrossRef]
  48. Clauß, F.; Ahrens, M.A.; Mark, P. Thermo-mechanical experiments on reinforced concrete beams: Assessing thermal, mechanical, and mixed impacts on fiber optic measurements. Struct. Concr. 2022, 23, 3521–3537. [Google Scholar] [CrossRef]
  49. Deutscher Ausschuss für Stahlbeton. Verstärken von Betonbauteilen, 467th ed.; Beuth Verlag GmbH: Berlin, Germany, 1996; ISBN 978-3-410-65245-8. [Google Scholar]
  50. Sanio, D.; Mark, P.; Ahrens, M.A. Computation of temperature fields on bridges. Implementation by means of spread sheets. Beton- Und Stahlbetonbau 2017, 112, 85–95. [Google Scholar] [CrossRef]
  51. Zichner, T. Temperaturunterschied Infolge Witterungseinfluß und Beheizung von Massiven Brücken; Forschung Straßenbau und Straßenverkehrstechnik Heft 212: Bonn, Germany, 1976. [Google Scholar]
  52. Sanio, D.; Ahrens, M.A.; Mark, P. Lifetime predictions of prestressed concrete bridges—Evaluating parameters of relevance using Sobol’ indices. Civ. Eng. Des. 2022, 4, 143–153. [Google Scholar] [CrossRef]
  53. Richter, B.; Herbers, M.; Marx, S. Crack monitoring on concrete structures with distributed fiber optic sensors—Toward automated data evaluation and assessment. Struct. Concr. 2024, 25, 1465–1480. [Google Scholar] [CrossRef]
Figure 1. Principle of subsequent strengthening with slotted and thermally prestressed additional reinforcing bars on the example of a concrete slab ((a), created with generative AI) with section (b) and a balcony slab ((c), created with generative AI).
Civileng 06 00049 g001
Figure 2. Test setup (longitudinal section at top, cross-sections at bottom) with dimensions and measuring devices for the reference tests (no. 1, 3) and the thermally prestressed beam (no. 2).
Civileng 06 00049 g002
Figure 3. Test procedure comprising pre-loading (a), strengthening, heating (b), and cooling (c) of the beam with subsequent loading until failure (d), along with the loads, cross-sections, and photos associated with each step.
Civileng 06 00049 g003
Figure 4. Strain distribution along the initial reinforcement of beam no. 2 at the time of strengthening ( t a ), quasi-continuously recorded with DFOS and locally with SGs.
Civileng 06 00049 g004
Figure 5. Temperature (left) and strain (right) development in the added bar.
Civileng 06 00049 g005
Figure 6. Strain along the added thermally prestressed bar after cooling at tc.
Civileng 06 00049 g006
Figure 7. Numerical temperature distribution of the cross-section (left), associated strain distributions and prestress effective thermal strains (right) at t = t a = [2, 3, 5] h.
Civileng 06 00049 g007
Figure 8. Load deflection diagrams of the thermally prestressed and reference beams (a) and a photo during testing (b).
Civileng 06 00049 g008
Figure 9. Development of strains in the thermally prestressed bar and the reinforcing bars of all beams over the load.
Civileng 06 00049 g009
Figure 10. Strains and crack widths in the tensile zone before and after strengthening determined from DFOS (top) and crack mapping (bottom).
Civileng 06 00049 g010
Figure 11. Comparison of crack patterns at maximum load. Thermally prestressed beam (center) versus the reference beams (left, right).
Civileng 06 00049 g011
Figure 12. Comparison of measured and computed (dotted lines) mechanical strain in the reinforcement with (beam no. 2) and without (beam no. 3) prestress (solid lines).
Civileng 06 00049 g012
Table 1. Experimental campaign and key performance indicators.
SpecimenReinforcementKey Performance Indicators
Initial A s 0 Additional A s Max. DeflectionMax. Load CapacityCrack Development
(1) “Reference”Civileng 06 00049 i001-umax(1) > umax(2) ≤ umax(3)Fmax(1) < Fmax(2) ≥ Fmax(3)w(1) > w(2) ≤ w(3)
(2) “Thermally Prestressed”Civileng 06 00049 i002Civileng 06 00049 i003
(3) “Reference”Civileng 06 00049 i004-
Table 2. Concrete compositions for normal concrete (initial cross-section) and HPC (slot).
KomponenteNormal Concrete C30/37HPC Based on Nanodur-Compound 5941
TypeMass [kg/m3]TypeMass [kg/m3]
Sand0/2711.00/2426.0
Basalt--1/3882.0
Gravel2/8356.0--
Gravel8/16711.0--
Cement/BinderCEM 1 42.5 R340.0Nanodur Compound 5941 (Dyckerhoff)1042.0
Water-204.0-159.8
Superplasticizer--Master Glenium ACE 430
(Master Builders solutions, Mannheim, Germany)
12.3
Shrinkage Reducer--Eclipse Floor (gcp)8.0
Hardening Accelerator--Master X-Seed 100
(Master Builders solutions)
12.3
Table 3. Position and width of cracks determined from DFOS and crack mapping before and after thermal prestressing.
Crack No.Unreinforced at F g + F Δ g Thermally Prestressed at F g + F Δ g
DFOS/Crack MappingDFOS/Crack Mapping
Crack Width w [mm]Crack Position x o [m]Crack Width w [mm]Crack Position x o [m]
10.14/0.11.39/1.370.07/0.11.39/1.37
20.16/0.21.52/1.51-/0.1-/1.51
30.22/0.22.12/2.14-/0.1-/2.14
40.26/0.32.34/2.330.21/0.22.34/2.33
50.23/0.22.51/2.50-/0.1-/2.50
60.24/0.22.52/2.49-/0.1-/2.51
70.25/0.22.78/2.780.23/0.22.78/2.78
Table 4. Impact of thermal prestress.
Thermally PrestressedReference (1)Reference (3)
Maximum Load F m a x [kN]51.234.551.7
Deflection at F m a x [mm]60.260.071.5
Mean Crack Width at g + F Δ g [mm] t b t c
0.220.12-0.18
Disclaimer/Publisher’s Note: The statements, opinions and data contained in all publications are solely those of the individual author(s) and contributor(s) and not of MDPI and/or the editor(s). MDPI and/or the editor(s) disclaim responsibility for any injury to people or property resulting from any ideas, methods, instructions or products referred to in the content.