Article

Plasticity, Flow Liquefaction, and Cyclic Mobility in Liquefiable Soils with Low to Moderate Plasticity

by
Carmine P. Polito
1,* and
James R. Martin
2
1
Department of Civil and Environmental Engineering, Valparaiso University, Valparaiso, IN 46383, USA
2
North Carolina Agricultural and Technical State University, Greensboro, NC 27411, USA
*
Author to whom correspondence should be addressed.
CivilEng 2025, 6(2), 31; https://doi.org/10.3390/civileng6020031
Submission received: 22 March 2025 / Revised: 31 May 2025 / Accepted: 11 June 2025 / Published: 12 June 2025

Abstract

Over the past several decades, extensive research has advanced the understanding of liquefaction in clean sands and sand–silt mixtures under seismic loading. However, the influence of plastic (i.e., clayey) fines on the liquefaction behavior of sandy soils remains less well understood. This study investigates how the quantity and plasticity of fines affect both the susceptibility to liquefaction and the resulting failure mode. A series of stress-controlled cyclic triaxial tests were conducted on sand specimens containing varying proportions of non-plastic silt, kaolinite, and bentonite. Specimens were prepared at a constant relative density with fines content ranging from 0% to 37%. Two liquefaction modes were examined: flow liquefaction, characterized by sudden and large strains under undrained conditions, and cyclic mobility, which involves gradual strain accumulation without complete strength loss. The results revealed a clear relationship between soil plasticity and liquefaction mode. Specimens containing non-plastic fines or fines with a liquid limit (LL) below 20% and a plasticity index (PI) of 0 exhibited flow liquefaction. In contrast, specimens with LL > 20% and PI ≥ 7% consistently displayed cyclic mobility behavior. These findings help reconcile the apparent contradiction between laboratory studies, which often show increased liquefaction susceptibility with plastic fines, and field observations, where clayey soils frequently appear non-liquefiable. The study emphasizes the critical role of plasticity in determining liquefaction type, providing essential insight for seismic risk assessments and design practices involving fine-containing sandy soils.

Graphical Abstract

1. Introduction

Over the past six decades, significant advances have been made in understanding the liquefaction behavior of clean sands subjected to seismic loading. A robust framework now exists to describe the mechanisms of liquefaction and the key parameters governing this phenomenon in sands [1,2,3,4,5]. More recently, over the last 30 years, research has extended this understanding to include sand–silt mixtures and soils with non-plastic fines, further refining our knowledge of liquefaction susceptibility in various soil types [6,7,8,9,10]. However, the behavior of sands containing plastic fine-grained materials, such as clays, remains relatively less well understood.
A particular point of ambiguity lies in how plasticity influences the mode of liquefaction that a soil may undergo during cyclic loading. This confusion can lead to misinterpretation of laboratory test results and can appear to suggest that plasticity-based liquefaction screening methods may be invalid. While many laboratory studies suggest that the addition of plastic fines increases a soil’s susceptibility to liquefaction, plasticity-based liquefaction criteria frequently classify these same soils as “non-liquefiable”. This apparent contradiction underscores the need for further investigation into how plasticity influences not just the occurrence, but the mode of liquefaction—namely, flow liquefaction versus cyclic mobility.
This paper presents the results of a laboratory-based parametric study aimed at addressing this gap. Stress-controlled cyclic triaxial tests were conducted on sand specimens containing varying amounts and types of fines—including non-plastic silt, kaolinite, and bentonite. The fines content ranged from 0% to 37%, and all specimens were prepared at a constant relative density. Two liquefaction modes were examined: (1) flow liquefaction, associated with large, sudden deformations and effective stress approaching zero, and (2) cyclic mobility, characterized by gradual strain accumulation without complete loss of strength.
The study revealed that the liquefaction mode is closely tied to the plasticity of the soil. Specimens with low plasticity (liquid limit < 20%, plasticity index = 0) exhibited flow liquefaction, while those with higher plasticity (liquid limit > 20%, plasticity index ≥ 7%) predominantly exhibited cyclic mobility. These findings help to reconcile the divergent results often observed between laboratory tests and post-earthquake field investigations. Whereas laboratory results often suggest increased liquefaction susceptibility with plastic fines, field observations frequently indicate limited or no liquefaction in clay-rich soils.
By clarifying the influence of plasticity on liquefaction behavior, this study contributes valuable insight into the conditions under which different liquefaction modes occur. This has direct implications for seismic hazard assessment, as flow liquefaction can cause severe and sudden ground failure, whereas cyclic mobility tends to result in limited deformation and lower risk to infrastructure and life. The following sections provide a review of relevant background literature, describe the experimental methodology, present the test results, and conclude with a discussion of the findings and their practical implications.

1.1. Background

Following a review of findings on the effect of soil plasticity on liquefaction resistance from the literature, further explanation of flow liquefaction and cyclic mobility will be provided. This section will conclude with a discussion of plasticity-based liquefaction susceptibility criteria.

1.1.1. Previous Studies on the Effect of Soil Plasticity on Liquefaction Resistance

Liquefaction is a process where saturated soil loses its strength and stiffness due to applied stress, typically from earthquake shaking or rapid loading, causing it to behave like a fluid. While liquefaction is commonly associated with clean sands, natural soils often contain varying amounts of fines including clay particles. The presence of clay changes the mechanical and hydraulic behavior of sandy soils, influencing their susceptibility to liquefaction. Numerous studies have explored how the addition of fine-grained, plastic soils affects the liquefaction resistance of sand, and this section summarizes that research.
The effect of fines, particularly clay, on liquefaction potential is complex. Depending on the type and amount of clay, the presence of fines can either increase or decrease liquefaction susceptibility. Some researchers have attempted to define threshold fines content that marks a shift in the soil’s behavior from clean sand. The Chinese criteria, for instance, classify soils with less than 5% fines as clean sands, 5–35% as silty sands, and more than 35% as non-liquefiable [11]. However, studies have shown that not all fines have the same impact; clay fines, due to their plasticity and structure, behave differently from silt fines.
The fines content (FC) alone does not fully characterize liquefaction behavior; the type of fines is equally important. For instance, Bray and Sancio [12] found that soils containing clay fines (with a plasticity index, PI > 7) significantly reduce the liquefaction potential of sand compared to non-plastic silt fines. They proposed that plasticity, rather than just the quantity of fines, must be considered when assessing liquefaction potential.
Clay particles, due to their small size, large surface area, and cohesive properties, affect the soil’s shear strength and pore pressure buildup. Plastic clay fines (e.g., kaolinite, illite, montmorillonite) can enhance the soil’s resistance to cyclic loading, thereby improving liquefaction resistance. A study by Polito and Martin [13] found that sands with low-plasticity clay fines (PI < 10) had reduced liquefaction resistance, whereas those with moderate plasticity fines (PI ≈ 10–20) showed increased resistance. This was attributed to improved interparticle bonding and reduced compressibility, which hindered pore pressure generation during cyclic loading. However, highly plastic clays may decrease permeability, potentially aggravating undrained conditions.
Liquefaction is driven by the generation of excess pore water pressure under cyclic loading, and the presence of clay affects both the generation and dissipation of this pressure. Clay particles reduce the soil’s permeability, slowing the dissipation of pore water pressure, which can prolong the duration of liquefied states. Ishihara [14] emphasized that in sand–clay mixtures, pore pressure buildup is more gradual, and the number of loading cycles required for liquefaction increases as clay content rises. However, this could lead to prolonged instability during rapid loading events like earthquakes, as trapped pore water pressure reduces effective stress for extended periods.
Research on the effect of plastic fines on liquefaction resistance has yielded mixed results. Some studies have found that the addition of plastic fines reduces liquefaction resistance, while others suggest that the addition of plastic fines increases liquefaction resistance. Still, others have reported that adding plastic fines to a sandy soil initially reduces resistance up to a certain threshold, beyond which resistance begins to increase.
Goudarzy et al. [15] observed that adding plastic fines, like kaolin and bentonite, to Hostun sand reduced the peak strength and increased contractive behavior, leading to lower liquefaction resistance. Similarly, Akhila et al. [16] found that while non-plastic fines reduce liquefaction resistance, low-plasticity clay fines could also decrease resistance, depending on their proportion and plasticity. Other studies have reported similar findings, particularly for fines of low plasticity [13,17,18,19,20,21,22,23].
On the other hand, some research has found that plastic fines increase liquefaction resistance. Jradi and Boukhatem [24] showed that adding plastic fines like illite to Fontainebleau sand increased the undrained shear strength, improving resistance to liquefaction. Similarly, Qi et al. [25] and Ganiyu and Kennedy [26] found that higher plastic fines content could reduce pore pressure buildup, thus enhancing liquefaction resistance.
Another set of studies suggests a more nuanced behavior: plastic fines initially decrease resistance to liquefaction but then increase resistance beyond a certain fines content threshold. Belkhatir et al. [27] found that increasing fines content initially decreased liquefaction resistance, but once a certain threshold was crossed, further addition of fines increased resistance due to changes in the soil’s fabric. Bouferra and Shahrour [28] observed that low amounts of plastic fines decreased liquefaction resistance, but higher contents improved it due to increased cohesion. Similar trends were reported by Thevanayagam et al. [29], Rao et al. [30], and Goudarzy et al. [31].
Cyclic triaxial tests have shown a general trend: as clay content increases, the cyclic resistance ratio (CRR)—which measures a soil’s ability to resist liquefaction under cyclic loading—also tends to increase, particularly when the clay is plastic. Vaid and Sivathayalan [32] found that sands with 10–30% plastic fines exhibited enhanced cyclic resistance compared to clean sands, but non-plastic fines did not have the same effect.
There is also a concept of a “threshold fines content”, at which the soil shifts from a sand-dominated to a fines-dominated matrix. According to Thevanayagam et al. [29], this transition typically occurs when fines content exceeds 20–30%, though this depends on the fines’ plasticity and their interaction with the sand particles.
The microstructure of sand–clay mixtures plays a key role in how they respond to cyclic loading. At low clay contents, clay particles fill the voids between sand grains, improving packing and interlocking, which can enhance liquefaction resistance. However, as clay content increases, the clay may dominate the fabric, altering the soil’s deformation behavior. Scanning electron microscope (SEM) images from studies like Yang et al. illustrate how increasing clay content leads to a more dispersed fabric, which can decrease strength and increase void ratios, counteracting the benefits seen at lower clay contents [33].
Natural soils also undergo aging and secondary cementation, which can increase their strength over time [34]. Clay promotes these processes through physicochemical bonding, and aging effects in clayey sands can significantly enhance liquefaction resistance, making field liquefaction resistance higher than what laboratory tests suggest.
Field observations support these laboratory findings. For example, during the 1999 Kocaeli earthquake in Turkey, sites with sandy soils containing more than 15% clay (with a moderate PI) did not exhibit liquefaction, even under strong ground motion [12]. Similarly, during the 2011 Tōhoku earthquake in Japan, clayey sands outperformed clean sands under comparable seismic conditions [35].

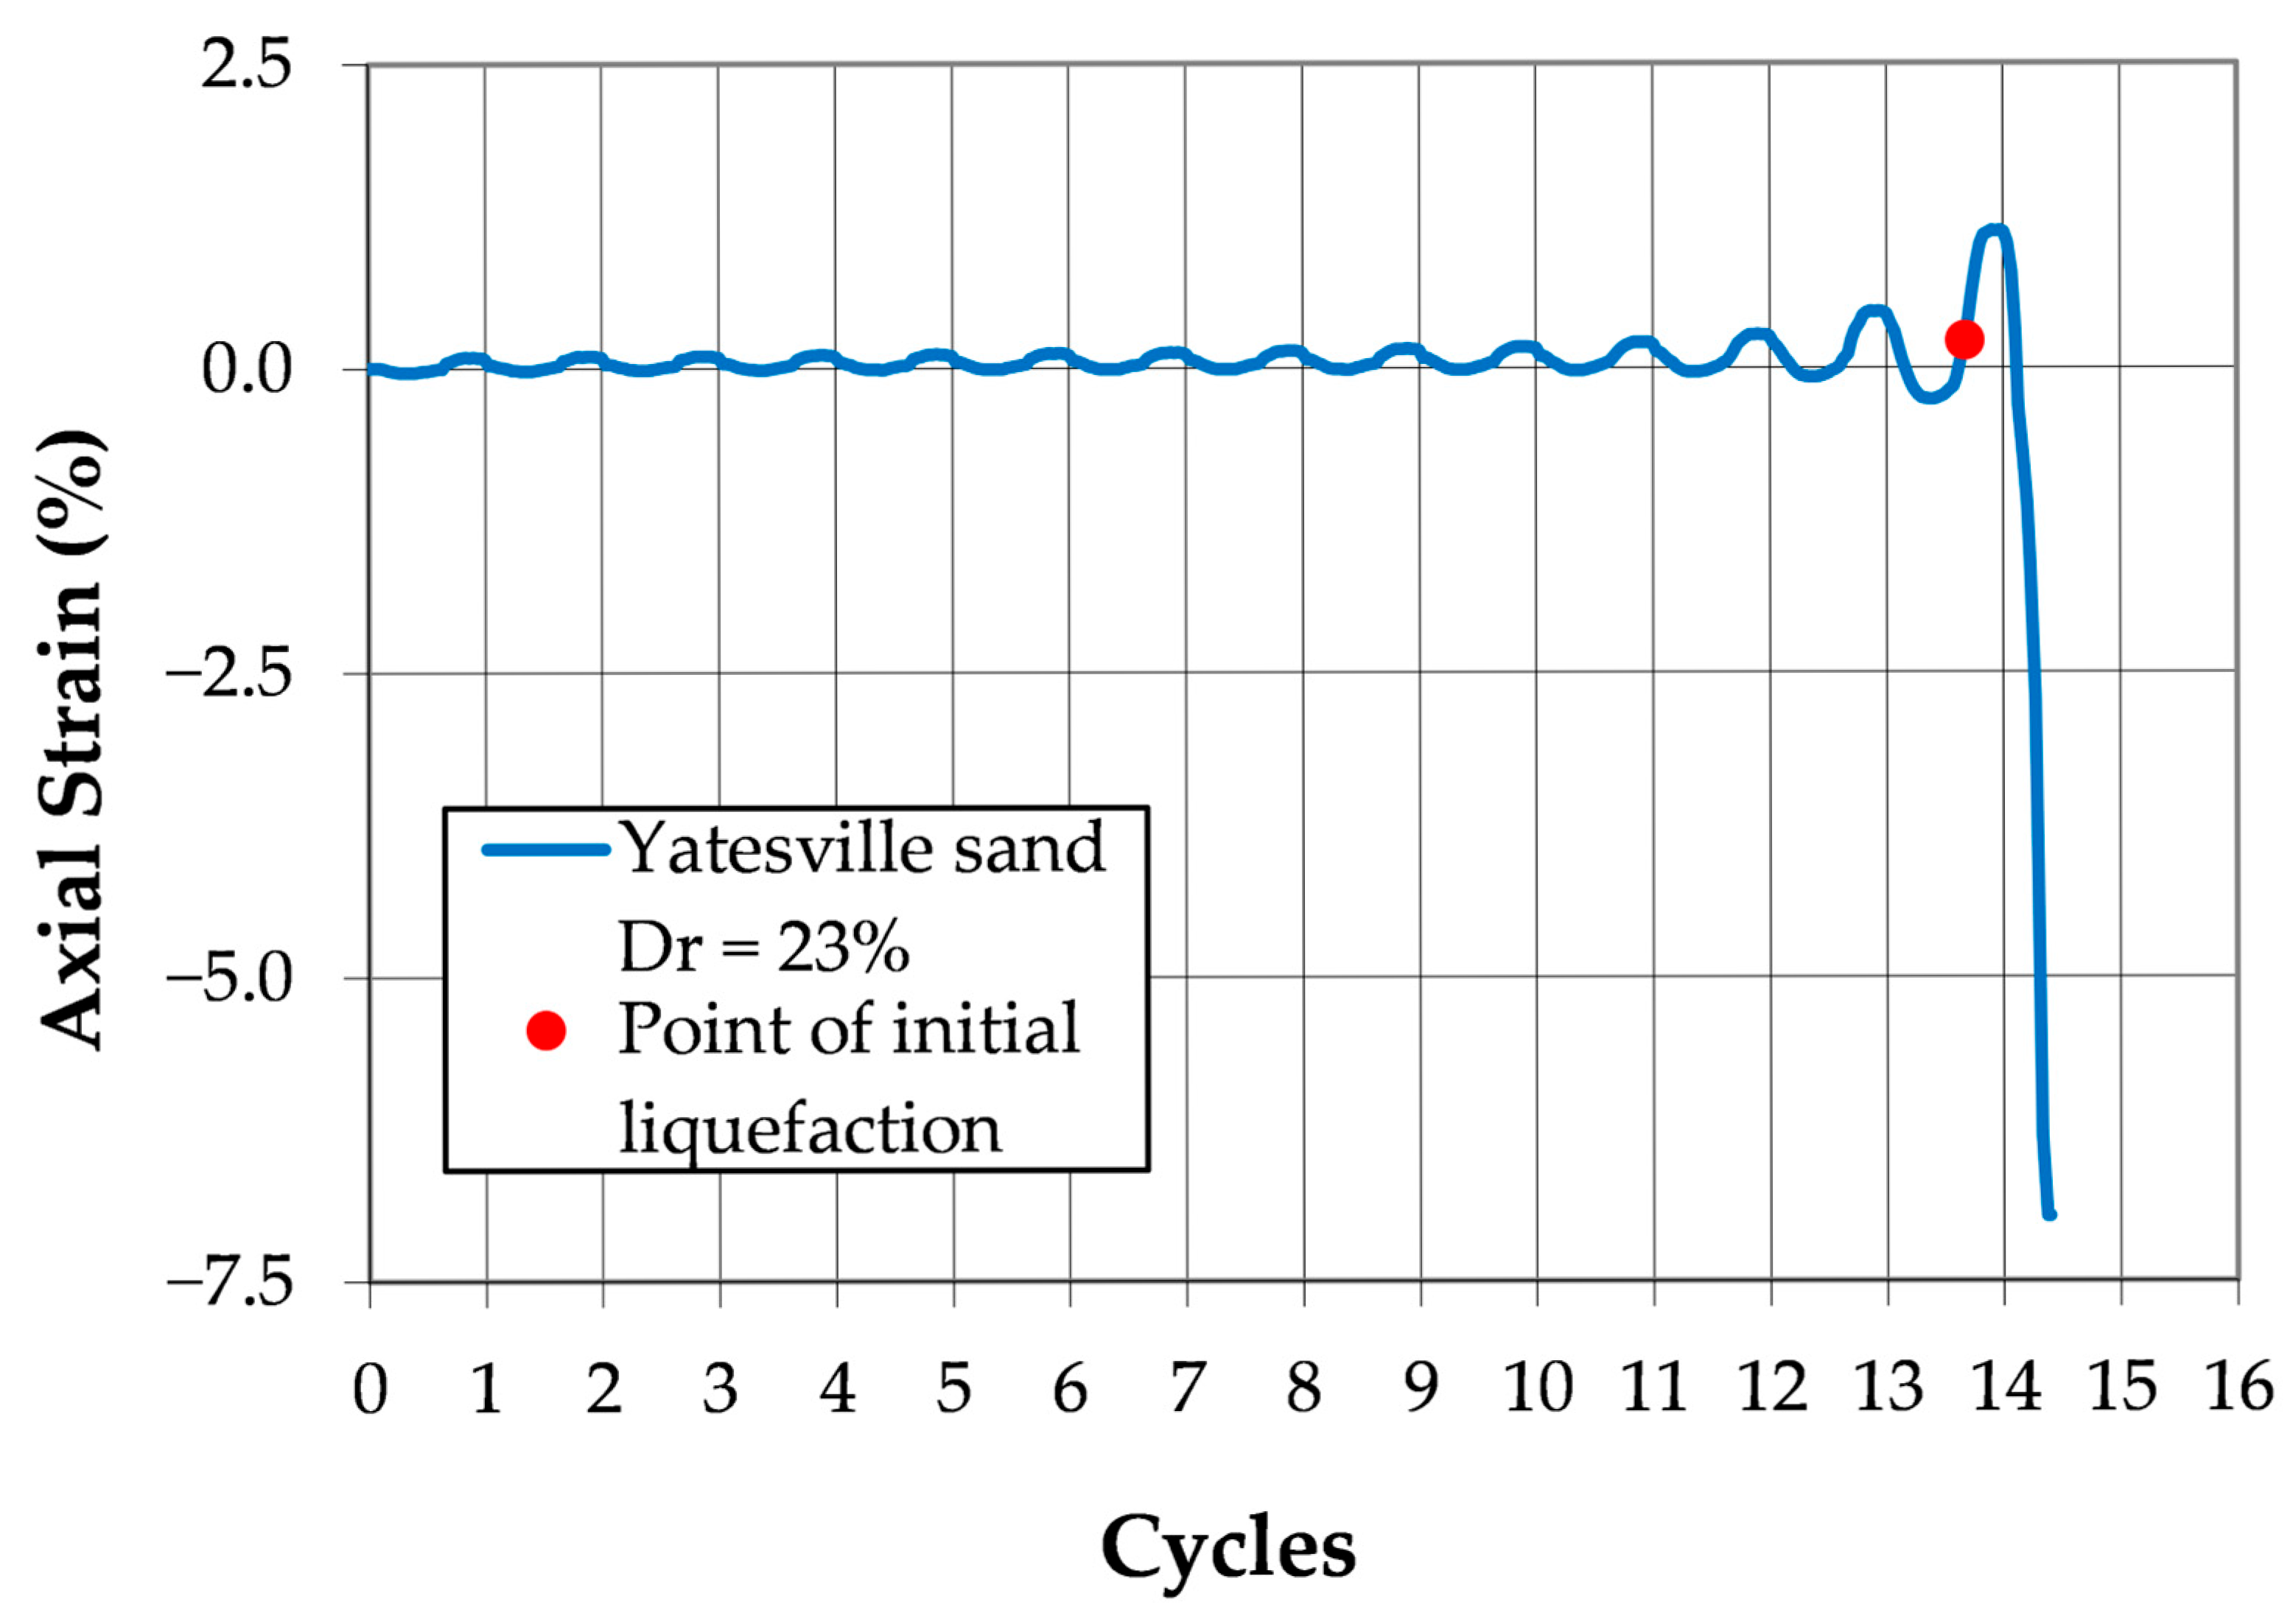
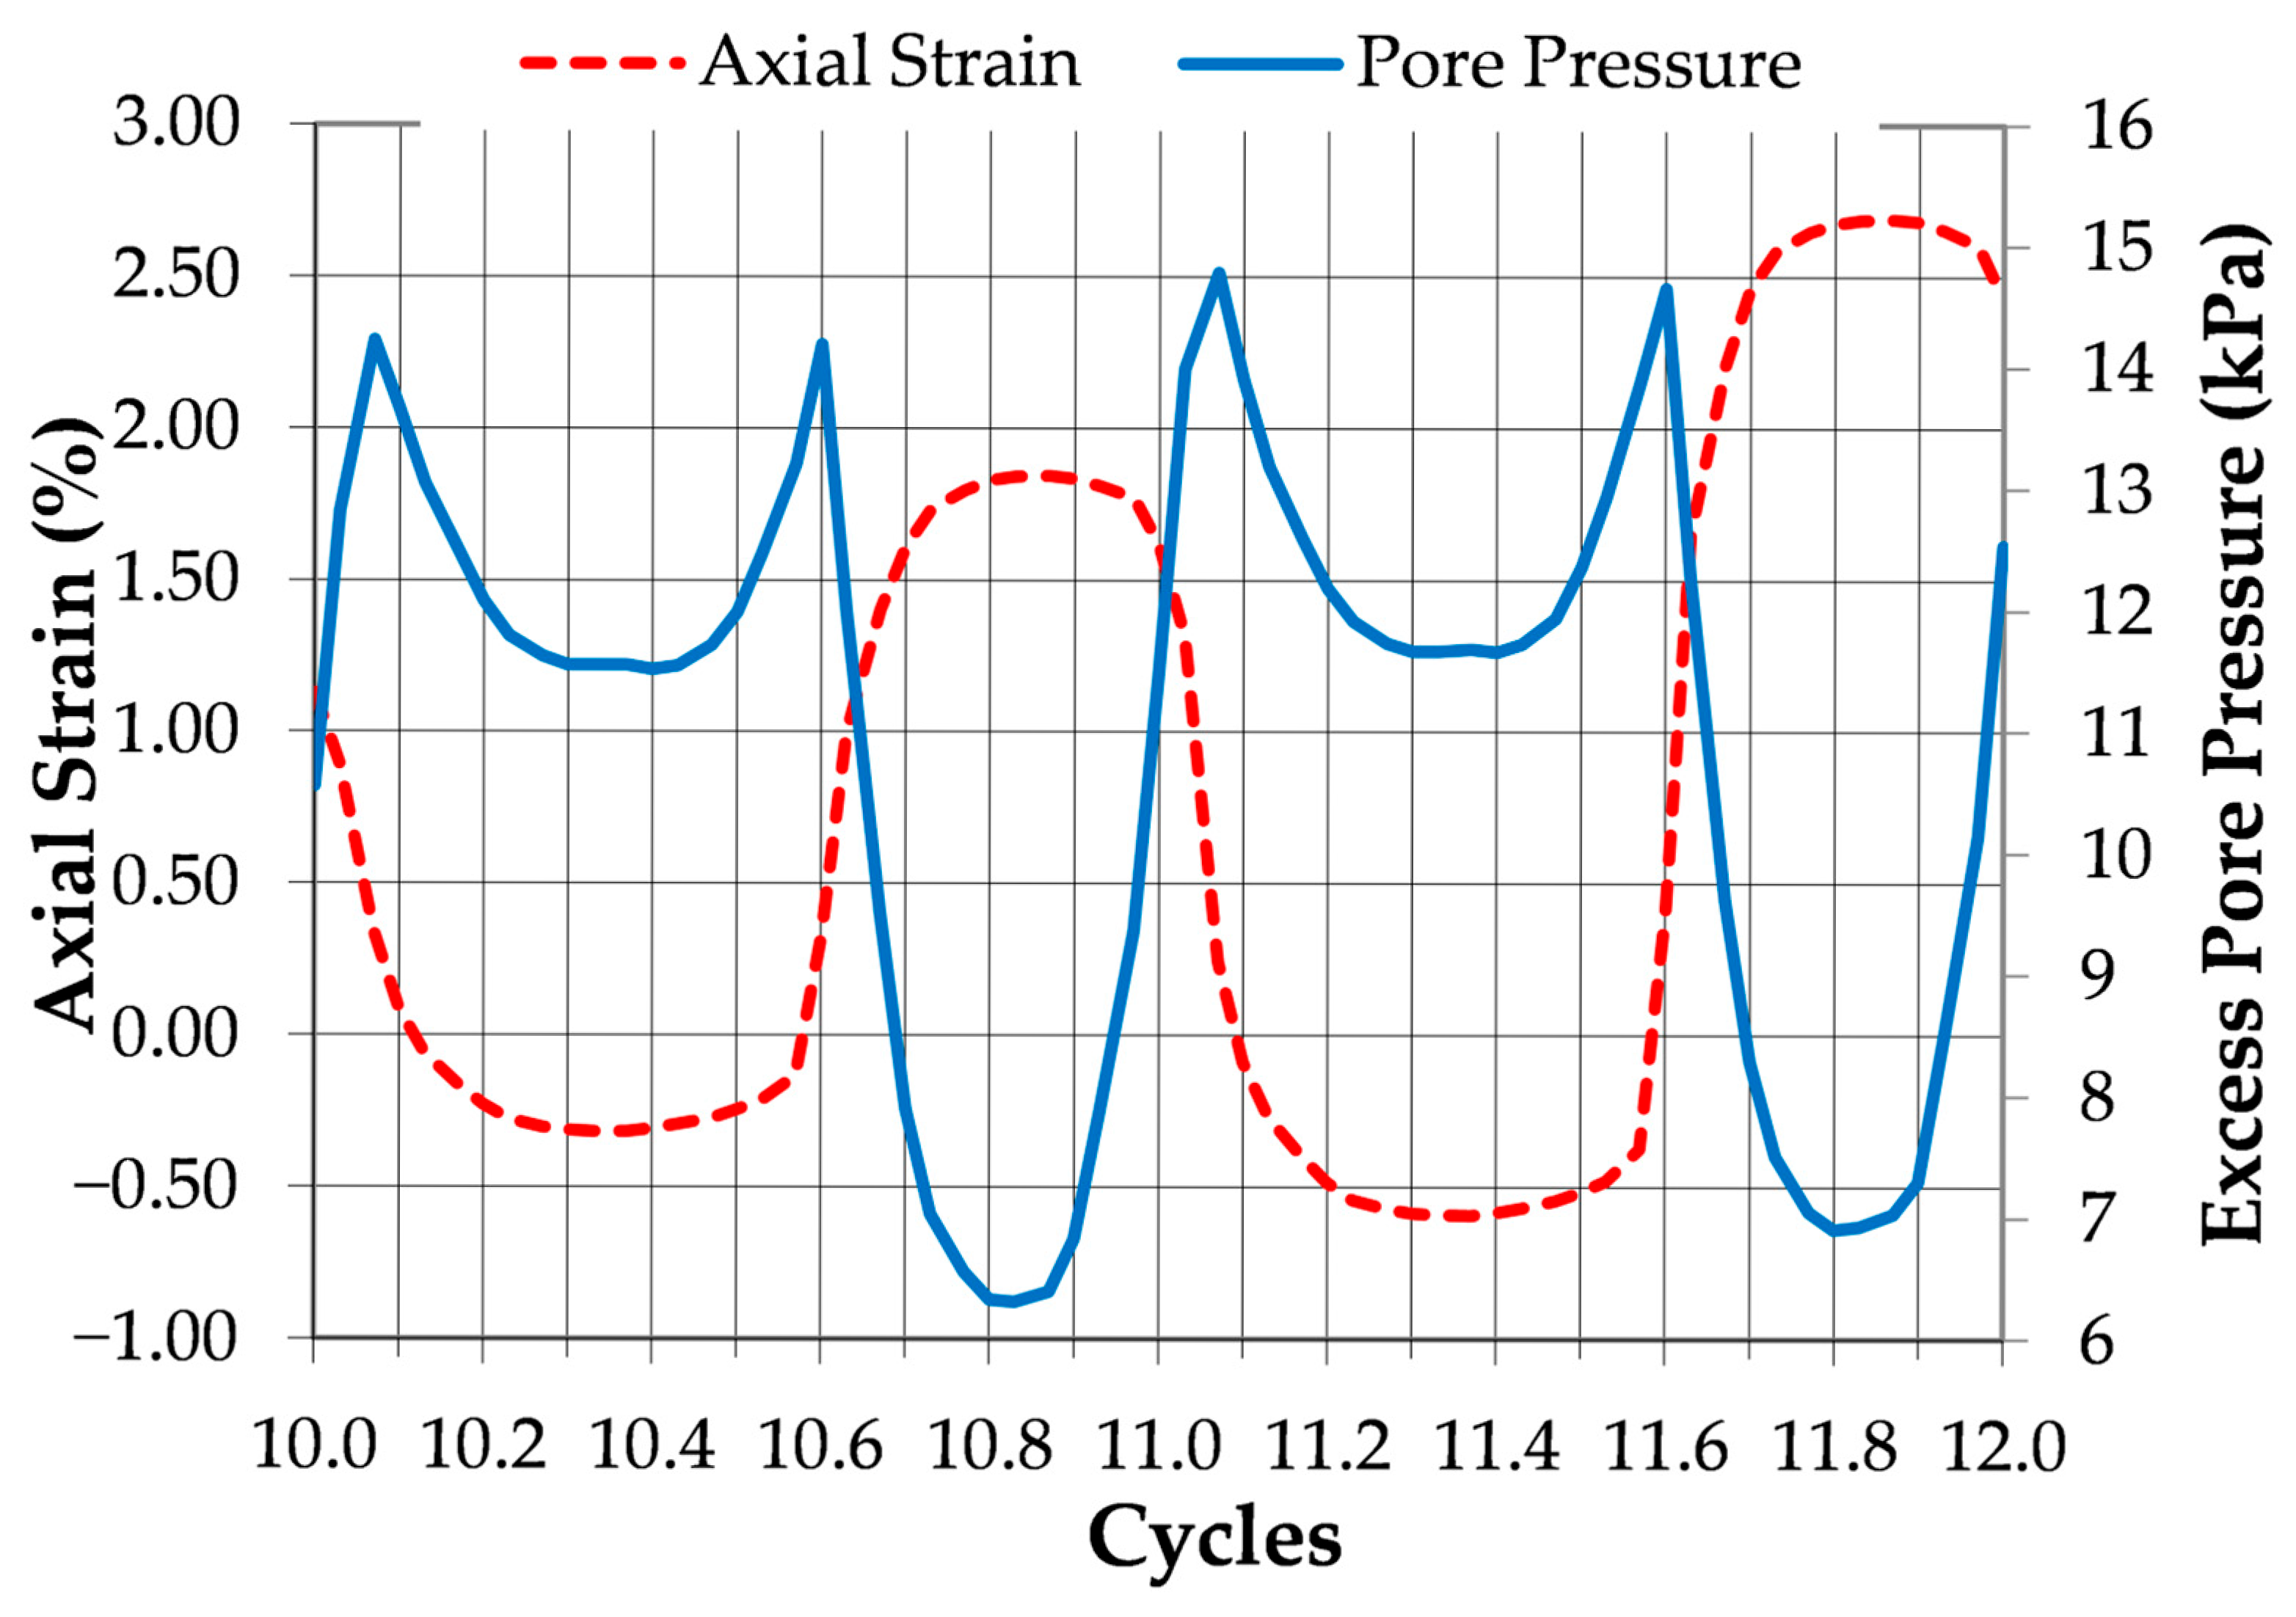
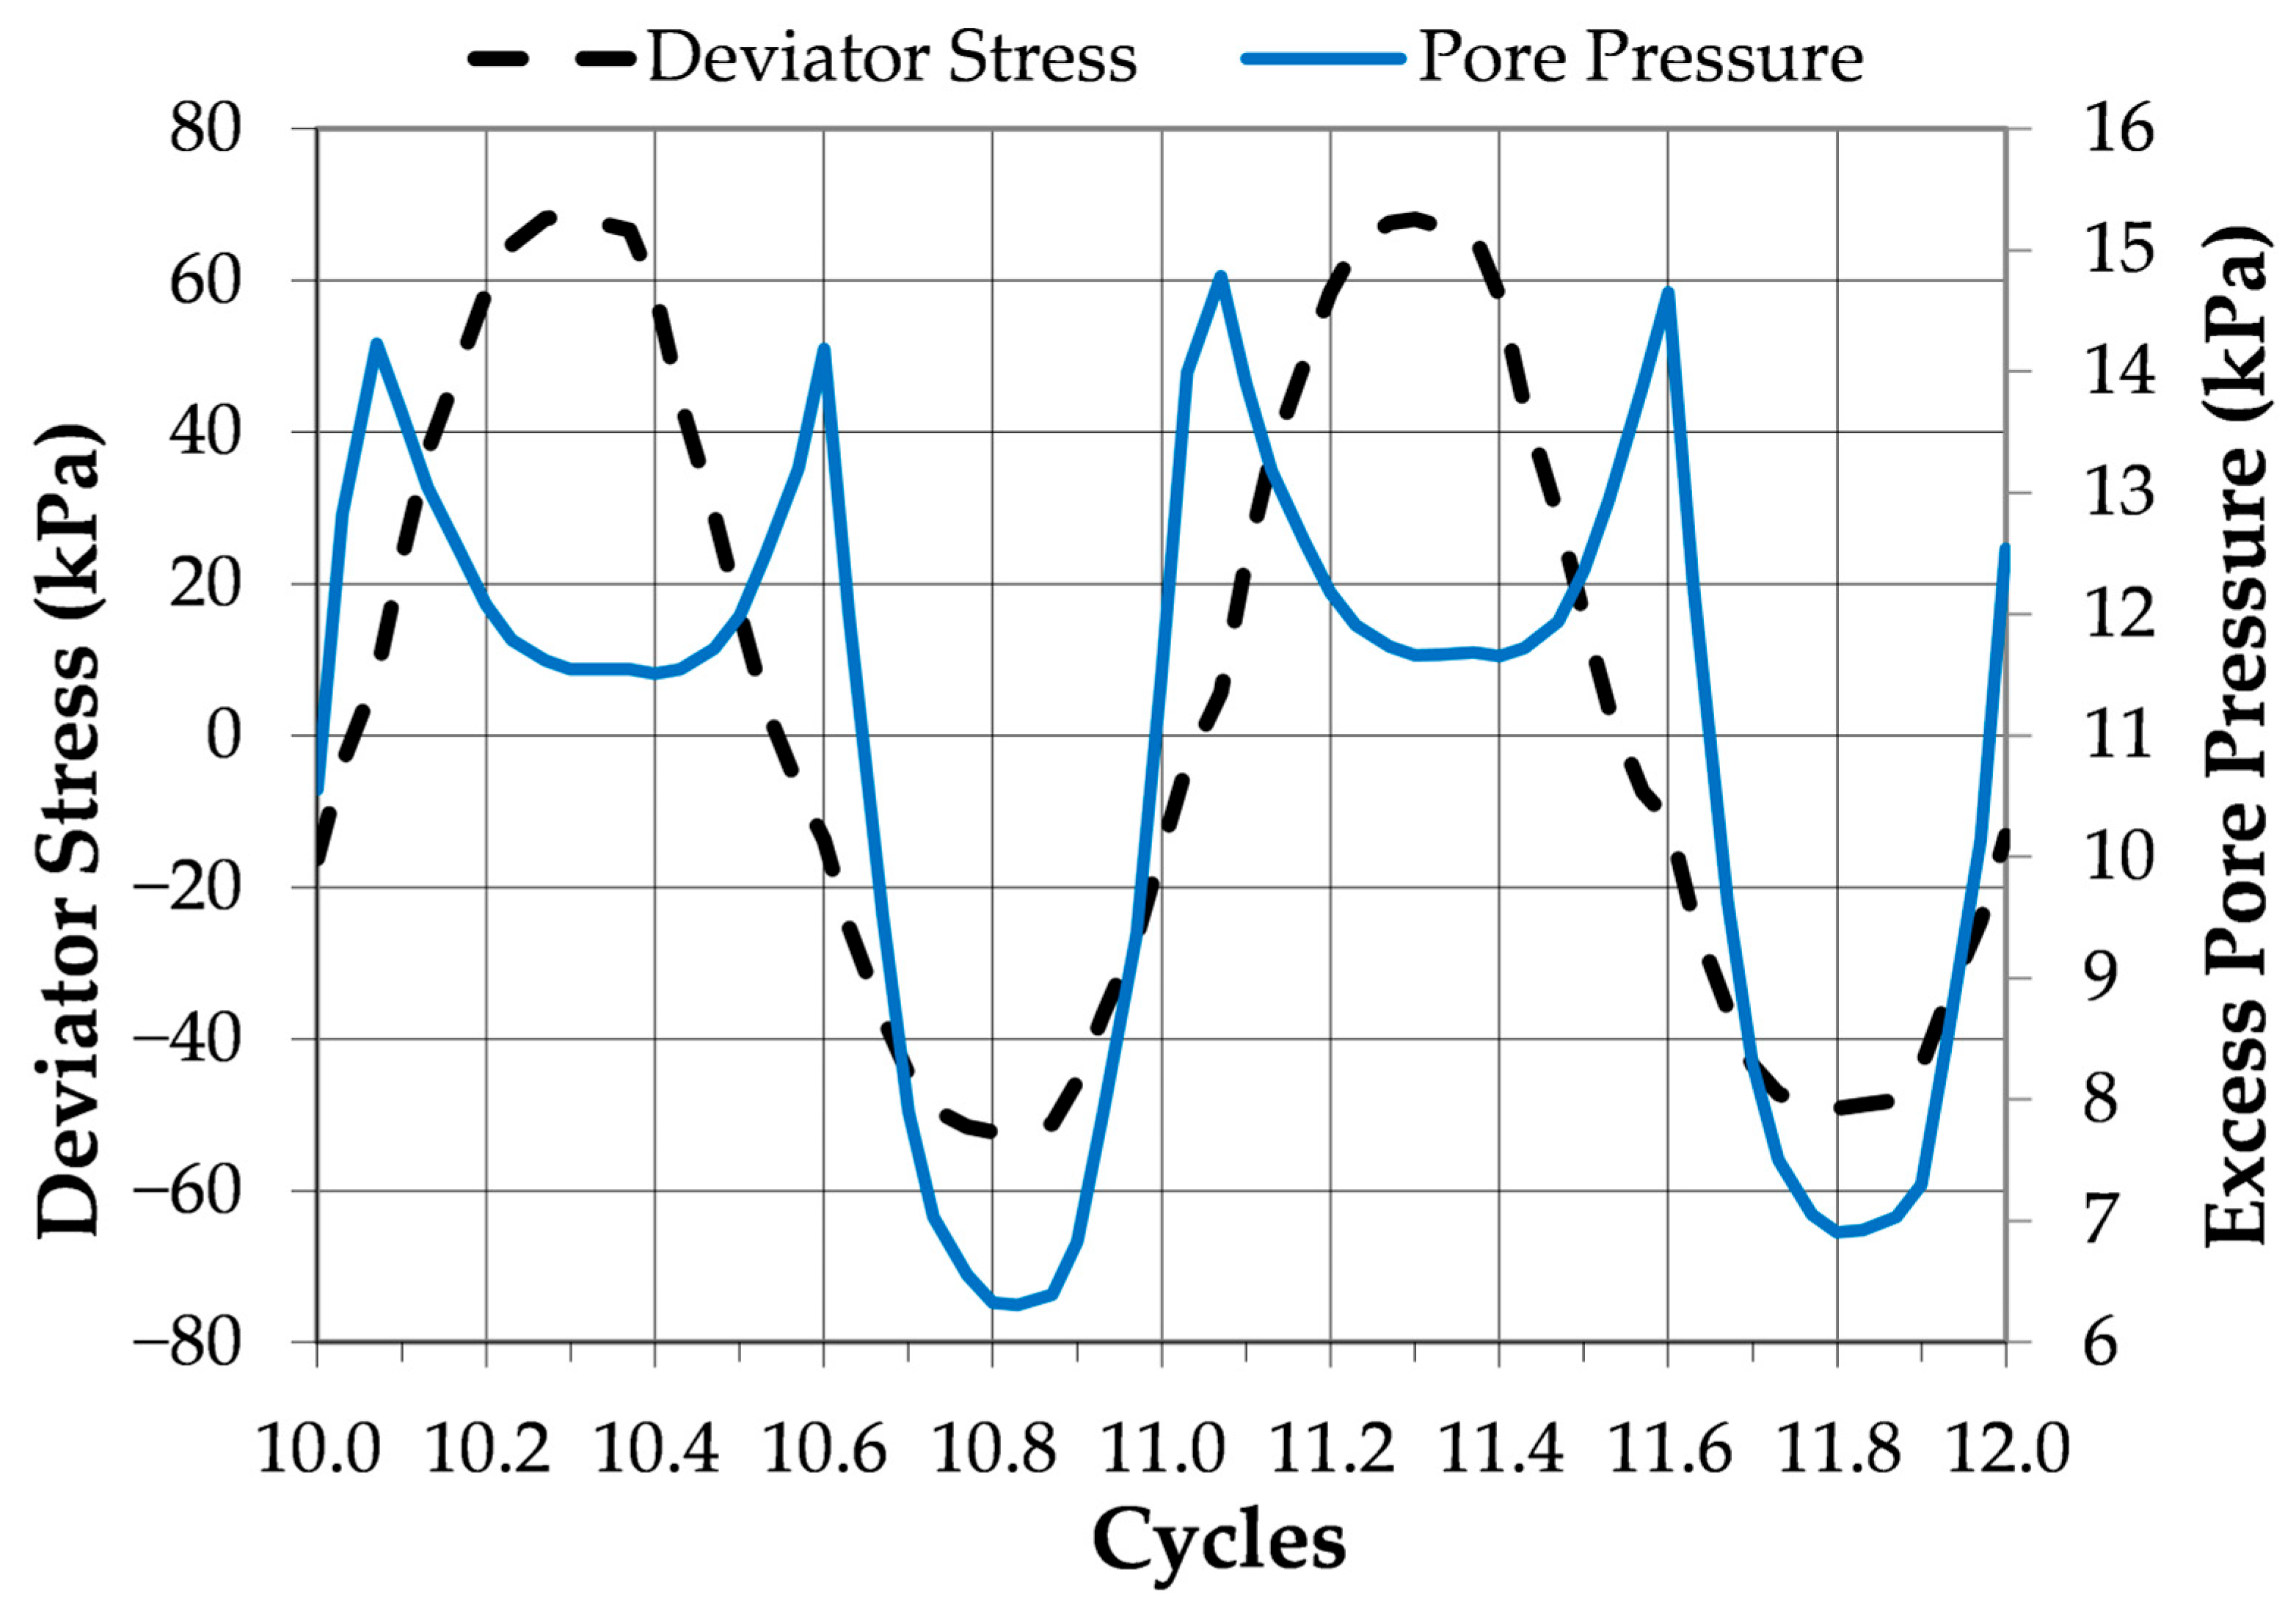
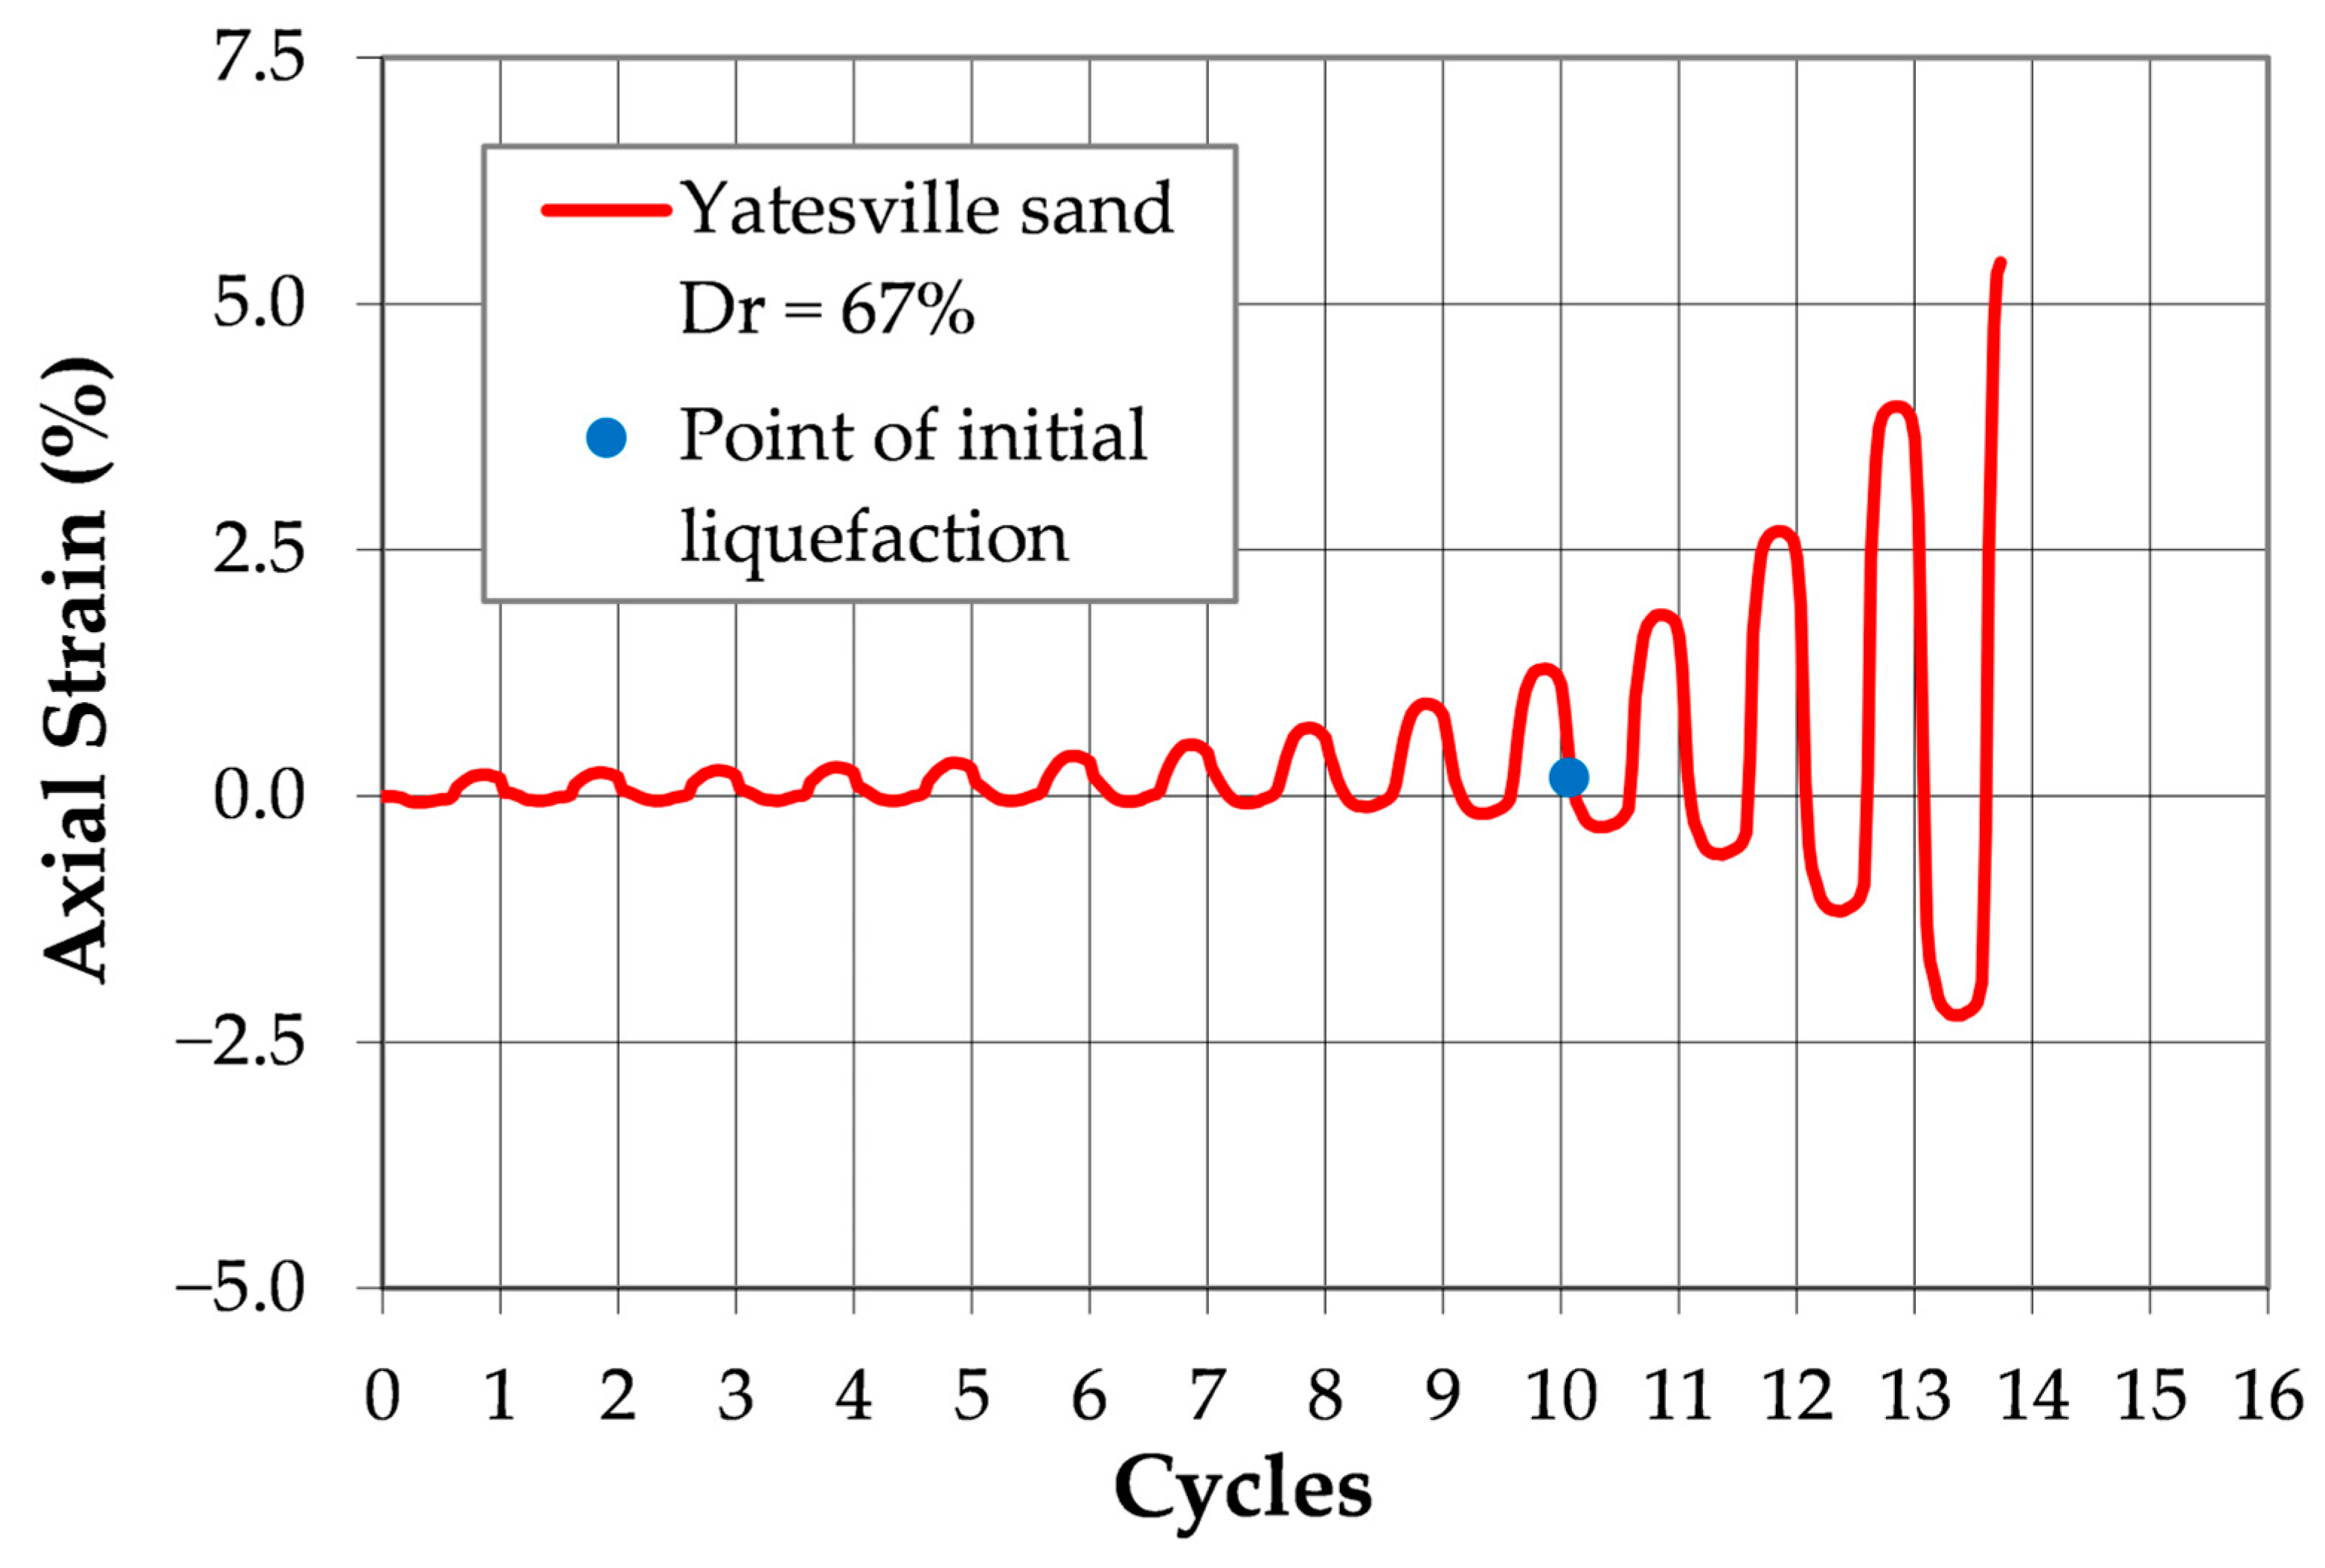
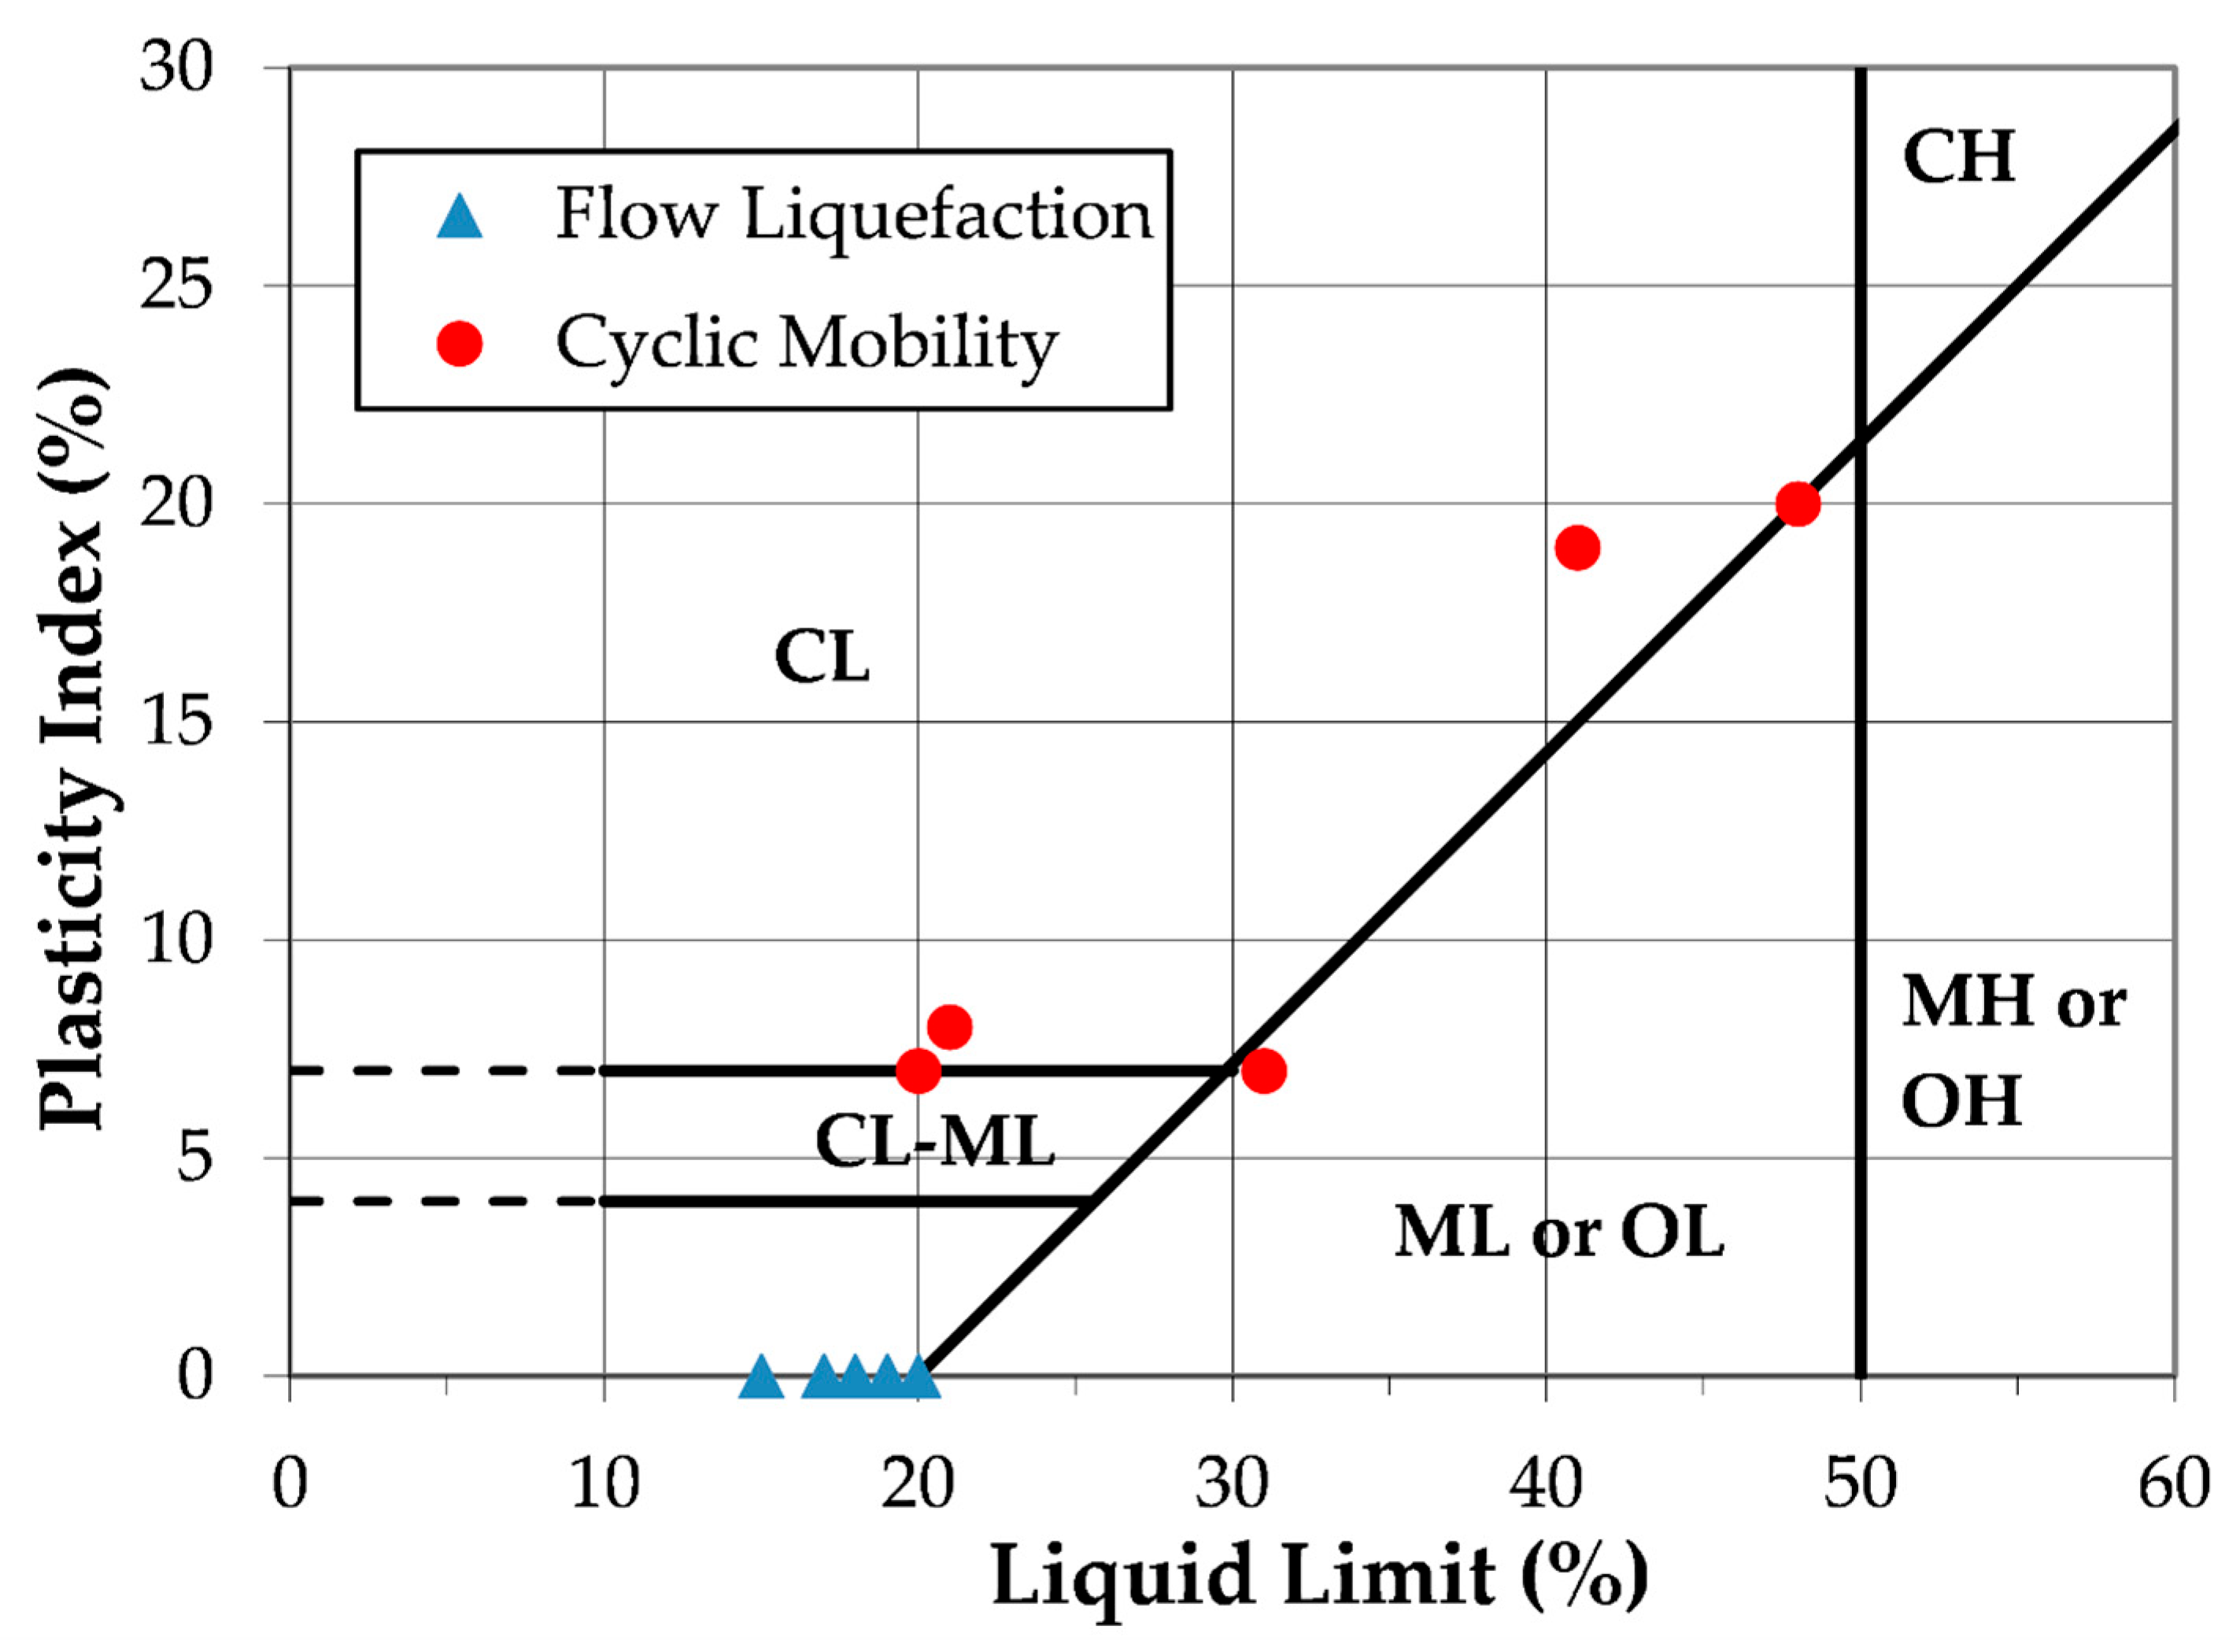
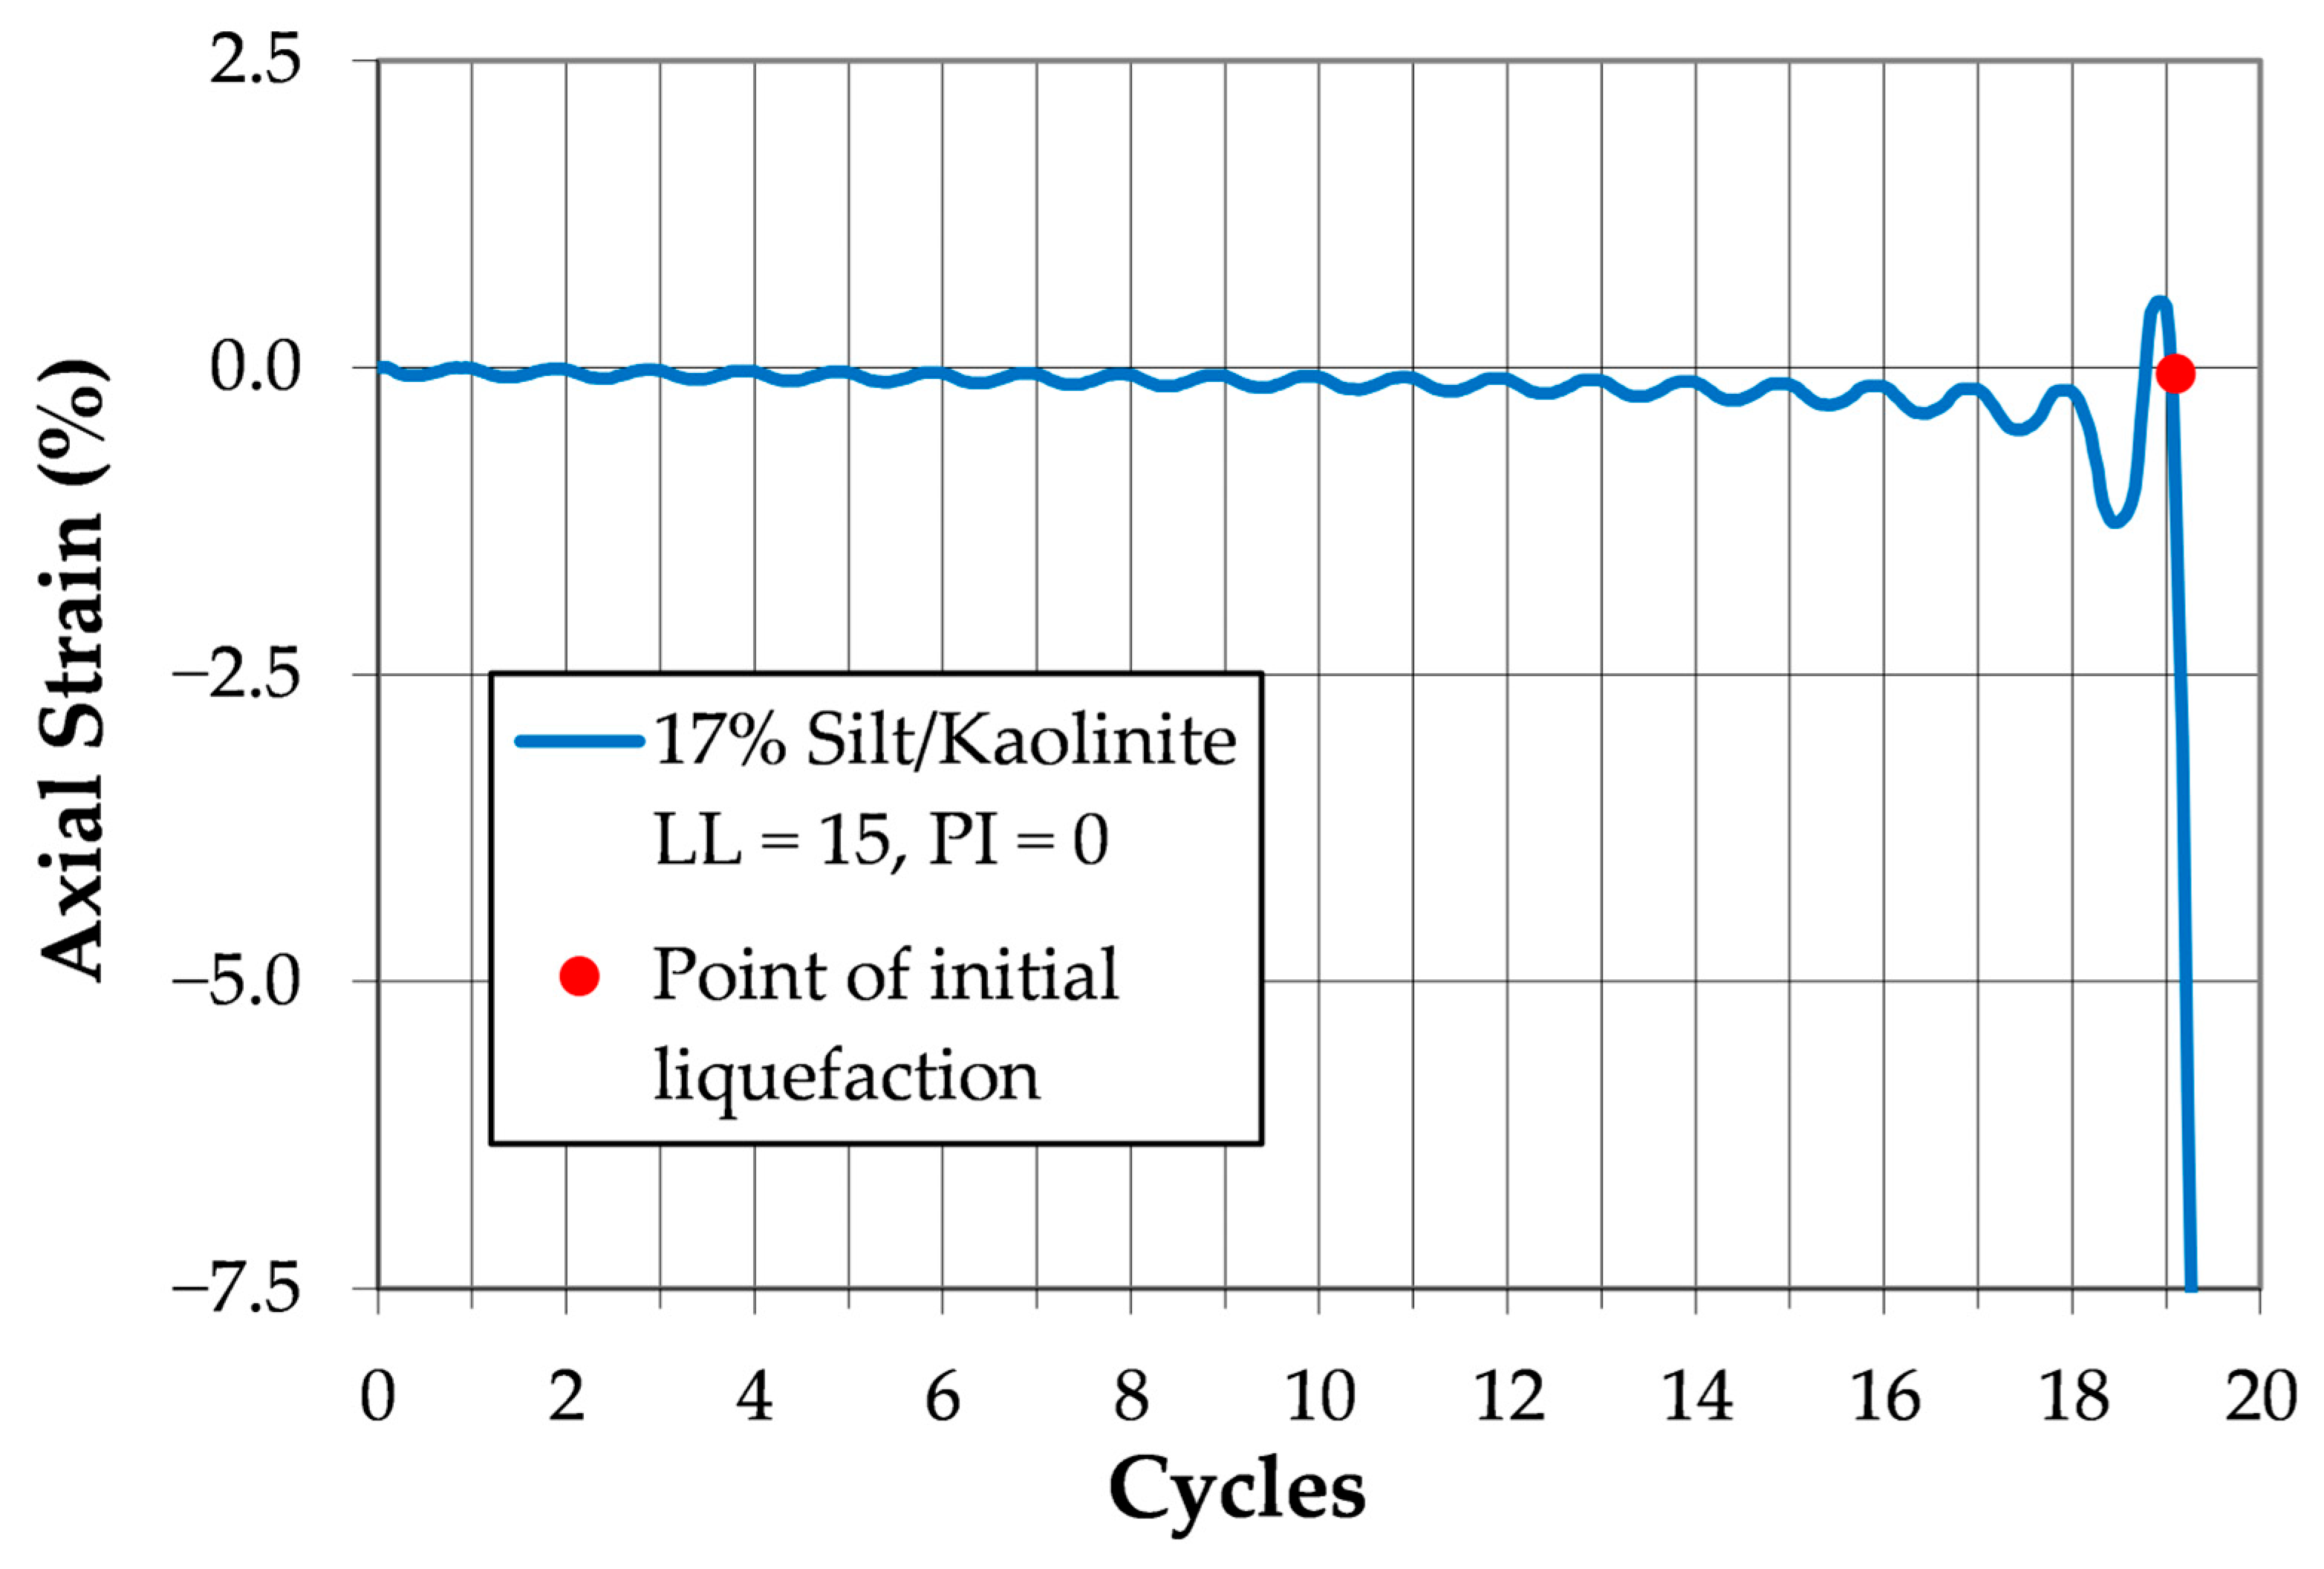
1.1.2. Liquefaction Failures: Flow Liquefaction and Cyclic Mobility

When a soil specimen in a laboratory test is subjected to cyclic loading and reaches a state of zero effective stress, it is said to have liquefied. Additionally, liquefaction can be defined as occurring when some level of strain is achieved in the specimen or the soil mass. When a strain-based criterion is used, the effective stress may not be equal to zero when liquefaction occurs, in which case, the soil likely has a shear strength value greater than zero.
When a soil liquefies, its pre- and post-liquefaction behaviors can be divided into two very different conditions: flow liquefaction and cyclic mobility. Correspondingly, soil deposits subjected to earthquake loadings are also capable of these two behaviors [36]. This section will provide a brief background on these two behaviors.
Flow liquefaction occurs in soils that either contract when sheared under drained conditions (i.e., when drainage and volume change are allowed to occur) or generate positive pore pressures when sheared under undrained conditions (i.e., when drainage and volume change are prevented from occurring). In clean sands, these soils are often described as being loose or as having a low relative density. When sheared undrained, these soils develop positive pore pressures which reduce the effective stress acting on the specimen, which, in turn, decreases the strength of the specimen. This lowered strength leads to increased straining under continued loading, which leads to increased pore pressures, resulting in even lower strengths. This self-perpetuating strength loss continues until a condition of zero or near-zero effective stress and near-zero strength is achieved. Due to the low strength in the liquefied soil, very large displacements typically accompany flow liquefaction.
A typical strain versus cycles of loading curve from a cyclic triaxial test performed on a specimen of Yatesville sand at a 23% relative density [37] exhibiting flow liquefaction is presented in Figure 1. Its behavior is characterized by very small axial strain levels throughout the loading until just before the onset of initial liquefaction during the 14th cycle of loading at which time a large, sudden, monotonic strain occurs. If one were to examine the specimen following the test, it would be found to bear no resemblance to its shape prior to loading. It would be found to be a soft mass of soil with very little strength, with only the rubber membrane preventing it from forming a shallow pile on the floor of the triaxial cell.
In Figure 1, the specimen develops some small (less than 0.5%) axial strains just prior to the occurrence of initial liquefaction; however, within half a cycle of loading following initial liquefaction, it has reached a strain of greater than 7%. The strain measured in the test was limited by the range of the LVDT used to measure the axial deformation; it was actually much larger, with the specimen completely collapsing and losing all semblance of its original shape. This susceptibility to extremely large monotonic strains is what makes flow liquefaction such a threat to the built environment.
Cyclic mobility occurs in soils that are initially contractive and then dilative when sheared under drained conditions and that initially generate positive pore pressures followed by decreasing pore pressures when sheared under undrained conditions. When sheared undrained, the soil will initially attempt to compress, thus developing an increase in pore pressures that reduces the effective stress acting on the specimen, but as the loading continues, the soil attempts to dilate, the pore pressures decrease, the effective stress increases, and the strength of the soil increases, thus limiting the strain. This tendency for dilation and the resulting strength gain prevents large displacements from occurring.
Figure 2 and Figure 3 [37] show this contractive/dilative behavior as it occurred in an undrained, stress-controlled cyclic triaxial test. Figure 2 shows the increase in pore pressure that occurs between cycles of loading 10.0 to 10.1 and again between cycles of loading 10.8 and 11.1, as the deviator stress increases. With further increases in deviator stress, the pore pressure decreases and then increases again slightly before decreasing significantly as the deviator stress decreases to its minimum value. Examining Figure 3 over these same ranges shows that the decrease in pore pressure that occurs when the deviator stress peaks corresponds to the portion of loading when the axial strain is at its minimum (most compressive). As the deviator stress decreases toward its minimum, the axial strain increases toward its maximum (most tensile) and the pore water pressure decreases to its minimum value. At this point, the process begins again.
A typical strain versus cycles of loading curve from a cyclic triaxial test performed on a specimen of Yatesville sand at a relative density of 67%, which exhibits cyclic mobility is presented in Figure 4 [37]. Its behavior is characterized by the nearly uniform development of bi-directional strains throughout the course of loading. Because the specimen is weaker in “tension” (when minor principal effective stress acts in the vertical direction) than in compression, there is a tendency for slightly greater strains to develop when the minor principal effective stress acts in the tensile strain direction. This explains the drift in axial strain that occurs in the direction of positive strain in the figure. If one were to examine the specimen following the test, it would be found to be essentially the same as it was prior to loading, that is, a rigid, uniform cylinder.
As can be seen in Figure 4, the specimen has already undergone over 1% axial straining before reaching initial liquefaction during the eleventh cycle. As loading continues after the occurrence of initial liquefaction, biaxial strains continue to develop, but the specimen never undergoes the large monotonic strain observed during flow liquefaction.

1.1.3. History of Plasticity-Based Liquefaction Susceptibility Criteria

Since the 1970s, building codes in the People’s Republic of China have included a listing of “thresholds to liquefaction” used to separate soils that are considered liquefiable from those considered non-liquefiable [38,39]. These criteria, commonly referred to as the Chinese Criteria, are based on the observed behavior of soils during several major earthquakes in the People’s Republic of China. Two of the major focuses of the criteria are the percentage of “clay” (defined as particles with mean grain diameters smaller than 0.005 mm) present and the plasticity index of the soil. Table 1 provides a brief summary of the Chinese criteria. In the table, soils meeting these criteria (e.g., having a clay content greater than 10%) are considered non-liquefiable.
Based upon further field experiences and differences in testing methodologies, several modifications have been proposed to the Chinese criteria [38,39]. Seed et al. [40], in their investigation of the slope failures at the Lower San Fernando Dam following the February 1971 San Fernando earthquake, presented a modified version of the Chinese criteria. As cited by Marcuson et al. [41], they proposed that soils containing more than 15 percent of particles finer than 0.005 mm, with liquid limits greater than 35 percent and water content less than 90 percent of the liquid limit, could be considered safe from liquefaction.
Finn, Ledbetter, and Wu [42] recommended adjustments to the Chinese criteria to account for uncertainties and differences between ASTM and Chinese liquid limit determinations. Their proposed modifications included reducing the fines content by 5 percent, the liquid limit by 1 percent, and the water content by 2 percent.
Building on this, Koester [43] suggested an additional revision to better reconcile discrepancies in liquid limit measurements between the two standards. He recommended increasing the liquid limit threshold to 36 percent.
In the last 25 years, a number of studies have further evaluated the effects of plastic fines on the liquefaction of sandy soils, and several of these studies have suggested other plasticity-based liquefaction susceptibility criteria [44,45,46,47,48,49,50]. The changes proposed by several of these studies are summarized in Table 2.

2. Laboratory Testing Program
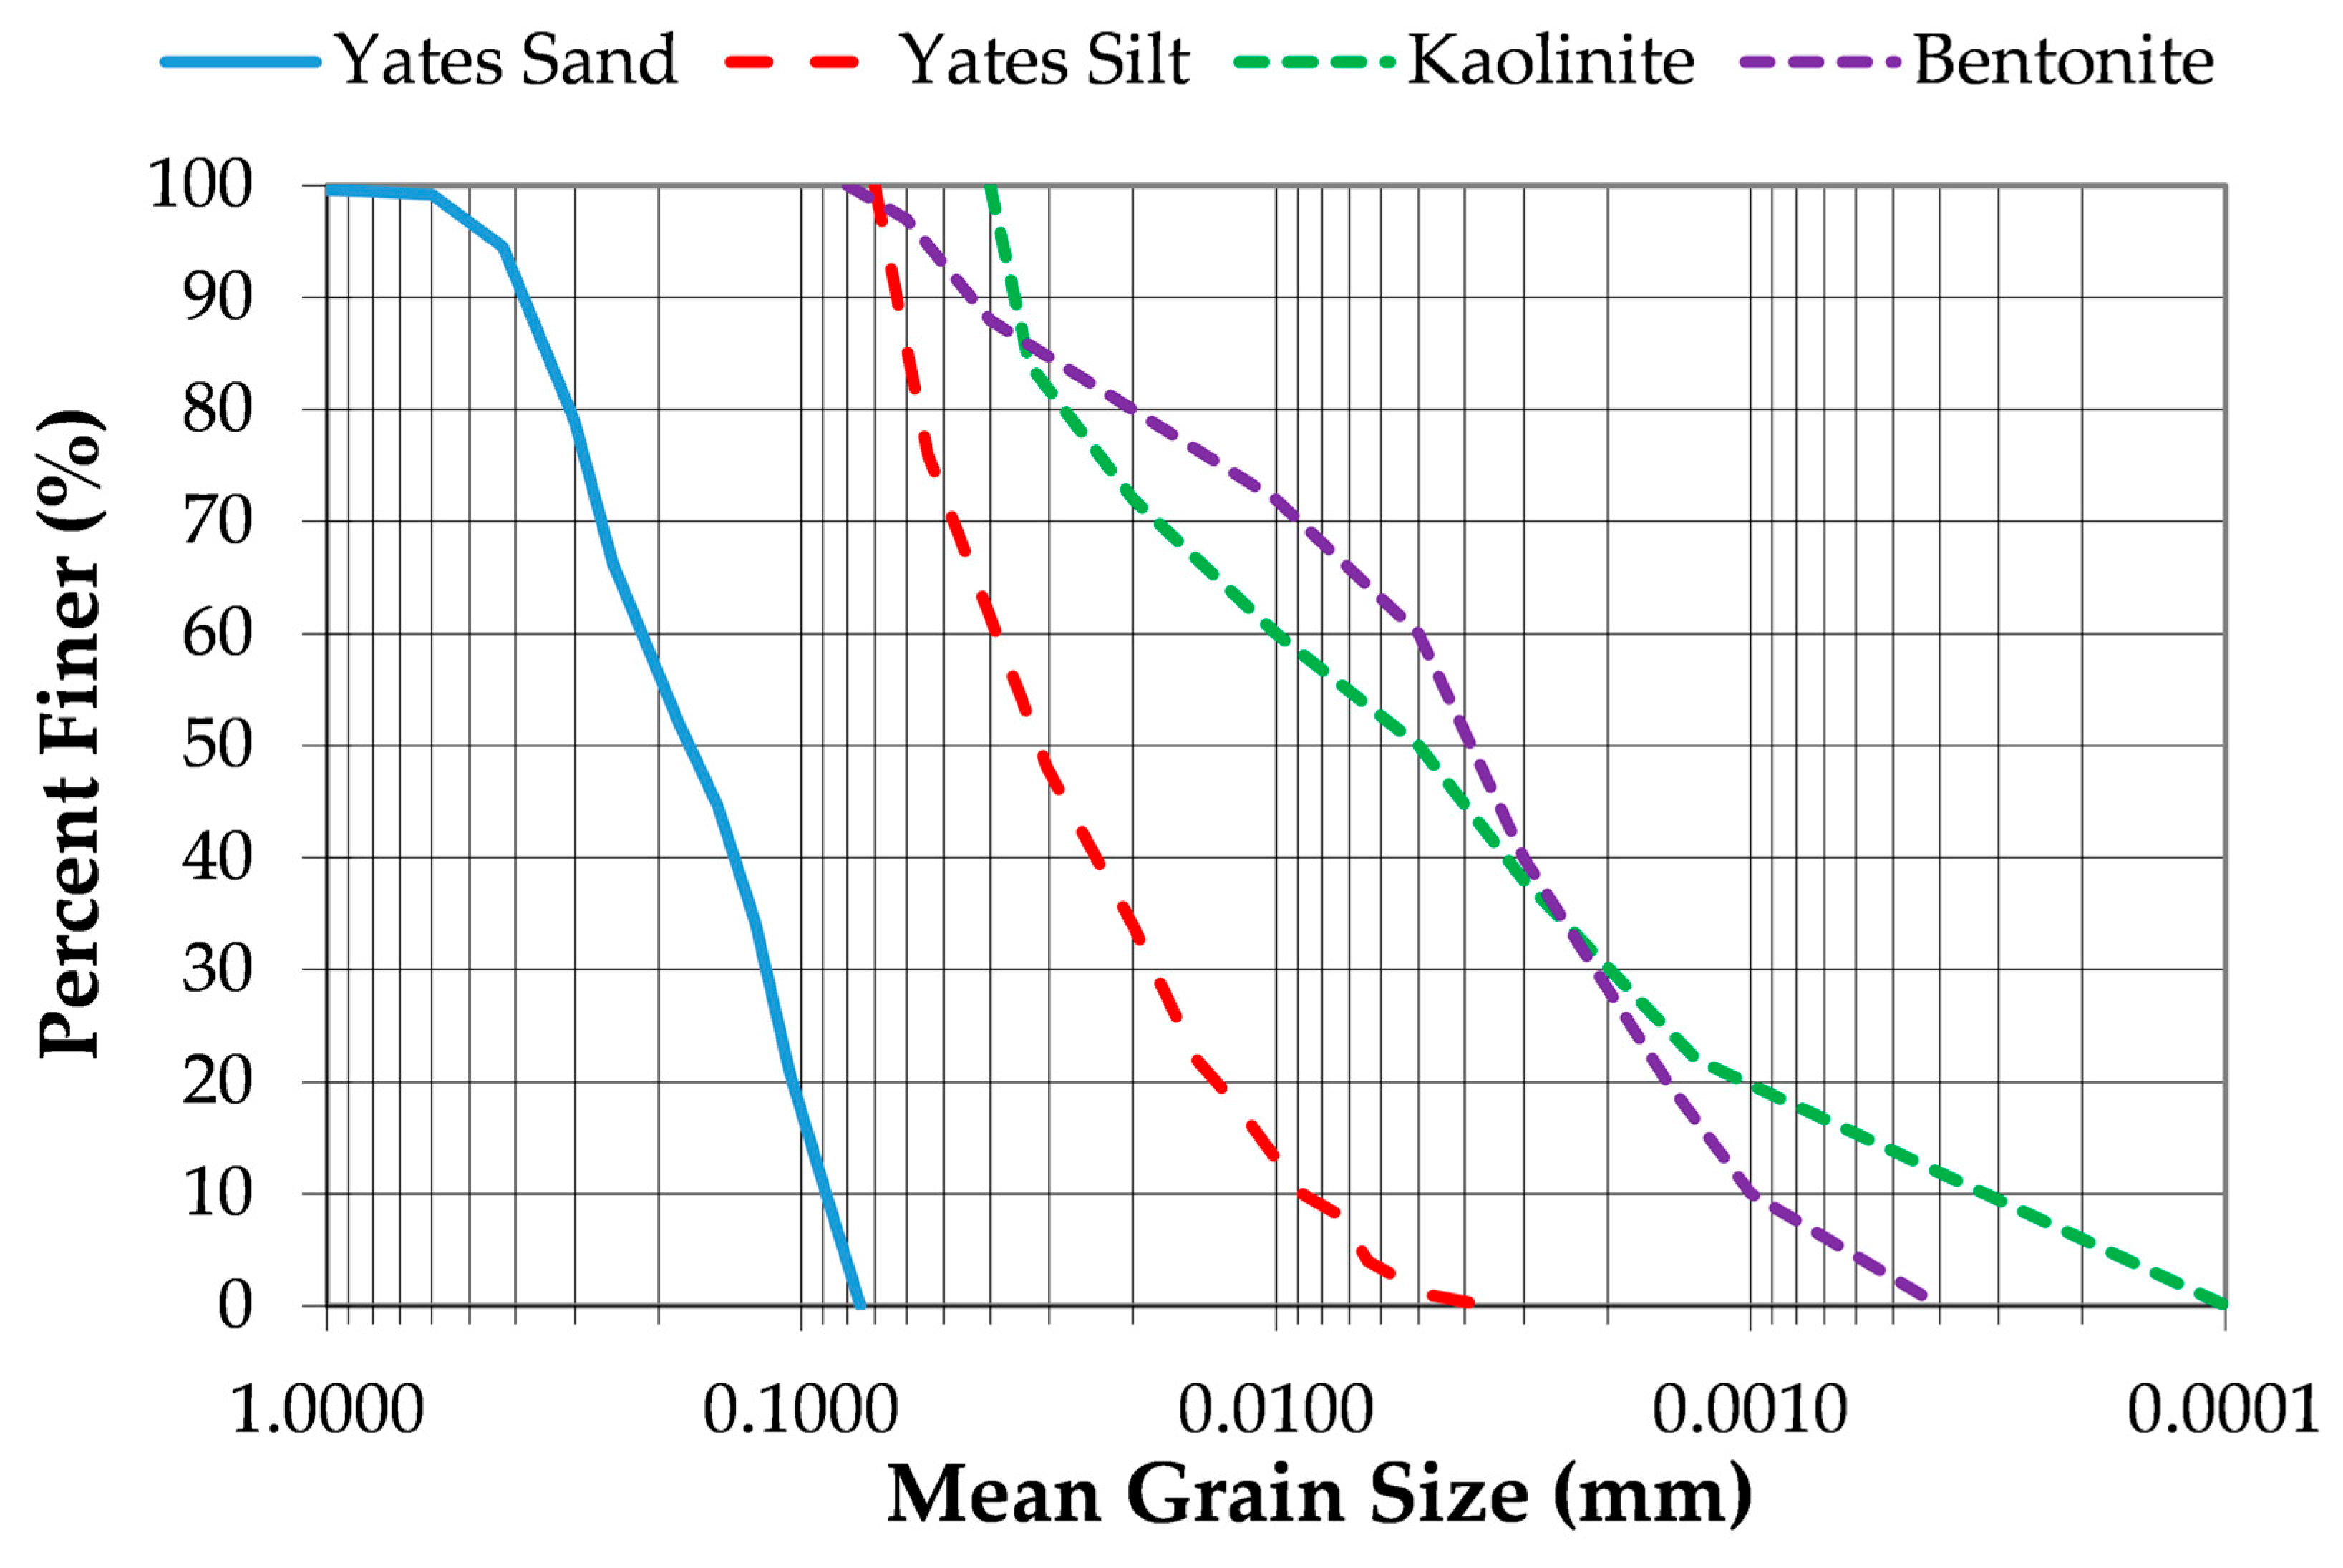
A series of 42 cyclic triaxial tests were performed to determine the effects of increased plastic fines content and plasticity on the liquefaction resistance of soils. These 42 tests were supplemented by an additional 30 specimens with the same range of relative densities (25% to 30%) and the same percentages of non-plastic fines (0% to 37%) from a previous study [13] to help distinguish between the effects of the quantity of the fine-grained material and the effects of the plasticity of the fine-grained material. Following a description of the soils tested, the testing procedure is described. Further details regarding each of these topics have been provided by Polito [37].

2.1. Soils Tested

The soils used in this study consisted of one sand, one non-plastic silt, and two high-plasticity clays: kaolinite and bentonite. The coarse-grained material used in the specimens was Yatesville sand. The fine-grained portion of the specimens consisted of various quantities and combinations of Yatesville silt, kaolinite, and bentonite.
Yatesville sand, which consists of the coarse-grained fraction of Yatesville silty sand, was obtained from a dam site in Lawrence County, Kentucky. It is a poorly graded, medium to fine sand. It is light brown in color, and its grains are sub-angular to sub-rounded in shape.
The non-plastic portion of the fine-grained material consisted of Yatesville silt, which was also derived from Yatesville silty sand. The silt is light brown in color and has no discernible liquid or plastic limit.
The two clays used for the plastic portion of the fine-grained material consisted of commercially available kaolinite and bentonite. The kaolinite used was obtained from a supplier in Georgia. It is classified as a high-plasticity clay. The bentonite used was obtained from a supplier in Wyoming. It is also classified as a high-plasticity clay. Table 3 presents the index properties of the soils tested and their grain-size distribution curves are provided in Figure 5.

2.2. Soil Mixtures

Cyclic triaxial tests were performed on 42 specimens of Yatesville sand with fines content ranging from 0 to 37 percent. The fine-grained material consisted of 14 combinations of kaolinite, bentonite, and Yatesville silt. Additionally, the results of the tests performed on another 30 specimens prepared with only non-plastic silt at similar fines content (0 to 37 percent) and densities (23 to 30 percent relative density) were included in the analyses.
These soil mixtures were chosen because they provided a variety of fines content and levels of plasticity, while also providing soils that met the plasticity-based liquefaction criteria as well as soils that did not meet the plasticity-based liquefaction criteria. This group of tests also exhibits both liquefaction modes: flow liquefaction and cyclic mobility.
By selecting these tests, the primary aspects of the study can be evaluated, chiefly the effects of soil plasticity on the liquefaction of sandy soils. This can be further evaluated as the effect that soil plasticity has on the liquefaction mode, especially with regard to which liquefaction mode occurs. Lastly, these tests can provide insight into the conflict between the results reported in many laboratory studies (that the addition of plastic fines increases liquefaction susceptibility) and those reported in many post-earthquake field investigations (that soils with significant amounts of plastic fines do not liquefy).
The plasticity of the various soil mixtures was determined for the fraction of the material passing the No. 40 sieve in accordance with ASTM D 4318 Standard Test Method for Liquid Limit, Plastic Limit, and Plasticity Index of Soils [51]. Liquid and plastic limit tests were performed for each soil mixture containing plastic fines. The percentage of fine-grained material reported for the cyclic triaxial specimens is based on the mass of the entire gradation of Yatesville sand and not on the mass of the Yatesville sand passing the No. 40 sieve. For example, 100 g of Yatesville sand with 12% kaolinite contains 88 g of sand and 12 g of kaolinite. Because 95% of Yatesville sand passes the No. 40 sieve, the soil tested after removing the portion of Yatesville sand retained on the No. 40 sieve consisted of 83 g of sand and 12 g of kaolinite.
Some soils, most notably those with low clay contents, were found to have liquid limits but not plastic limits and were thus identified as being non-plastic in accordance with the ASTM standard [51]. The non-plastic Yatesville silt used in the study was found to have neither a liquid limit nor a plastic limit. A summary of the mixtures and their plasticity data is provided in Table 4.
During the testing program, it was found that in order to obtain meaningful results the soil must be examined in terms of its overall plasticity, not just the plasticity of the fine-grained fraction. Numerous studies performed in the past have analyzed the effects of plastic fines based solely on the plasticity of the fine-grained material. This may lead to erroneous results, as it neglects the effects that the percentage of fines in the soil has upon the Atterberg Limits, and thus the effects it has on the cyclic resistance of that soil. For example, the pure kaolinite used in this study has a liquid limit of 58 and a plasticity index of 31, but Yatesville sand with 26 percent kaolinite has a liquid limit of 20 and a plasticity index of 7. Similarly, Yatesville sand with 12 percent kaolinite is classified as non-plastic with a liquid limit of 17 and no measurable plastic limit. These three soils have activities of 0.31, 0.27, and 0, respectively.

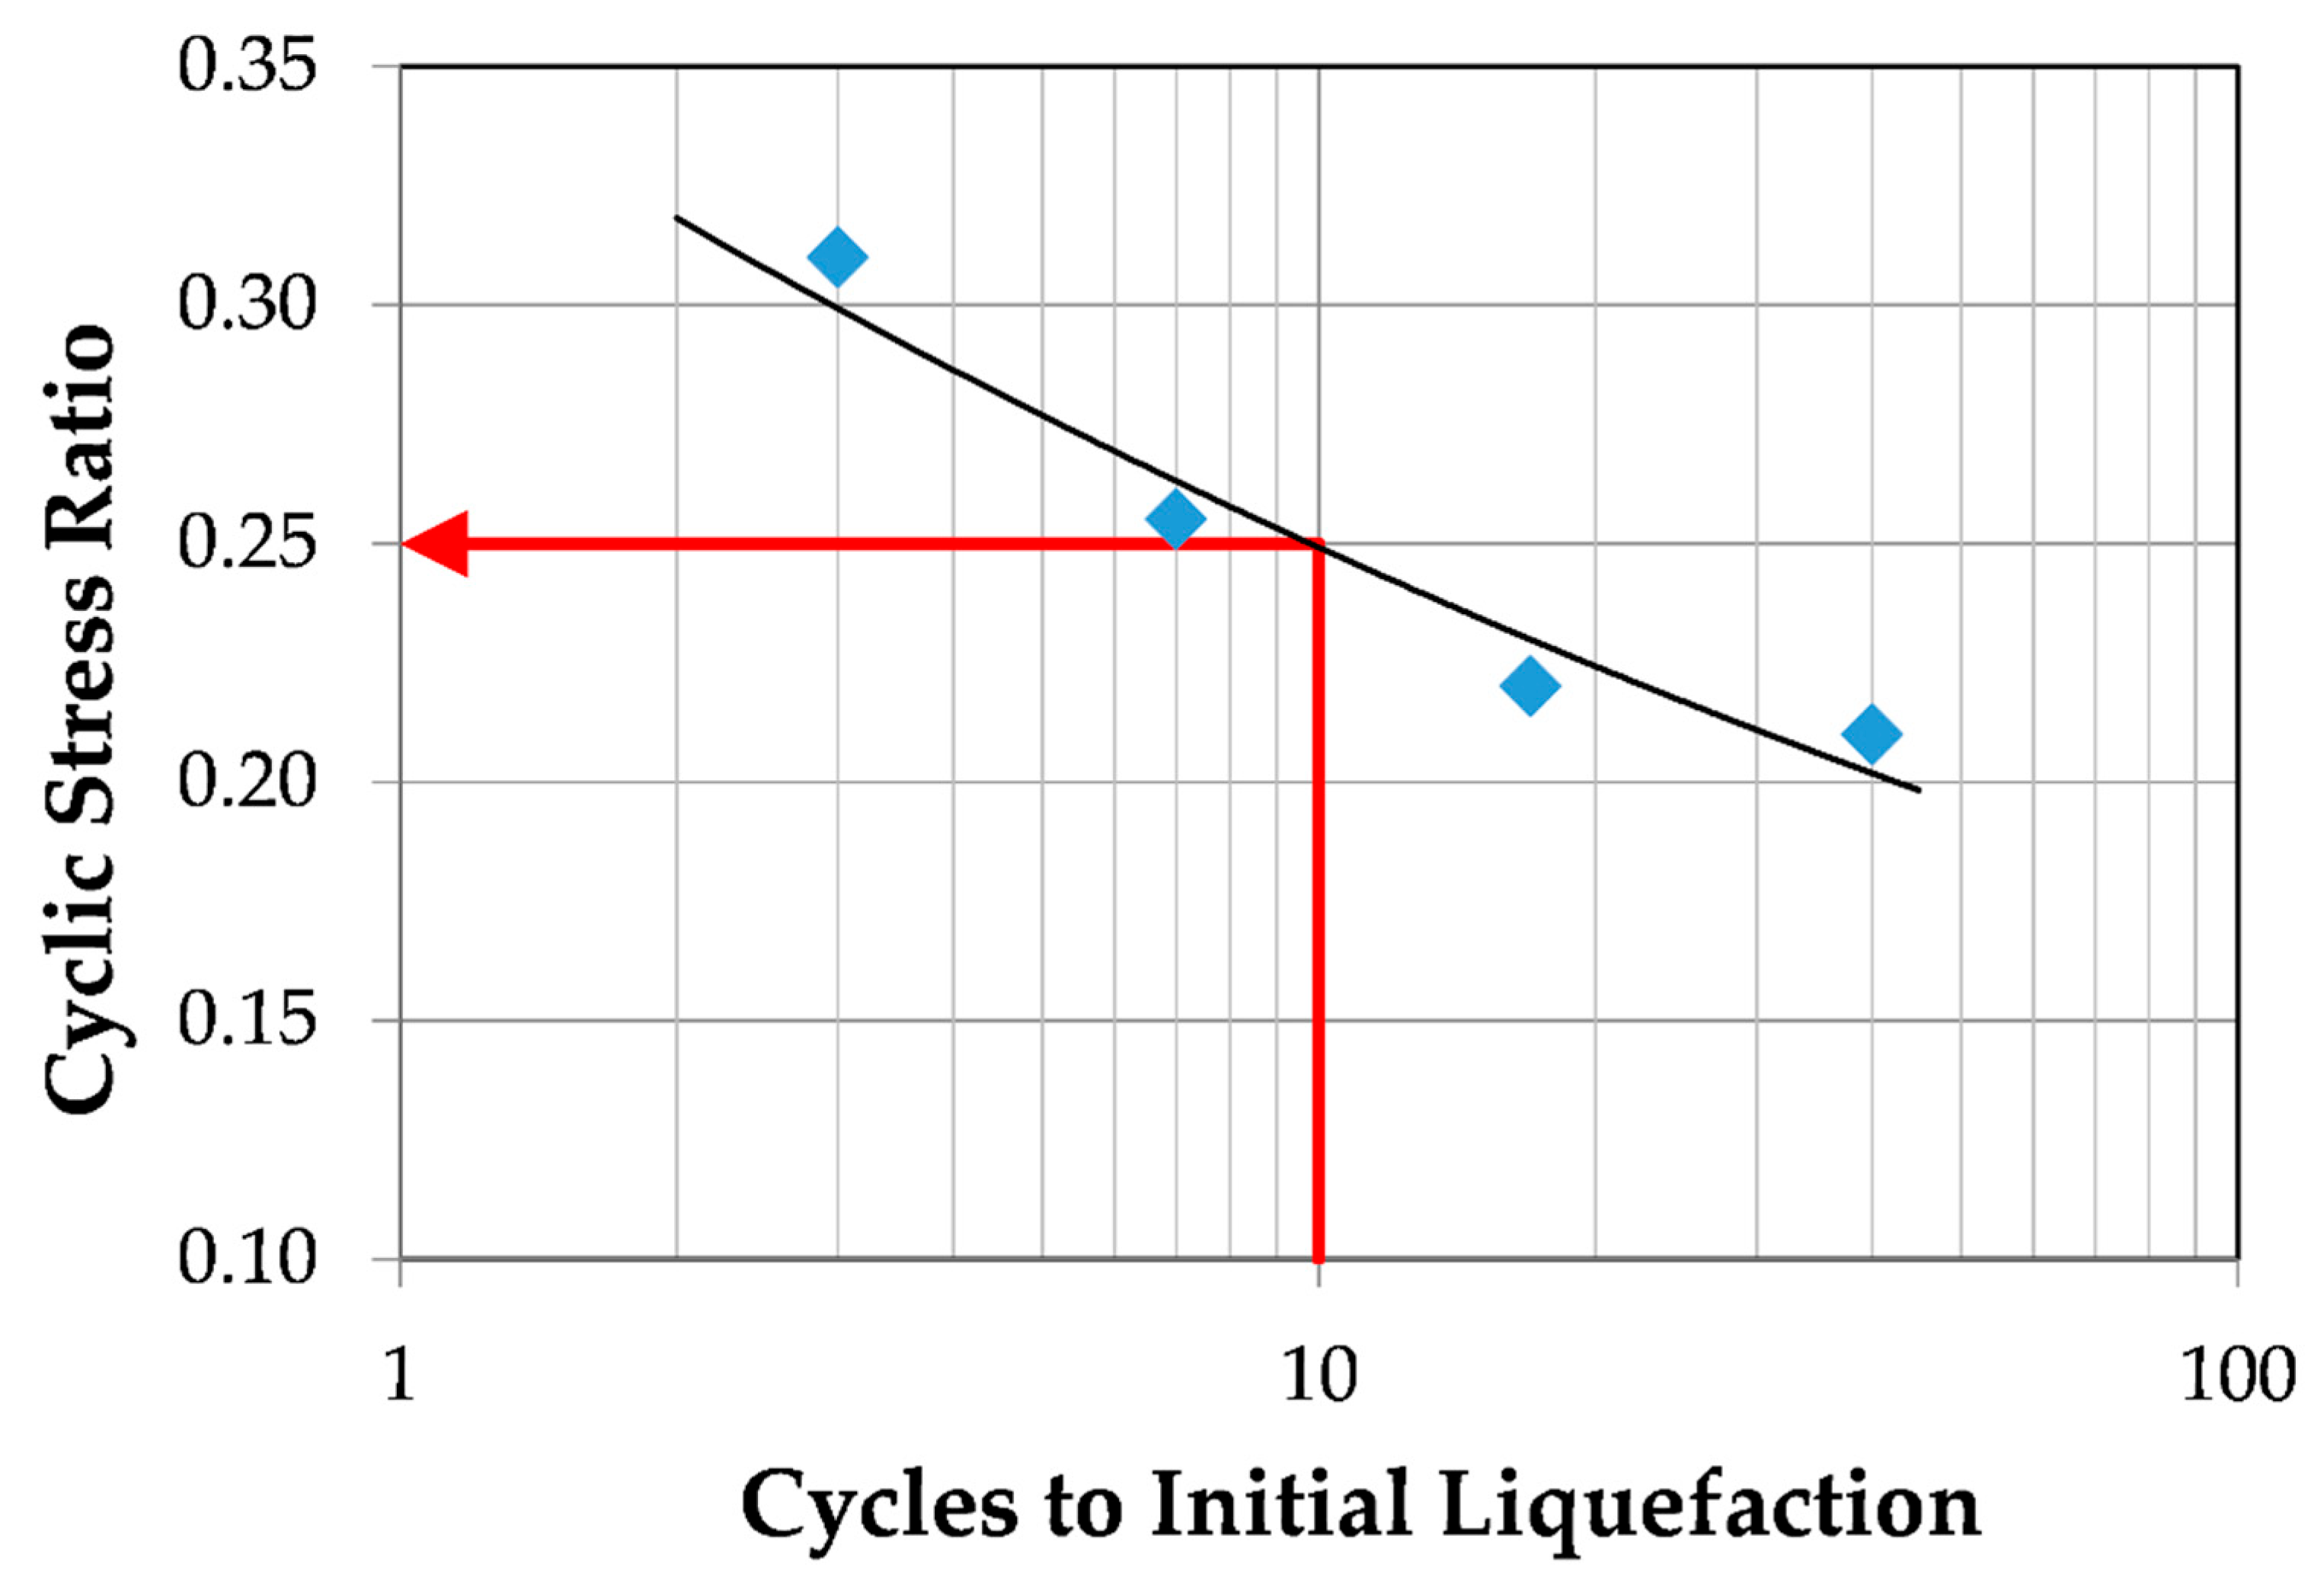
2.3. Cyclic Triaxial Testing

The cyclic resistance of the soils tested was evaluated using stress-controlled cyclic triaxial tests in accordance with ASTM 5311 Standard Test Method for Load-Controlled Cyclic Triaxial Strength of Soil [52]. Cyclic triaxial testing of the soil mixtures was performed using an electropneumatic cyclic triaxial testing apparatus.
All cyclic triaxial specimens tested were 71 mm in diameter and 154 mm in height. They were formed by moist tamping at a water content that produced 50% saturation in the specimen. Undercompaction was used to ensure a uniform density throughout the specimen [53]. Once the specimen had been formed and placed in the triaxial cell, it was saturated by flowing CO2 through the specimen for at least 15 min to purge the air from the soil voids. Next, the CO2 was purged from the voids by flowing at least three pore volumes of de-aired water through the specimen.
The specimen was then subjected to the application of sufficient back pressure to ensure saturation and was isotropically consolidated to a stress of 100 kPa. All specimens had post-consolidation relative densities of between 23% and 30%.
Following consolidation, the specimens were subjected to a sinusoidally varying deviator stress at the desired cyclic stress ratio until they liquefied. The study defined liquefaction as initial liquefaction. This occurs when the effective stress acting on the specimen first equals zero, which corresponds to the excess pore pressure generated during cyclic loading first equaling the effective stress acting on the specimen prior to the commencement of cyclic loading.
The test results were used to develop a cyclic resistance curve such as the one shown in Figure 6. The cyclic resistance ratio of the soil is the cyclic stress ratio required to cause liquefaction in a predetermined number (typically 10 to 20) of cycles of loading. In this study, the cyclic resistance ratio was first defined as the cyclic stress ratio required to cause initial liquefaction in 10 cycles of loading. For the data presented in Figure 6, the cyclic resistance ratio is a cyclic stress ratio of 0.25.

3. Results

For each individual test, the applied cyclic stress ratio, the cycles of loading required to trigger initial liquefaction, and for each soil mixture, the liquid limits, plasticity indexes, cyclic resistance ratios, and failure modes are presented in Table 5.
An examination of the data reveals that the soils with liquid limits of 20 or less that did not have a measurable plasticity index failed via flow liquefaction. Similarly, the soils with liquid limits of 20 or greater that had measurable plasticity indexes failed via cyclic mobility. This pattern may be seen in Figure 7. In order to tie this behavior more directly to soil type, the data were plotted on a USCS soil classification chart [54]. In the figure, it can be seen that the majority of the soils that are classified as non-plastic silts (ML) are susceptible to flow liquefaction failures. The soils that classify as either lean clays (CL) or silty clays (CL-ML) are subject to cyclic mobility failures. The sole exception is one mixture that is classified as a non-plastic silt but underwent a cyclic mobility failure. This mixture plots very close to the A-line with an LL = 31 and a PL = 7, thus it behaves more similarly to a lean clay than it does to the soils with a plasticity index of zero.
Figure 8 presents a strain versus cycles of liquefaction curve for a specimen that underwent a flow liquefaction failure. The soil tested consisted of Yatesville sand mixed with 8.5% non-plastic silt and 8.5% kaolinite. The specimen had a post-consolidation relative density of 23.9%, a liquid limit of 15, and no discernible plastic limit. In the figure, the classic flow liquefaction pattern of minimal axial strain until shortly before initial liquefaction, which occurs during the 20th cycle of loading, followed by large, sudden strains, is clearly visible. This is the same pattern noted in Figure 1, which presents the axial strain versus cycles of loading for a specimen of clean, loose sand that also underwent flow liquefaction.
Figure 9 presents a strain versus cycles of liquefaction curve for a specimen that underwent a cyclic mobility failure. The soil tested consisted of Yatesville sand mixed with 8.5% bentonite and 8.5% kaolinite. The specimen had a post-consolidation relative density of 28.2%, a liquid limit of 41, and a plasticity index of 19. In the figure, the classic cyclic mobility pattern of axial strain accumulation before initial liquefaction, which occurs during the 12th cycle of loading, is clearly visible. This is the same pattern noted in Figure 4, which presents the axial strain versus cycles of loading for a specimen of clean, dense sand that also underwent a cyclic mobility failure.

4. Discussion of Results

Three major implications can be made from this study. The first is that, when viewed in terms of initial liquefaction, the addition of plastic fines does not inherently increase the cyclic resistance of a sand. The second is that the most viable component of the plasticity-based liquefaction susceptibility criteria is the criterion involving the plasticity of the soil. Lastly, it may not be proper to evaluate the liquefaction susceptibility of soils with significant amounts of plastic fines using the commonly used stress-based definitions of initial liquefaction. Each of these implications is discussed further below.

4.1. Liquefaction of Clayey Sands with Low Plasticity

The findings of the laboratory study performed during this research do not support the conclusions of those studies in the literature that found that adding small amounts of clay to a sand increases its resistance to liquefaction. In fact, the current study indicates that the addition of small amounts of clay to a sand actually decreases the sand’s ability to withstand liquefaction. It is not until a significant amount of highly plastic fines is added that the soil becomes less liquefiable than either the clean sand or a sand with a similar amount of non-plastic fines. This appears to be the case for both stress-based liquefaction (i.e., initial liquefaction) and strain-based failure criteria (e.g., 5% single-amplitude axial strain).
Loose sandy soils that contain plastic fines but whose plasticity does not meet the requirements of the plasticity-based liquefaction susceptibility criteria (e.g., LL > 35 or PI > 10) may have cyclic resistances much lower than soils with a comparable percentage of non-plastic (i.e., silty) fines. The addition of even a few percent of plastic fines mixed in with the sand or the sand and silty fine-grained material may cause the cyclic resistance to decrease. Thus, the introduction of plastic fines may in fact increase the susceptibility of a sand to liquefaction. These trends may be seen in Figure 10, which plots the cyclic resistances of soils prepared to a constant relative density as a function of their fines content and composition.
If one examines Figure 10 at a fines content of 17 percent, one can see that the specimens with non-plastic silt (CRR = 0.24, LL = 0, PI = 0) had the largest cyclic resistance ratio, followed by the specimens with bentonite (CRR = 0.22, LL = 48, PI = 20), followed by the specimens with a mixture of kaolinite and bentonite (CRR = 0.18, LL = 41, PI = 19). These three mixtures are followed by the specimens with a mixture of non-plastic silt, kaolinite and bentonite (CRR = 0.17, LL = 31, PI = 7), followed by the specimens with a mixture of non-plastic silt and kaolinite (CRR = 0.135, LL = 15, PI = 0), and finally the specimens with kaolinite (CRR = 0.13, LL = 18, PI = 0).
One possible reason for this decrease in liquefaction resistance is that when small amounts of clay are added to the sand, the clay particles may either adhere to the surface of the sand particles or become located between the normal sand grain to sand grain points of contact. Because the clay particles typically have lower friction angles than the sand, the presence of these particles may make it easier for the sand grains to slide past each other, thus requiring less work to liquefy the soil. This increased ease of movement may not be compensated for until the soil has enough plasticity to prevent the sand grains from sliding. This would explain why plasticity-based liquefaction susceptibility criteria, such as the Modified Chinese criteria, require relatively high levels of soil plasticity.
These soils with low levels of plasticity (i.e., PI = 0) were all found to be subject to flow liquefaction failures. Under cyclic loading, these soils initially showed very little straining; however, as the pore pressure ratio approached 100 percent (i.e., the effective stress approached zero), these soils underwent sudden, almost spontaneous, deformations that were large in magnitude.

4.2. Plasticity-Based Liquefaction Susceptibility Criteria

Numerous criteria have been proposed to distinguish liquefiable from non-liquefiable soils based on parameters such as clay content, plasticity, and density [22,23,24,25,26,27,28,29,30]. Among these, soil plasticity emerges as the most consistent indicator for differentiating soils prone to flow liquefaction from those that exhibit cyclic mobility. Whether expressed as the plasticity index or liquid limit, soils exceeding a certain plasticity threshold are generally not susceptible to flow liquefaction failures.
However, soils classified as non-liquefiable under plasticity-based criteria may still experience initial liquefaction in the field: that is, a condition of near-zero effective stress. They may also undergo significant but temporary straining. Due to their inherent plasticity, these soils tend to exhibit cyclic mobility rather than flow liquefaction. The resulting limited deformations and absence of physical manifestations like sand boils may lead to the mistaken conclusion that liquefaction did not occur. It is this cyclic mobility, characterized by limited deformations, that differentiates plastic soils from those undergoing flow liquefaction during seismic events.
The behavior of clayey sands under cyclic loading suggests that deformation characteristics provide a more meaningful indicator of liquefaction susceptibility than effective stress levels alone. As both the amount and plasticity of fines increase, distinct changes in deformation response occur, offering a practical framework for evaluating the liquefaction potential of clayey sand deposits. These behavioral shifts also support the use of plasticity-based criteria for assessing liquefaction susceptibility.
Interestingly, soils with plastic fines that meet the plasticity criteria may exhibit lower cyclic resistance compared to soils with similar contents of non-plastic fines. Nevertheless, this difference is of limited relevance, as plastic soils are not prone to flow liquefaction. Although these soils may generate pore pressures and reductions in effective stress similar to those of non-plastic soils, their deformation response is markedly different. Low-plasticity soils are vulnerable to sudden, large strains under high pore pressure ratios, while soils with higher plasticity deform gradually under cyclic loading, straining in both compression and tension as pore pressures rise. These soils typically do not undergo additional deformation once cyclic loading ceases, a behavior consistent with what is referred to as “cyclic mobility”.
Therefore, it is inappropriate to define liquefaction in plastic soils solely by the occurrence of zero effective stress or by laboratory-measured strain thresholds. This also clarifies why field observations often report that such soils did not liquefy during earthquakes. While they may have reached pore pressures equal to their confining stress, indicating initial liquefaction, the absence of large permanent deformations or sand boils leaves no visible evidence of liquefaction.

4.3. Resolution of the Paradox of the Lab and the Field

The two types of failure modes (flow liquefaction and cyclic mobility) can be used to explain the paradox that adding fines to sandy soils in the lab makes it easier to liquefy the soil, while plasticity-based liquefaction criteria, which have proved very effective in the field, indicate that these soils do not liquefy at all. The resolution of the paradox lies in the shift in liquefaction behavior that occurs as plastic fines content increases.
Adding plastic fines does, indeed, make the soil liquefy in fewer cycles under the same load, just as many studies have reported. This is the case whether liquefaction is defined using a stress-based approach (e.g., zero effective stress) or a strain-based criterion (e.g., 5% single-amplitude strain). What changes as more plastic fines are added is the failure mechanism.
At relatively low levels of plasticity, the soil is still susceptible to flow liquefaction failures that can lead to the formation of sand boils and large permanent deformations. Once the soil has enough plastic fines that it meets the plasticity-based liquefaction criteria, its failure mode switches to cyclic mobility, which typically produces neither sand boils nor large permanent deformation. As a result, the occurrence of cyclic mobility may be hard to identify in post-earthquake investigations. Similarly, laboratory studies tend to define liquefaction using laboratory-based criteria such as initial liquefaction or some level of axial strain and do not separate the failures by liquefaction type.

5. Conclusions

Several conclusions regarding the effects of plastic fines on the liquefaction of sandy soils and the use of plasticity-based liquefaction susceptibility criteria may be drawn from this study.
The presence of plastic fines can reduce a soil’s liquefaction resistance if those fines are of low plasticity. This can occur whether liquefaction is defined as zero effective stress or as some level of strain. However, in sands containing plastic fines, liquefaction behavior is more strongly influenced by the overall plasticity of the soil rather than the fines content or clay fraction alone. This plasticity, whether expressed through the liquid limit, plastic limit, or plasticity index, plays a critical role in determining susceptibility to flow liquefaction.
Plasticity-based criteria for liquefaction resistance are effective because they capture the soil’s behavior after initial liquefaction. Soils that meet a minimum plasticity index, typically 7% to 10%, or fall within suggested, albeit conservative, liquid limit ranges of 32 to 37, tend not to experience flow liquefaction. Instead, they exhibit cyclic mobility with limited deformation.
Given this distinct response, traditional liquefaction assessments based on initial liquefaction or laboratory-measured strain are not suitable for soils that meet these plasticity thresholds. While such soils may show signs of initial liquefaction, they do not undergo the large, disruptive deformations typical of flow liquefaction, nor do they exhibit associated features like steady-state flow or sand boils.
The seeming paradox that liquefaction studies performed in the laboratory often report that the addition of plastic fines increases the likelihood of a soil liquefying, whereas plasticity-based liquefaction criteria may report that same soil as non-liquefiable, can be explained based on the mode of liquefaction. When sufficient plastic fines are present in the soil to meet the plasticity-based liquefaction criteria, the liquefaction mode changes from flow liquefaction (which is usually accompanied by sand boils and large permanent displacements) to cyclic mobility (which typically does not produce either sand boils or large permanent displacements).

Author Contributions

Conceptualization, C.P.P. and J.R.M.; methodology, C.P.P. and J.R.M.; software, C.P.P.; validation, C.P.P.; formal analysis, C.P.P.; investigation, C.P.P.; resources, J.R.M.; data curation, C.P.P.; writing—original draft preparation, C.P.P.; writing—review and editing, C.P.P. and J.R.M.; supervision, J.R.M.; project administration, J.R.M.; funding acquisition, J.R.M. All authors have read and agreed to the published version of the manuscript.

Funding

This research received no external funding.

Data Availability Statement

All data and materials are available upon request from the corresponding author. The data are not publicly available due to ongoing research involving a part of the data.

Acknowledgments

The first author would like to thank Valparaiso University for its financial support provided via the Alfred W. Sieving Endowed Chair of Engineering.

Conflicts of Interest

The authors have no conflicts of interest to declare. There are no financial interests to report.

References

  1. Mogami, T.; Kubo, K. The Behaviour of Soil during Vibration. In Proceedings of the Third International Conference on Soil Mechanics and Foundation Engineering, Zurich, Switzerland, 16–27 August 1953; Volume 1, pp. 152–153. [Google Scholar]
  2. Seed, H.B.; Lee, K.L. Liquefaction of Saturated Sands during Cyclic Loading. J. Soil Mech. Found. Div. 1966, 92, 105–134. [Google Scholar] [CrossRef]
  3. Lee, K.L.; Seed, H.B. Cyclic Stress Conditions Causing Liquefaction of Sand. J. Soil Mech. Found. Div. 1967, 93, 47–70. [Google Scholar] [CrossRef]
  4. Seed, H.B. Soil Liquefaction and Cyclic Mobility Evaluation for Level Ground during Earthquakes. J. Geotech. Eng. Div. 1979, 105, 201–255. [Google Scholar] [CrossRef]
  5. Nemat-Nasser, S.; Shokooh, A. A Unified Approach to Densification and Liquefaction of Cohesionless Sand in Cyclic Shearing. Can. Geotech. J. 1979, 16, 659–678. [Google Scholar] [CrossRef]
  6. Polito, C.; Sibley, E. Threshold Fines Content and the Behavior of Sands with Non-Plastic Silts. Can. Geotech. J. 2020, 57, 462–465. [Google Scholar] [CrossRef]
  7. Thevanayagam, S. Effect of Fines and Confining Stress on Undrained Shear Strength of Silty Sands. J. Geotech. Geoenviron. Eng. 1998, 124, 479–491. [Google Scholar] [CrossRef]
  8. Hazirbaba, K. Pore Pressure Generation Characteristics of Sands and Silty Sands: A Strain Approach. Ph.D. Thesis, University of Texas at Austin, Austin, TX, USA, 2005. [Google Scholar]
  9. Kokusho, T. Liquefaction Strengths of Poorly-Graded and Well-Graded Granular Soils Investigated by Lab Tests. In Earthquake Geotechnical Engineering, Proceedings of the 4th International Conference on Earthquake Geotechnical Engineering–Invited Lectures, Thessaloniki, Greece, 25–28 June 2006; Pitilakis, K., Ed.; Springer: Dordrecht, The Netherlands, 2006; Volume 6, pp. 159–184. [Google Scholar]
  10. Tao, M.; Figueroa, J.L.; Saada, A.S. Influence of Nonplastic Fines Content on the Liquefaction Resistance of Soils in Terms of the Unit Energy. In Cyclic Behaviour of Soils and Liquefaction Phenomena, Proceedings of the International Conference, Bochum, Germany, 31 March–2 April 2004; Triantafyllidis, T., Ed.; CRC Press: London, UK, 2004; pp. 223–231. [Google Scholar]
  11. Seed, H.B.; Idriss, I.M.; Arango, I. Evaluation of Liquefaction Potential Using Field Performance Data. J. Geotech. Eng. 1983, 109, 458–482. [Google Scholar] [CrossRef]
  12. Bray, J.D.; Sancio, R.B. Assessment of the Liquefaction Susceptibility of Fine-Grained Soil. J. Geotech. Geoenviron Eng. 2006, 132, 1165–1177. [Google Scholar] [CrossRef]
  13. Polito, C.; Martin, J.R. The Effects of Non-Plastic Fines on the Liquefaction Resistance of Sands. J. Geotech. Geoenviron. Eng. 2001, 127, 408–415. [Google Scholar] [CrossRef]
  14. Ishihara, K. Liquefaction and Flow Failure during Earthquakes. Géotechnique 1993, 43, 351–415. [Google Scholar] [CrossRef]
  15. Goudarzy, M.; Sarkar, D.; Wichtmann, T. Influence of Plastic Fines Content on the Liquefaction Susceptibility of Sands: Monotonic Loading. Acta Geotech. 2021, 16, 1283–1295. [Google Scholar] [CrossRef]
  16. Akhila, M.; Rangaswamy, K.; Sankar, N. Liquefaction Susceptibility of Silty Sands and Low Plastic Clay Soils. Int. J. Geotech. Earthq. Eng. 2019, 10, 17–31. [Google Scholar] [CrossRef]
  17. Monkul, M.M.; Ozden, G. Effects of Plastic Fines on the Instability of Sand. Soils Found. 2009, 49, 581–591. [Google Scholar]
  18. Park, S.-S.; Kim, Y.-S. Liquefaction Resistance of Sands Containing Plastic Fines with Different Plasticity. J. Geotech. Geoenviron. Eng. 2013, 139, 825–830. [Google Scholar] [CrossRef]
  19. Varghese, V. An Experimental Study on Effect of Plastic Fines Content on Liquefaction Properties of Sand. Int. J. Eng. Res. Appl. 2015, 5, 102–106. [Google Scholar]
  20. Eseller-Bayat, E.E.; Monkul, M.M.; Akin, O.; Yenigun, S. Evaluation of the Effect of Relative Density on Liquefaction Assessment of Sands with Plastic and Non-Plastic Fines. In Liquefaction Triggering, Consequences and Mitigation; ASCE: Reston, VA, USA, 2018; pp. 244–253. [Google Scholar] [CrossRef]
  21. Akhila, M.; Ranga Swamy, K.; Sankar, N. Effects of Fines Content and Plasticity on Liquefaction Resistance of Sands. Proc. Inst. Civ. Eng. Geotech. Eng. 2020, 173, 483–495. [Google Scholar] [CrossRef]
  22. Hsiao, D.-H.; Lin, C.-C. Effects of the Properties of Fines on the Pore Water Pressure Generation Characteristics of Sand–Silt–Clay Mixtures during Cyclic Loading. Appl. Sci. 2023, 13, 8126. [Google Scholar] [CrossRef]
  23. Dang, Q.-H.; Reiffsteck, P.; Vu, M.-N.; Nguyen-Sy, T.; Pham, V.-H. Effect of Plastic Fine Content on the Static Liquefaction Potential of Sandy Soil. Appl. Sci. 2024, 14, 5881. [Google Scholar] [CrossRef]
  24. Jradi, L. Study of the Influence of Fine Particles on the Properties of Liquefaction of Sands. Ph.D. Thesis, Université Paris-Est, Créteil, France, 2018. [Google Scholar]
  25. Qi, W.; Guoxing, C.; Hongmei, G.; Dandan, J. Effect of Plastic Fines on Liquefaction Characteristics of Gravelly Soil. In Proceedings of the 6th International Conference on Earthquake Geotechnical Engineering, Christchurch, New Zealand, 1–4 November 2015; Available online: https://www.issmge.org/uploads/publications/59/60/748.00_Qi.pdf (accessed on 5 May 2025).
  26. Ganiyu, M.O.; Kennedy, C. Effect of Content and Plasticity of Fines on Liquefaction Behaviour of Soils. Q. J. Eng. Geol. Hydrogeol. 2020, 53, 343–350. [Google Scholar]
  27. Belkhatir, M.; Arab, A.; Belkhatir, M. Fines Content and Cyclic Preloading Effect on Liquefaction Potential of Silty Sands. Acta Polytech. Hung. 2012, 9, 185–200. [Google Scholar]
  28. Bouferra, R.; Shahrour, I. Liquefaction Susceptibility Study of Sandy Soils: Effect of Low Plastic Fines. Arab. J. Geosci. 2013, 6, 4083–4091. [Google Scholar] [CrossRef]
  29. Thevanayagam, S.; Shenthan, T.; Mohan, S.; Liang, J. Undrained Fragility of Clean Sands, Silty Sands, and Sandy Silts. J. Geotech. Geoenviron. Eng. 2002, 128, 849–859. [Google Scholar] [CrossRef]
  30. Rao, S.E.; Varghese, V.; Patel, S. An Experimental Study on Effect of Plastic Fines Content on Liquefaction Properties of Sand. In Proceedings of the 50th Indian Geotechnical Conference, Pune, India, 17–19 December 2015. [Google Scholar]
  31. Goudarzy, M.; Sarkar, D.; Lieske, W.; Wichtmann, T. Influence of Plastic Fines Content on the Liquefaction Susceptibility of Sands: Cyclic Loading. Acta Geotech. 2022, 17, 4977–4988. [Google Scholar] [CrossRef]
  32. Vaid, Y.P.; Sivathayalan, S. Fundamental Factors Affecting Liquefaction Susceptibility of Sands. Can. Geotech. J. 2000, 37, 592–606. [Google Scholar] [CrossRef]
  33. Yang, J.; Sato, T.; Koseki, J. Undrained Cyclic Behavior of Sand under Anisotropic Consolidation and Its Application to Liquefaction Analysis. Soils Found. 2006, 46, 135–147. [Google Scholar]
  34. Mesri, G.; Stark, T.D.; Chen, C.S.; Choi, Y.L. The Chicago-O’Hare Test Embankment: Prediction and Performance. Géotechnique 1990, 40, 231–244. [Google Scholar]
  35. Yamaguchi, A.; Mori, T.; Kazama, M.; Yoshida, N. Liquefaction in Tohoku District during the 2011 off the Pacific Coast of Tohoku Earthquake. Soils Found. 2012, 52, 811–829. [Google Scholar] [CrossRef]
  36. Casagrande, A. Liquefaction and Cyclic Mobility of Sands: A Critical Review. In Proceedings of the 5th Pan American Conference on Soil Mechanics and Foundation Engineering, Buenos Aires, Argentina, 17–22 November 1975; Volume 5, pp. 80–133. [Google Scholar]
  37. Polito, C.P. The Effects of Non-Plastic and Plastic Fines on the Liquefaction of Sandy Soils. Ph.D. Thesis, Virginia Polytechnic Institute and State University, Blacksburg, VA, USA, 1999; p. 289. [Google Scholar]
  38. Wang, W. Some Findings in Soil Liquefaction; Report; Water Conservancy and Hydro-Electric Power Scientific Research Institute: Beijing, China, 1979; pp. 1–17. [Google Scholar]
  39. Jennings, P.C. Earthquake Engineering and Hazards Reduction in China; CSCPRC Report No. 8; National Academy of Sciences: Washington, DC, USA, 1980. [Google Scholar]
  40. Seed, H.B.; Lee, K.L.; Idriss, I.M.; Makdisi, F. Analysis of the Slides in the San Fernando Dams During the Earthquake of February 9, 1971; Report No. UCB/EERC 73-2; Earthquake Engineering Research Center, University of California: Berkeley, CA, USA, 1973. [Google Scholar]
  41. Marcuson, W.F.; Hynes, M.E.; Franklin, A.G. Evaluation and Use of Residual Strength in Seismic Safety Analysis of Embankments. Earthq. Spectra 1990, 6, 529–572. [Google Scholar] [CrossRef]
  42. Finn, W.L.; Ledbetter, R.H.; Wu, G. Liquefaction in Silty Soils: Design and Analysis. In Ground Failures Under Seismic Conditions; Geotechnical Special Publication No. 44; ASCE: Reston, VA, USA, 1994; pp. 51–76. [Google Scholar]
  43. Koester, J.P. The Influence of Fine Type and Content on Cyclic Strength. In Ground Failures Under Seismic Conditions; Geotechnical Special Publication No. 44; ASCE: Reston, VA, USA, 1994; pp. 17–33. [Google Scholar]
  44. Andrews, D.C.A.; Martin, G.R. Criteria for Liquefaction of Silty Soils. In Proceedings of the 12th World Conference on Earthquake Engineering, Auckland, New Zealand, 30 January–4 February 2000. [Google Scholar]
  45. Polito, C.P. Plasticity Based Liquefaction Criteria. In Proceedings of the 4th International Conference on Recent Advances in Geotechnical Earthquake Engineering and Soil Dynamics, San Diego, CA, USA, 29 March 2001; University of Missouri-Rolla: Rolla, MO, USA, 2001. [Google Scholar]
  46. Seed, R.B.; Cetin, K.O.; Moss, R.E.S.; Kammerer, A.M.; Wu, J.; Pestana, J.M.; Riemer, M.F.; Sancio, R.B.; Bray, J.D.; Kayen, R.E.; et al. Recent Advances in Soil Liquefaction Engineering: A Unified and Consistent Framework. In Proceedings of the 26th Annual ASCE Los Angeles Geotechnical Spring Seminar, Long Beach, CA, USA, 30 April 2003. [Google Scholar]
  47. Boulanger, R.W.; Idriss, I.M. Liquefaction Susceptibility Criteria for Silts and Clays. J. Geotech. Geoenviron. Eng. 2006, 132, 1413–1426. [Google Scholar] [CrossRef]
  48. Prakash, S.; Puri, V.K. Recent Advances in Liquefaction of Fine-Grained Soils. In Proceedings of the International Conferences on Recent Advances in Geotechnical Earthquake Engineering and Soil Dynamics, San Diego, CA, USA, 24 May 2010. [Google Scholar]
  49. Uprety, S.; Puri, V. Effect of Plasticity on Liquefaction of a Selected Fine-Grained Soil. In Geo-Congress 2019: Earthquake Engineering and Soil Dynamics (GSP 308); ASCE: Reston, VA, USA, 2019. [Google Scholar] [CrossRef]
  50. Ghani, S.; Kumari, S. Liquefaction Study of Fine-Grained Soil Using Computational Model. Innov. Infrastruct. Solut. 2021, 6, 58. [Google Scholar] [CrossRef]
  51. ASTM D4318-17e1; Standard Test Method for Liquid Limit, Plastic Limit, and Plasticity Index of Soils. ASTM International: West Conshohocken, PA, USA, 2017; Volume 4.08[1].
  52. ASTM D5311/D5311M-13; Standard Test Method for Load-Controlled Cyclic Triaxial Strength of Soil. ASTM International: West Conshohocken, PA, USA, 2013; Volume 4.08[1].
  53. Ladd, R.S. Preparing Test Specimens Using Undercompaction. Geotech. Test. J. 1978, 1, 16–23. [Google Scholar] [CrossRef]
  54. ASTM D2487-17; Standard Practice for Classification of Soils for Engineering Purposes (Unified Soil Classification System). ASTM International: West Conshohocken, PA, USA, 2020; Volume 4.08[1].
Figure 1. Axial stress as a function of cycles of loading for a soil undergoing a flow liquefaction failure (based on data from Polito [37]).
Civileng 06 00031 g001
Figure 2. Deviator stress and excess pore pressure for a specimen undergoing cyclic mobility (based on data from Polito [37]).
Civileng 06 00031 g002
Figure 3. Axial strain and excess pore pressure for a specimen undergoing cyclic mobility (based on data from Polito [37]).
Civileng 06 00031 g003
Figure 4. Axial stress as a function of cycles of loading for a soil undergoing a cyclic mobility failure (based on data from Polito [37]).
Civileng 06 00031 g004
Figure 5. Grain-size-distribution curves for the soils used in the study (based on data from Polito [37]). The mean grain size is the average of the two smaller particle dimensions and is related to the size of the opening in the sieve on which the particle was retained.
Civileng 06 00031 g005
Figure 6. Cyclic resistance curve for a soil with a cyclic resistance ratio, N10, of 0.25.
Civileng 06 00031 g006
Figure 7. Flow liquefaction and cyclic mobility plotted on a soil classification chart (based on data from Polito [37]).
Civileng 06 00031 g007
Figure 8. Axial strain versus cycles of loading for a soil undergoing flow liquefaction (based on data from Polito [37]).
Civileng 06 00031 g008
Figure 9. Axial strain versus cycles of loading for a soil undergoing cyclic mobility (based on data from Polito [37]).
Civileng 06 00031 g009
Figure 10. The cyclic resistances of soils prepared to a constant relative density as a function of their fines content and composition (based on data from Polito [37]).
Civileng 06 00031 g010
Table 1. The Chinese Criteria. Soils meeting these criteria are considered non-liquefiable.
ConditionThreshold
Maximum epicentral distance (km)Log Dmax = 0.87 M − 4.5
Minimum intensity6
Mean grain size, D50 (mm)D50 < 0.02 mm or D50 > 1.0 mm
Clay content (% <0.005 μm)Clay content > 10%
Coefficient of uniformity, CuCu > 10
Relative density (%)Dr > 75%
Void ratio, eE < 0.8
Plasticity index, PIPI> 10%
Depth to water table (m)Depth > 5 m
Depth to sand layer (m)Depth > 20 m
Table 2. Recent plasticity-based liquefaction susceptibility criteria.
AuthorsLiquefiable?LL (%)PI (%)w/LL% FinerRef.
Andrews and Martin [44]Yes<32%----< 10[27]
Polito [45]Yes≤25%PI < 7----[28]
Potentially25 ≤ LL ≤ 357 < PI < 10----
Seed et al. [46]Yes<37PI < 12>0.8--[29]
Potentially37 < LL < 4712 < PI < 20>0.85--
Bray and Sancio [12]Yes--PI < 12
12 < PI < 18
>0.85
>0.8
--[30]
Boulanger and Idriss [47]Yes--< 3----[31]
Potentially--3 < PI < 7----
Table 3. Index properties of the soils tested (based on data from Polito [37]).
Yatesville SandYatesville SiltKaoliniteBentonite
USCS classificationSPMLCHCH
Specific gravity, Gs2.722.782.602.69
Median grain size, D50 (mm)0.180.030.0050.004
Liquid limit, LLNot testedNot tested58385
Plastic limit, PLNot testedNot tested2742
Plasticity index, PINot testedNot tested31343
Table 4. Plasticity data for soil mixtures (based on data from Polito [37]).
FinesFinesClay
ContentTypeContentLLPLPIActivity
0--0------0
4K4.017----0
4M/K2.020----0
4M0------0
7K7.019----0
7M/K3.519----0
7M0------0
12Bent12.04828201.67
12K12.017----0
12M/K6.017----0
12M0------0
17K/B17.04122191.12
17K17.018----0
17M/K8.515----0
17M/K/B11.3312470.93
17M0------0
26K26.0201370.27
26M/K13.0151410.15
26M0------0
37K37.0211380.22
37M0------0
Where M = Yatesville non-plastic silt, K = kaolinite, and B = bentonite.
Table 5. Cyclic triaxial test results (based on data from Polito [37]).
CyclicCycles Cyclic
FileFinesFinesClayStressto ResistanceFailure
NameTypeContentContentRatioInitialLLPIRatioMode
(%)(%) Liq’n N10
YMK4C15M/K420.12128
YMK4C16M/K420.1202220--0.140FL
YMK4C18M/K420.1486
YMK7C18M/K73.50.14720
YMK7C20M/K73.50.1591019--0.164FL
YMK7C22M/K73.50.1787
YMK12C15M/K1260.11424
YMK12C18M/K1260.142817--0.136FL
YMK12C20M/K1260.1585
YMK17C14M/K178.50.10520
YMK17C16M/K178.50.1251015--0.132FL
YMK17C18M/K178.50.1396
YMK26C14M/K26130.11025
YMK26C16M/K26130.1221415--0.124FL
YMK26C18M/K26130.1447
YK4C10K440.07030
YK4C17K440.1281617--0.142FL
YK4C20K440.1518
YK7C17K770.13313
YK7C20K770.1481219--0.164FL
YK7C22K770.1734
YK12C12K12120.08040
YK12C15K12120.1081317--0.11FL
YK12C20K12120.1393
YK17C12K17170.08446
YK17C15K17170.1111018--0.132FL
YK17C17K17170.1247
YK26C12K26260.06197
YK26C16K26260.12472070.111CM
YK26C18K26260.1375
YK37C14K37370.108167
YK37C20K37370.143222180.171CM
YK37C23K37370.1975
YMKB17C21M/K/B1711.30.17010
YMKB17C23M/K/B1711.30.18363170.17CM
YMKB17C25M/K/B1711.30.1965
YKB17C19K/B17170.14849
YKB17C21K/B17170.1711341190.183CM
YKB17C23K/B17170.1958
YB12C20B12120.16623
YB12C22B12120.1881448200.218CM
YB12C24B12120.20114
Disclaimer/Publisher’s Note: The statements, opinions and data contained in all publications are solely those of the individual author(s) and contributor(s) and not of MDPI and/or the editor(s). MDPI and/or the editor(s) disclaim responsibility for any injury to people or property resulting from any ideas, methods, instructions or products referred to in the content.

