Article

Assessing the Capability of Computational Fluid Dynamics Models in Replicating Wind Tunnel Test Results for the Rose Fitzgerald Kennedy Bridge

1
School of Civil Engineering, University College Dublin, Belfield, D04 V1W8 Dublin, Ireland
2
School of Mechanical and Materials Engineering, University College Dublin, Belfield, D04 V1W8 Dublin, Ireland
3
Transport Infrastructure Ireland, Parkgate Business Centre, D08 DK10 Dublin, Ireland
*
Author to whom correspondence should be addressed.
CivilEng 2021, 2(4), 1065-1090; https://doi.org/10.3390/civileng2040057
Submission received: 7 October 2021 / Revised: 29 November 2021 / Accepted: 2 December 2021 / Published: 19 December 2021
(This article belongs to the Special Issue Early Career Stars in Civil Engineering)

Abstract

:
Despite its wide acceptance in various industries, CFD is considered a secondary option to wind tunnel tests in bridge engineering due to a lack of confidence. To increase confidence and to advance the quality of simulations in bridge aerodynamic studies, this study performed three-dimensional RANS simulations and DESs to assess the bridge deck aerodynamics of the Rose Fitzgerald Kennedy Bridge and demonstrated detailed procedures of the verification and validation of the applied CFD model. The CFD simulations were developed in OpenFOAM, the results of which are compared to prior wind tunnel test results, where general agreements were achieved though differences were also found and analyzed. The CFD model was also applied to study the effect of fascia beams and handrails on the bridge deck aerodynamics, which were neglected in most research to-date. These secondary structures were found to increase drag coefficients and reduce lift and moment coefficients by up to 32%, 94.3%, and 52.2%, respectively, which emphasized the necessity of including these structures in evaluations of the aerodynamic performance of bridges in service. Details of the verification and validation in this study illustrate that CFD simulations can determine close results compared to wind tunnel tests.

1. Introduction

Hazardous wind conditions can lead to various problems for long-span bridges. The collapse of the Tacoma Narrows Bridge has shown the catastrophic failure that flutter can cause; this has driven engineers to carefully take into account the aerodynamic analysis within procedures of bridge design. Although similar bridge failures due to divergent aeroelastic effects did not occur after that, it has been witnessed that the wind effect can seriously influence the serviceability of long-span bridges, especially cable-supported bridges. For instance, according to a report by Kumarasena et al. [1], many long-span cable-stayed bridges encountered severe rain–wind-induced vibrations (RWIVs). Vortex-induced vibrations (VIVs) were observed at the Trans-Tokyo Bay Crossing Bridge, as reported by Fujino and Yoshida [2]. More recently, in 2020, large oscillations of the bridge deck occurred at the Humen Pearl Bridge, which was also believed to be VIVs and caused a complete shutdown of the bridge [3]. Therefore, accurately estimating wind actions on bridges has become an essential part of modern bridge design.
The traditional approach of estimating wind loads on long-span bridges is through the use of wind tunnel tests. Here, scaled models of the bridge are tested in wind tunnels, and aerodynamic forces are measured by sensors. This has been commonly adopted as an effective method to evaluate the aerodynamic performance of the bridge, providing useful information to bridge engineers and designers. Wind tunnel tests have been central to the design of recent landmark bridge structures, such as the Stonecutters Bridge, where the bridge deck was optimized using wind tunnel tests [4]. Similarly, wind tunnel test results were used to evaluate the safety of incomplete bridge sections during the construction of the Su-tong Bridge [5]. In the academic literature, wind tunnel tests have also been widely used to study aerodynamic problems of bridges such as vortex-induced vibrations [6,7,8,9], flutter instabilities [10,11,12,13], and cable vibrations [14,15,16,17]. Despite the great contributions that wind tunnel tests have made in bridge aerodynamic studies, there are several short-comings and limitations in the use of wind tunnel tests: the Reynolds number scaling effect [6]; the interference of flow caused by sensors and other apparatus [18]; and the approximation made in the inlet turbulence conditions [19]. In addition, conducting wind tunnel tests in bridge design practice is costly and can be difficult to schedule with the wind tunnel facility.
In recent times, the rapid development of applied mathematics and modern computational capacity, combined with the fundamental knowledge derived from wind tunnel studies, has enabled the implementation of numerical simulations based on computational fluid dynamics (CFD) in the study of bridge aerodynamics. Many studies have adopted CFD simulations to calculate aerostatic force coefficients to evaluate the aerodynamic performance of various bridge decks. Even with limited computational power, some pioneering studies [20,21,22] have shown the significant potential of CFD simulations in this area. Similar to the application of wind tunnel tests, CFD simulations have been adopted in the study of flutter [23,24,25], VIV [26,27,28,29], and RWIV [30,31,32,33]. On one hand, these numerical studies show good agreement with their corresponding wind tunnel results. On the other hand, CFD has been demonstrated to have a few advantages over wind tunnel tests. Firstly, CFD can be applied to investigate scenarios that would be considered infeasible as experiments. Secondly, CFD offers non-intrusive sampling, and so the results are not influenced by sensors and other apparatus. More importantly, compared to the wind tunnel tests, CFD offers significantly faster and more affordable solutions for steady-state problems. Such efficiency and affordability are crucial for bridge design, especially at the early stage when prototypes are frequently examined and updated.
Despite its contributions to bridge design, CFD modeling in bridge engineering has a few limitations. Firstly, the application of CFD modeling in bridge engineering is often considered a supplementary method to wind tunnel tests and needs to be validated by experiments [23,25,26,27,28], which indicates a lack of confidence in CFD. To overcome this, CFD modelling in bridge engineering should provide more comprehensive verification and validation of the numerical methods and solutions [34]. Secondly, the full capacity of CFD simulations was not demonstrated by most numerical studies. To save on computational power, most numerical studies in this area use simplified geometries of bridge structures where details are often neglected. To date, there has been relatively little research into the impact on aerodynamic coefficients of including secondary structures in CFD models. Liu et al. [35] studied the effect of multiple rails on the aerodynamic coefficient of a steel box bridge deck by performing two-dimensional (2D) RANS simulations with the k-ω SST turbulence model. It was found that the drag coefficients of bridge decks without any detailed structures were 30% to 40% smaller than those of bridge decks with guard rails installed. This finding emphasizes the necessity to consider secondary structures in simulations that were aimed to evaluate the bridge decks at the service stage. Li et al. [36] studied the effects of wind fairing angles on the dynamic performance of bridge decks by performing 2D URANS simulations with the k-ω SST turbulence model on bridge deck sections with maintenance rails and crash barriers. It was found that the amplitude of VIVs is positively correlated with the wind fairing angle, and one of the effective methods to mitigate VIVs is to reduce the vortex scale at the windward side of the upper surface of the bridge deck. However, the effect of central barriers and maintenance rails on the bridge deck aerodynamic performance was not investigated. Kusano et al. [37] conducted 2D URANS simulations with the k-ω SST turbulence model on bridge deck sections with guide vanes and railings that were designed to suppress VIVs. Through comparisons with bridge deck sections without any secondary structures, it was found that the installation of railings and guide vanes can increase drag coefficients of the bridge deck section by up to 66% and reduce the gradient of lift coefficients to angles of attack reduced by 22%. However, discrepancies of approximately 33%, 52%, and 88% were found in the comparison between numerically and experimentally determined drag, lift, and moment coefficients, respectively. Jeong et al. [38] evaluated the validity of 2D URANS simulations with the k-ω SST turbulence model in estimating aerodynamic force coefficients of twin-box bridge decks. Large discrepancies were found in the comparison of aerodynamic coefficients derived from simulations and wind tunnel tests, where lift and moment coefficients calculated from 2D simulations were 57% and 31% lower than wind tunnel, respectively. They suggested that the large discrepancies were due to the 3D effects that the 2D model neglected. Each of the aforementioned studies conducted simulations in 2D, which cannot account for flow development in the spanwise direction. He et al. [39] included the spanwise dimension and performed 3D RANS simulations with the k-ω SST turbulence model on a train–bridge system. They studied the effect of secondary structures (wind barriers for trains) on aerodynamic coefficients of both trains and bridge decks. It was found that low-porosity (30%) wind barriers struck a balance between increasing the drag and lift coefficients on bridge deck and reducing the drag coefficients of the trains.
To summarise, the use of CFD simulations in bridge engineering can be improved from two perspectives. Firstly, to make the findings of CFD simulations applicable for bridge decks beyond the construction state, in service, geometries used in the simulations should include all secondary structures. Secondly, there is a need to verify and validate the use of 3D RANS simulations with the k-ω SST turbulence model.
In this paper, 3D RANS CFD simulations with the k-ω SST turbulence model are developed to replicate wind tunnel test results for the Rose Kennedy Fitzgerald Bridge. Simulations are performed using the OpenFOAM-v6 modelling software to calculate aerodynamic coefficients of three bridge deck sections with multiple configurations of secondary structures. The purpose of this study is (1) to validate the use of 3D RANS simulations with the k-ω SST turbulence model in the estimation of aerodynamic coefficients by comparing to corresponding wind tunnel tests and (2) to investigate the effect of three different types of fascia beams and handrails on the aerodynamic performance of bridge decks. Initially, a description of the Rose Kennedy Fitzgerald bridge is provided, along with a description of the wind tunnel tests. Then, the CFD model developed for this work is presented, including details of the geometry of the model, the domain, the mesh, the governing equations, the boundary conditions, the numerical configuration, and the parallel configuration. The subsequent section details the verification of the model by way of a mesh-sensitivity study, a domain-sensitivity study, and a comparison of different turbulence modelling methods. The CFD model is then validated using the model described in Section 4, and simulations are presented for three different bridge decks. The results here are compared with those presented in the wind tunnel test report. Finally, an assessment is presented on the impact of secondary structures on aerodynamic coefficients. A flow chart (Figure 1) is presented to demonstrate the procedures of this study.

2. The Rose Kennedy Fitzgerald Bridge

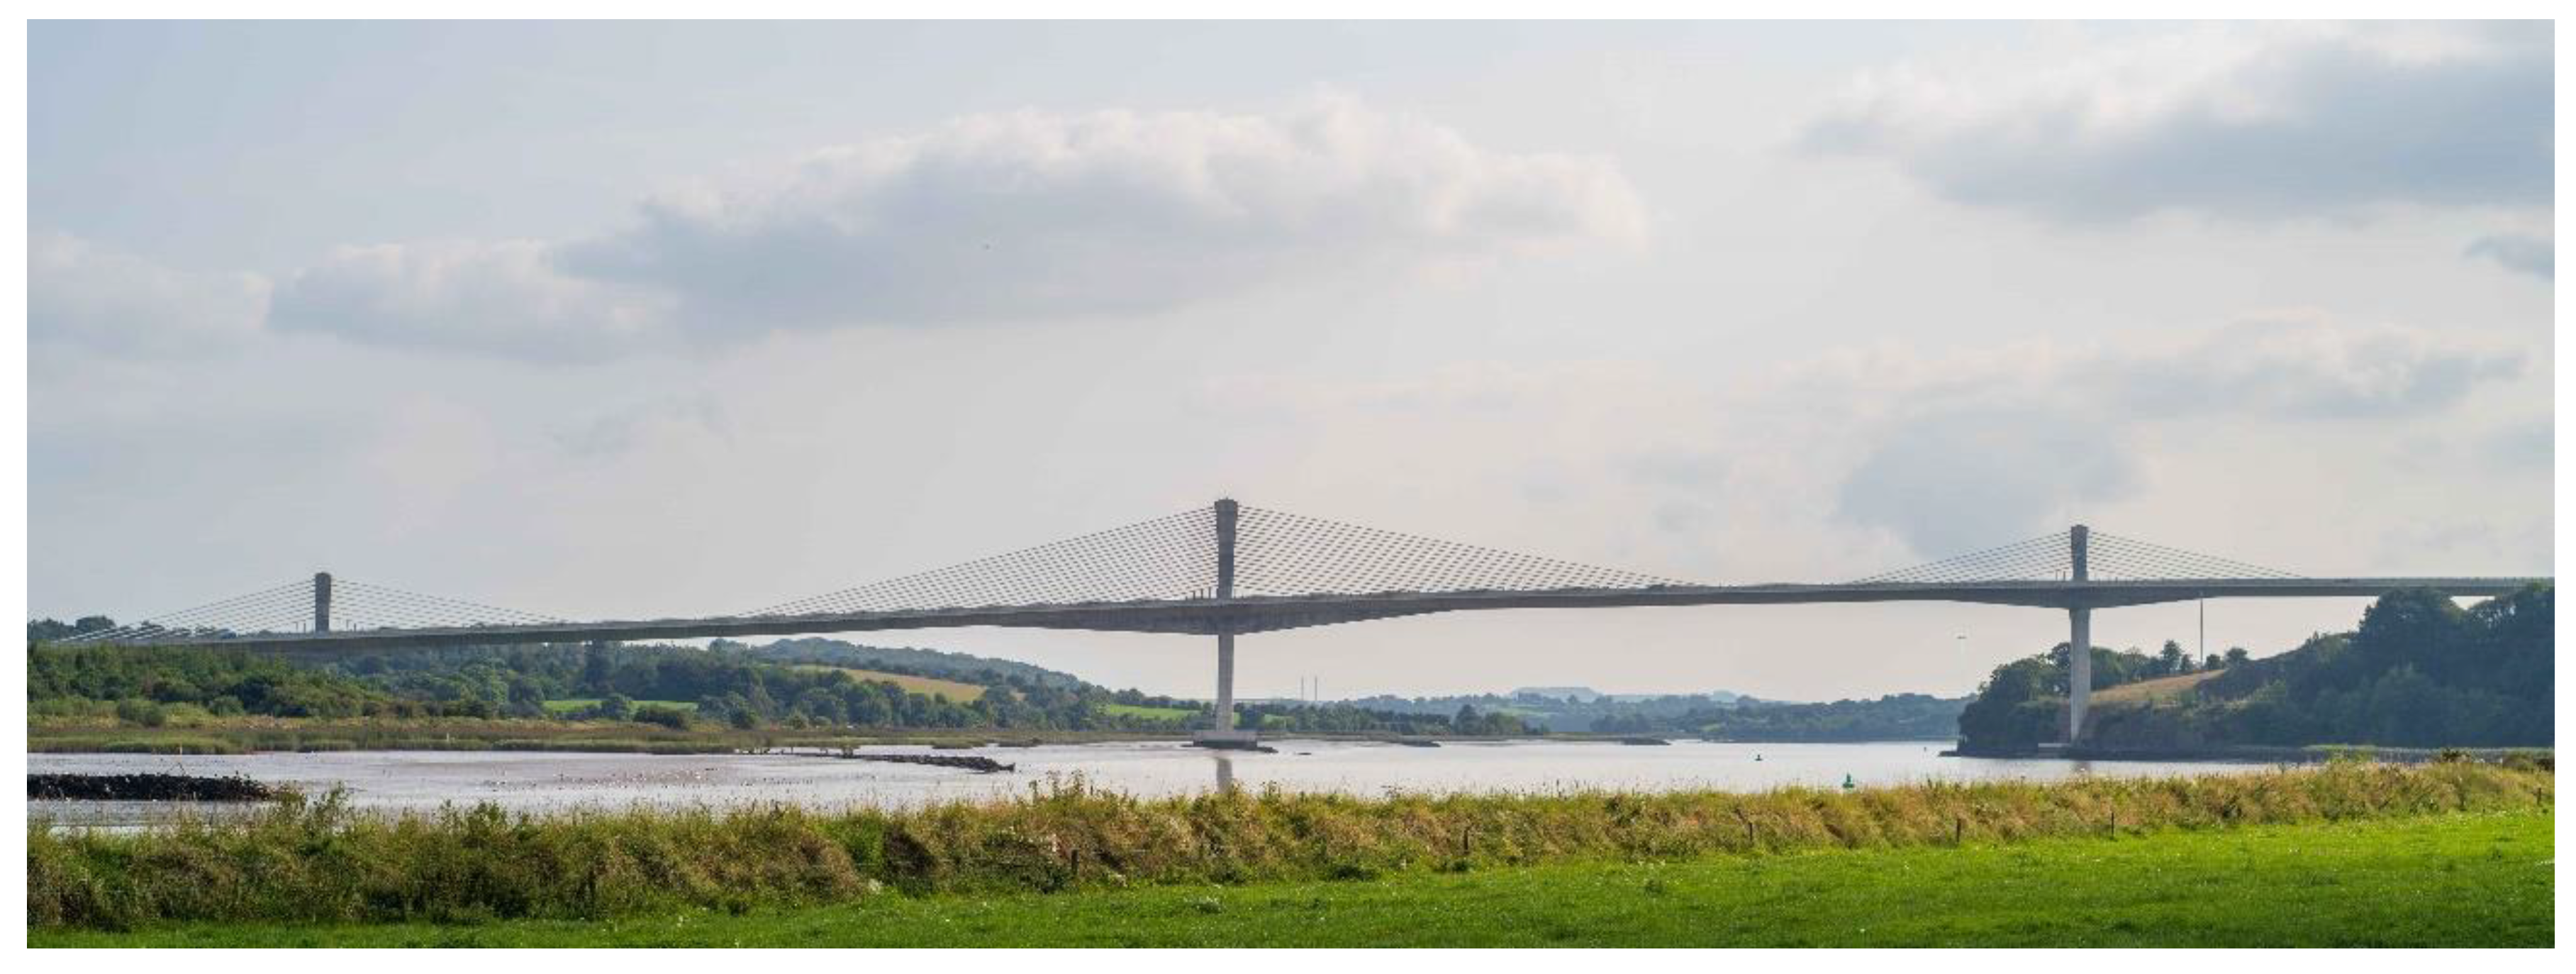
The Rose Kennedy Fitzgerald Bridge (Figure 2) serves as a second river crossing to bypass the town of New Ross, Co. Wexford, Ireland. It is an extrados bridge, i.e., a hybrid type of the box girder bridge and the cable-stayed bridge. It has a main span of 230 m, which is the longest extrados bridge with concrete box girder in the world [40]. In addition, it is currently the longest bridge in Ireland, with a full length of 887 m.

3. Description of the Wind Tunnel Tests

Given its length, wind effects were considered critical for the Rose Fitzgerald Kennedy bridge. Wind tunnel tests were performed in the ACLA-16 wind tunnel facility of the Instituto Universitario de Microgravedad, Spain. Figure 3 shows the cross section of the wind tunnel facility, which has a dimension of 2.2 m by 2.2 m. The testing chamber has a length of 20 m, enabling it to create wind flow with a velocity of up to 32 m/s. All wind tunnel tests in this study were performed in accordance with the wind tunnel practice guide by ASCE [41].
The geometries used in these tests are three sectional bridge deck models with a scale of 1/50 (Figure 4). As shown in Figure 4, all geometries have the same spanwise length of 0.72 m and effective width of 0.438 m. The shallow deck (Figure 4a), the medium deck (Figure 4b), and the deep deck (Figure 4c) have effective depths of 0.07 m, 0.13 m, and 0.17 m, respectively. The selection of the scale is a compromise between two concerns. On one hand, the smallest detail of the handrails in the model has a thickness 1.5×10⁻³ m at the selected scale, and further reducing the scale will make these details difficult to manufacture. On the other hand, limited by the size of the wind tunnel facility, larger scales will lead to blockage problems. The models were manufactured using several types of plywood and medium density fibreboard. This type of artificial wood has transversely isotropic properties and is widely used in carpentry and model manufacture.
Each one of these models was placed on a rotational plate that allowed it to be tested with a range of angles of attack from −10 degrees to 10 degrees (Figure 5 and Figure 6). These models and the rotational plate were located in the center of the testing chamber. The wind velocity was set at 5.9 m/s for all configurations, and turbulence was generated with an intensity of 15% and a mixing length of 0.68 m. Aerodynamic forces acting on the deck were measured using a six-component Delta SI 330-30 strain gauge, manufactured by ATI [42]. Measurements were taken for 60 s at a sampling frequency of 5000 Hz, from which time-averaged results of drag force (Fx), lift force (Fz), and pitching moment (My) were calculated. According to EN 1991-1-4 [43], based on these results, dimensionless force coefficients were calculated using Equations (1)–(3):
C F x = 2 F x ρ U 2 H L ,
C F z = 2 F z ρ U 2 B L ,
C M y = 2 M y ρ U 2 B 2 L ,
where C F x , C F z , C M y are drag, lift, and pitching moment coefficients, respectively; ρ is the density of the air, which is 1.225 kg/m3 that corresponds to the temperature of 15 °C; U is the reference velocity (5.9 m/s); B is the effective width of the section (0.438 m); H is the depth of the section; and L is the span of the section (0.72 m).

4. CFD Model

4.1. Geometry

The geometry used in the CFD simulations has the same dimensions of the model used in the wind tunnel test (Figure 4), including features such as fascia beams and handrails. The deck was firstly sketched in 2D and then extruded to 3D. Then, secondary structures, which are sketched as separate 3D solid parts, are attached on the bridge deck. The model is initially developed for the sectional bridge deck geometry with a depth of 0.13 m, replicating the same geometry used in the 1:50 scaled wind tunnel test of the medium deck. The other two geometries are investigated in Section 6. Like the wind tunnel test, there are 21 configurations in the CFD simulations, each of which simulates the bridge deck with a different angle of attack ranging from −10 degrees to +10 degrees with an increment of 1 degree. The sign convention and the rotated configurations are shown in Figure 5 and Figure 6, respectively.

4.2. Computational Domain

The computational domain (Figure 7) has a length (l) of 20 m and a depth (d) and a breadth (b) of 2.2 m, which are the same as that of the wind tunnel. A sensitivity study with respect to computational domain size has been performed, the results of which are presented in Section 5.2. Within the computational domain, there are three types of boundary region. The yellow face (Figure 7) is the inlet, the red face is the outlet, and the other four faces are defined as no-slip walls. The bridge geometry is placed in the center of the domain, the surface of which is also considered a no-slip wall.

4.3. Computational Mesh

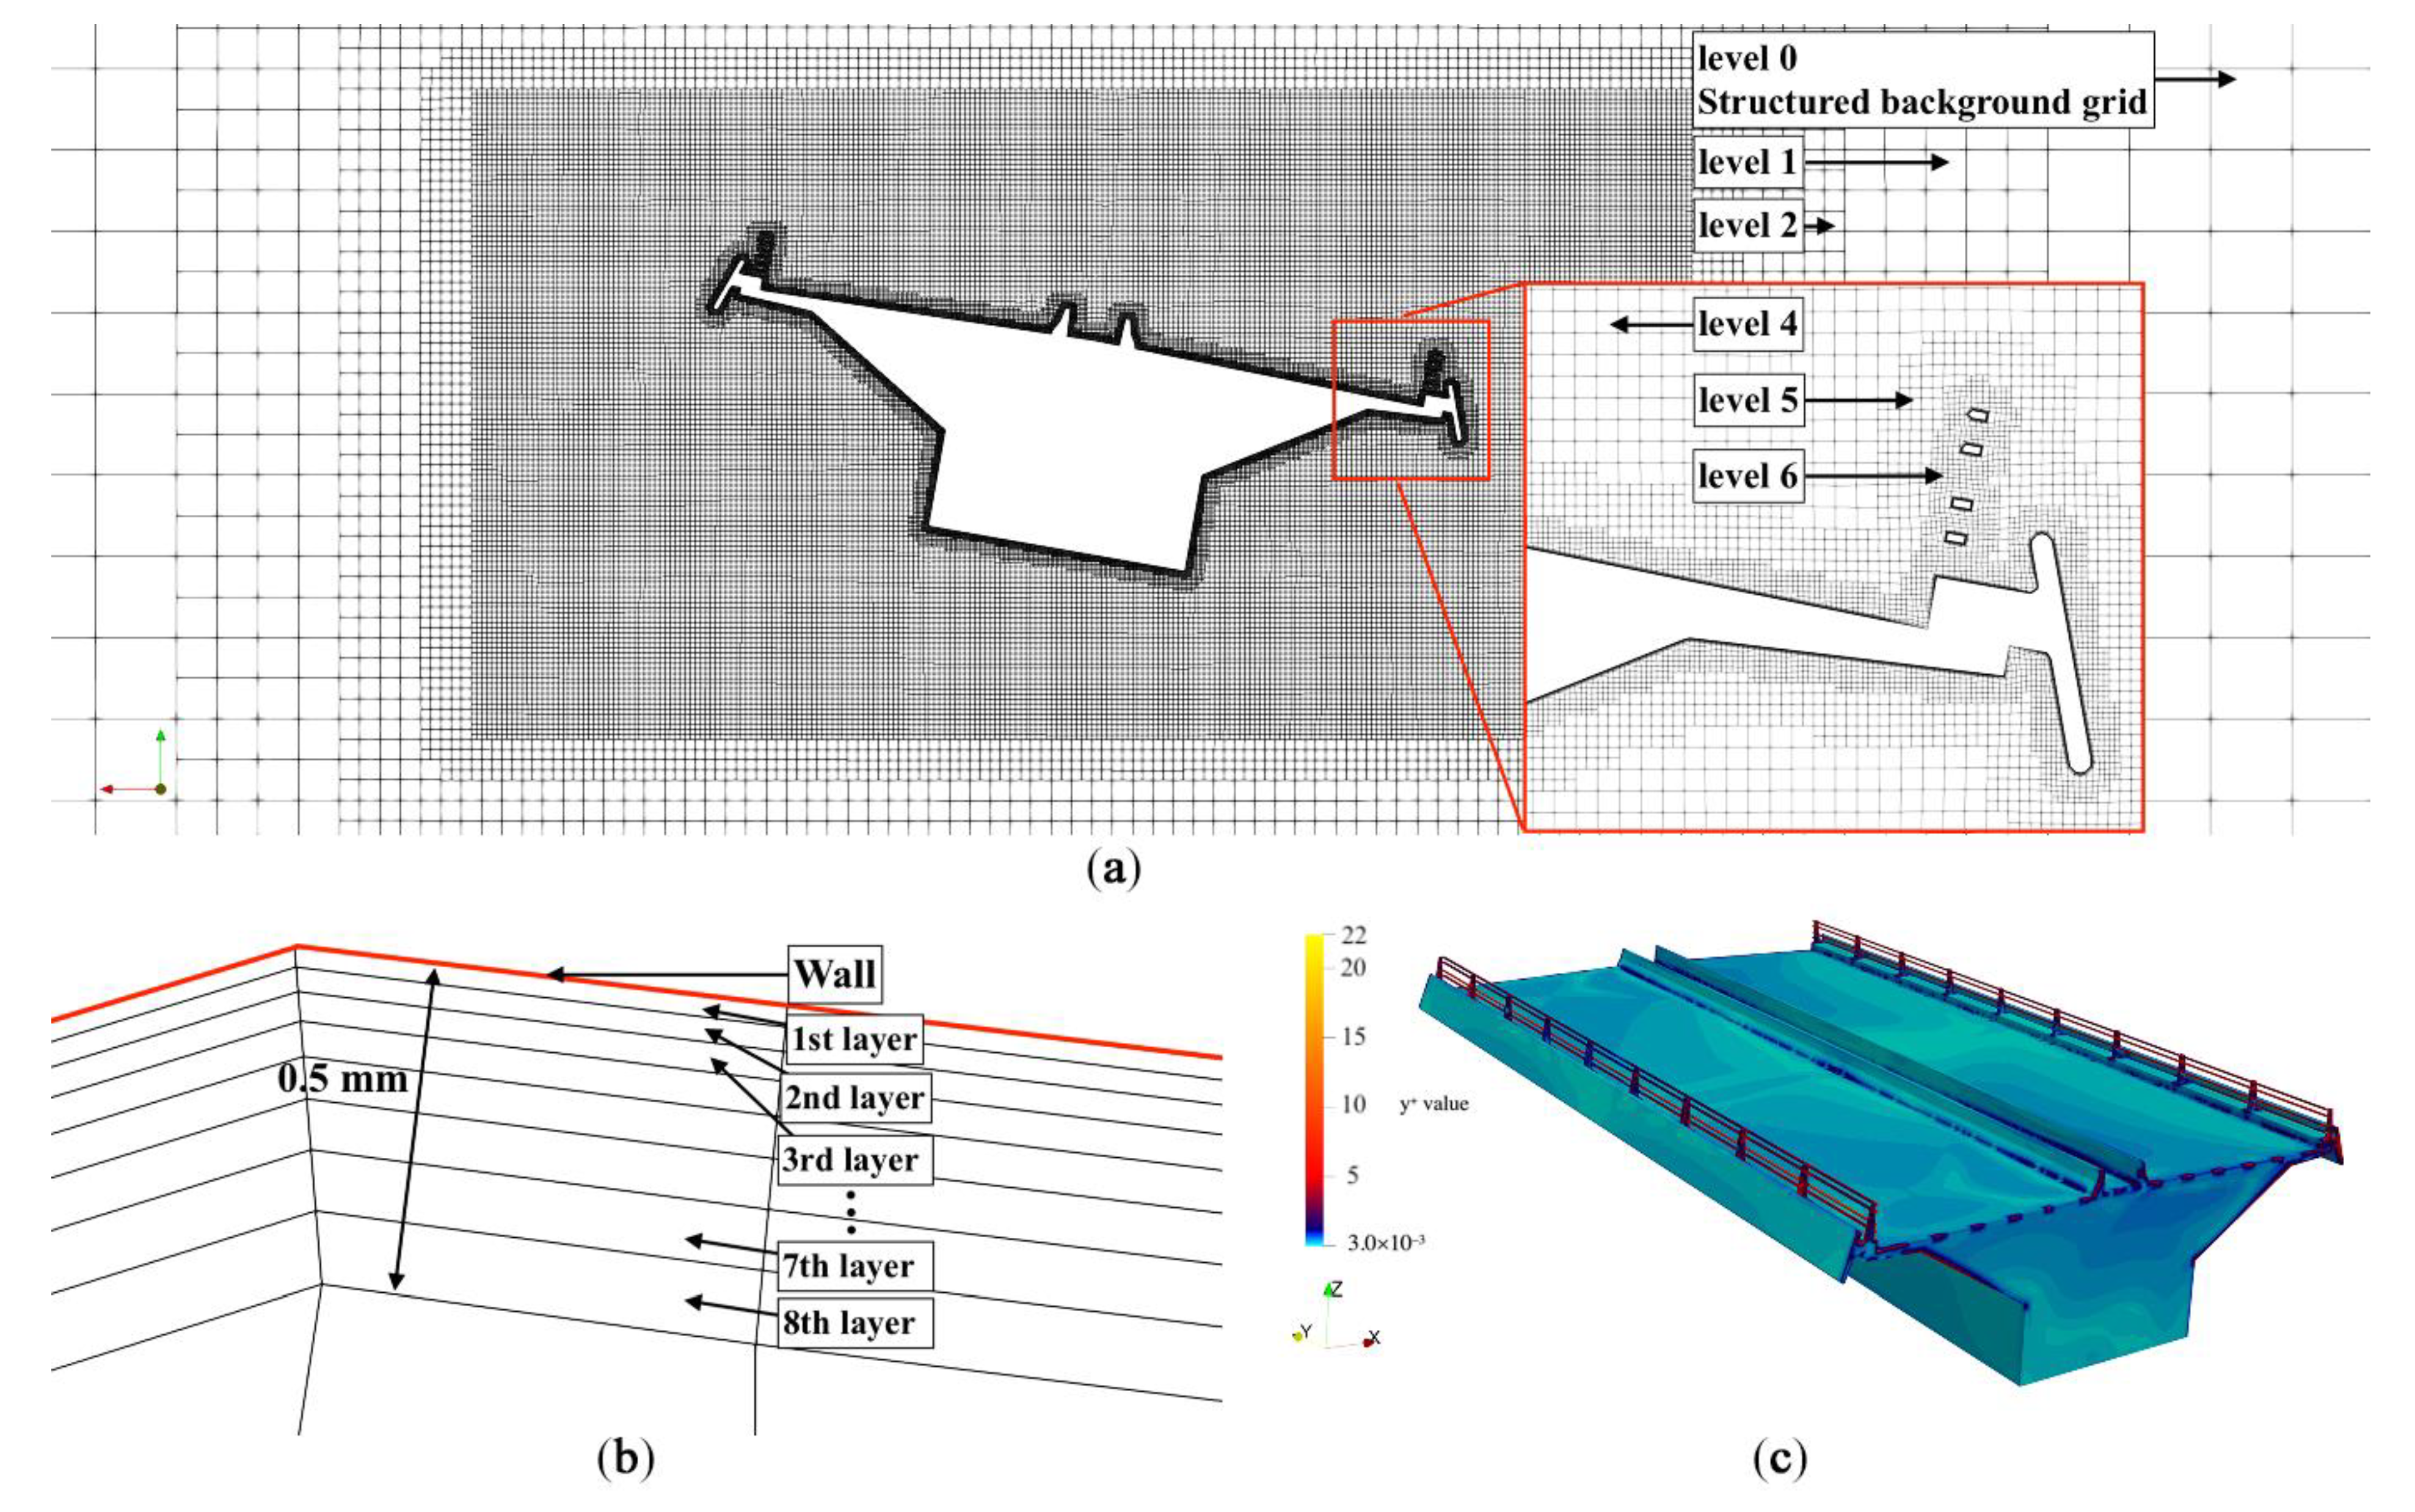
The computational mesh used in the simulations was created using OpenFOAM utilities snappyHexMesh and blockMesh. It is a hybrid mesh containing a structured background grid and an unstructured hexahedron-dominated mesh in the near-wall region. As shown in Figure 8a, regional refinement is applied around the bridge geometry with six levels. There are five buffer layers between two adjacent levels. As shown Figure 8b, eight layers of cells were placed on the bridge surface to resolve the viscous sublayer, with the thickness of 5 × 10⁻⁴ m; which corresponds to a maximum and mean y+ values of 1.3 and 0.35, respectively, at the bridge surface (Figure 8c). The total mesh contained approximately 35 million cells, depending on the angles of attack.

4.4. Governing Equations

In the presented CFD model, the flow within the testing domain is assumed to be incompressible, Newtonian, and statistically steady, with temperature and gravity effects neglected. The flow is governed by the Reynolds-averaged Navier–Stokes (RANS) formulation for mass and momentum:
U = 0 ,
( UU ) = [ ν eff ( U + ( U ) T ) ] p ,
where U is the time-averaged velocity, p is the time-averaged kinematic pressure (pressure divided by density), and νeff is the effective kinematic viscosity, which is the summation of laminar kinematic viscosity (ν) and the turbulent kinematic viscosity (νt). The value of ν is 1.47 × 10⁻⁵ m2/s, which corresponds to air at the temperature of the wind tunnel testing chamber (15 °C). The unknown νt is calculated from the turbulence kinetic energy (k) and the energy dissipation frequency (ω) using the k-ω SST turbulence model [44]. The use of the k-ω SST turbulence model has shown good performance in the study of bridge aerodynamics [27,29,30,45]. In addition, a comparison of different turbulence models is given in Section 5.3, where νt is calculated from k and the energy dissipation rate (ε) using the k-ε model and the modified turbulence viscosity (   ν ˜   ) using the Spalart–Allmaras (SAS) model.

4.5. Boundary Conditions

A summary of boundary conditions of the four primary unknowns (U, p, k, and ω) applied at each boundary region is shown in Table 1.
Boundary conditions at the inlet patch are configured to replicate the inlet turbulence generated in the wind tunnel tests, where U is set to be the mean wind velocity of the wind tunnel test (5.9 m/s in x-direction); p is given a Neumann condition; and k and ω are initialized using Equations (6) and (7):
k = 3 2 ( U I ) 2 ,
ω = 0.09 1 4 k l ,
where I is the turbulence intensity (15%); and l is the mixing length (0.68 m), as defined in the wind tunnel tests. All wall regions are no-slip walls, where k and ω are configured with adaptive wall functions built in OpenFOAM, which can switch between near-wall strategies of high and low Reynolds number based on the y+ value.

4.6. Numerical Configuration

In this study, all RANS simulations employ the SIMPLE algorithm [46] to perform the pressure–velocity coupling (simpleFoam solver in OpenFOAM-v6). All terms in the RANS equations are discretized using the nominally second-order cell-centered finite volume method [47], where gradient and Laplacian terms are discretized using Gaussian integration with linear interpolation. Convection/advection terms are discretized using a second-order accurate linear-upwind scheme. A summary of linear solvers used in the solutions is presented in Table 2.
In addition to RANS simulations, detached-eddy simulations (DESs) are performed for the comparison of different turbulence modelling methods. The DES is a hybrid of the large-eddy simulation (LES) and the RANS simulation that resolves large-scaled vortices in the freestream region as in LESs and model the eddies in the near-wall region, as in the RANS simulation. The DES provides more accurate solutions than using RANS simulations and is computationally more affordable than performing LESs. In this study, spatial schemes and linear solvers of the DESs remain identical to those in the RANS simulations. The Euler implicit scheme is used for the time discretization. The PIMPLE algorithm is employed, which is a hybrid of the SIMPLE algorithm and the PISO algorithm [50]. Here, the time step is initialized with a value of 5 × 10⁻⁷ s. The actual time step after the first iteration is gradually increased until the maximum Courant number reaches 4, leading to an average time step of 1×10⁻⁵ s. The transient simulations require significantly more computational power than steady-state simulations. Therefore, only four configurations of the bridge deck model are simulated: −10°, −5°, 5°, and 10°. It took approximately 500 h on 128 CPU cores to run each of these simulations.

4.7. Parallel Configuration

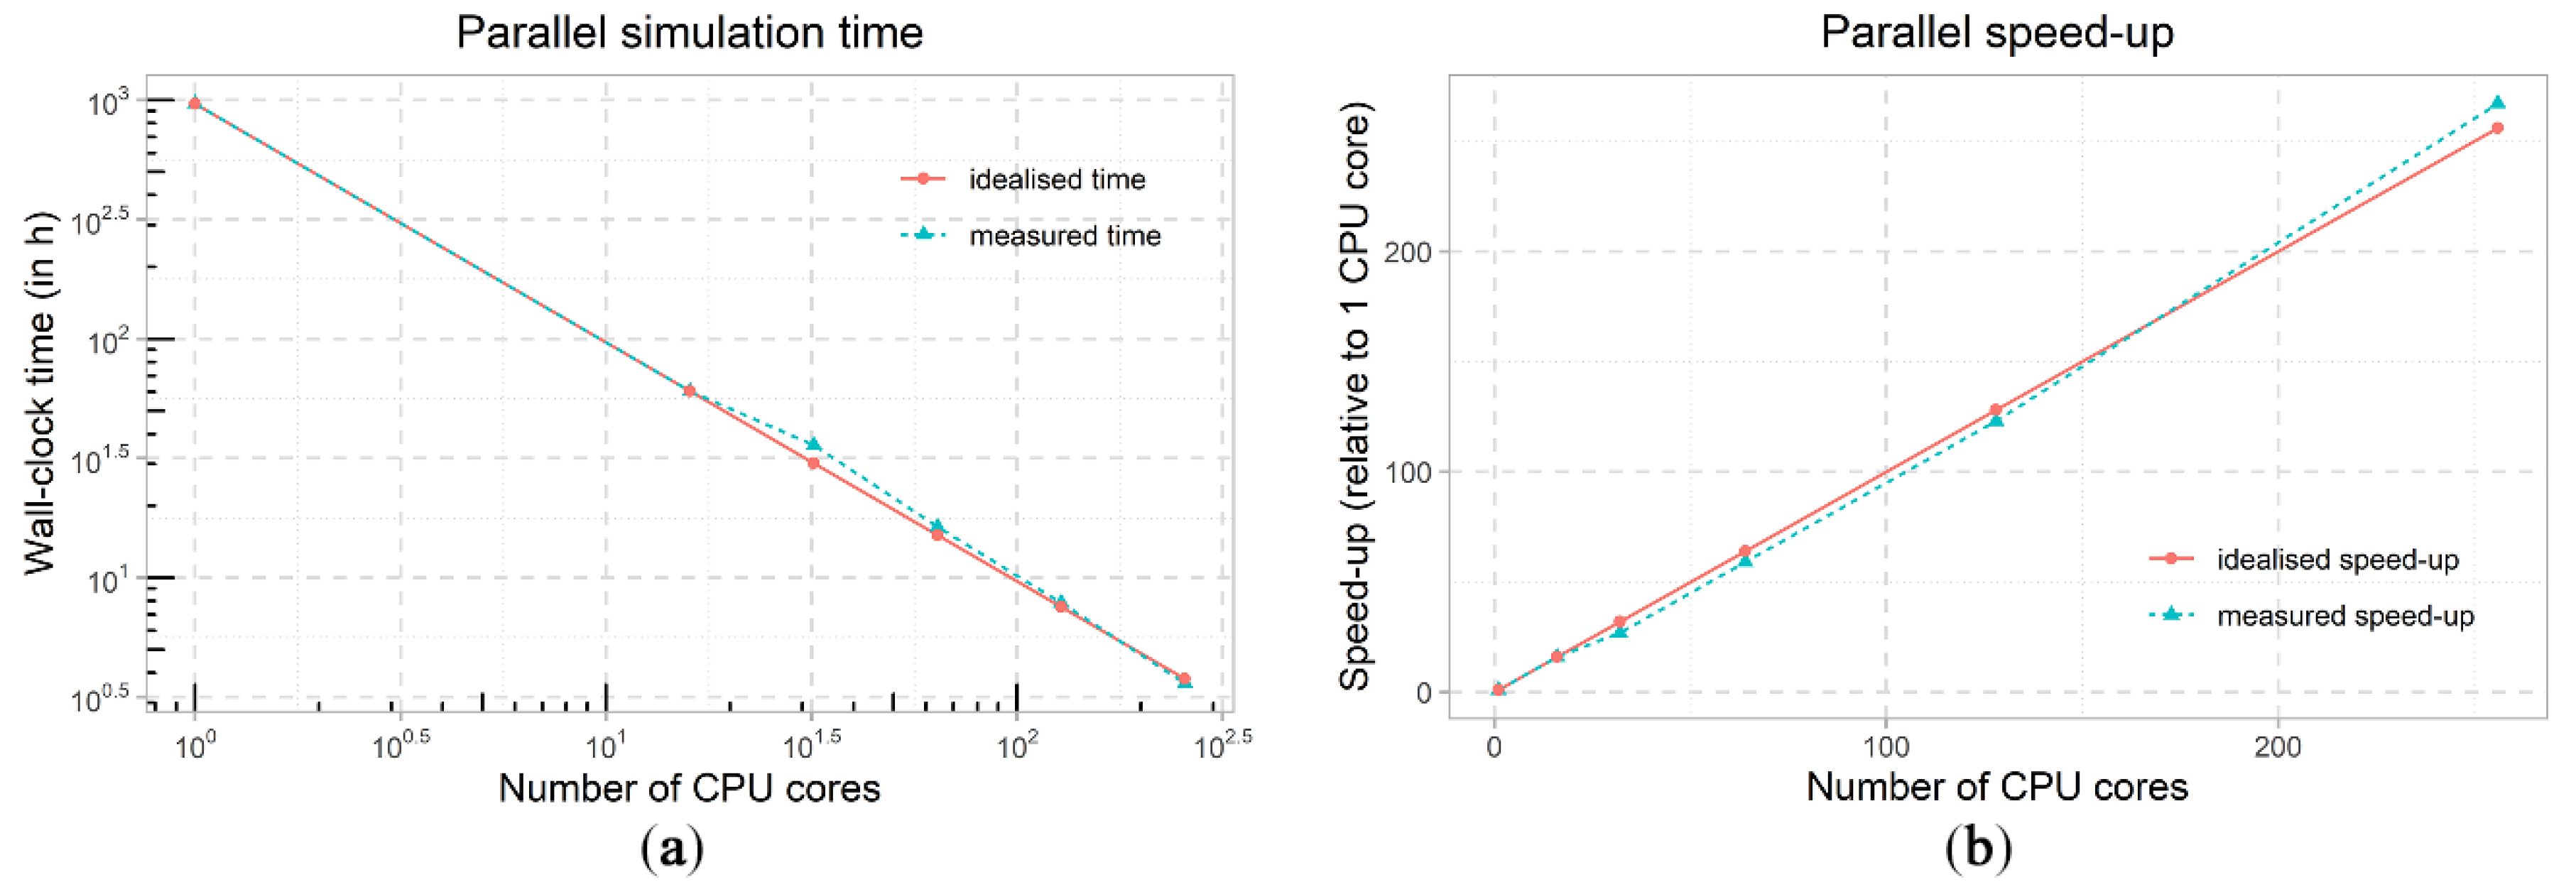
All simulations in this study are performed in parallel on the Irish Centre for High-End Computing (ICHEC) Kay server (Intel Xeon Gold 6148 processors running at 2.4 GHz). To assess the parallel efficiency of the method, the simulation is run for 6000 iterations with different numbers of CPU cores. The computational mesh was decomposed using the SCOTCH algorithm [51]. Results of this parallel strong scaling test are given in Table 3, based on which, the simulation time and simulation speed-up are plotted in Figure 9a,b, respectively.
In Figure 9a, the simulation time is shown to reduce from over one month (965 h) on 1 CPU core to 3.6 h when performed on 256 cores. This information is presented in terms of speed-up in Figure 8b. Ideally, the simulation should scale linearly, i.e., using 64 CPU cores should speed up the simulation 64 times. However, Figure 9b shows that using 64 or fewer cores does not reach the idealized speed-up rate. In contrast, the model shows a super-linear parallel speed-up, where using 256 cores speeds up the simulation by a factor of 267 versus using 1 CPU core. This can be explained by the cache effects [52]. Similar super-linear parallel efficiency was also seen in simulations using the OpenFOAM software by Cardiff et al. [53]. In addition, although using 256 cores will further speed up the simulation, the queueing time on the server will be significantly longer, and so the maximum number of CPU cores used in the current study is 128.

5. Verification of the CFD Models

5.1. Mesh Sensitivity Analysis

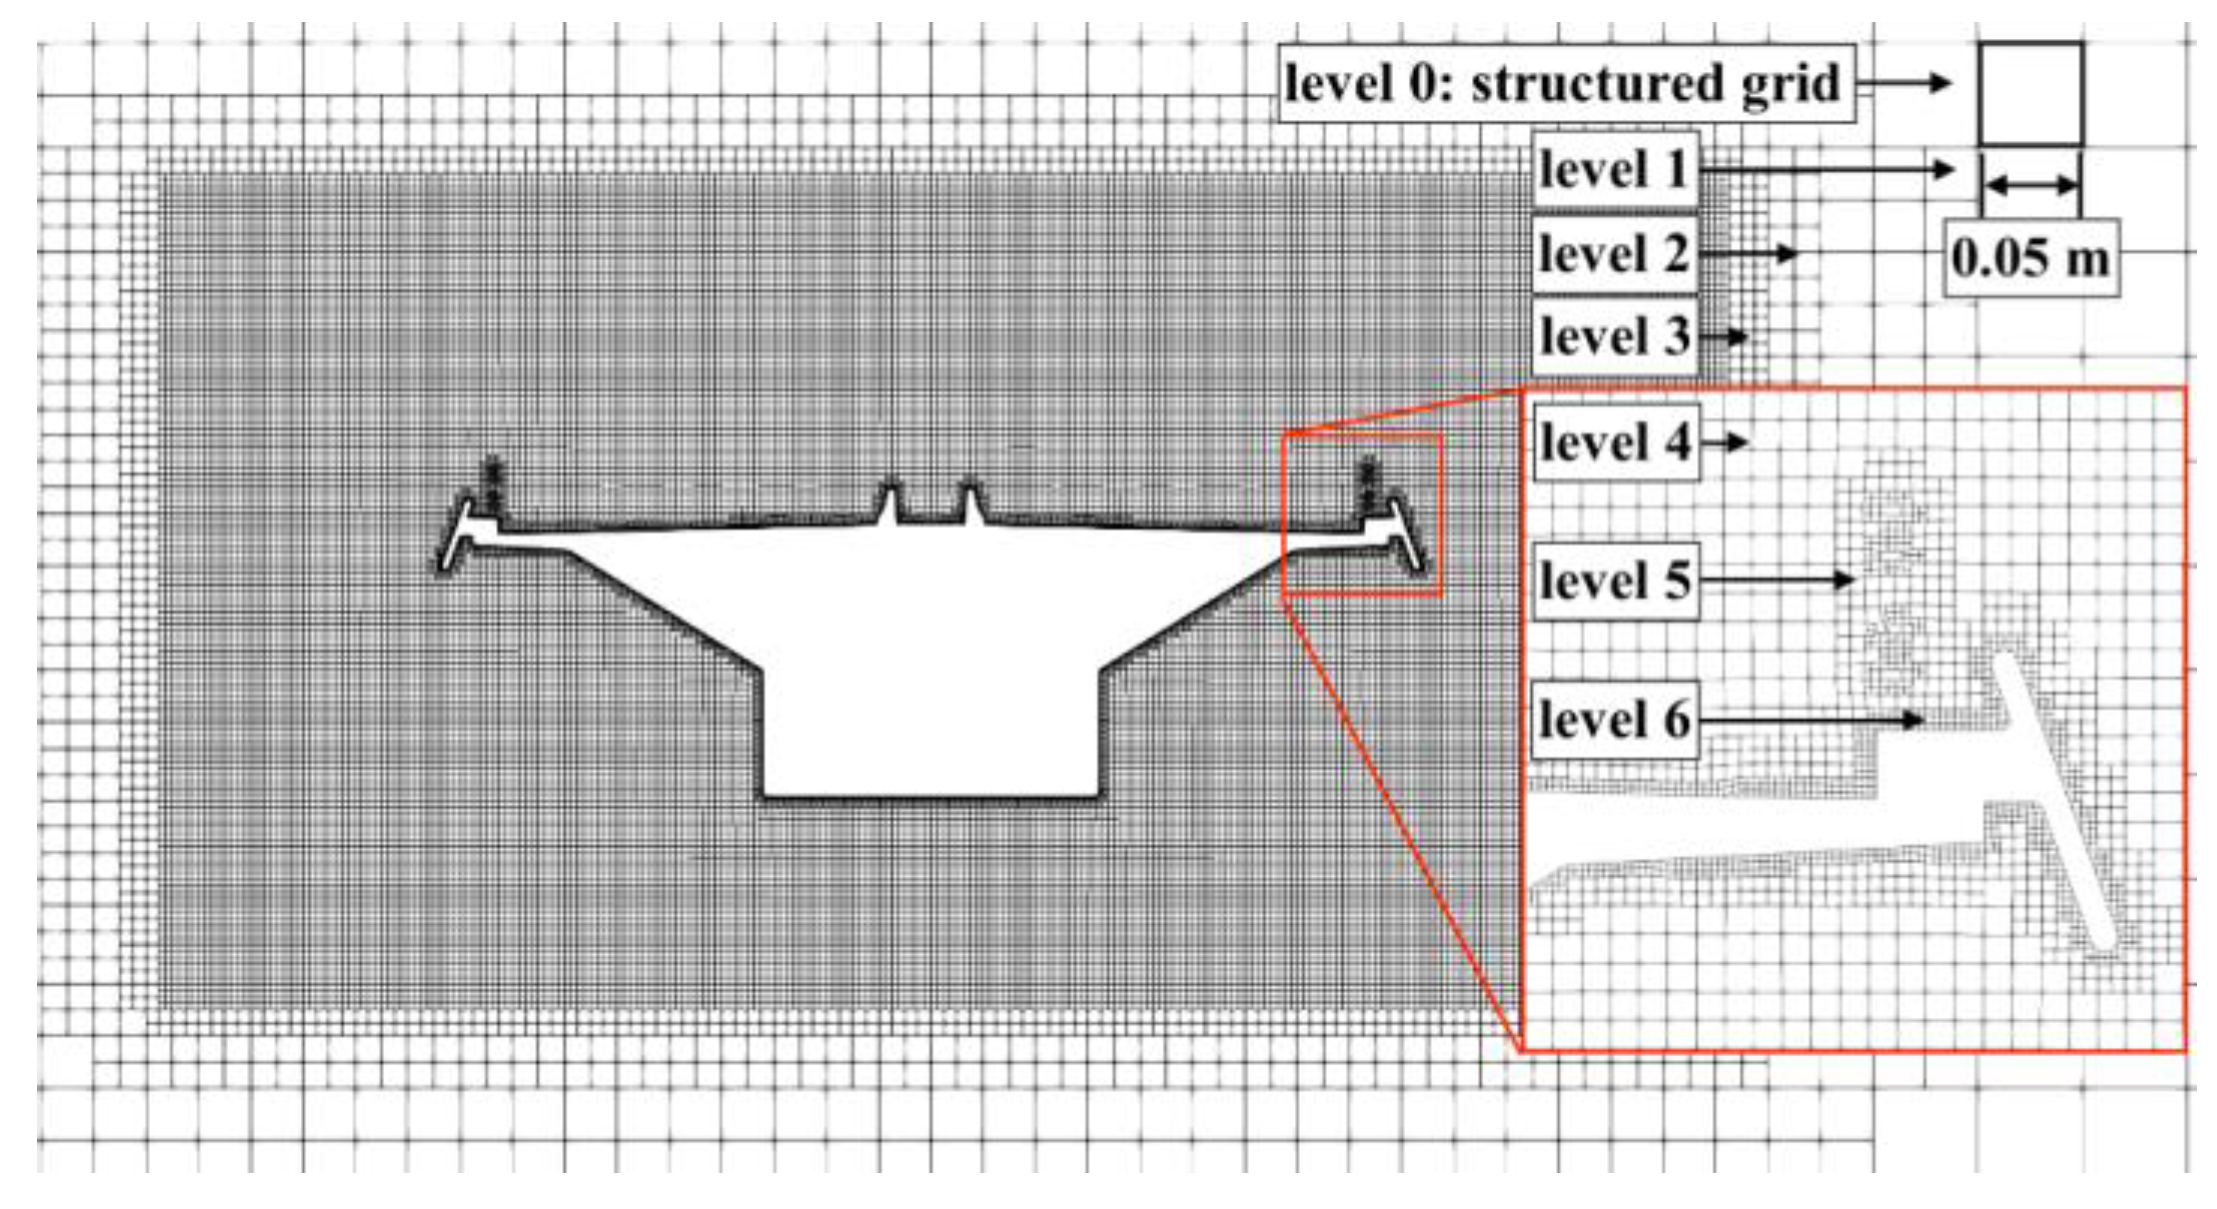
The quality of the computational mesh has significant impact on the results of numerical simulations. An infinitely dense mesh will lead to a solution with no mesh/discretization errors; however, it is impossible to achieve due to the limits of computational power. It is practical to stop the mesh refinement where the mesh errors are sufficiently small, according to a mesh sensitivity analysis. In this study, five different meshes are compared. Details of meshes No.1 to No.5 in the region close the bridge surface are shown in Figure 10, Figure 11, Figure 12, Figure 13 and Figure 14, respectively.
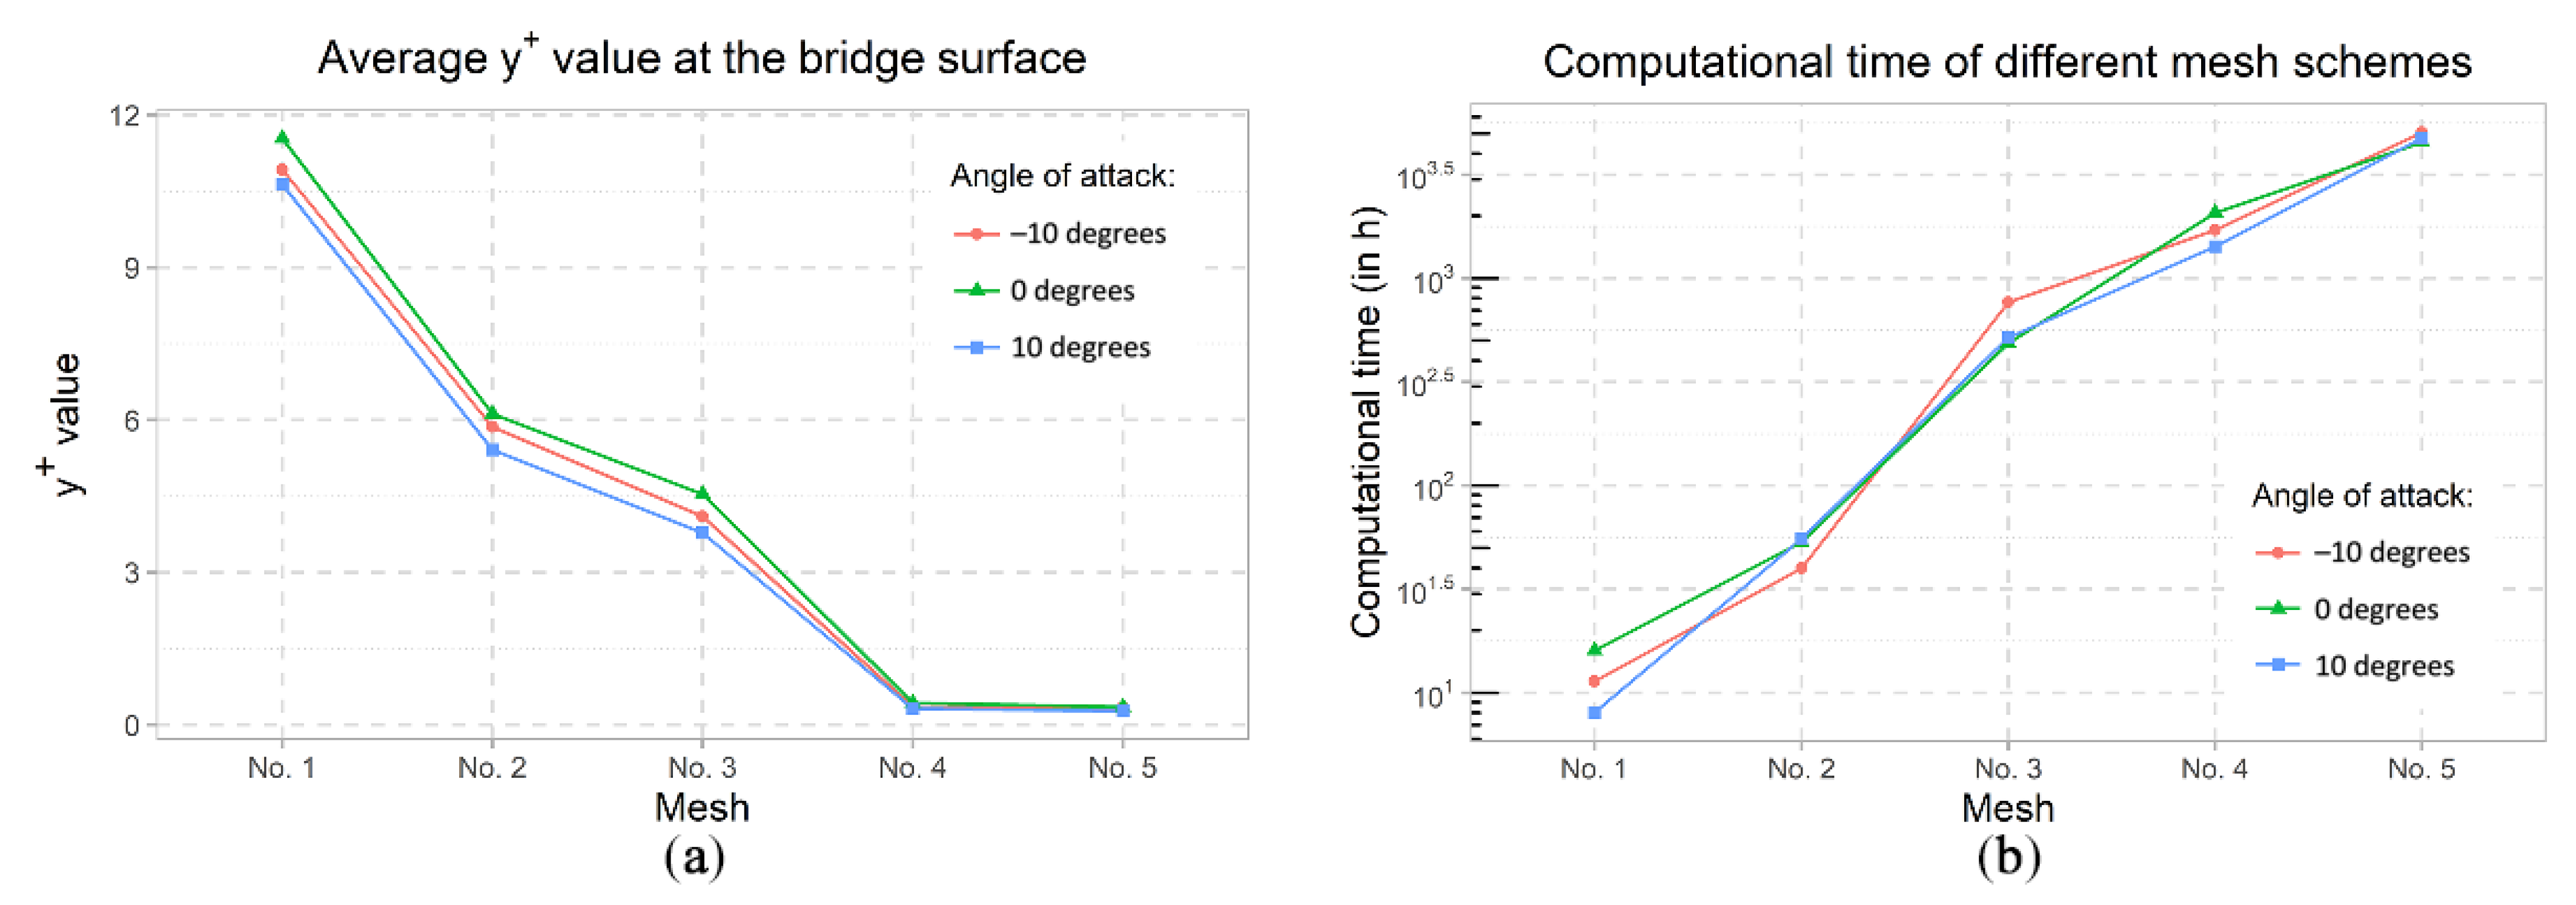
As shown in Figure 10 and Figure 11, the meshes No.1 and No.2 have the same structured grid, in which cells are cubic with a length of 0.1 m. Based on the structured grid, mesh No.1 is refined by five levels, making the average length of the smallest cells approximately 3 × 10⁻³ m, while mesh number No.2 is refined by six levels, leading to an average thickness of the smallest cells approximately 1.5 × 10⁻³ m. Meshes No.3 (Figure 12) and No.4 (Figure 13) apply a finer structured grid with 0.05 m-long cubic cells, based on which, both meshes are refined by six levels towards the bridge surface. The smallest cell thickness of Mesh No.3 is approximately 8 × 10⁻⁴ m at the bridge surface. However, in mesh No.4, extra boundary cells of eight layers are added at the bridge surface, leading to an average wall thickness of approximately 5 × 10⁻⁴ m. Mesh No.5 (Figure 14) has a further refined structured grid, where cells within the background mesh have a length of 0.03 m. Identical refinement and boundary schemes of mesh No.4 are applied to mesh No.5, leading to an average wall thickness of approximately 6 × 10⁻⁵ m. Each of the above five meshes are applied with three rotational configurations of the bridge deck geometry (−10°, 0°, and +10°). Each angle configuration results in a slightly different total cell count while still using the same mesh (Table 4). In this mesh sensitivity study, the full-length (20 m) computational domain, the turbulence model (k-ω SST), and the boundary conditions are kept the same for each simulation.
Figure 15a demonstrates the average dimensionless wall thickness (y+) at the bridge surface for each mesh configuration. Figure 15b shows the clock time for each simulation. As the mesh density increases, the required computational time increases, as expected. The clock time of simulations with mesh No.5 is almost three times of that using mesh No.4.
Results of aerodynamic coefficients (lift, drag, and moment) based on the five meshes are plotted over average cell sizes at the bridge surface in Figure 16. In general, the values tend to convergence for the finer meshes. Results of simulations using mesh No.1 have significant differences to results of simulations using mesh No.2. In the calculation of the lift coefficient for the 10-degree configuration, the difference between results for mesh No.1 and mesh No.2 has a relative difference of over 20%. It can also be found that there are oscillations within the plot. The largest oscillation occurs in Figure 16c, where a relative difference of 7% was found for the −10-degree configuration moment coefficient between mesh No.3 and mesh No.4. Similarly, in Figure 16a, mesh No.3 has a deviated drag coefficient value for the configuration of −10 degrees. However, that only leads to a relative error of 4% compared to the corresponding result of mesh No.3. For all three aerodynamic coefficients, there is no appreciable change in results between using mesh No.4 and mesh No.5. Considering this, along with the computational cost of finer meshes, mesh No.4 is considered to be the appropriate mesh for use in this study.

5.2. Domain Sensitivity Study

When replicating wind tunnel tests using CFD simulations, using a smaller computational domain can reduce the cell count in the mesh, thereby saving on the computational power. However, the use of smaller computational domains might lead to a loss of fidelity in the simulation. To determine the effect of domain sizes on the numerical results, a domain sensitivity study is conducted. Four different domain sizes are considered, each of which has the same cross section of 2.2 m by 2.2 m but has a different length (Figure 17). The full domain has a length of 20 m to replicate the wind tunnel facility, and the half domain, quarter domain, and one-eighth domain have lengths of 10 m, 5 m, and 2.5 m, respectively.
These domains are applied in all 21 configurations. The results (Figure 18) show that the length of domain has a moderate effect on cases with small angles of attack but will significantly influence cases with large angles of attack. In general, as the domain length increases, the results of drag and moment coefficients decrease, while the results of lift coefficients increase. In Figure 18a, the drag coefficients of cases with an angle of attack from 1 degree to 10 degrees are nearly independent from the domain length except for results derived from the one-eighth domain length. Additionally, it can be found that as the angle of attack decreases from 0 degrees to −10 degrees, the difference in drag coefficients is amplified. In Figure 18b, the difference in lift coefficients of various angles of attack is almost constant among cases with various domain sizes. In Figure 18c, moment coefficients of cases with an angle of attack from −10 degrees to 3 degrees are almost independent of the domain length, while moment coefficients of the remaining configurations show a strong dependence on the domain length. Therefore, in order to eliminate the effect of domain length on aerodynamic coefficients, the full-length domain is used in the model to replicate the corresponding wind tunnel tests.

5.3. Sensitivity to Selection of Turbulence Model

The use of RANS formulations makes complex CFD studies computationally affordable at the expense of introducing an extra unknown to be modelled: the Reynolds stress. Currently, two types of models are available to solve this, eddy-viscosity models and the Reynolds stress model. Although the Reynolds stress model is commonly accepted to offer a more accurate estimation of flow separation and the development of vortices, it requires significantly more computational power than eddy-viscosity models. The main reason for this is that eddy-viscosity models normally contain one or two scalar transport equations, whereas computing the 3D Reynolds stress tensor using the Reynolds stress model requires the solution of at least six scalar transport equations. In this study, as the focus is on the calculation of time-averaged aerodynamic coefficients, and the detailed information of vortices is not of interest, eddy-viscosity models are used. The three most commonly used eddy viscosity models are examined in this study, namely the standard k-ε turbulence model [54], the Spalart–Allmaras (SAS) model [55], and the standard k-ω SST turbulence model [44]. These models were applied in all 21 configurations using mesh No.4. Simulations using the standard k-ε model and the SAS model adopt the identical boundary conditions of U and p in Table 1. Boundary conditions for k, ε and ν ˜ are summarized in Table 5.
As shown in Table 4, k, ε, and   ν ˜   are all configured with Dirichlet conditions at the inlet, where the initial values are calculated using Equations (6), (8) and (9), respectively:
ε = 0.0675 k 1.5 l ,
  ν ˜   = 1.5 UIl
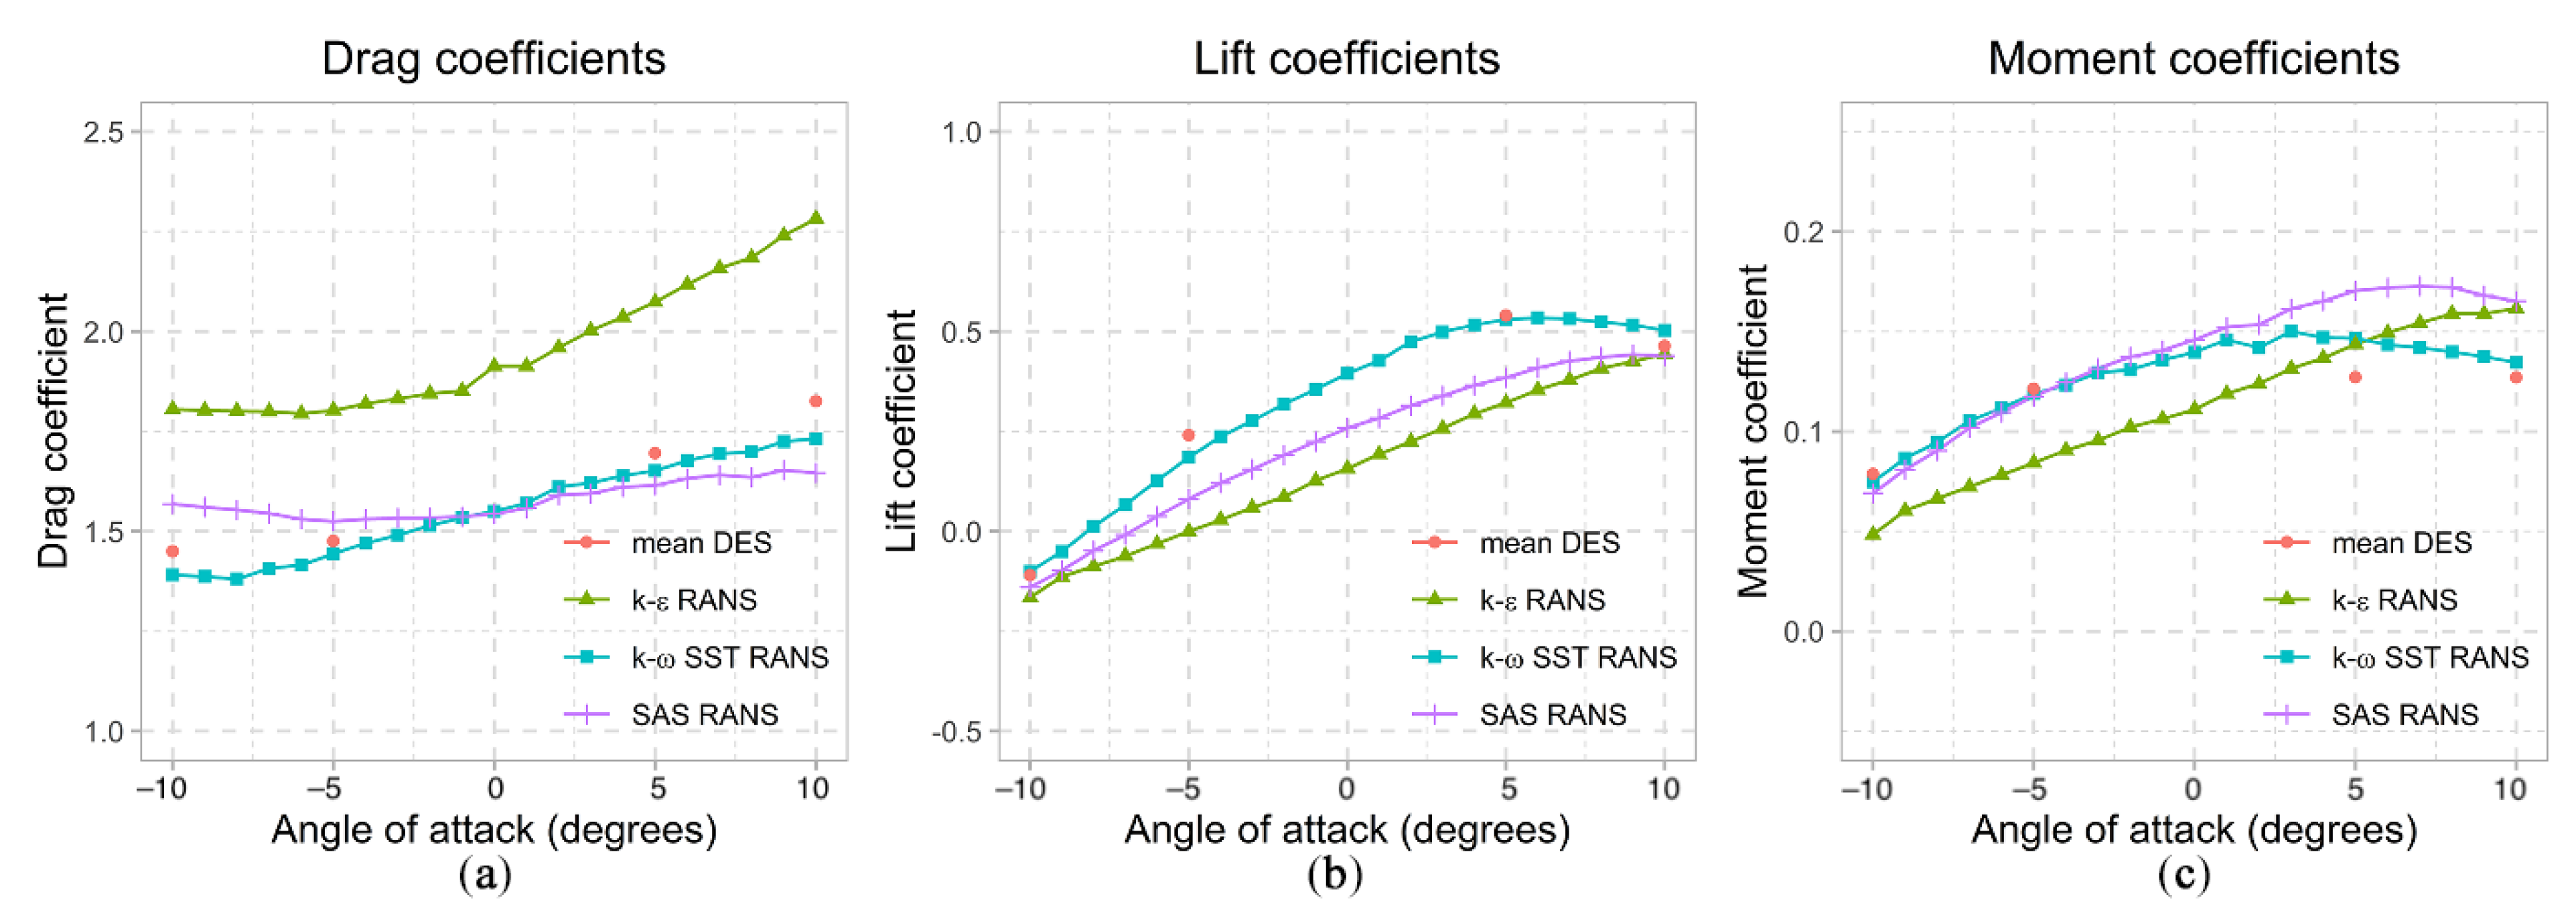
Similar to the configuration for simulations using the k-ω SST turbulence model, all wall regions are no-slip walls, where   k , ε , and   ν ˜   are configured with adaptive wall functions. Additionally, DES simulations were performed using the k-ω SST turbulence model in the near-wall region. Boundary conditions of the DES simulations were identical to RANS simulations with the k-ω SST model. Results derived from RANS simulations using three different turbulence models are compared to the time-averaged values of results determined in DES simulations as shown in Figure 18. In general, results from simulations using the k-ε model vary considerably from the other three sets of results. As shown in Figure 19a, the drag coefficients derived from RANS simulations with the k-ω SST model and SAS model are in a good agreement with the DES results. The k-ω SST model and the SAS model show maximum relative differences of 2.1% and 8.2%, respectively, to the DES results of drag coefficients. The drag coefficients predicted by the k-ε model are approximately 25% larger than the DES results. In Figure 19b, lift coefficients derived from simulations based on the k-ε model show an almost linear correlation with the angle of attack. Such correlations are not seen in the other three sets of data. The variation between results from the SAS model and the k-ω SST model is notably small at large angles of attack. However, such variations tend to increase as the angle of attack decreases toward zero degrees. The k-ω SST model provides the closest results of lift coefficients to the time-averaged DES results, with a maximum relative difference of 8.5%, whereas maximum relative differences in the lift coefficients predicted by the k-ε model and the SAS model are 27.6% and 50.7%, respectively. As shown in Figure 19c, the SAS model predicts the largest moment coefficients among the three models, while the k-ε model predicts the smallest moment coefficients, except where the angle of attack ranges from 5 degrees to 10 degrees. Compared to the limited samples from DES simulations, the k-ω SST model gives the closest results, except for an angle of attach of 5 degrees. The difference in the results derived by the SAS model and the k-ω SST model is relatively small, where angle of attack has negative values. This difference tends to increase as the positive angle of attack increases. Both the SAS model and the k-ω SST model show that the largest moment coefficient occurs at a positive angle of attack that is smaller than 10 degrees, while the k-ε model shows that the largest moment coefficients is with the largest positive angle of attack.
Findings are twofold from the above comparison of aerodynamic coefficients derived from simulations applying different turbulence models. Firstly, results from the RANS simulations with the k-ε model are significantly different from other results. Potential explanations for the poor performance of the k-ε model might be its overestimation of the reattachment length behind the bluff body [56] and the excessive turbulent kinematic energy it determines at the boundary layer [57]. Secondly, the SAS model and the k-ω SST model determine close results in the estimation of drag coefficients and the estimation of moment coefficients with negative angles of attack; however, the k-ω SST model derives overall the closest results to the mean value of DES results. Therefore, the k-ω SST model has been adopted by the authors here.

6. Validation of the CFD Models

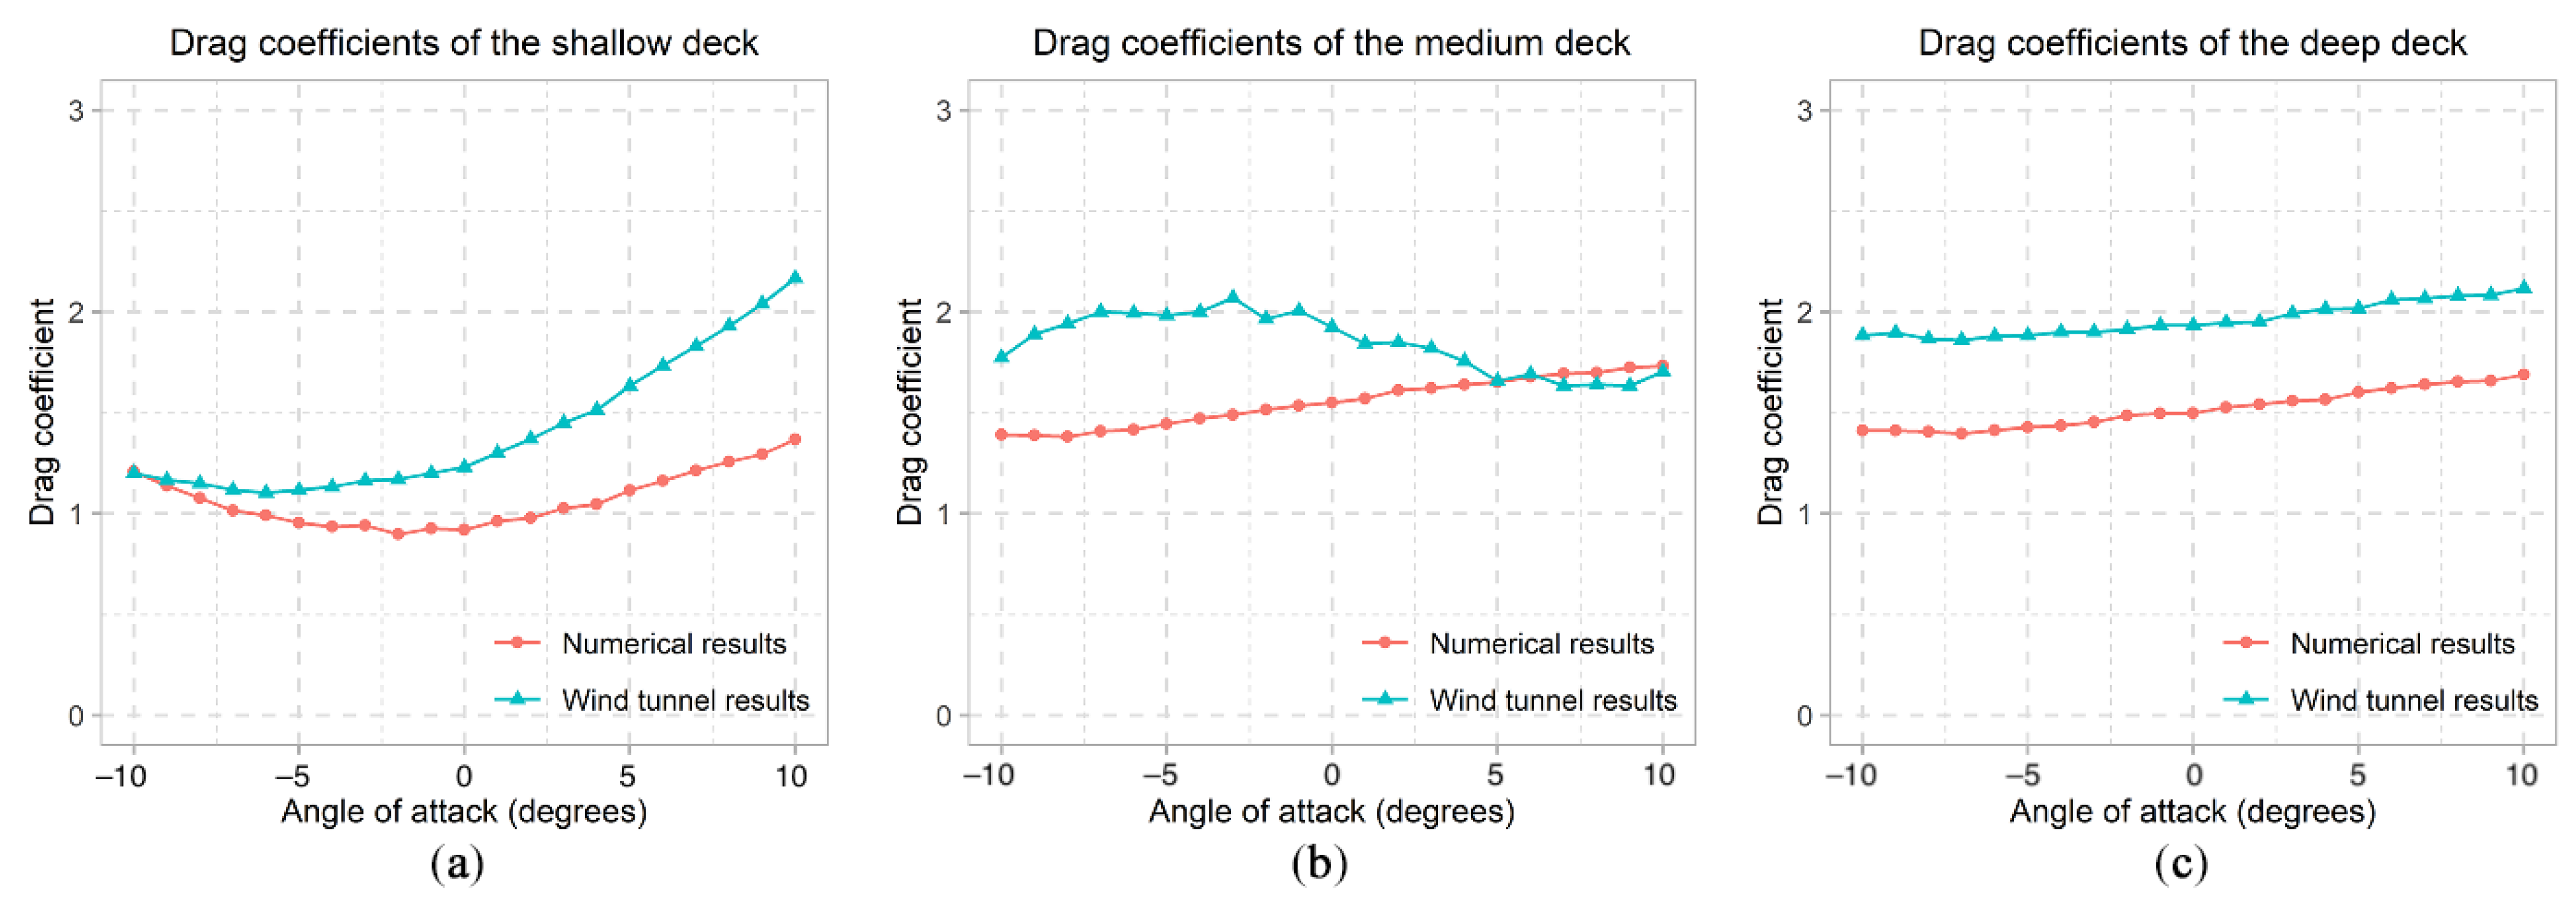
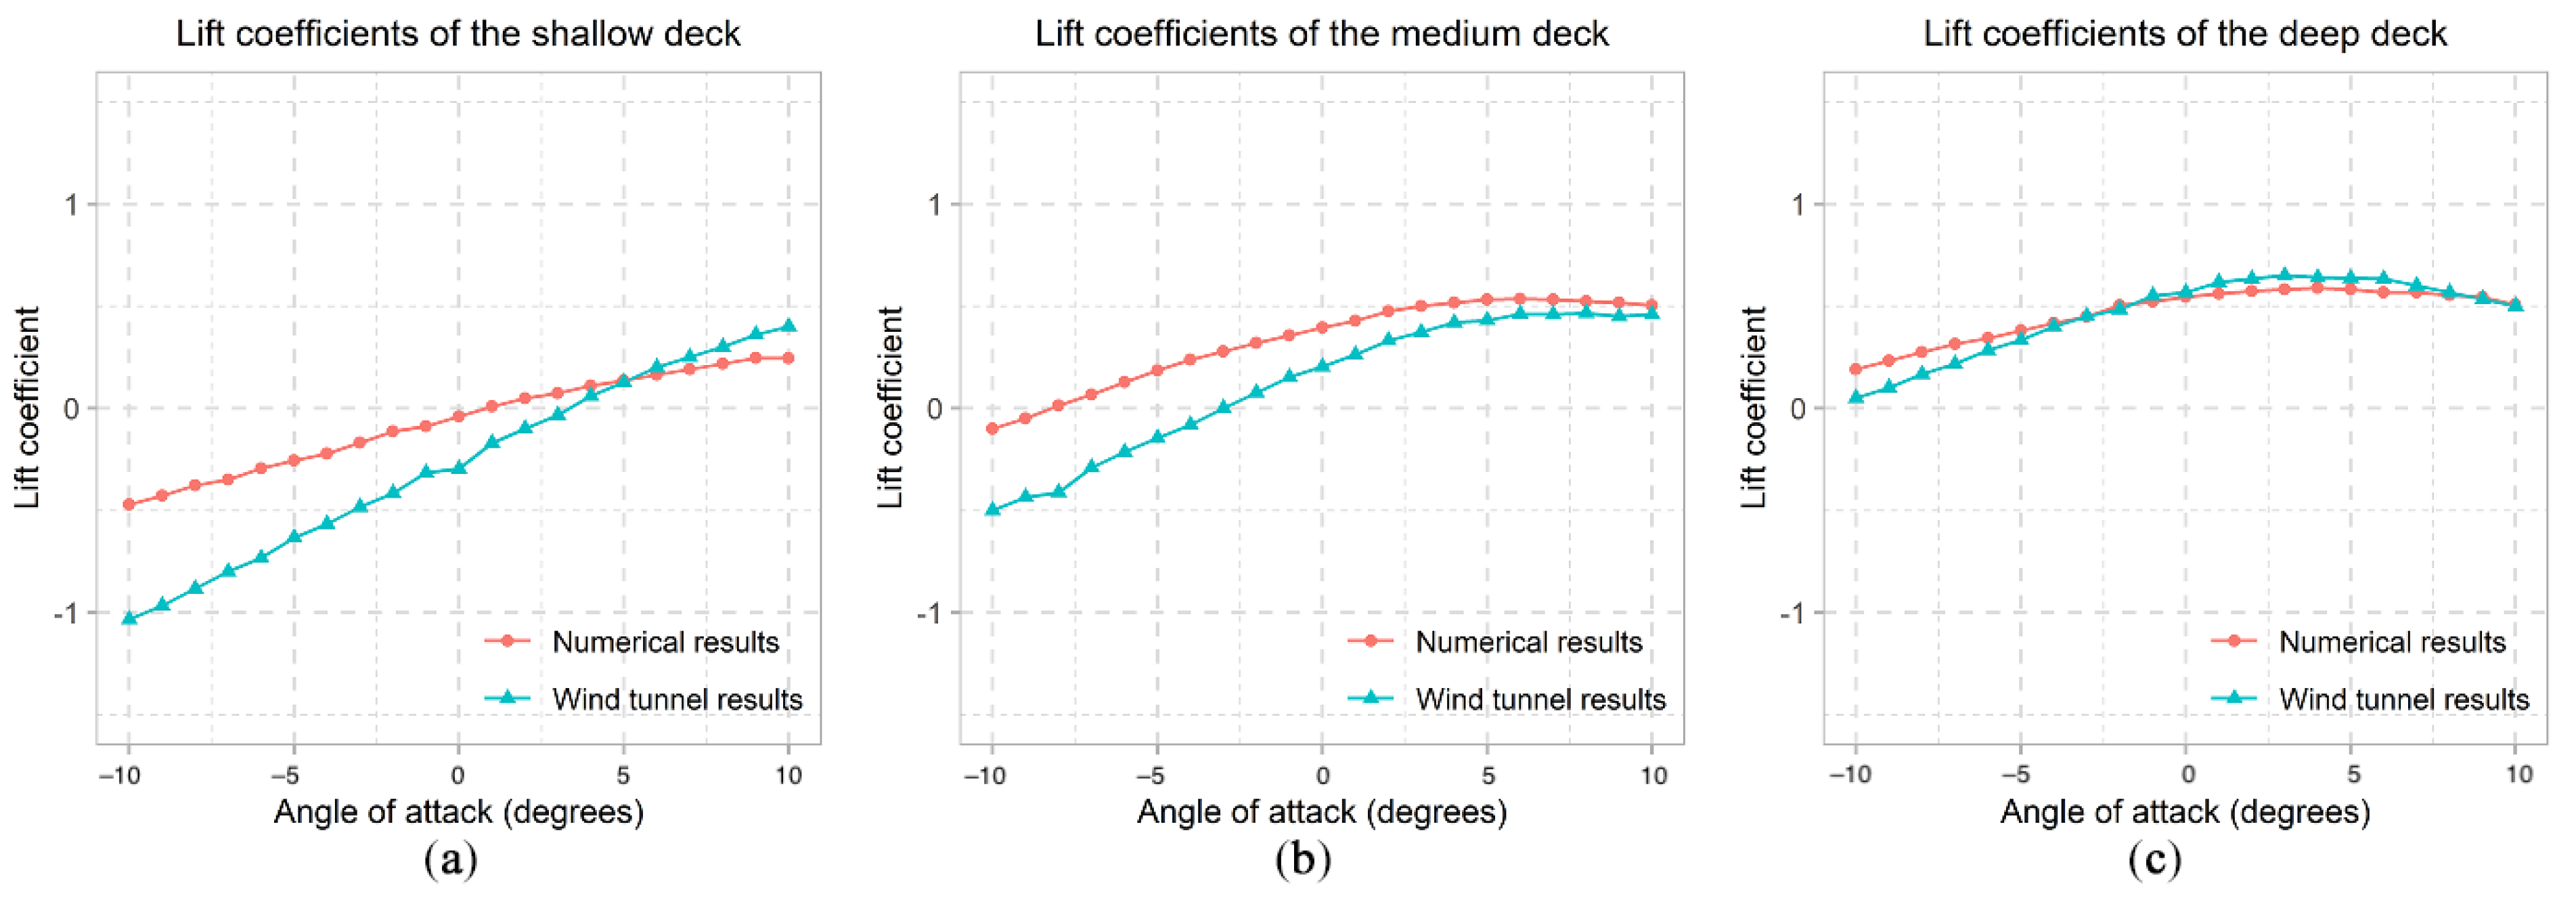
The results from Section 5 demonstrate that the CFD model with the use of the full-length domain, the k-ω SST turbulence model, and mesh No.4 can provide predictions of time-averaged aerodynamic coefficients for the medium bridge deck with reasonably small numerical errors and an affordable computational power. To assess the robustness of the CFD modelling approach, it is then applied to the other two bridge deck geometries shown in Figure 4. These two bridge decks, the shallow deck and the deep deck, representing other sections of the bridge (the depth profile for the bridge varies over the length of the bridge), were also considered in the wind tunnel tests of the Rose Fitzgerald Kennedy bridge. All geometries are simulated in the full-length domain with 21 rotational configurations using Mesh No.4 and the k-ω SST turbulence model. For the purposes of validation, these results are then compared with the corresponding results from the wind tunnel test report. The results are shown in Figure 20, Figure 21 and Figure 22.
As shown in Figure 20, drag coefficients determined by wind tunnel tests have a moderately larger value than the numerical results, except for cases with large angle of attack (5 degrees to 10 degrees) of the medium deck in Figure 20b. Maximum relative differences of numerical results to wind tunnel results are 26.8% at the angle of attack of +10 degrees for the shallow deck (Figure 20a), 29.6% at the angle of attack of −7 degrees for the medium deck (Figure 20b), and 25.6% at the angle of attack of −9 degrees for the deep deck (Figure 20c). In a study by Han et al. [58], a relative difference of approximately 30% at the angle of attack of 3 degrees can be found in the comparison of numerical and experimental results. It is also worth mentioning that the difference between numerical and experimental results of the drag coefficients increased as the angle of attack increased, which indicates that larger discrepancies (over 30%) might be found for further increases in angle of attack.
It is also found that differences between wind tunnel results and numerical results in cases of the shallow deck show a strong correlation to the angle of attack: the difference decreases as the negative angle of attack increases; the difference increases as the positive angle of attack increases. Such correlation does not exist in the cases of the medium deck and the deep deck. Instead, differences between wind tunnel results and experimental results of the deep deck are almost constant, with a value of approximately 0.5. Additionally, the plot of wind tunnel results of the medium deck shows a significantly different shape as to the plot of the wind tunnel results of the shallow and deep decks, whereas the plot of numerical results derived from the CFD model show good consistency.
Figure 21 shows that the lift coefficients derived from numerical results are partially in good agreement with the wind tunnel results. In Figure 21a, lift coefficients of the shallow deck predicted by the CFD model have an average 20% relative difference with respect to the wind tunnel results where angle of attack ranges from +5 degrees to +9 degrees, whereas for other configurations of angle of attack, the average relative difference is approximately 60%. For lift coefficients of the medium deck (Figure 21b), numerical results agree well with those calculated from wind tunnel results within the range angle of attack from +2 degrees to +10 degrees, where the maximum relative difference is below 30%. For other configurations of angle of attack in Figure 21b, the average relative difference is approximately 70%. However, it is interesting to find that lift coefficients of the deep deck predicted by the numerical method and wind tunnel tests reach reasonably good agreement for most configurations of angle of attack: −6 degrees to +10 degrees. Within this range, the largest relative difference between wind tunnel results and numerical results is only 17% at −6 degrees, and most cases have a relative difference of less than 10%.
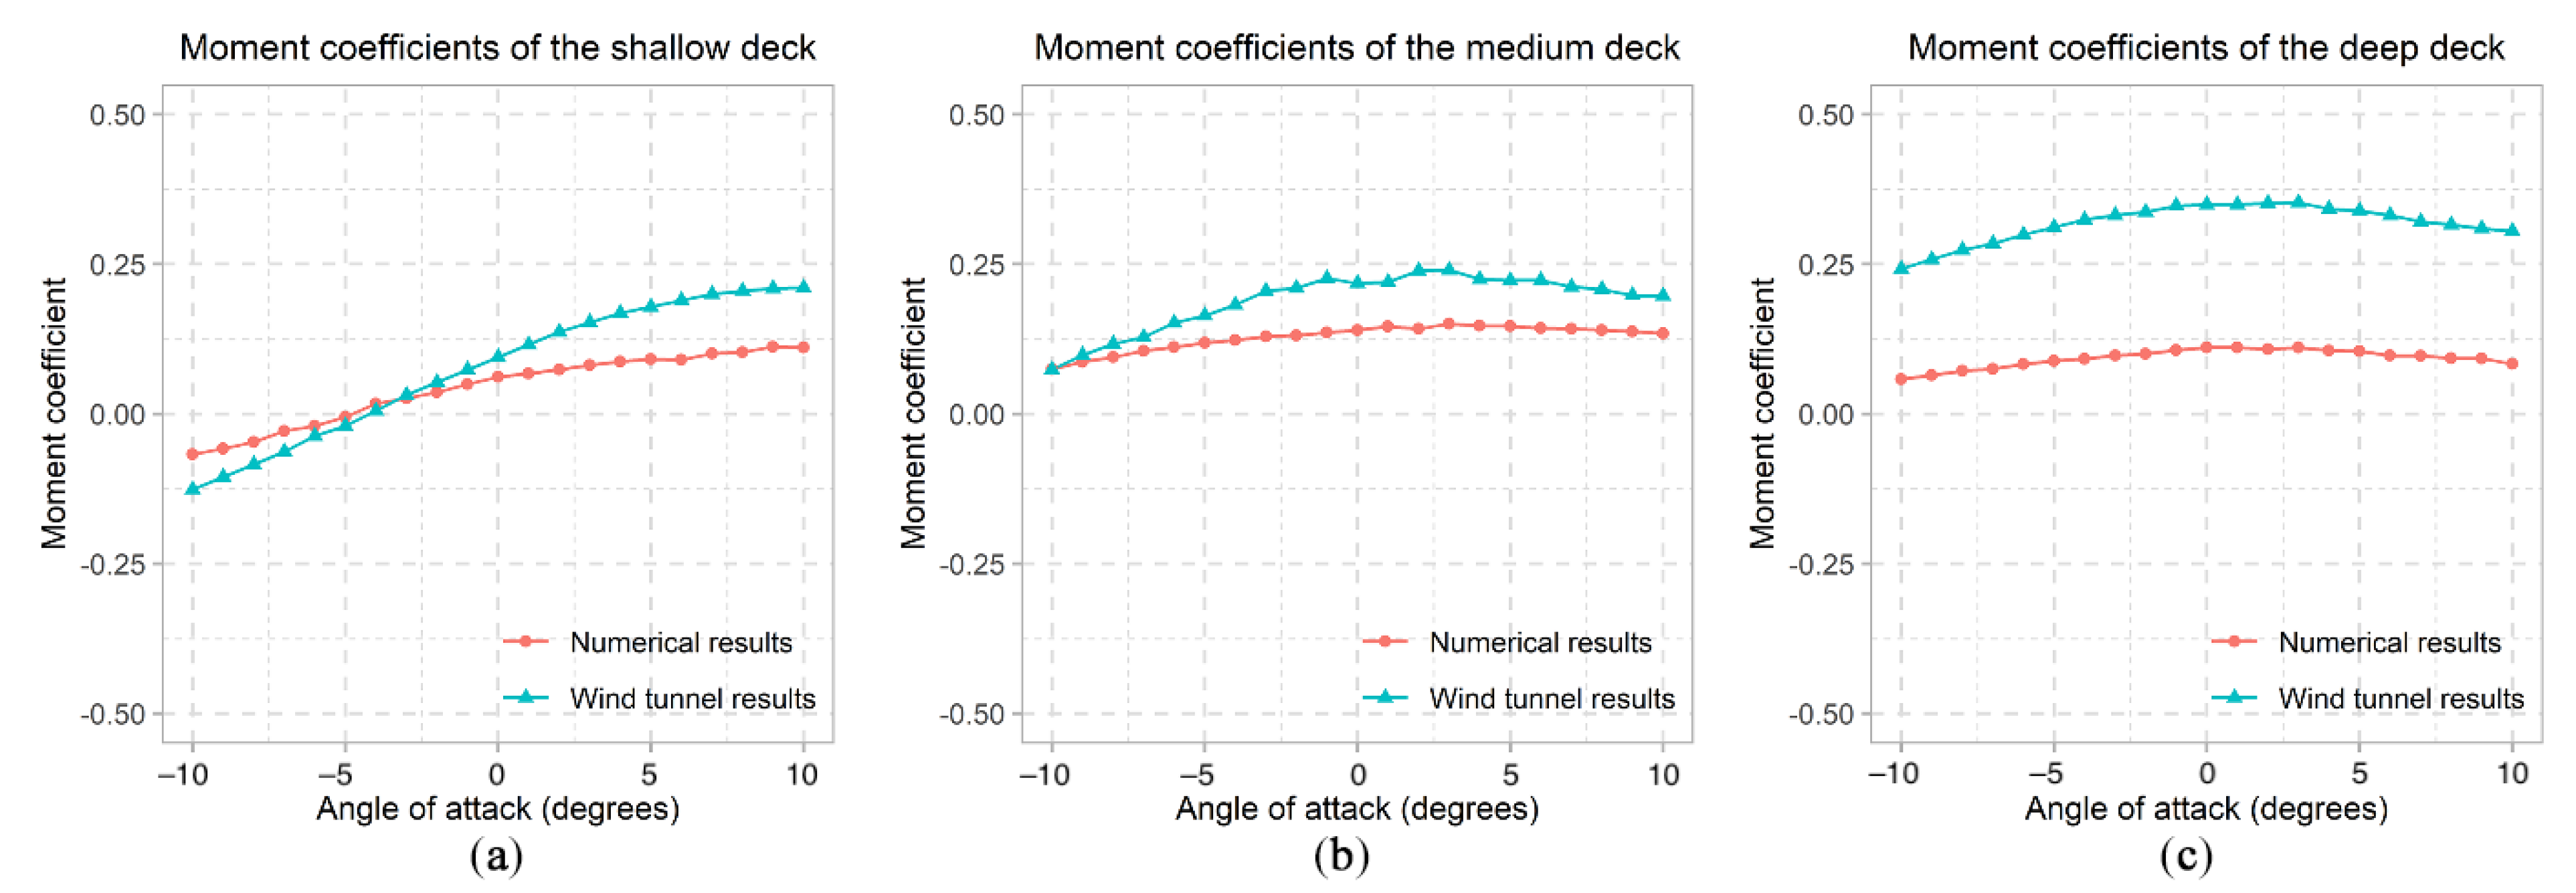
As shown in Figure 22, the moment coefficients calculated from wind tunnel results are mostly larger than those predicted by the CFD model, except for the shallow deck at a range of angle of attack from −10 degrees to −5 degrees. In general, the shape of moment coefficients plot from wind tunnel results and numerical results agree with each other. For instance, wind tunnel tests and the CFD model predict the same zero-moment angle of attack of approximately −4 degrees for the shallow deck. Additionally, wind tunnel tests and the CFD model both predict that angles of attack correspond to maximum moment coefficients of the medium and deep decks are within the range of +2 degrees to +4 degrees. However, the relative difference between wind tunnel results and numerical results of moment coefficients are notably large. For moment coefficients of the shallow deck (Figure 22a), the maximum relative difference between numerical results and wind tunnel results occurs at an angle of attack of −5 degrees with a value of 73.7%. For moment coefficients of the medium deck (Figure 22b), the maximum relative difference between numerical results and wind tunnel results occurs at the angle of attack of −2 degrees, with a value of 40.6%. As for the deep deck, wind tunnel results of moment coefficients are significantly larger than numerical results and have an almost constant relative difference of approximately 70%. In addition, it is worth noticing that the differences in moment coefficients show some similarity to the differences in drag coefficients, which indicates that the drag coefficients might have some effects on the moment coefficients. This phenomenon might result from the coupling effect between wind flows in the spanwise direction and in the cross-sectional direction but should be further investigated in future studies.
In general, there is a good agreement between the numerical results and the wind tunnel test results of aerodynamic coefficients for the three different bridge decks. However, discrepancies are also found within comparisons, which might be explained from three aspects. Firstly, at a large angle of attack, the blockage ratio of all three bridge decks in the wind tunnel facility can reach a value of approximately 3%. Additionally, aspect ratios of the shallow deck, the medium deck, and the deep deck are 5.43, 3.37, and 2.58, respectively, although blockage ratios of these decks do not exceed 5%, which is a recommended maximum threshold value for not applying mathematical modifications on results [59]. According to Takeda and Kato [60], aerodynamic coefficients of slender sections, with an aspect ratio of lower than 5, are more sensitive to the blockage ratio in wind tunnel tests than other sections. Given that discrepancies in this study mainly correspond to large angle of attack, it can be inferred that the blockage ratio might have influenced the wind tunnel results on aerodynamic coefficients of the shallow deck section with a magnitude of angle of attack larger than 5 degrees. Secondly, in wind tunnel tests of the three sections, a side plate and rotational plate is installed at each end of the bridge geometry, whereas the CFD model does not include such structures. According to Kubo et al. [61], side plates can have large effect on aerodynamic coefficients determined from wind tunnels. Additionally, they suggested that the side plate effect might be amplified with the use of slender sections and large blockage ratios. Furthermore, the presence of sensors in the wind tunnel is not included in the CFD model and might contribute to discrepancies in the comparison since the sensors can potentially interfere with the flow field around the bridge deck. The discrepancies in the comparisons between numerical results and experimental results are mainly in lift and moment coefficients, which was also seen in studies by others. Jeong et al. [38] found that they had differences of up to 57% and 31% in their lift and moment coefficients, respectively, when comparing CFD results with experimental results. Similarly, in the study by Jiang et al. [62], a relative difference of 50% was seen in the comparison of moment coefficients determined from numerical and experimental results. Interestingly, both Jeong et al. [38] and Jiang et al. [62] achieved good agreement between experimental and numerical results in terms of the drag coefficients, where the largest relative differences were approximately 14% and 18%, respectively, and perhaps deserves further investigation.

7. Assessing the Impact of Including Secondary Structures

7.1. Fascia Beams

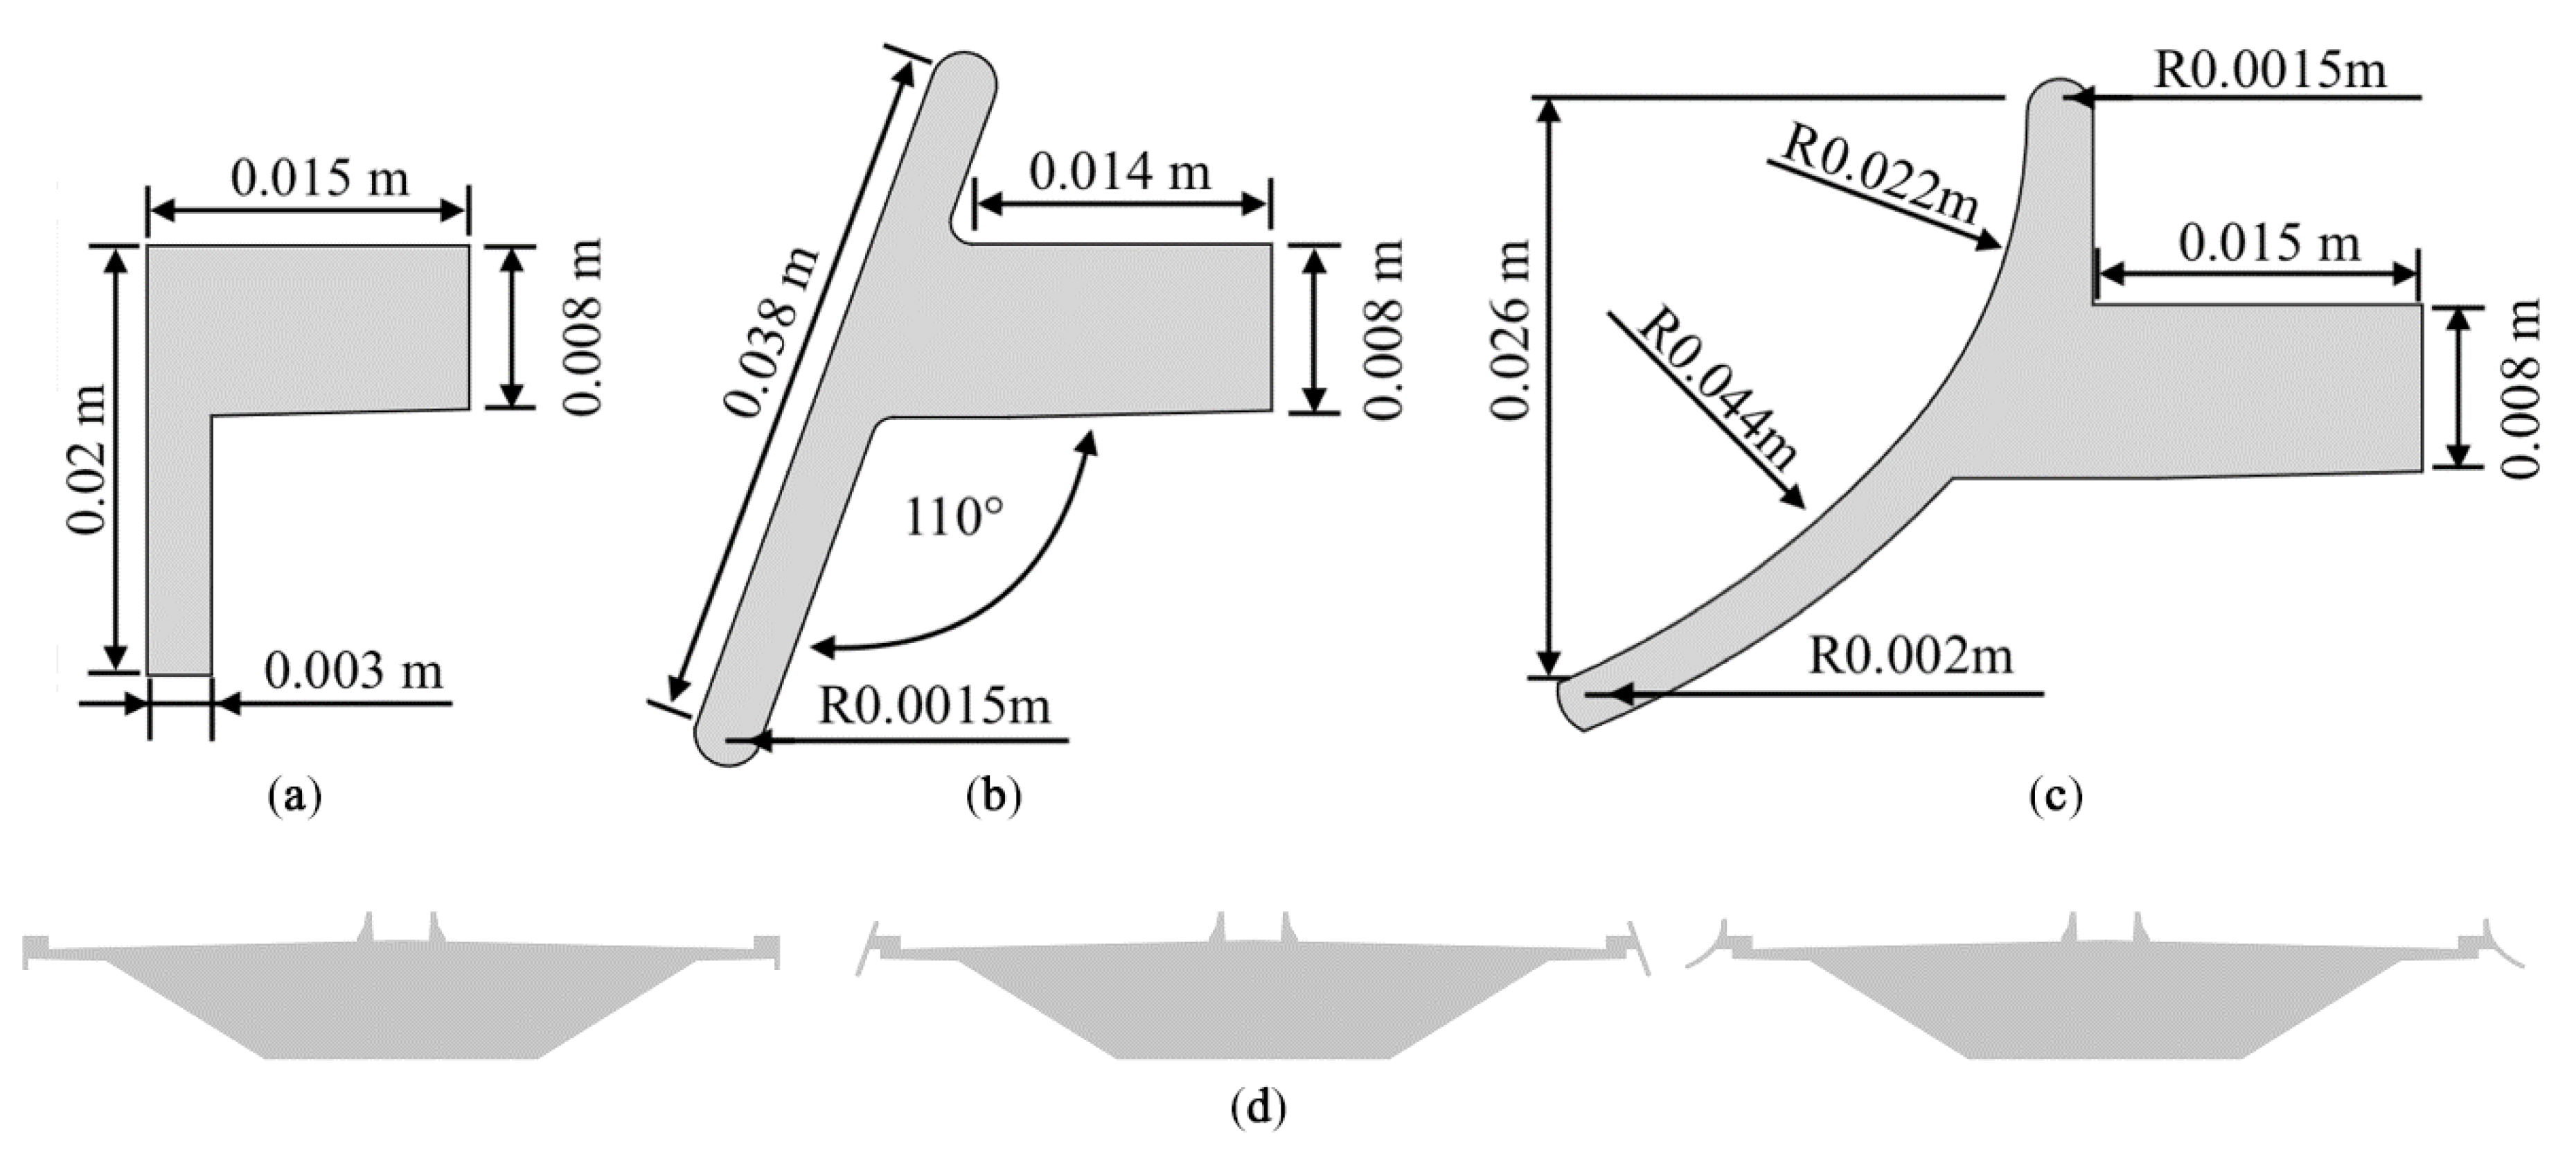
Three types of fascia beam were considered in the design phase of the Rose Fitzgerald Kennedy bridge; a vertical fascia beam (Figure 23a), an inclined fascia beam (Figure 23b), and a curved fascia beam (Figure 23c). Locations of these fascia beams are shown in Figure 23d.
Each of the three fascia beams were modelled on each of the three deck depths to assess their impact on the aerodynamic coefficient. Figure 24, Figure 25 and Figure 26 illustrates these results, including a comparison with the aerodynamic coefficients, where no fascia beams were included.
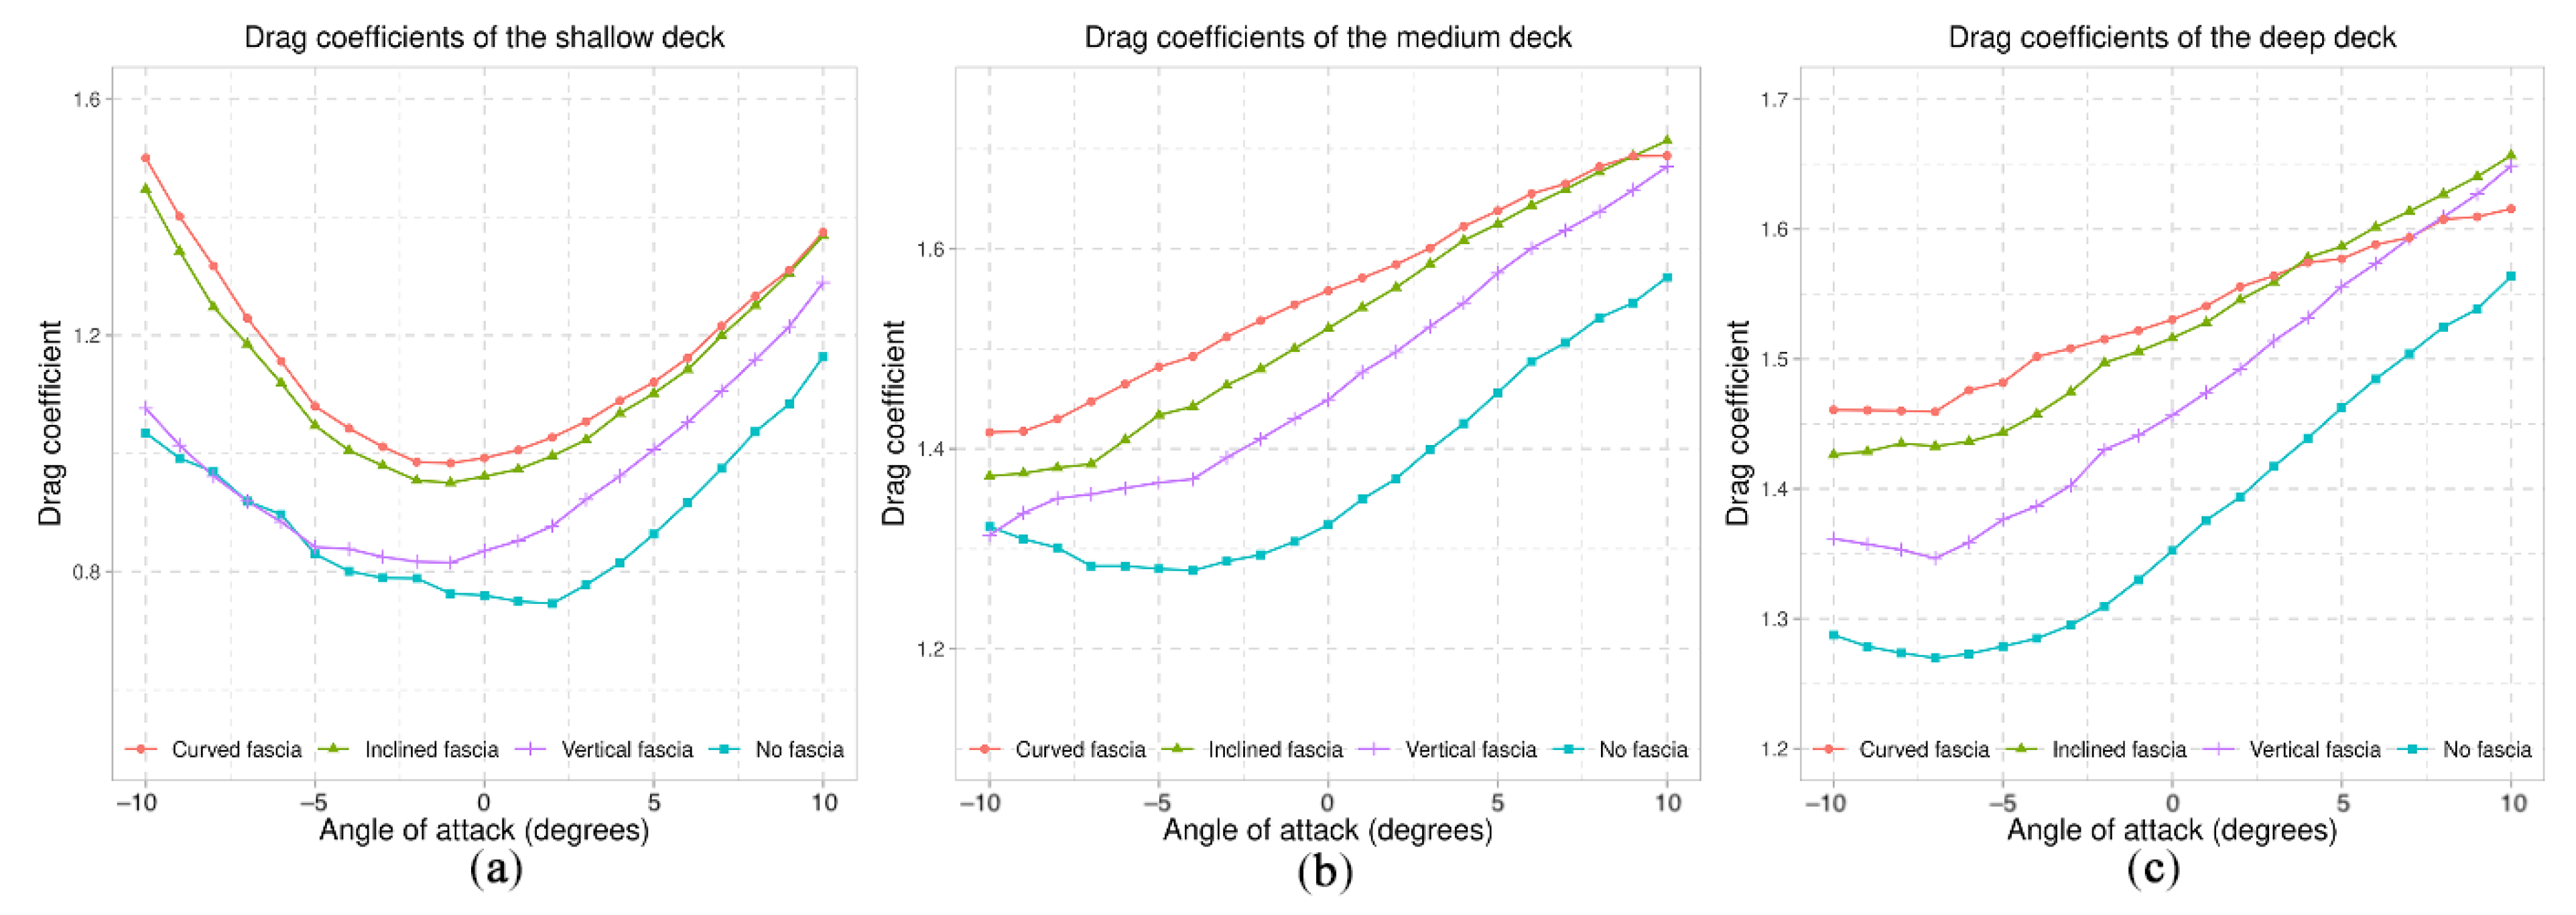
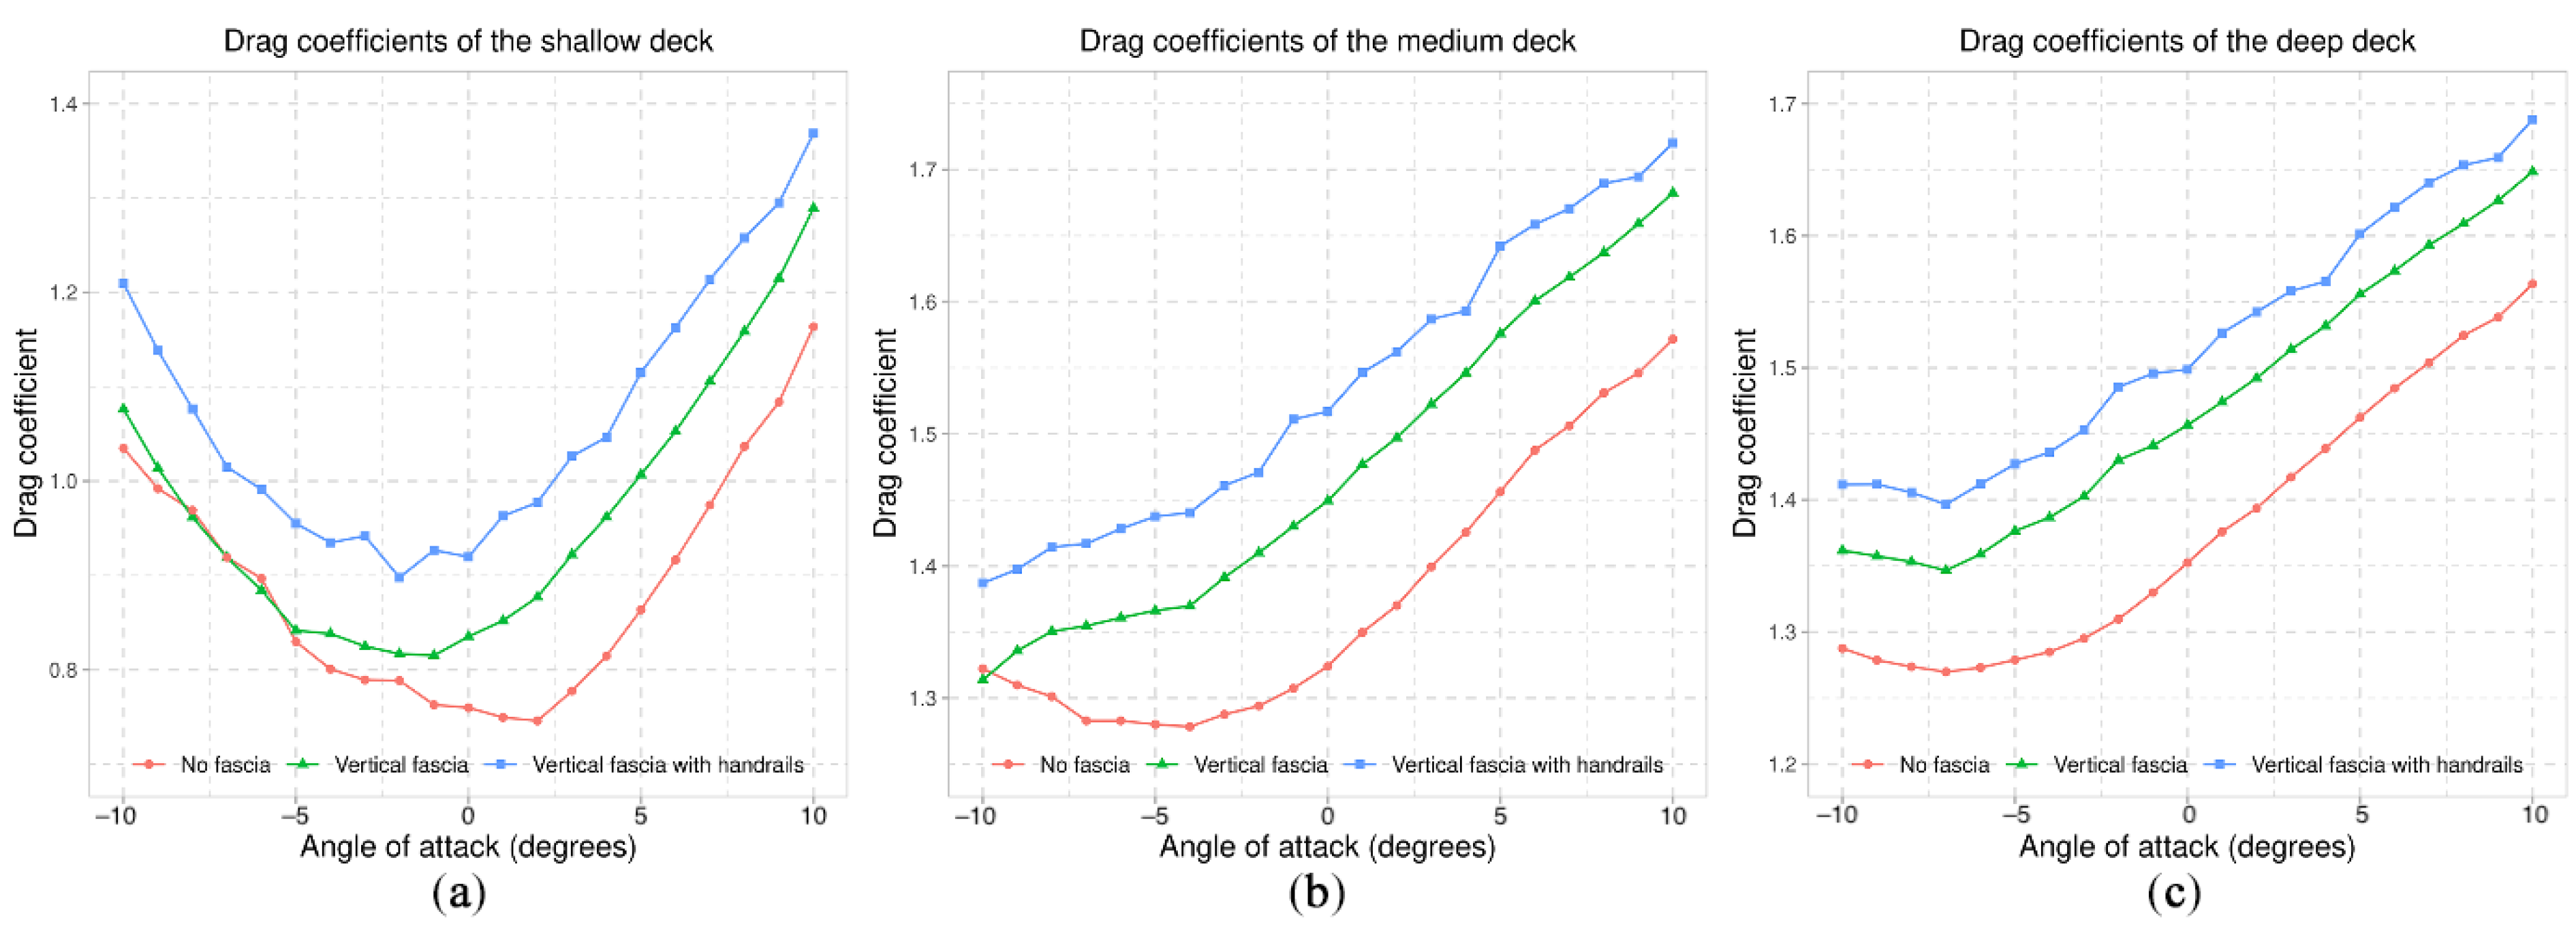
The presence of fascia beam leads to a considerable increase in the magnitude of drag coefficients for each of the three decks (Figure 24). The curved fascia beam resulted in the largest drag coefficients, with increases from 18.1% to 44.9% for the shallow deck, 7.1% to 18.6% for the medium deck, and 3.3% to 16.9% for the deep deck compared with the deck with no fascia included. Interestingly, the increases in drag coefficients between the curved fascia beam and the inclined fascia beam are relatively small, with largest relative differences of 5.3%, 3.7%, and 2.9% for the shallow, medium, and deep decks, respectively. This demonstrates that once the fascia beam has been included in wind assessment, the choice of fascia beam is of lesser impact. The vertical fascia beam leads to the smallest increase in the magnitude of drag coefficients. Compared to bridge decks without any secondary structures, drag coefficients of the shallow, medium, and deep decks with the curved fascia beam are 0.005% to 18.6%, 0.6% to 9.5%, and 5.4% to 9.2% larger, respectively.
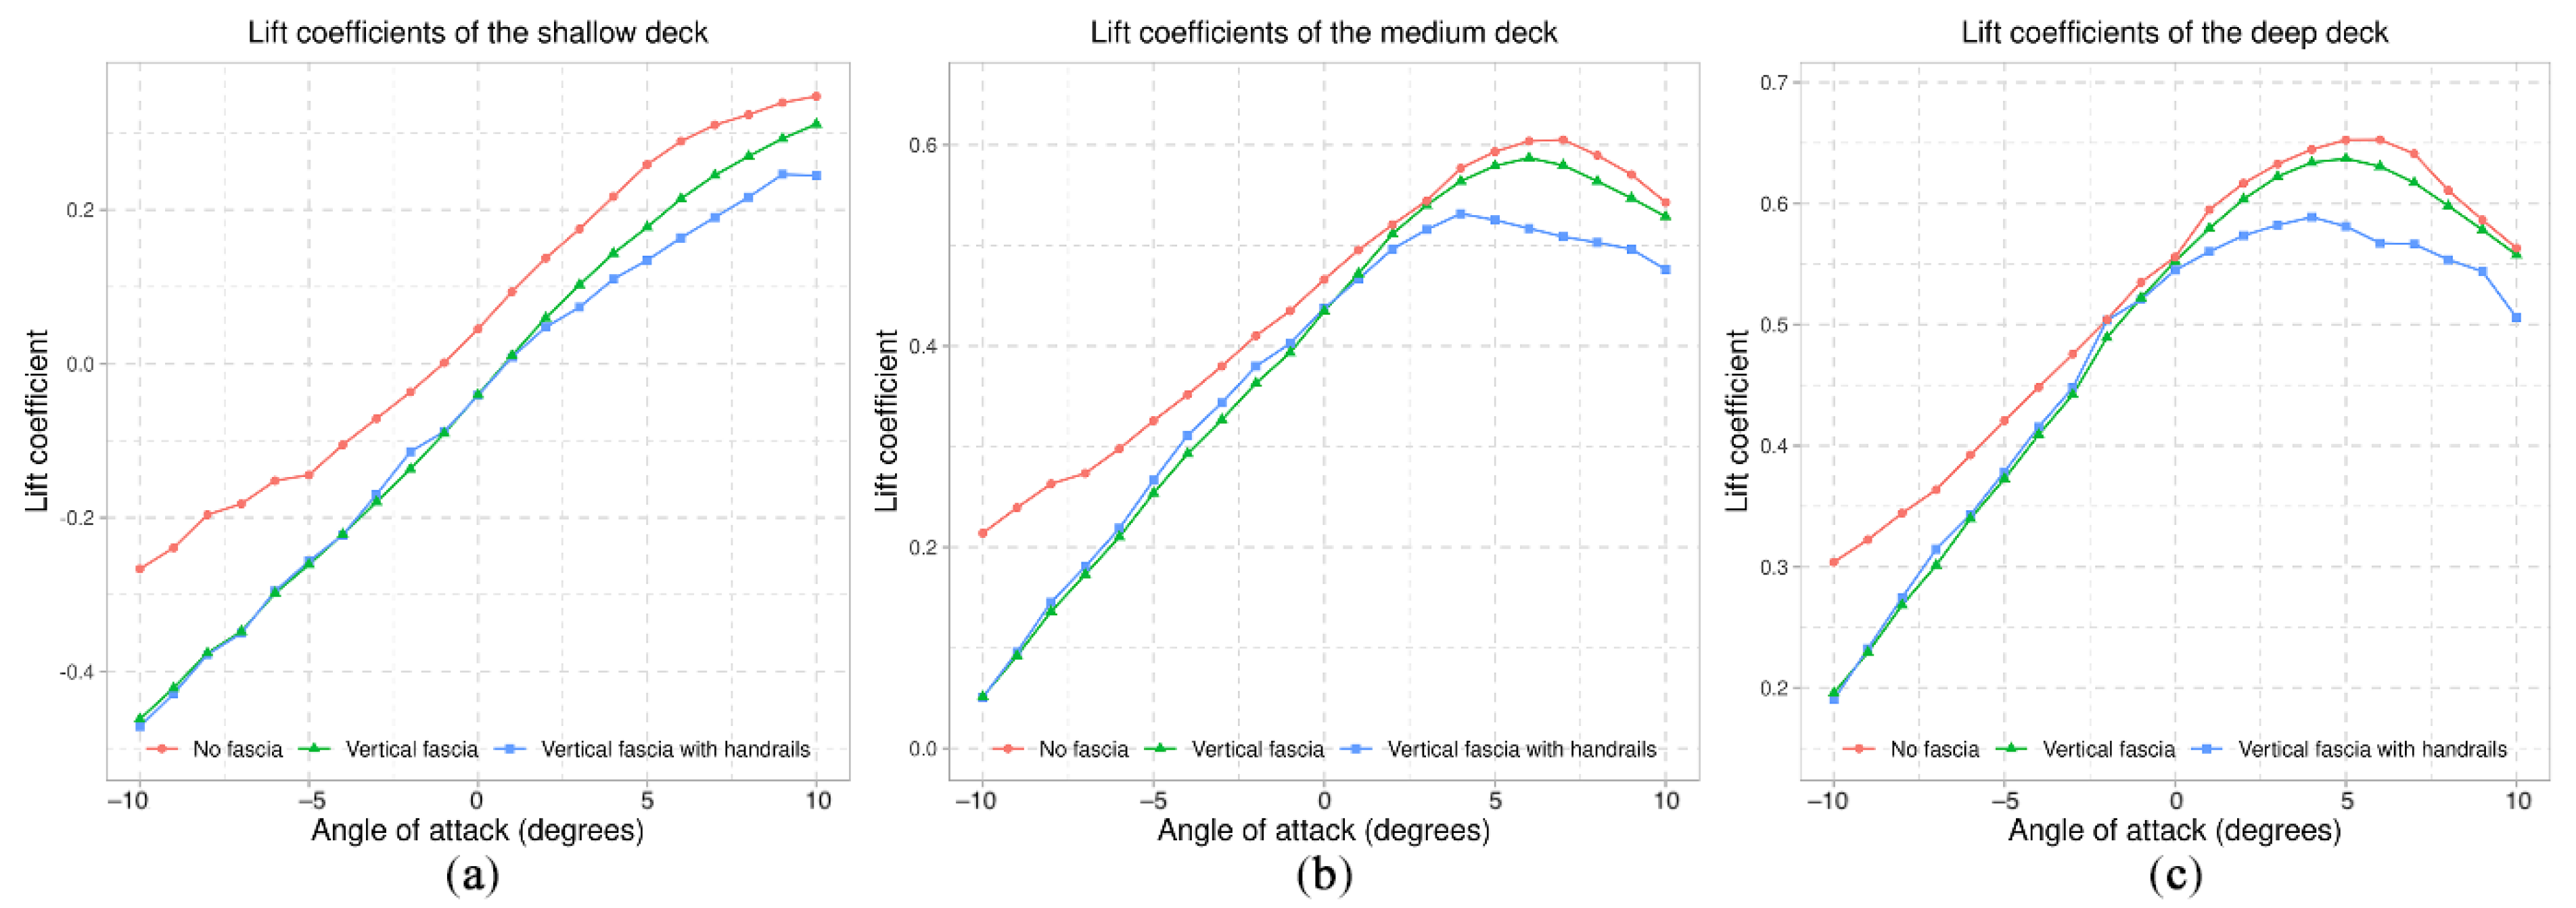
The presence of fascia beams also has appreciable effects on the lift coefficients (Figure 25). For the shallow deck with positive angles of attack, lift coefficients are reduced by 31.5% to 53.9% with the vertical and inclined fascia beams, respectively. The differences between the inclined fascia beam and the curved fascia beam are negligible (Figure 25a). For negative angles of attack, the lift coefficients for bridge decks with fascia beams are up to 126.8% larger. Lift coefficients for the medium and deep decks with fascia beams are smaller in magnitude compared to decks without fascia beams. Exceptions are found in configurations of large positive angles of attack. For the medium deck with the curved fascia beam at an angle of attack of 10 degrees, the lift coefficient is 20.9% larger compared to the medium deck without fascia beams. The lift coefficient is 46.1% larger in deep decks with curved fascia beam than in deep decks without fascia beams at an angle of attack of 10 degrees.
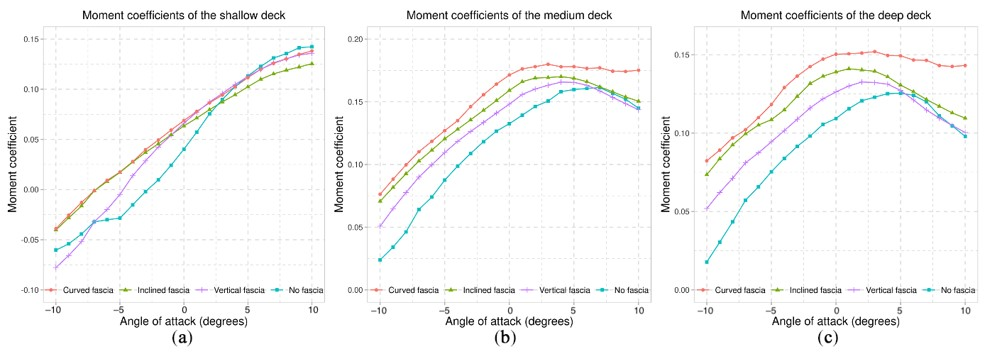
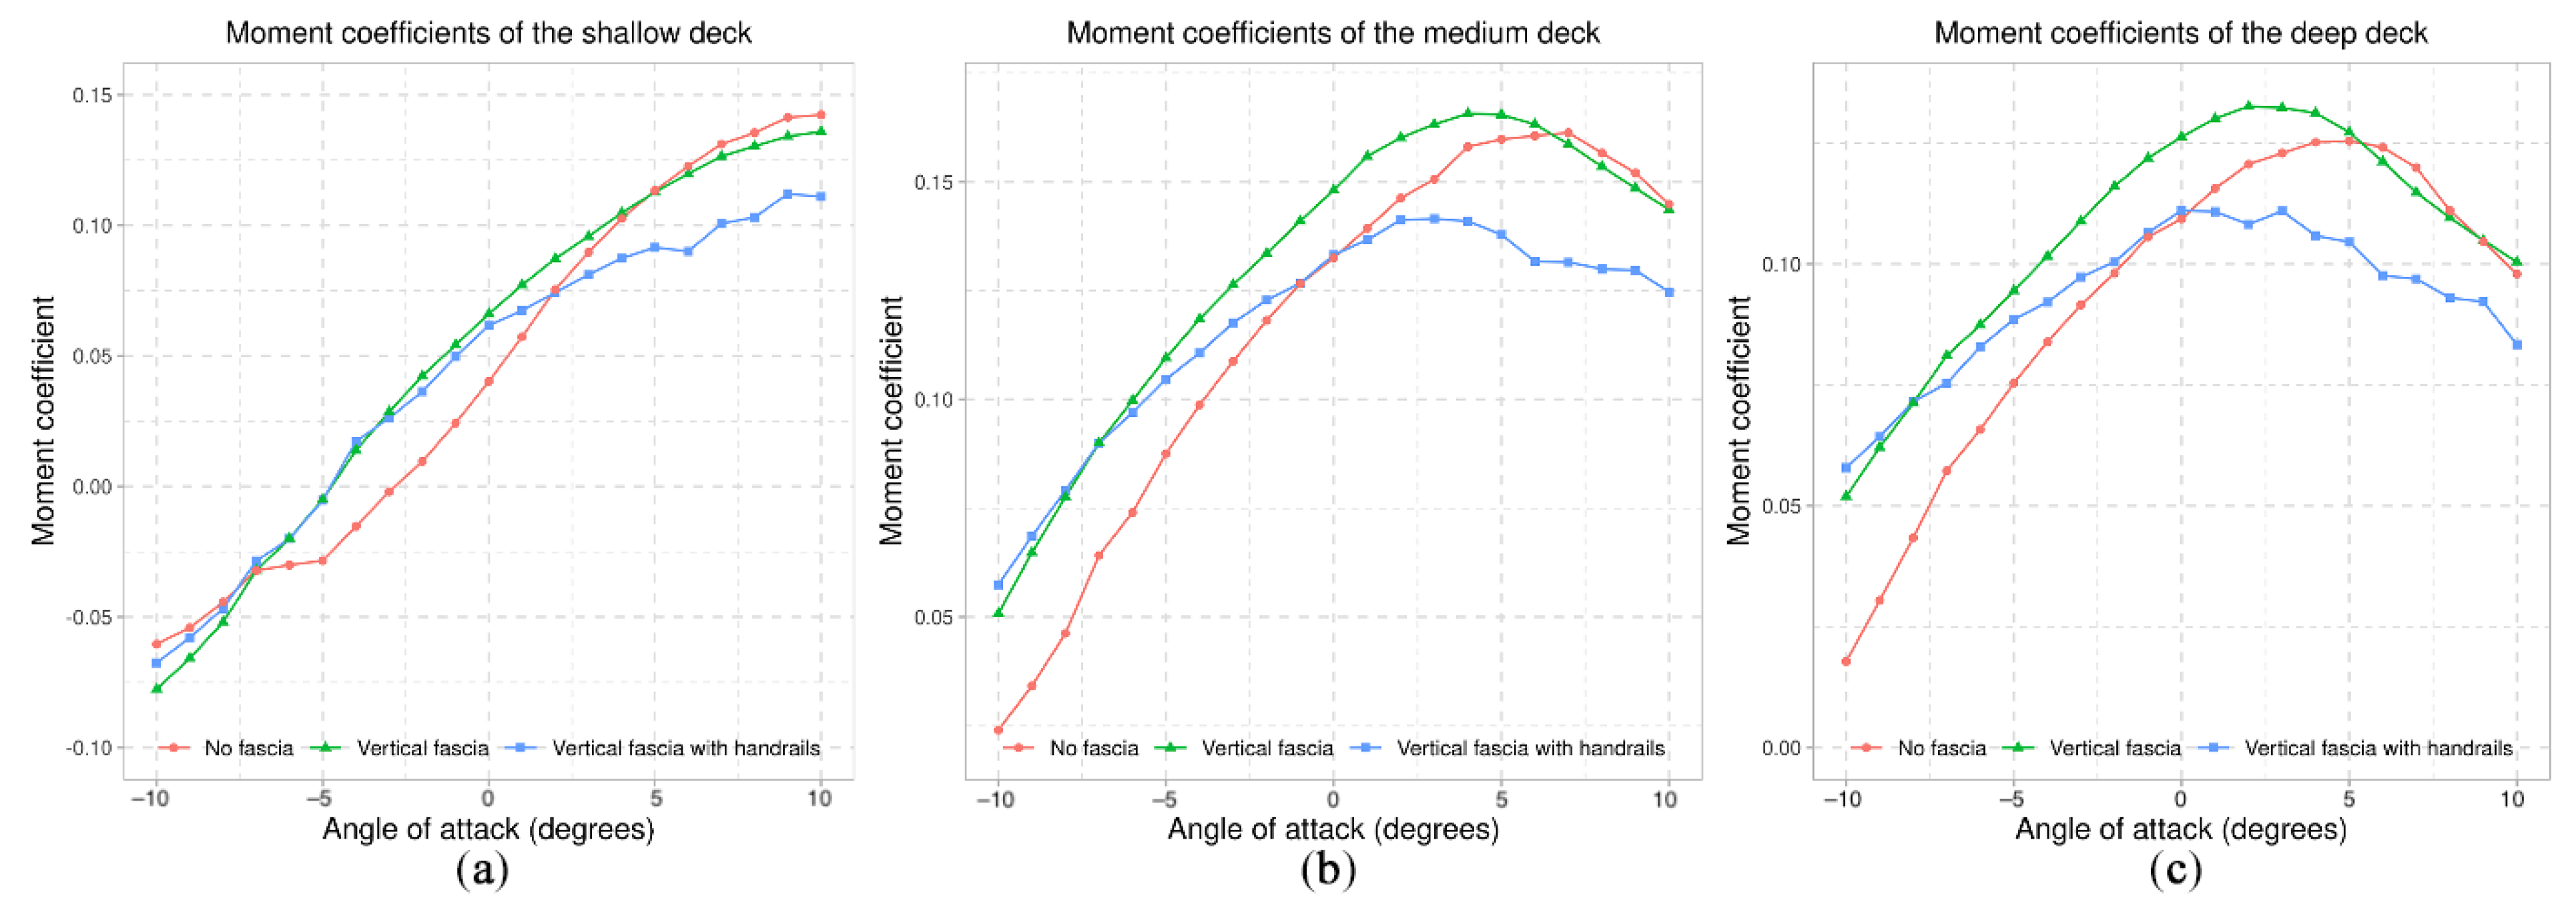
Differences in moment coefficients of the shallow deck caused by the presence of fascia beams are relatively small (Figure 26), whereas the medium and deep decks have larger moment coefficients. The curved fascia beam leads to the largest increase in moment coefficients for the medium and deep decks at an angle of attack of −10 degrees, by 217.9% and 312.8%, respectively. Overall, the vertical fascia beam resulted in the least change in aerodynamic coefficients when compared to the other options. In the final design of the Rose Fitzgerald, the vertical fascia beam was selected due to its simplicity to manufacture.

7.2. Handrails

Handrails (Figure 27a) were then included in the model with the vertical fascia beam to assess their impact on the aerodynamic coefficients of bridge decks. Locations of these handrails are shown in Figure 27b.
Aerodynamic coefficients of bridge decks with handrails are shown in Figure 28, Figure 29 and Figure 30.
As shown in Figure 28, the presence of the handrails has an appreciable effect on increasing drag coefficients of all three decks. Compared to bridge decks with vertical fascia beams, drag coefficients of the shallow, medium, and deep decks with vertical fascia beams and handrails increased by 6.3% to 13.4%, 2.3% to 5.1%, and 2.5% to 3.8%, respectively. Compared to bridge decks without any secondary structures, drag coefficients of the shallow, medium, and deep decks with vertical fascia beams and handrails increased by 10.4% to 32%, 4.9% to 15.2%, and 7.9% to 13.4%, respectively. Interestingly, the effect of handrails on lift coefficients (Figure 29) of the three decks is negligible for cases with negative angles of attack. For cases with positive angles of attack, the installation of handrails appears to reduce the lift coefficients. Compared to bridge decks without any secondary structures, the largest reduction in lift coefficients of the shallow, medium, and deep decks are 94.3%, 76.2%, and 37.4%, respectively. As shown in Figure 30a, the presence of handrails provides a stabilizing effect on the shallow deck with vertical fascia beams, where magnitudes of moment coefficients are reduced by 2.5% to 52.2%. This stabilizing effect is also seen in the moment coefficients of medium (Figure 30b) and deep decks (Figure 30c), where maximum reductions in moment coefficients are 16.3% and 18.2%, respectively.
This analysis demonstrates that fascia beams and handrails have a substantial effect on aerodynamic coefficients. Fascia beams significantly increased the drag coefficients, particularly for shallower bridge decks. The inclusion of fascia beams was shown to reduce lift and moment coefficients, especially at large angles of attack. Similarly, the presence of handrails was also shown to increase drag coefficients of bridge decks. They also considerably reduced lift coefficients at large angles of attack and provided bridge decks with a stabilizing effect. Overall, the neglection of fascia beams in simulations can significantly underestimate drag coefficients and overestimate lift and moment coefficients. Therefore, the inclusion of secondary structures in CFD simulations to evaluate aerodynamic performance of bridge decks at service stage is essential.

8. Conclusions

In this paper, a 3D CFD model of the bridge deck of the Rose Fitzgerald Kennedy Bridge has been developed. Sensitivity studies of the mesh, the domain, and the turbulence modelling approach have been conducted to verify the numerical solutions. Through these sensitivity studies, it is found that these factors have significant influence on the simulation results. In particular, it is found that the attempt to save on computational power by reducing the length of domain will lead to results that are notably different from results calculated using a full-length domain. It has also been found that there are significant differences between results of simulations with the k-ε turbulence model and other models. RANS simulations with the k-ω SST model can deliver results that agree well with DES results and are over 60 times faster than DES. To validate the model, time-averaged aerodynamic coefficients of three different bridge decks are determined using the model and have shown a general agreement with those derived from corresponding wind tunnel tests. However, some discrepancies exist in the comparison of numerical results and wind tunnel results, which might be attributed to blockage ratios at large angle of attack, combined effect of blockage ratios and the side plate effect, and the sensor interference in wind tunnel tests, which deserve further investigation. The model has been applied to study the effect of secondary structures, namely fascia beams and handrails, on the aerodynamic coefficients of the selected three bridge decks. It has been found that these secondary structures significantly increase drag coefficients (up to 32%) and reduce lift coefficients (up to 94.3%) and moment coefficients (up to 52.2%), which demonstrates the importance of taking these into account when evaluating the aerodynamic performance of bridge decks in-service.

Author Contributions

Conceptualization, J.K., P.C., and Y.Z.; resources, F.C.; writing—original draft preparation, Y.Z.; writing—review and editing, J.K., P.C., and F.C.; supervision, J.K. All authors have read and agreed to the published version of the manuscript.

Funding

This research was funded by China Scholarship Council, grant number 201808300003.

Data Availability Statement

The data presented in this study are available on request from the corresponding author.

Acknowledgments

The authors wish to acknowledge the Irish Centre for High-End Computing (ICHEC) for the provision of computational facilities and support. The authors also wish to acknowledge Transport Infrastructure Ireland (TII) for the provision of relevant experimental data. Additionally, Yuxiang Zhang acknowledges the scholarship received jointly from University College Dublin and the China Scholarship Council.

Conflicts of Interest

The authors declare no conflict of interest. The funders had no role in the design of the study; in the collection, analyses, or interpretation of data; in the writing of the manuscript, or in the decision to publish the results.

References

  1. Kumarasena, S.; Jones, N.; Irwin, P.; Taylor, P. Wind-Induced Vibration of Stay Cables; Publication No. FHWA-RD-05-083; Technical Report; Federal Highway Administration: Springfield, VA, USA, 2007. [Google Scholar]
  2. Fujino, Y.; Yoshida, Y. Wind-induced vibration and control of Trans-Tokyo Bay crossing bridge. J. Struct. Eng. 2002, 128, 1012–1025. [Google Scholar] [CrossRef]
  3. Zhang, C. Humen Bridge remains closed after shaking. China Daily, 6 May 2020. [Google Scholar]
  4. Larsen, A.; Yeung, N.; Carter, M. Stonecutters Bridge, Hong Kong: Wind tunnel tests and studies. Proc. Inst. Civil Eng. Bridge Eng. 2012, 165, 91–104. [Google Scholar] [CrossRef]
  5. Ma, C.-m.; Duan, Q.-s.; Liao, H.-l. Experimental investigation on aerodynamic behavior of a long span cable-stayed bridge under construction. KSCE J. Civ. Eng. 2018, 22, 2492–2501. [Google Scholar] [CrossRef]
  6. Larsen, A.; Savage, M.; Lafrenière, A.; Hui, M.C.; Larsen, S.V. Investigation of vortex response of a twin box bridge section at high and low Reynolds numbers. J. Wind Eng. Ind. Aerodyn. 2008, 96, 934–944. [Google Scholar] [CrossRef]
  7. Marra, A.M.; Mannini, C.; Bartoli, G. Wind tunnel modeling for the vortex-induced vibrations of a yawed bridge tower. J. Bridge Eng. 2017, 22, 04017006. [Google Scholar] [CrossRef]
  8. Xin, D.; Zhang, H.; Ou, J. Experimental study on mitigating vortex-induced vibration of a bridge by using passive vortex generators. J. Wind Eng. Ind. Aerodyn. 2018, 175, 100–110. [Google Scholar] [CrossRef]
  9. Hu, C.; Zhao, L.; Ge, Y. Mechanism of suppression of vortex-induced vibrations of a streamlined closed-box girder using additional small-scale components. J. Wind Eng. Ind. Aerodyn. 2019, 189, 314–331. [Google Scholar] [CrossRef]
  10. Guntorojati, I. Flutter analysis of cable stayed bridge. Procedia Eng. 2017, 171, 1173–1177. [Google Scholar]
  11. Yang, Y.; Zhou, R.; Ge, Y.; Zhang, L. Flutter Characteristics of Thin Plate Sections for Aerodynamic Bridges. J. Bridge Eng. 2018, 23, 04017121. [Google Scholar] [CrossRef]
  12. Niu, H.; Zhu, J.; Chen, Z.; Zhang, W. Dynamic performance of a slender truss bridge subjected to extreme wind and traffic loads considering 18 flutter derivatives. J. Aerosp. Eng. 2019, 32, 04019082. [Google Scholar] [CrossRef]
  13. Mei, H.; Wang, Q.; Liao, H.; Fu, H. Improvement of Flutter Performance of a Streamlined Box Girder by Using an Upper Central Stabilizer. J. Bridge Eng. 2020, 25, 04020053. [Google Scholar] [CrossRef]
  14. Hikami, Y.; Shiraishi, N. Rain-wind induced vibrations of cables stayed bridges. J. Wind Eng. Ind. Aerodyn. 1988, 29, 409–418. [Google Scholar] [CrossRef]
  15. Jing, H.; Xia, Y.; Li, H.; Xu, Y.; Li, Y. Excitation mechanism of rain–wind induced cable vibration in a wind tunnel. J. Fluids Struct. 2017, 68, 32–47. [Google Scholar] [CrossRef]
  16. Cheng, P.; Li, W.-J.; Chen, W.-L.; Gao, D.-L.; Xu, Y.; Li, H. Computer vision-based recognition of rainwater rivulet morphology evolution during rain–wind-induced vibration of a 3D aeroelastic stay cable. J. Wind Eng. Ind. Aerodyn. 2018, 172, 367–378. [Google Scholar] [CrossRef]
  17. Gao, D.; Chen, W.; Eloy, C.; Li, H. Multi-mode responses, rivulet dynamics, flow structures and mechanism of rain-wind induced vibrations of a flexible cable. J. Fluids Struct. 2018, 82, 154–172. [Google Scholar] [CrossRef]
  18. Reddy, K.; Sharma, D.; Poddar, K. Effect of end plates on the surface pressure distribution of a given cambered airfoil: Experimental study. In New Trends in Fluid Mechanics Research; Springer: Berlin/Heidelberg, Germany, 2007; p. 286. [Google Scholar]
  19. Simiu, E.; Scanlan, R.H. Wind Effects on Structures: Fundamentals and Applications to Design; John Wiley: New York, NY, USA, 1996. [Google Scholar]
  20. Murakami, S.; Mochida, A. 3-D numerical simulation of airflow around a cubic model by means of the k-ϵ model. J. Wind Eng. Ind. Aerodyn. 1988, 31, 283–303. [Google Scholar] [CrossRef]
  21. Kuroda, S. Numerical simulation of flow around a box girder of a long span suspension bridge. J. Wind Eng. Ind. Aerodyn. 1997, 67, 239–252. [Google Scholar] [CrossRef]
  22. Selvam, R.P.; Tarini, M.J.; Larsen, A. Computer modelling of flow around bridges using LES and FEM. J. Wind Eng. Ind. Aerodyn. 1998, 77, 643–651. [Google Scholar] [CrossRef]
  23. Anina, Š.; Ruediger, H.; Stanko, B. Numerical simulations and experimental validations of force coefficients and flutter derivatives of a bridge deck. J. Wind Eng. Ind. Aerodyn. 2015, 144, 172–182. [Google Scholar] [CrossRef]
  24. Xu, F.; Zhang, Z. Free vibration numerical simulation technique for extracting flutter derivatives of bridge decks. J. Wind Eng. Ind. Aerodyn. 2017, 170, 226–237. [Google Scholar] [CrossRef]
  25. Helgedagsrud, T.A.; Bazilevs, Y.; Mathisen, K.M.; Øiseth, O.A. Computational and experimental investigation of free vibration and flutter of bridge decks. Comput. Mech. 2019, 63, 121–136. [Google Scholar] [CrossRef]
  26. Sarwar, M.W.; Ishihara, T. Numerical study on suppression of vortex-induced vibrations of box girder bridge section by aerodynamic countermeasures. J. Wind Eng. Ind. Aerodyn. 2010, 98, 701–711. [Google Scholar] [CrossRef]
  27. Zhang, H.; Xin, D.; Ou, J. Wake control using spanwise-varying vortex generators on bridge decks: A computational study. J. Wind Eng. Ind. Aerodyn. 2019, 184, 185–197. [Google Scholar] [CrossRef]
  28. Zhang, T.; Sun, Y.; Li, M.; Yang, X. Experimental and numerical studies on the vortex-induced vibration of two-box edge girder for cable-stayed bridges. J. Wind Eng. Ind. Aerodyn. 2020, 206, 104336. [Google Scholar] [CrossRef]
  29. Chen, X.; Qiu, F.; Tang, H.; Li, Y.; Xu, X. Effects of Secondary Elements on Vortex-Induced Vibration of a Streamlined Box Girder. KSCE J. Civ. Eng. 2021, 25, 173–184. [Google Scholar] [CrossRef]
  30. Li, H.; Chen, W.-L.; Xu, F.; Li, F.-C.; Ou, J.-P. A numerical and experimental hybrid approach for the investigation of aerodynamic forces on stay cables suffering from rain-wind induced vibration. J. Fluids Struct. 2010, 26, 1195–1215. [Google Scholar] [CrossRef]
  31. Xie, P.; Zhou, C.Y. Numerical investigation on effects of rivulet and cable oscillation of a stayed cable in rain-wind-induced vibration. J. Mech. Sci. Technol. 2013, 27, 685–701. [Google Scholar] [CrossRef]
  32. Bi, J.; Guan, J.; Wang, J.; Lu, P.; Qiao, H.; Wu, J. 3d numerical analysis on wind and rain induced oscillations of water film on cable surface. J. Wind Eng. Ind. Aerodyn. 2018, 176, 273–289. [Google Scholar] [CrossRef]
  33. Jing, H.; He, X.; Wang, Z. Numerical modeling of the wind load of a two-dimensional cable model in rain–wind-induced vibration. J. Fluids Struct. 2018, 82, 121–133. [Google Scholar] [CrossRef]
  34. Zhang, Y.; Cardiff, P.; Keenahan, J. Wind-Induced Phenomena in Long-Span Cable-Supported Bridges: A Comparative Review of Wind Tunnel Tests and Computational Fluid Dynamics Modelling. Appl. Sci. 2021, 11, 1642. [Google Scholar] [CrossRef]
  35. Liu, L.; Zhang, L.; Wu, B.; Chen, B. Effect of Accessory Attachment on Static Coefficients in a Steel Box Girder for Long-Span Suspension Bridges. J. Eng. Sci. Technol. Rev. 2017, 10, 68–83. [Google Scholar] [CrossRef]
  36. Li, Y.-L.; Chen, X.-Y.; Yu, C.-J.; Togbenou, K.; Wang, B.; Zhu, L.-D. Effects of wind fairing angle on aerodynamic characteristics and dynamic responses of a streamlined trapezoidal box girder. J. Wind Eng. Ind. Aerodyn. 2018, 177, 69–78. [Google Scholar] [CrossRef]
  37. Kusano, I.; Jakobsen, J.B.; Snæbjörnsson, J.T. CFD simulations of a suspension bridge deck for different deck shapes with railings and vortex mitigating devices. IOP Conf. Ser. Mater. Sci. Eng. 2019, 700, 012003. [Google Scholar] [CrossRef]
  38. Jeong, W.; Liu, S.; Bogunovic Jakobsen, J.; Ong, M.C. Unsteady RANS simulations of flow around a twin-box bridge girder cross section. Energies 2019, 12, 2670. [Google Scholar] [CrossRef] [Green Version]
  39. He, X.; Zhou, L.; Chen, Z.; Jing, H.; Zou, Y.; Wu, T. Effect of wind barriers on the flow field and aerodynamic forces of a train–bridge system. Proc. Inst. Mech. Eng. Part F J. Rail Rapid Transit 2019, 233, 283–297. [Google Scholar] [CrossRef]
  40. Bowe, M.; Murphy, J.; Shinkwin, J. The Rose Fitzgerald Kennedy Bridge; PROF-ENG: Velká Hraštice, Czech Republic, 2020. [Google Scholar]
  41. ASCE. Wind Tunnel Testing for Buildings and Other Structures ASCE/SEI 49-12; American Society of Civil Engineers: Washington, DC, USA, 2012. [Google Scholar]
  42. Gutiérrez, M.O.; Longhi, S.F.; Ortega, O.G. Wind Loads and Wind Condition on a Section of the New Ross Bypass Bridge (Ireland); Universidad Politécnica de Madrid: Madrid, Spain, 2017. [Google Scholar]
  43. Eurocode, C. 1: Actions on Structures–Part 1.4: General Actions–Wind Actions; The European Standard EN: Brussels, Belgium, 2005. [Google Scholar]
  44. Menter, F.R.; Kuntz, M.; Langtry, R. Ten years of industrial experience with the SST turbulence model. Turbul. Heat Mass Transf. 2003, 4, 625–632. [Google Scholar]
  45. Nguyen, V.-M.; Phan, T.-H.; Phan, H.-N.; Nguyen, D.-A.; Ha, M.-N.; Nguyen, D.-T. Three-Dimensional Study on Aerodynamic Drag Coefficients of Cable-Stayed Bridge Pylons by Finite Element Method. In Structural Health Monitoring and Engineering Structures; Springer: Singapore, 2021; pp. 489–498. [Google Scholar]
  46. Patankar, S.V.; Spalding, D.B. A calculation procedure for heat, mass and momentum transfer in three-dimensional parabolic flows. In Numerical Prediction of Flow, Heat Transfer, Turbulence and Combustion; Elsevier: Amsterdam, The Netherlands, 1983; pp. 54–73. [Google Scholar]
  47. Jasak, H. Error Analysis and Estimation for the Finite Volume Method with Applications to Fluid Flows. Ph.D. Thesis, University of London, London, UK, 1996. [Google Scholar]
  48. Barrett, R.; Berry, M.; Chan, T.F.; Demmel, J.; Donato, J.; Dongarra, J.; Eijkhout, V.; Pozo, R.; Romine, C.; Van der Vorst, H. Templates for the Solution of Linear Systems: Building Blocks for Iterative Methods; SIAM: Philadelphia, PA, USA, 1994. [Google Scholar]
  49. Van der Vorst, H.A. Bi-CGSTAB: A fast and smoothly converging variant of Bi-CG for the solution of nonsymmetric linear systems. SIAM J. Sci. Stat. Comput. 1992, 13, 631–644. [Google Scholar] [CrossRef]
  50. Issa, R.I. Solution of the implicitly discretised fluid flow equations by operator-splitting. J. Comput. Phys. 1986, 62, 40–65. [Google Scholar] [CrossRef]
  51. Chevalier, C.; Pellegrini, F. PT-Scotch: A tool for efficient parallel graph ordering. Parallel Comput. 2008, 34, 318–331. [Google Scholar] [CrossRef] [Green Version]
  52. Venkatesh, T.; Sarasamma, V.; Rajalakshmy, S.; Sahu, K.C.; Govindarajan, R. Super-linear speed-up of a parallel multigrid Navier–Stokes solver on Flosolver. Curr. Sci. 2005, 88, 589–593. [Google Scholar]
  53. Cardiff, P.; Karač, A.; Ivanković, A. A large strain finite volume method for orthotropic bodies with general material orientations. Comput. Methods Appl. Mech. Eng. 2014, 268, 318–335. [Google Scholar] [CrossRef]
  54. Launder, B.E.; Spalding, D.B. The numerical computation of turbulent flows. In Numerical Prediction of Flow, Heat Transfer, Turbulence and Combustion; Elsevier: Amsterdam, The Netherlands, 1983; pp. 96–116. [Google Scholar]
  55. Spalart, P.; Allmaras, S. A One-Equation Turbulence Model for Aerodynamic Flows. In Proceedings of the 30th Aerospace Sciences Meeting and Exhibit, Reno, NV, USA, 6–9 January 1992; p. 439. [Google Scholar]
  56. Tominaga, Y.; Mochida, A.; Murakami, S.; Sawaki, S. Comparison of various revised k–ε models and LES applied to flow around a high-rise building model with 1:1:2 shape placed within the surface boundary layer. J. Wind Eng. Ind. Aerodyn. 2008, 96, 389–411. [Google Scholar] [CrossRef]
  57. Sun, D.; Owen, J.; Wright, N. Application of the k–ω turbulence model for a wind-induced vibration study of 2D bluff bodies. J. Wind Eng. Ind. Aerodyn. 2009, 97, 77–87. [Google Scholar] [CrossRef]
  58. Han, Y.; Chen, H.; Cai, C.; Xu, G.; Shen, L.; Hu, P. Numerical analysis on the difference of drag force coefficients of bridge deck sections between the global force and pressure distribution methods. J. Wind Eng. Ind. Aerodyn. 2016, 159, 65–79. [Google Scholar] [CrossRef]
  59. Holmes, J.D. Wind Loading of Structures; CRC Press: Boca Raton, FL, USA, 2007. [Google Scholar]
  60. Takeda, K.; Kato, M. Wind tunnel blockage effects on drag coefficient and wind-induced vibration. J. Wind Eng. Ind. Aerodyn. 1992, 42, 897–908. [Google Scholar] [CrossRef]
  61. Kubo, Y.; Miyazaki, M.; Kato, K. Effects of end plates and blockage of structural members on drag forces. J. Wind Eng. Ind. Aerodyn. 1989, 32, 329–342. [Google Scholar] [CrossRef]
  62. Jiang, B.; Zhou, Z.; Yan, K.; Hu, C. Effect of Web Inclination of Streamlined Flat Box Deck on Aerostatic Performance of a Bridge. J. Bridge Eng. 2021, 26, 04020126. [Google Scholar] [CrossRef]
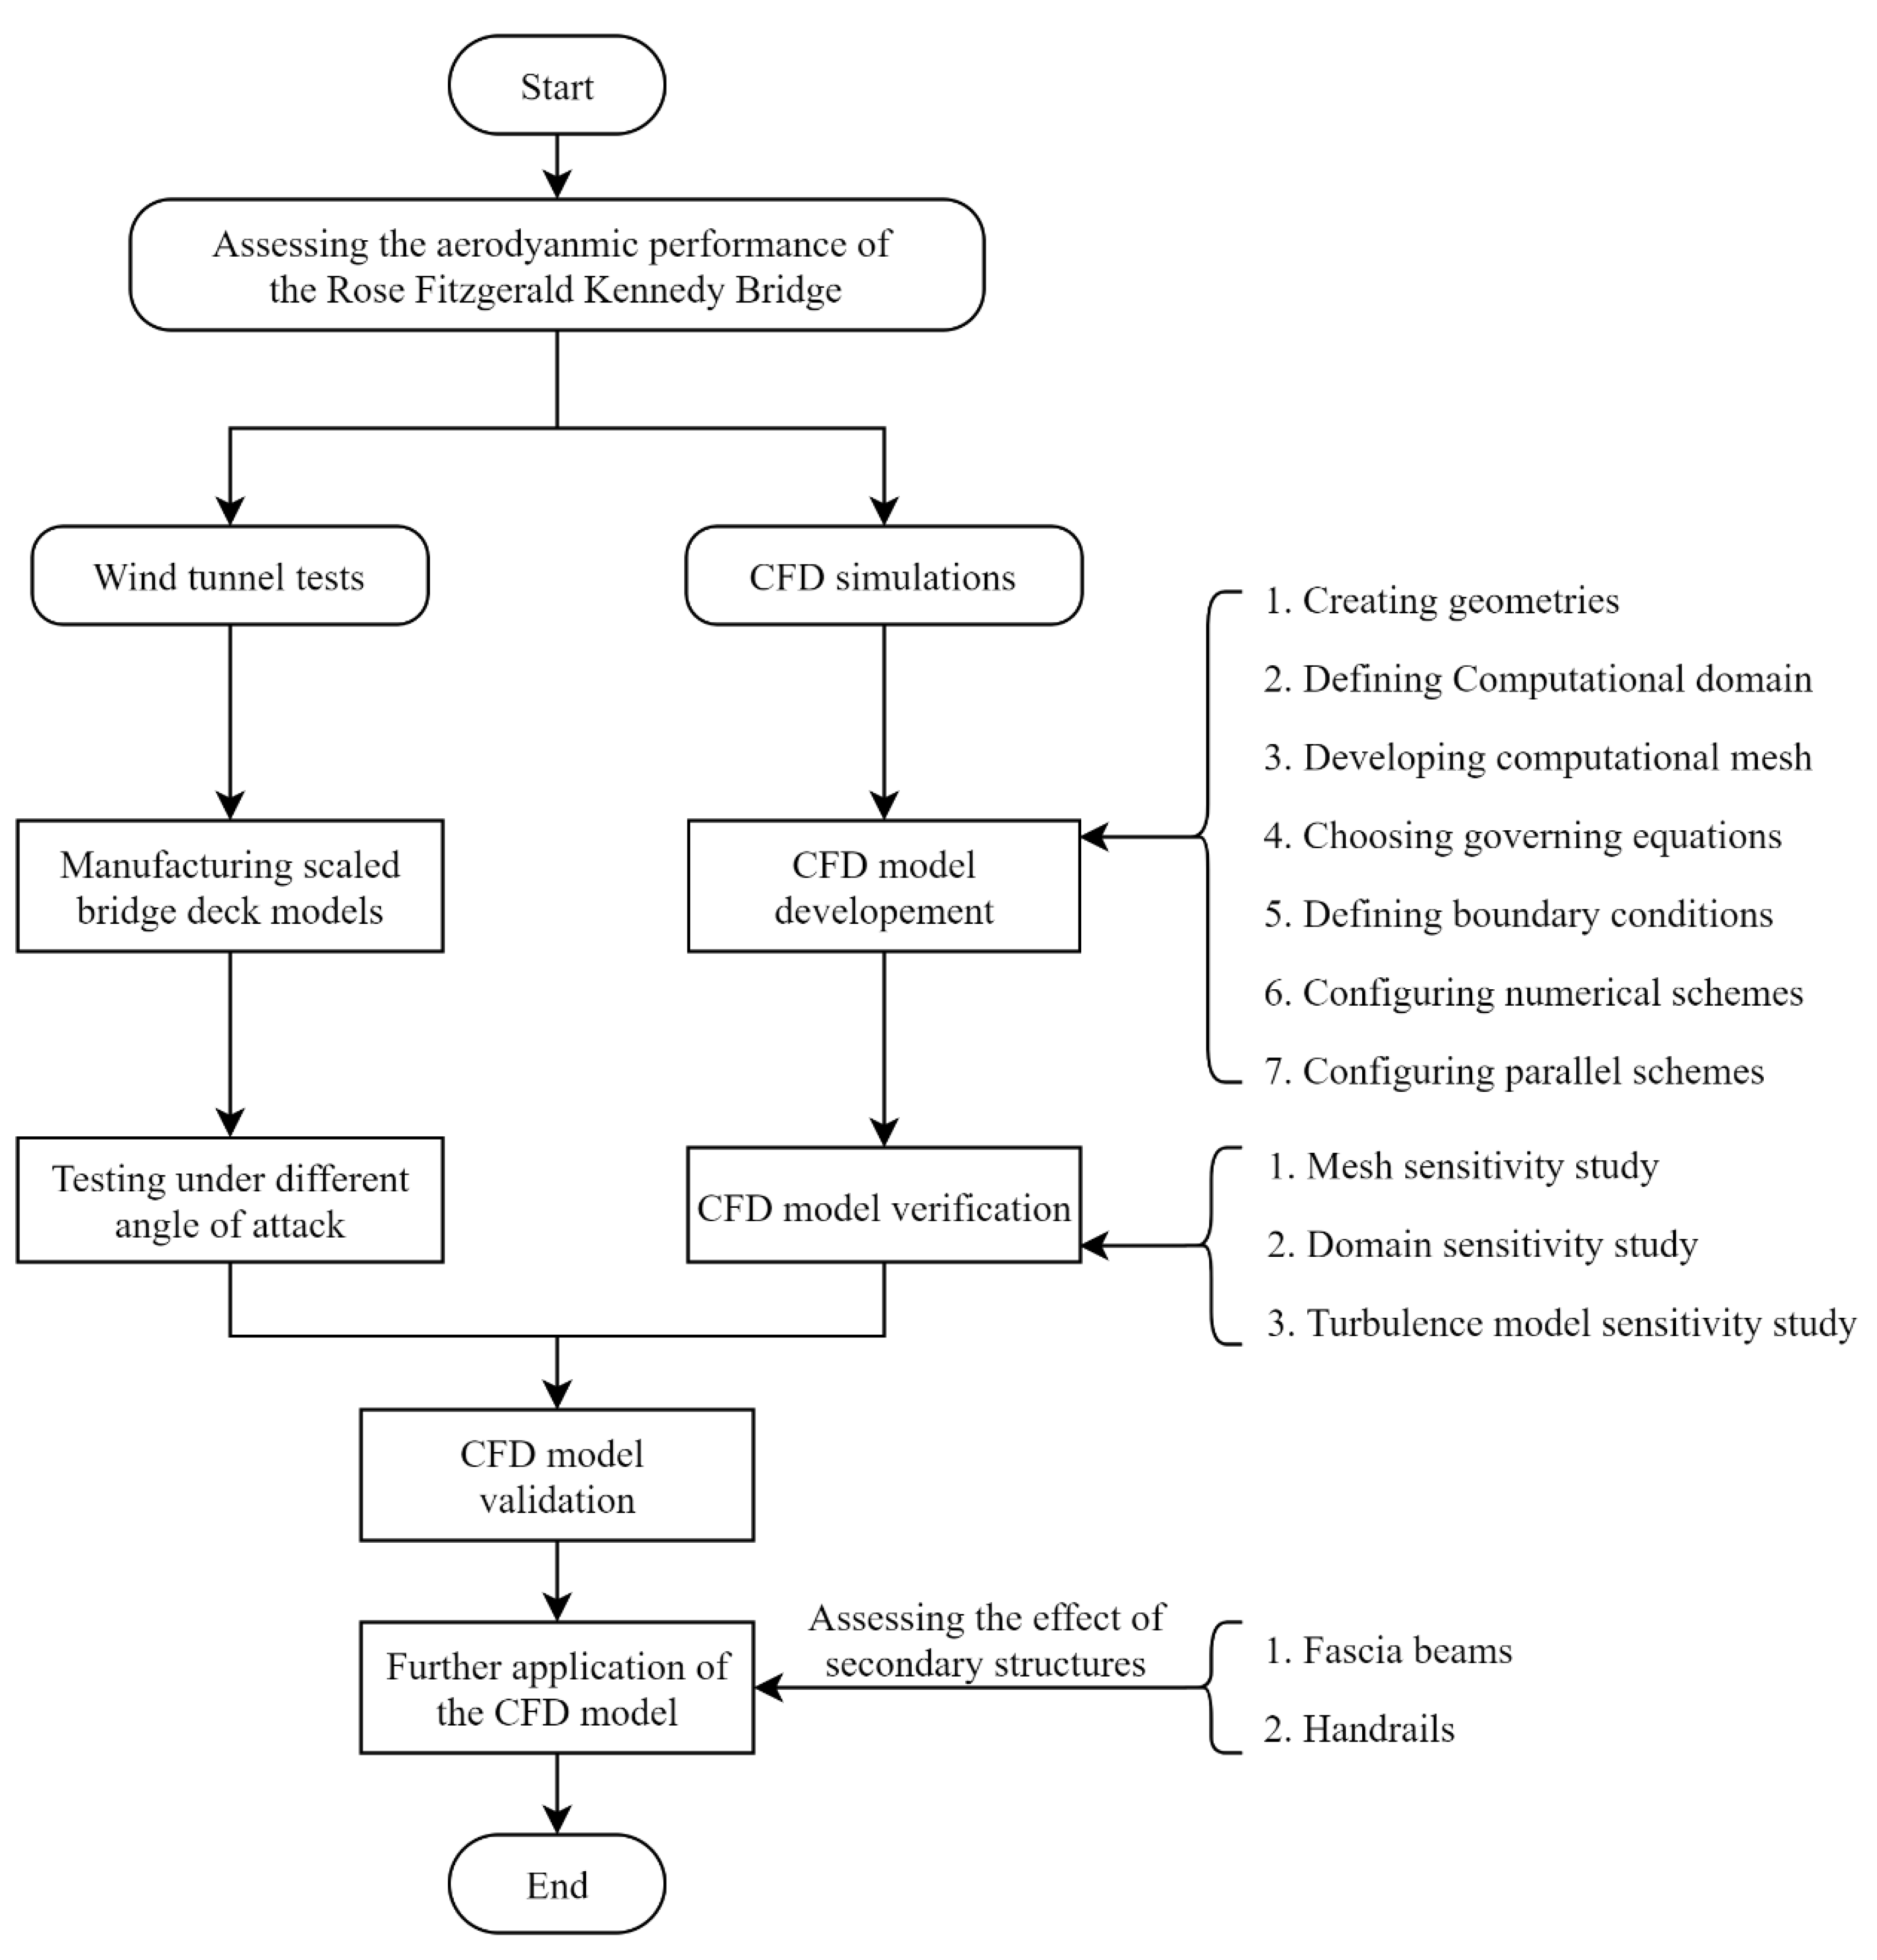
Figure 1. Procedures of the study.
Civileng 02 00057 g001
Figure 2. View of the Rose Fitzgerald Kennedy Bridge.
Civileng 02 00057 g002
Figure 3. Configurations of the wind tunnel: (a) Cross section of the wind tunnel; (b) Bridge model on the rotational plate [42].
Civileng 02 00057 g003
Figure 4. Dimensions of bridge deck models: (a) Geometry of the shallow deck; (b) Geometry of the medium deck; (c) Geometry of the deep deck.
Civileng 02 00057 g004
Figure 5. Sign convention of the angle of attack.
Civileng 02 00057 g005
Figure 6. Rotational configurations of the bridge deck.
Civileng 02 00057 g006
Figure 7. Computational domain used in simulations.
Civileng 02 00057 g007
Figure 8. Configurations of the mesh: (a) View of the internal mesh; (b) View of the boundary layer mesh; (c) Plot of the y+ value.
Civileng 02 00057 g008
Figure 9. Parallel simulation time and speed-up: (a) Parallel simulation time; (b) Parallel simulation speed-up.
Civileng 02 00057 g009
Figure 10. Details of mesh No.1.
Civileng 02 00057 g010
Figure 11. Details of mesh No.2.
Civileng 02 00057 g011
Figure 12. Details of mesh No.3.
Civileng 02 00057 g012
Figure 13. Details of mesh No.4.
Civileng 02 00057 g013
Figure 14. Details of mesh No.5.
Civileng 02 00057 g014
Figure 15. Effect of mesh density on y+ value and computational time: (a) Average y+ value at the bridge surface; (b) Computational time of different mesh.
Civileng 02 00057 g015
Figure 16. Comparison of aerodynamic coefficients in the mesh sensitivity study: (a) Drag coefficients; (b) Lift coefficients; (c) Moment coefficients.
Civileng 02 00057 g016
Figure 17. Domain sizes considered in the domain sensitivity study.
Civileng 02 00057 g017
Figure 18. Comparison of aerodynamic coefficients in the domain sensitivity study: (a) Drag coefficients: (b) Lift coefficients; (c) Moment coefficients.
Civileng 02 00057 g018
Figure 19. Comparison of aerodynamic coefficients in the turbulence model sensitivity study: (a) Drag coefficients; (b) Lift coefficients; (c) Moment coefficients.
Civileng 02 00057 g019
Figure 20. Drag coefficients of different bridge decks: (a) the shallow deck; (b) the medium deck; (c) the deep deck.
Civileng 02 00057 g020
Figure 21. Lift coefficients of different bridge decks: (a) the shallow deck; (b) the medium deck; (c) the deep deck.
Civileng 02 00057 g021
Figure 22. Moment coefficients of different bridge decks: (a) the shallow deck; (b) the medium deck; (c) the deep deck.
Civileng 02 00057 g022
Figure 23. Fascia beams considered in the design: (a) Vertical fascia beam; (b) Inclined fascia beam; (c) Curved fascia beam; (d) Locations of fascia beams on the deck.
Civileng 02 00057 g023
Figure 24. Change in drag coefficient for each fascia beam for the (a) shallow deck, (b) medium deck, and (c) deep deck.
Civileng 02 00057 g024
Figure 25. Change in lift coefficient for each fascia beam for the (a) shallow deck, (b) medium deck, and (c) deep deck.
Civileng 02 00057 g025
Figure 26. Change in moment coefficients for each fascia beam for the (a) shallow deck, (b) medium deck, and (c) deep deck.
Civileng 02 00057 g026
Figure 27. Handrails of the bridge deck: (a) Dimensions of handrails; (b) Locations of handrails on the shallow deck with vertical fascia beams.
Civileng 02 00057 g027
Figure 28. Change in drag coefficients with the inclusion of vertical fascia beams and handrails for the (a) shallow deck, (b) medium deck, and (c) deep deck.
Civileng 02 00057 g028
Figure 29. Change in lift coefficients with the inclusion of vertical fascia beams and handrails for the (a) shallow deck, (b) medium deck, and (c) deep deck.
Civileng 02 00057 g029
Figure 30. Change in moment coefficients with the inclusion of vertical fascia beams and handrails for the (a) shallow deck, (b) medium deck, and (c) deep deck.
Civileng 02 00057 g030
Table 1. Boundary conditions of simulations based on the k-ω SST model.
Boundary RegionParameterTypeValueUnitSurface-Normal Gradient
InletUDirichlet5.9m/s-
pNeumann-m2/s20
kDirichlet1.17m2/s2-
ωDirichlet2.9s−1-
outletUNeumann-m/s0
pDirichlet0m2/s2-
kNeumann-m2/s20
ωNeumann-s−10
wallUno-slip0m/s-
pNeumann-m2/s20
kAdaptive wall function-m2/s2-
ωAdaptive wall function-s−1-
Table 2. A summary of linear solvers.
ParameterLinear SolverSolving Tolerance
pPreconditioned conjugate gradient [48]1 × 10⁻¹¹
U, k, ω, ε,   ν ˜   Preconditioned bi-conjugate gradient [49]1 × 10⁻¹¹
Table 3. Results of the strong scalability test of a case with 31 million cells.
Number of CPU CoresWall-Clock Time (In h)Speed-UpCells Per CPU Core
1965.28 (estimated)-33,189,094
1660.33161,937,500
3235.8826.903968,750
6416.3159.172484,375
1287.84123.023242,188
2563.61267.175121,094
Table 4. Cell count of the five mesh schemes.
ConfigurationsCell Count of Mesh No.1Cell Count of Mesh No.2Cell Count of Mesh No.3Cell Count of Mesh No.4Cell Count of Mesh No.5
−10°452,1381,962,32414,607,63633,242,17085,922,392
454,1441,973,22714,575,02033,189,09486,008,513
10°448,1441,972,35514,608,86033,227,28986,441,092
Table 5. Boundary conditions of k, ε and   ν ˜   .
Boundary Regionk, (In the k-ε Model) ε, (In the k-ε Model)   ν ˜   (In the SAS Model)
inletDirichlet (1.17 m2/s2)Dirichlet (0.56 m2/s3)Dirichlet (0.74 m2/s)
outletNeumann with zero surface-normal gradientNeumann with zero surface-normal gradientNeumann with zero surface-normal gradient
walladaptive wall functionadaptive wall functionadaptive wall function
Publisher’s Note: MDPI stays neutral with regard to jurisdictional claims in published maps and institutional affiliations.