Article

Multidecadal Analysis of an Engineered River System Reveals Challenges for Model-Based Design of Human Interventions

by
Koen D. Berends
1,2,
Matthijs R. A. Gensen
1,*,
Jord J. Warmink
1 and
Suzanne J. M. H. Hulscher
1
1
Department of Marine and Fluvial Systems, University of Twente, P.O. Box 2017, 7500 AE Enschede, The Netherlands
2
Department of River Dynamics and Inland Shipping, Deltares, Boussinesqweg 1, 2629 HV Delft, The Netherlands
*
Author to whom correspondence should be addressed.
CivilEng 2021, 2(3), 580-598; https://doi.org/10.3390/civileng2030032
Submission received: 17 May 2021 / Revised: 7 July 2021 / Accepted: 9 July 2021 / Published: 14 July 2021
(This article belongs to the Section Water Resources and Coastal Engineering)

Abstract

:
Hydraulic models were used in practice to predict the effect of human intervention during extreme conditions. However, the accuracy of such predictions remains untested. In this study, we compare a simulated trend in water levels covering a twenty-year period of large-scale human intervention with a thirty-year observational record. The results show that the observed water levels display a linearly decreasing trend attributed to channel bed erosion. A deviation from this trend, which would be an indication of the effect of human intervention, was not observed. We propose that the most likely explanation for this is that any effect observable at lower discharge is hidden in the uncertainty of the rating curve. Given the inherent uncertainties associated with making predictions about a changing system for conditions with a low period of return, we argue that model uncertainty should be considered in intervention design.

1. Introduction

In January 1995, high discharge on the River Rhine prompted the evacuation of more than two hundred thousand people from flood-prone regions in The Netherlands. Although flood defences ultimately held, this event was instrumental to green-lighting a large-scale program to revise the Dutch Rhine branches. This program, which would become known as “Room for the River”, consisted of 39 coordinated interventions in the river system between 1995 and 2017 (Figure 1). It differed from previous efforts to increase flood safety in that the interventions did not focus on the primary flood defences (i.e., the dikes) but on spatial interventions that increased the conveyance capacity of the system by lowering the water levels during a design discharge. Examples of such interventions include side channels [1], flow-parallel longitudinal training dams instead of flow-orthogonal groynes [2,3] and other interventions [4,5]. The design of these spatially complex interventions was to a large extent based on model simulations [6], which presupposes a certain trust in their output.
The credibility of model simulations is in part based on proven accuracy by comparing model output with observations of reality. Hydraulic models used in Room for the River were optimised (calibrated) on available observations, resulting in adequate accuracy under observed conditions. However, it could be argued that historical evidence is still insufficient to claim a high accuracy for intervention designs because this requires both extrapolation to extreme discharges and extrapolation to changed conditions (i.e., the assumption of stationarity of model error [7,8,9]).
The use of model simulations based on limited empirical support in decision making has come under increased scrutiny at the turn of the century [10,11]. There has since been broad scientific consensus that an uncertainty analysis is indispensable in model-supported decision making, especially when models are used to predict the future [12,13,14]. In the literature, the uncertainty quantification of river models for extreme discharges is generally performed by propagating uncertainty in model assumptions to model the output by way of Monte Carlo simulation [15,16]. Berends et al. [4] extended this approach to uncertainty quantification for simulated hydraulic effects of human intervention. However, it is still unknown how well models are able to predict the hydraulic effects of changes in river systems.
In this paper, we study an unprecedented hydraulic and geographical data set of twenty years of human intervention in the River Waal (Figure 1). These interventions were designed to reduce flood levels, following the near-flood of 1995. In this paper, we analyse long-term trends in water levels using observations and hydraulic modelling. Our objective is to find out to what extent the predicted reduction in flood levels by hydraulic models can be verified using the observational record. First, we describe the simulated changes to flood water levels over time, including parameter uncertainty. Next, we construct Bayesian rating curve models from available observations to provide an independent analysis of water level trends over time. Finally, the simulated and observed trends are compared.

2. Data

In this section, we describe the available geographical and hydraulic data. For both data sets, meta-information is obtained from documentation and from an interview with experts from Rijkswaterstaat (English: Directorate-General for Public Works and Water Management; part of the Dutch Ministry of Infrastructure and Water Management).

2.1. Case Study

The River Waal is the largest (by discharge) and economically most important continuation of the River Rhine in the Dutch Delta (Figure 1). It is a lowland river with a gentle slope of 10 4 m/m, a total length of 85 km, and a single channel with an average width of about 250 m. The Waal draws about two-thirds of the discharge from the River Rhine, with the rest going to the smaller distributary rivers Nederrijn and IJssel, which results in an average discharge of about 1600 m 3 s 1 . In 1995, major rainfall in Europe led to a record discharge of nearly 7850 m 3 s 1 in the River Waal, which brought about a mass evacuation of cities along the River for fear of a dike breach. In response, the Dutch Government instituted the “Ruimte voor de Rivier” (customarily translated as “Room for the River”) programme to increase the flow capacity of the Rhine. The objective of this programme was to lower flood levels with such an amount that, during an even higher discharge (the design discharge was 16,000 m 3 s 1 for the Rhine or 10,165 m 3 s 1 for the Waal), the dikes would not overflow.

2.2. Geographical Database

A database containing detailed geographical information of the Dutch Rhine branches was made available by Rijkswaterstaat. This GIS database is part of the `Baseline’ information system, which is both a protocol for encoding GIS information and software for visualisation, manipulation and building hydraulic models [17]. Baseline has been built for bookkeeping of the changes to the river system following the Room for the River programme, and use of the Baseline is mandatory for new intervention designs [18]. The database consists of a description of the 1995 river system, including a digital elevation model, land-use map and information on structural elements such as dikes, embankments, measurement stations and groynes. Furthermore, the database includes a list of 289 identified changes to the Dutch Rhine system between 1995 and 2016, of which 104 are attributed to the River Waal. Individual changes are either autonomous (e.g., aggradation of the flood plains following a flood event) or anthropogenic (e.g., the construction of a new side channel). Although the list of changes is comprehensive, experts stressed that the list is not exhaustive. The list is limited to known changes and may lag behind reality. For example, measurements of the dike relocation and side channel construction at Nijmegen were executed between 2012 and 2015 but was only included in the Baseline database after its finished date in 2015. Therefore, the effects on the river flow during the construction phase are not visible in simulations but may have affected flood levels in reality.
Other, mainly autonomous changes that occurred in the river system are updated periodically, with an interval of one or more years, even though the actual changes happen gradually. Between 1995 and 2009, bed level changes were not updated. Bed levels before 2009 were based on a single-beam data set. From 2009 onwards, bed levels were annually updated based on multi-beam measurements. The vegetation maps were updated periodically, in 2005, 2008 and 2012. Due to the rate of update, some changes that are either seasonal or dependent on the timing of maintenance in reality are represented as a sudden change in vegetation. For example, during the growth season, meadows (low grass) may develop herbaceous vegetation, which offers significantly more resistance to flow, in a time span of weeks. This is expected to lead to a discrepancy between the observations and the model simulations.

2.3. Hydraulic Data

At six points along the River Waal, water levels relative to the Amsterdam Ordnance Datum (NAP) have been continuously measured on a daily basis since 1901. Measurements are currently taken using automatic float-driven shaft encoders [19]. The measurement stations are located near the cities of Vuren, Zaltbommel, Tiel, Dodewaard and Nijmegen with an additional one at the Pannerden bifurcation (see Figure 1).
Discharges are infrequently derived from measured flow velocities, first using mechanical hydrometric current meters (Specifically, a helical Ott device; ‘Ott mill’) and later (starting from 2002) hydroacoustically (ADCP). These observations were made available by Rijkswaterstaat, covering a period from 1988 to 2018. The data set includes 1257 observations, with an average of 42 observations per year. The maximum number of observations was recorded in 2008 (87 observations), while some years have less than 10 observations (1992 (8), 1994 (9) and 1997 (5)). Over the entire data set, most observations (51%) were carried out in the first four months (January through April). An overview of the available measurements is given in Table A2 (Appendix B).

3. Methods

3.1. General Outline

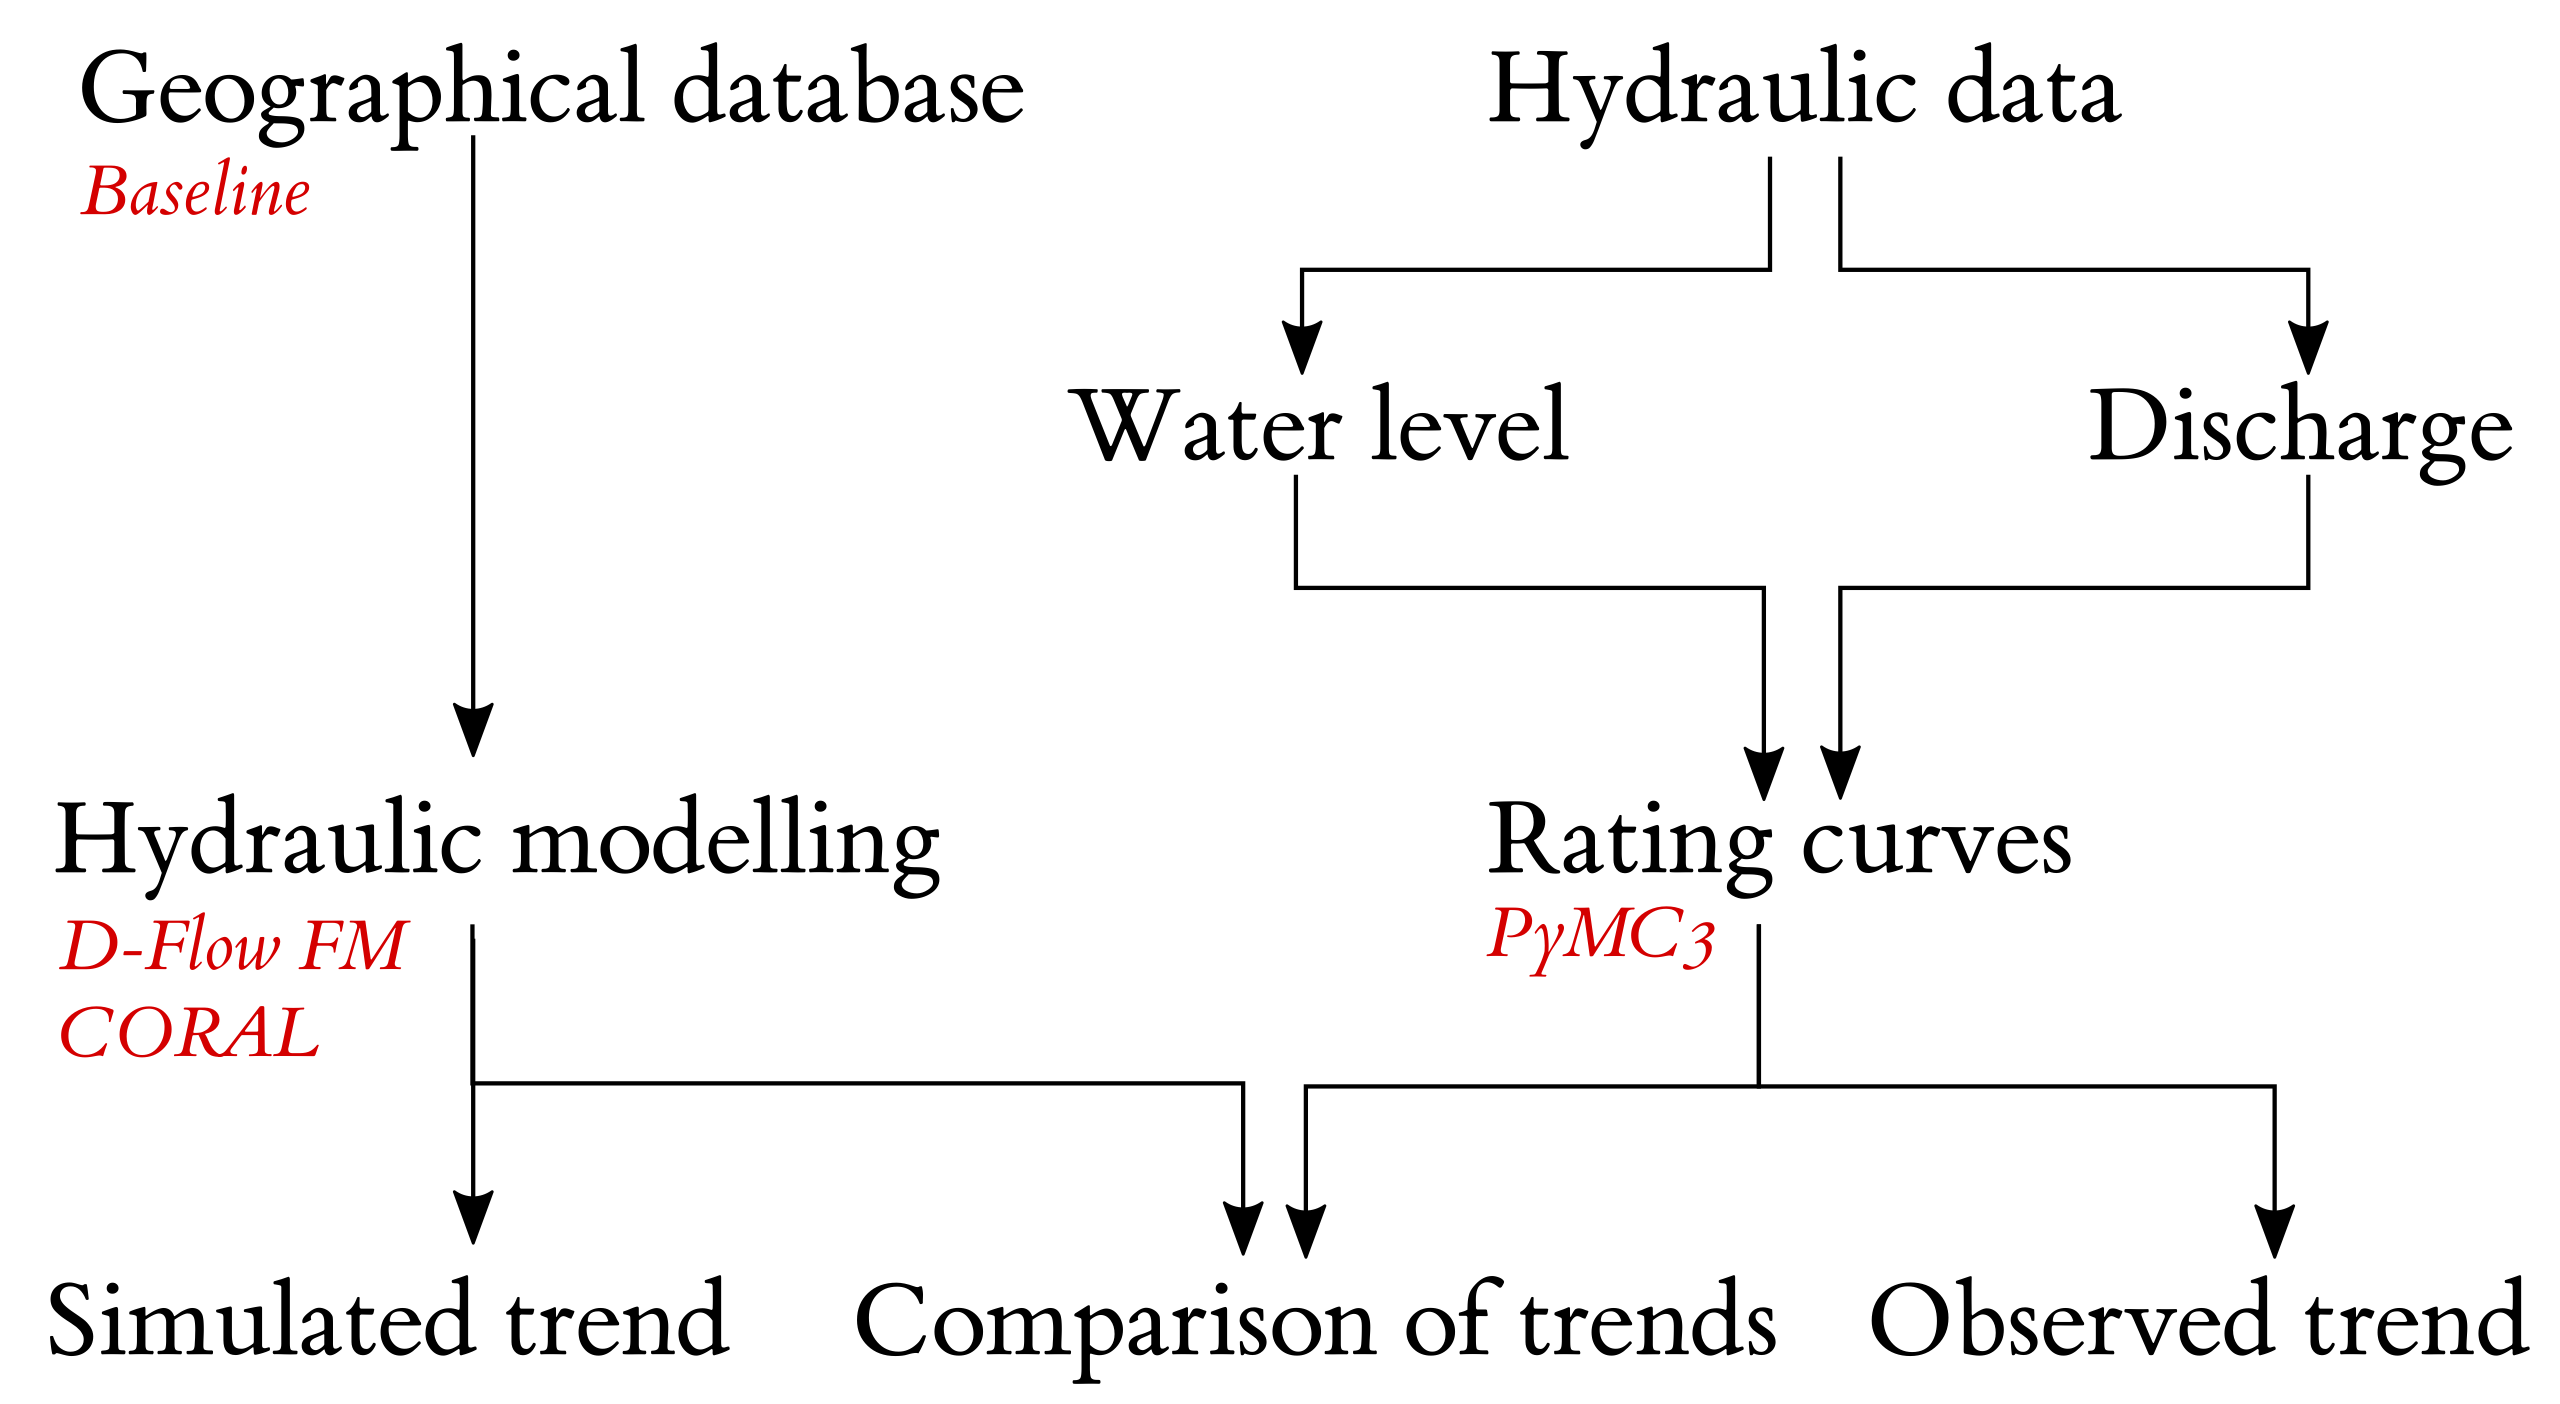
The general outline of this paper is shown in Figure 2.
In the practice of the Room for the River designs, the effect of flood mitigation measures in the Waal were projected using hydraulic simulations forced by design conditions. These design conditions were defined as the steady design discharge with a return period of approximately 1250 years, which for the Waal is 10,165 m 3 s 1 [20]. It should be noted that the choice for a steady discharge and not a discharge wave (which would introduce significant uncertainty with regard to its shape) is conservative, as any discharge wave would experience attenuation through dissipation, which both lowers the peak discharge as well as the peak water levels.
Here, we followed the approach taken in practice to calculate the trend in design flood water levels over 20 years, with two notable exceptions. First, we did not calibrate our models. The most important reason for this decision is to maintain independence between observations and model simulations. If the model was calibrated on the same observations used to corroborate model results, it would be obvious to any reader that the presented argument has very little merit. However, we also decided not to calibrate them because we look at the general trends, not precision, in the model simulation. To illustrate this point, we fully expected that a dike relocation, which increases the flow capacity of a river, would result in a prediction of decreased water levels (ceteris paribus) whether the model was calibrated or not. Compounding this issue, the ability of calibrated hydraulic models to remain accurate after significant change to the system has not yet been demonstrated.
The second deviation from the approach taken in practice is that we propagated parameter uncertainty in hydraulic roughness through the model. Berends et al. [4] showed that parameter uncertainty can result in significant uncertainty in the predicted effect depending on the type of intervention, but this does not change the sign of the effect: flood mitigation measures mitigate, although the precise amount of mitigation is sensitive to parameter uncertainty. However, since this study involves the superposition of multiple human interventions that lower flood levels as well as non-anthropogenic changes that are expected to increase flood levels (e.g., vegetation growth and sedimentation), the net effect is expected to be sensitive to parameter uncertainty.
The simulated trend is compared to rating curves (discharge–water level relationship), which are estimated for each year separately. These rating curves are referred to as the “observed trend”, as they are derived from observations.

3.2. Hydraulic Modelling

The River Waal was modelled using the Delft3D Flexible Mesh Suite (D-Flow FM) modelling software [21]. The numerical grid was curvilinear, with a grid size of approximately 20 m by 40 m in the main channel and 40 m by 50 m in the floodplains. The upstream boundary lies at the Pannerden bifurcation, and the downstream boundary lies at the Merwede bifurcation (see Figure 1).
The geographical model input (bed levels, sub-grid elements and roughness classification) was derived from the Baseline database. First, the geographical Baseline database was updated to the most recent (v. 6.1) protocol, which includes support for the D-FM modelling software. We then created a database for each year from 1995 up to and including 2015, with the exception of years in which no changes are recorded (1996, 2004 and 2006). For each of those years, the geographical input data for the hydraulic model were generated. All operations were performed with the Baseline software, and a total of 18 hydraulic models were created. Each of these hydraulic model represents a snapshot of the state of the river for a given year.
All models were forced by a constant discharge of 10,165 m 3 s 1 and a downstream water level computed from a stationary stage–discharge relationship at the Hardinxveld downstream boundary condition (Figure 1).
For the selection of parameters considered uncertain, we followed Warmink et al. [16,22], who concluded that hydraulic roughness and discharge are the most sensitive parameters. However, since discharge is not a variable in our analysis, we limited ourselves to hydraulic roughness, which is governed by 38 parameters related to the various land classes such as vegetation species and channel types. Uncertainty in hydraulic roughness is accounted for by varying the vegetation parameters and the roughness of channels and other water bodies, using the distributions by Berends et al. [4] (see Table A1 in Appendix A). The water level for the reference situation (1995) was quantified using a quasi-random Monte Carlo simulation with 500 samples. The uncertainty of the output water levels for all years except 1995 were quantified using coral [23,24]. coral is a Monte Carlo-based uncertainty quantification method that reduces the number of required simulations by mapping the joint probability distribution of the reference model to the distribution of the changed models (i.e., all models after 1995) using a correlation model. Here, we used a linear correlation model and 20 samples for each year.

3.3. Rating Curve Construction

In the River Waal, similar to most rivers, water levels are continuously measured but discharges are not. To extend the observational record, hydrologists use rating curves to estimate discharge from water level measurements. Rating curves are empirical models that express the water level in terms of discharge, usually based on the basic equation for steady, uniform flow in a wide rectangular channel using the Manning–Strickler formulation:
Q = A n 1 S b 1 / 2 ( z z b ) 5 / 3
with water level z (m+NAP; NAP stands for the Amsterdam Ordnance Datum or mean sea level), bed level z b (m+NAP), discharge Q (m 3 s 1 ), cross-sectional area A (m 2 ), roughness coefficient n (sm 1 / 3 ) and bed slope S b (m/m). In practice, Equation (1) is simplified as follows:
Q = a ( z b ) p
where parameters ( a , b , p ) are determined on the available data. However, this model is based on a rectangular geometry. Actual rivers have more complex geometry, featuring pool-riffle sequences, groyne fields and floodplains. This can be accounted for by extending the simple model using a divided-channel approach. Here, the discharge is computed from a summation following the division of the channel cross section in the subsections. Each subsection represents a certain flow regime, e.g., main channel flow and floodplain flow. The general form is given as follows:
Q = i = 1 N a i ( h b i ) + p i
where N is the number of divisions and the positive part operator + . For the River Waal, we used three divisions, roughly corresponding to the main channel, groyne fields and floodplains.
Mansanarez et al. [25] showed that changes in the rating curve due to system changes can be modelled through changes in the model parameters a i , b i and p i . Following other authors [25,26,27], we estimated the model parameters using a Bayesian inference formalised in Bayes’ theorem:
p ( Θ | O ) = p ( O | Θ ) p ( θ ) C 1
where the posterior distribution p ( Θ | O ) of the parameter Θ given observations O is computed as the product of the prior distribution p ( Θ ) , the likelihood of the observations given the parameters p ( O | Θ ) and a scaling term C to ensure unity. The likelihood term is determined by the adopted Gaussian error model. We assumed a Gaussian error model that is proportional to the discharge:
Q ( z | θ ) N ( f ( z | θ ) , ς f ( z | θ ) )
In this model, the parameters Θ in (4) consists of the model parameters θ = [ a 0 a n , b 0 b n , p 0 p n ] and the variance factor ς . Here, f ( z | θ ) is the deterministic rating curve model (3), which returns the discharge for water level z given the vector of parameters θ . This means that, for a total of three stages, we had ten parameters.
Within the Bayesian framework, all parameters ( θ , ς ) are stochastic variables. This means that they are described by probability distributions instead of scalar values. Prior to inference, the initial distributions should be chosen such that they cover the region where we expected the model to be accurate. After looking at the data, we had a better idea of what parameter value results in an accurate model.
For most situations, solving for the posterior is nontrivial and is accomplished using numerical methods. Here, we use a Markov Chain Monte Carlo (MCMC) algorithm to sample from the posterior, using the hamiltonian No-U-Turn sampler (NUTS) [28]. For the prior distributions, we chose the following (see Table 1 for an overview):
  • For a, a moderately informative prior with a normal distribution was centred on the values obtained from deterministic optimisation.
  • For b, a uniform distribution was chosen such that the values of b cannot overlap. This is necessary as the terms of (3) otherwise become interchangeable and therefore not identifiable by the algorithm.
  • For p, an informative prior was centered on 1.7, following from rounding up from the expected value for p based on the Manning equation ( 1.666 ).
  • For ς , a non-informative half-Cauchy following [29].
Table 1. Prior distributions. The notation N ( μ , σ ) stands for the normal distribution with mean μ and standard deviation σ . U ( x l , x u ) stands for the uniform distribution with lower bound x l and upper bound x u , and the HalfCauchy ( γ ) is the truncated Cauchy distribution with scale parameter γ .
ParameterPriorParameterPriorParameterPrior
a 0 N ( 100 , 20 ) b 0 U ( 2 , 6 ) p i N ( 1.6 , 0.25 )
a 1 N ( 150 , 20 ) b 1 U ( 6 , 12 ) ς HalfCauchy ( 2 )
a 2 N ( 200 , 20 ) b 2 U ( 12 , 14 )
We inferred the unknown parameters for every year (1988 to 2018) using the same set of parameters. In this way, no information from earlier years was used to determine the rating curve of a new year. The advantage of this approach is that (sudden) changes in the rating curve are easier to identify. However, the disadvantage is that years with little observations or with observations within a limited discharge range cannot benefit from previous measurement campaigns and result in higher model uncertainty.

4. Results

4.1. Simulated Trend

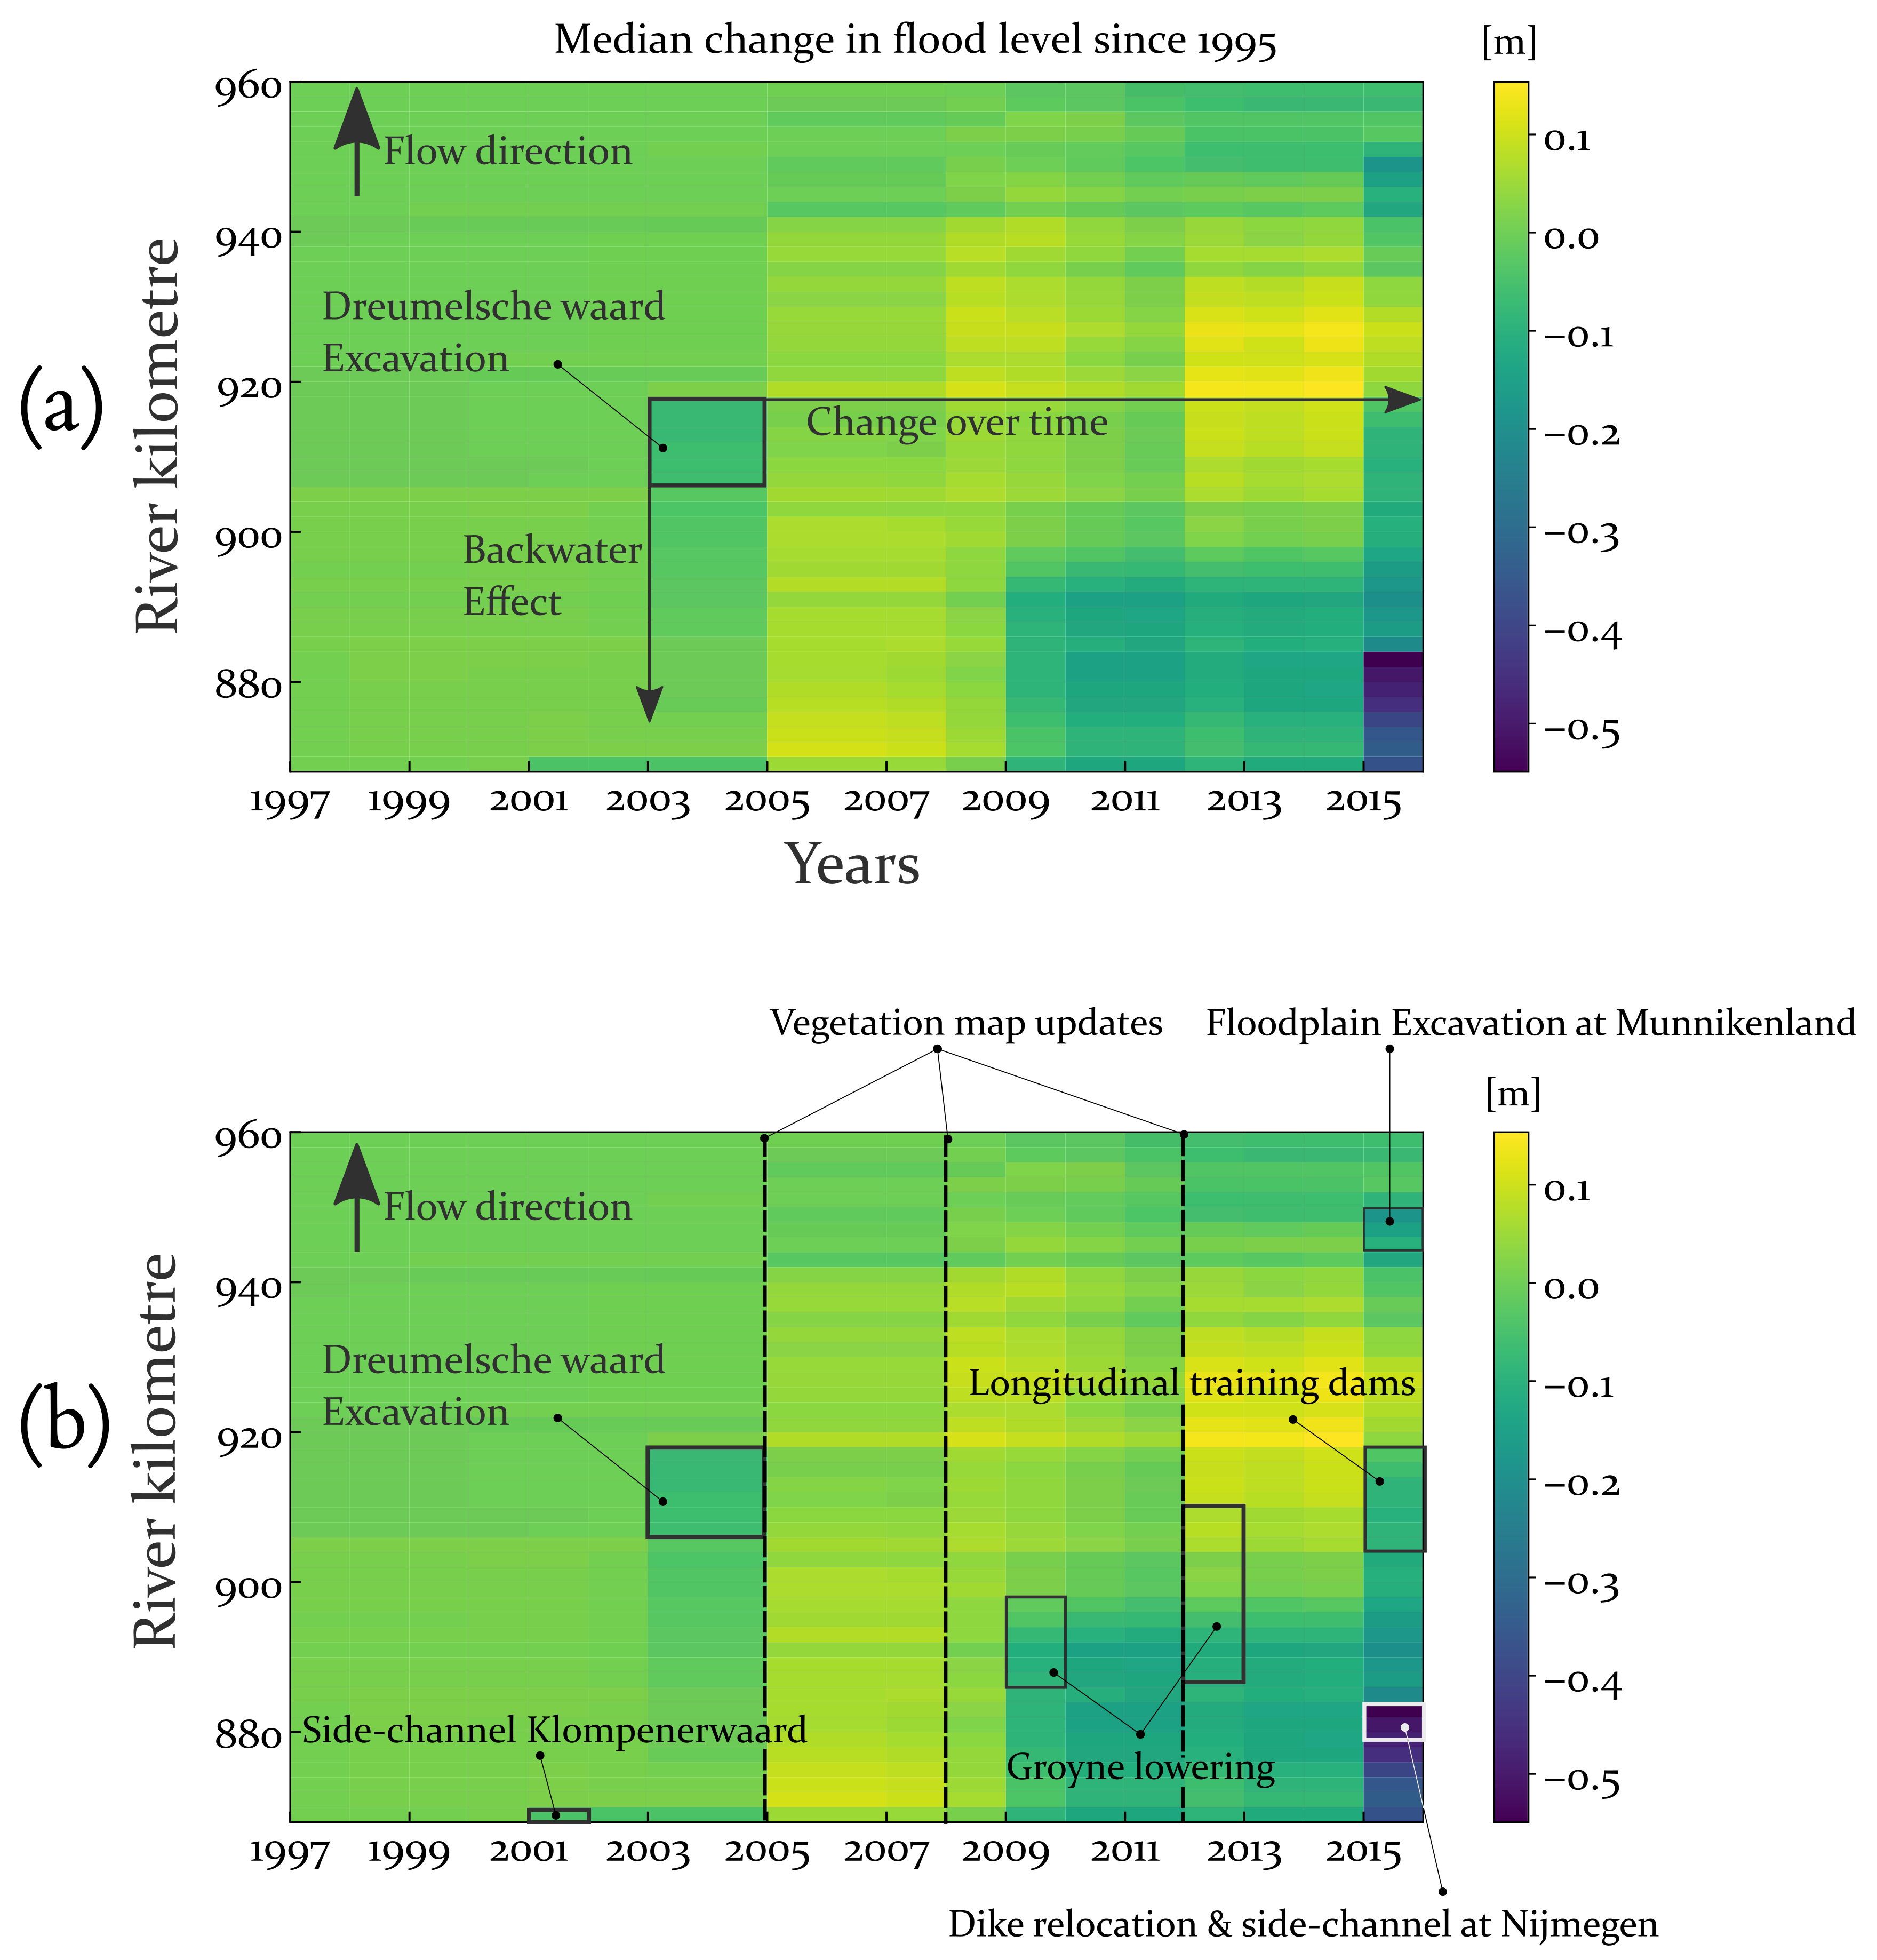
Figure 3 shows the median values of the simulated water levels for each location and year along the River Waal. The uncertainty of water levels is not shown in these figures but are discussed later. Both figures show the same data but are annotated differently.
In Figure 3a, we highlight how a single intervention affects water levels upstream from the intervention through backwater and into the future. In the figure, we observe that the median water level both increases and decreases over time. These changes are attributed to changes in the geographical database because the upstream discharge and downstream water level are constant and equal in all years.
The simulated changes in water levels are thus interpreted as the result of geographical changes. In Figure 3b, we annotate what measures may explain the major changes visible in the simulated water level differences. Notable changes include the update to the vegetation map in 2005 that coincides with a general increase in the median water level compared to 1995. This overall water level increase can only be attributed to the vegetation map update, as the only two other small scale interventions that year were local and expected to decrease water levels. Major interventions that decreased the water levels are mainly implemented in the simulation model of 2015.
Clearly visible interventions include the large-scale dike relocation and construction of an island and side-channel at Nijmegen, which was completed in late 2015 but was under construction for several years prior. The floodplain excavation at Munnikenland was officially opened in June 2016, but since most of it had been completed in 2015, we added the intervention to the 2015 changes. Another large scale intervention was the rehabilitation of the Millingerwaard floodplain, near the upstream boundary. We did not incorporate this intervention in the simulations because this intervention was only completed in May 2017. The Millingerwaard floodplain rehabilitation would likely lead to significant water level decrease starting from km 872 and with a maximum at 868, which is right at the Pannerden bifurcation.
The water level differences between 1995 and 2015 (Figure 4) show that the simulated flood water levels decreased overall, with the notable exception between measurement stations Zaltbommel and Tiel Waal (km 914–km 934). The increase in flood level is attributed to updated vegetation maps (Figure 3). This area of the River Waal contains the St. Andries river bend, at which point the dikes constrain the river, creating a bottleneck [4]. Figure 4 also shows that major changes in the simulated water levels are not reflected at the location of the measurement stations. The stations where changes in flood level are most likely to be observed are ‘Nijmegen haven’ and ‘Pannerdensche Kop’.
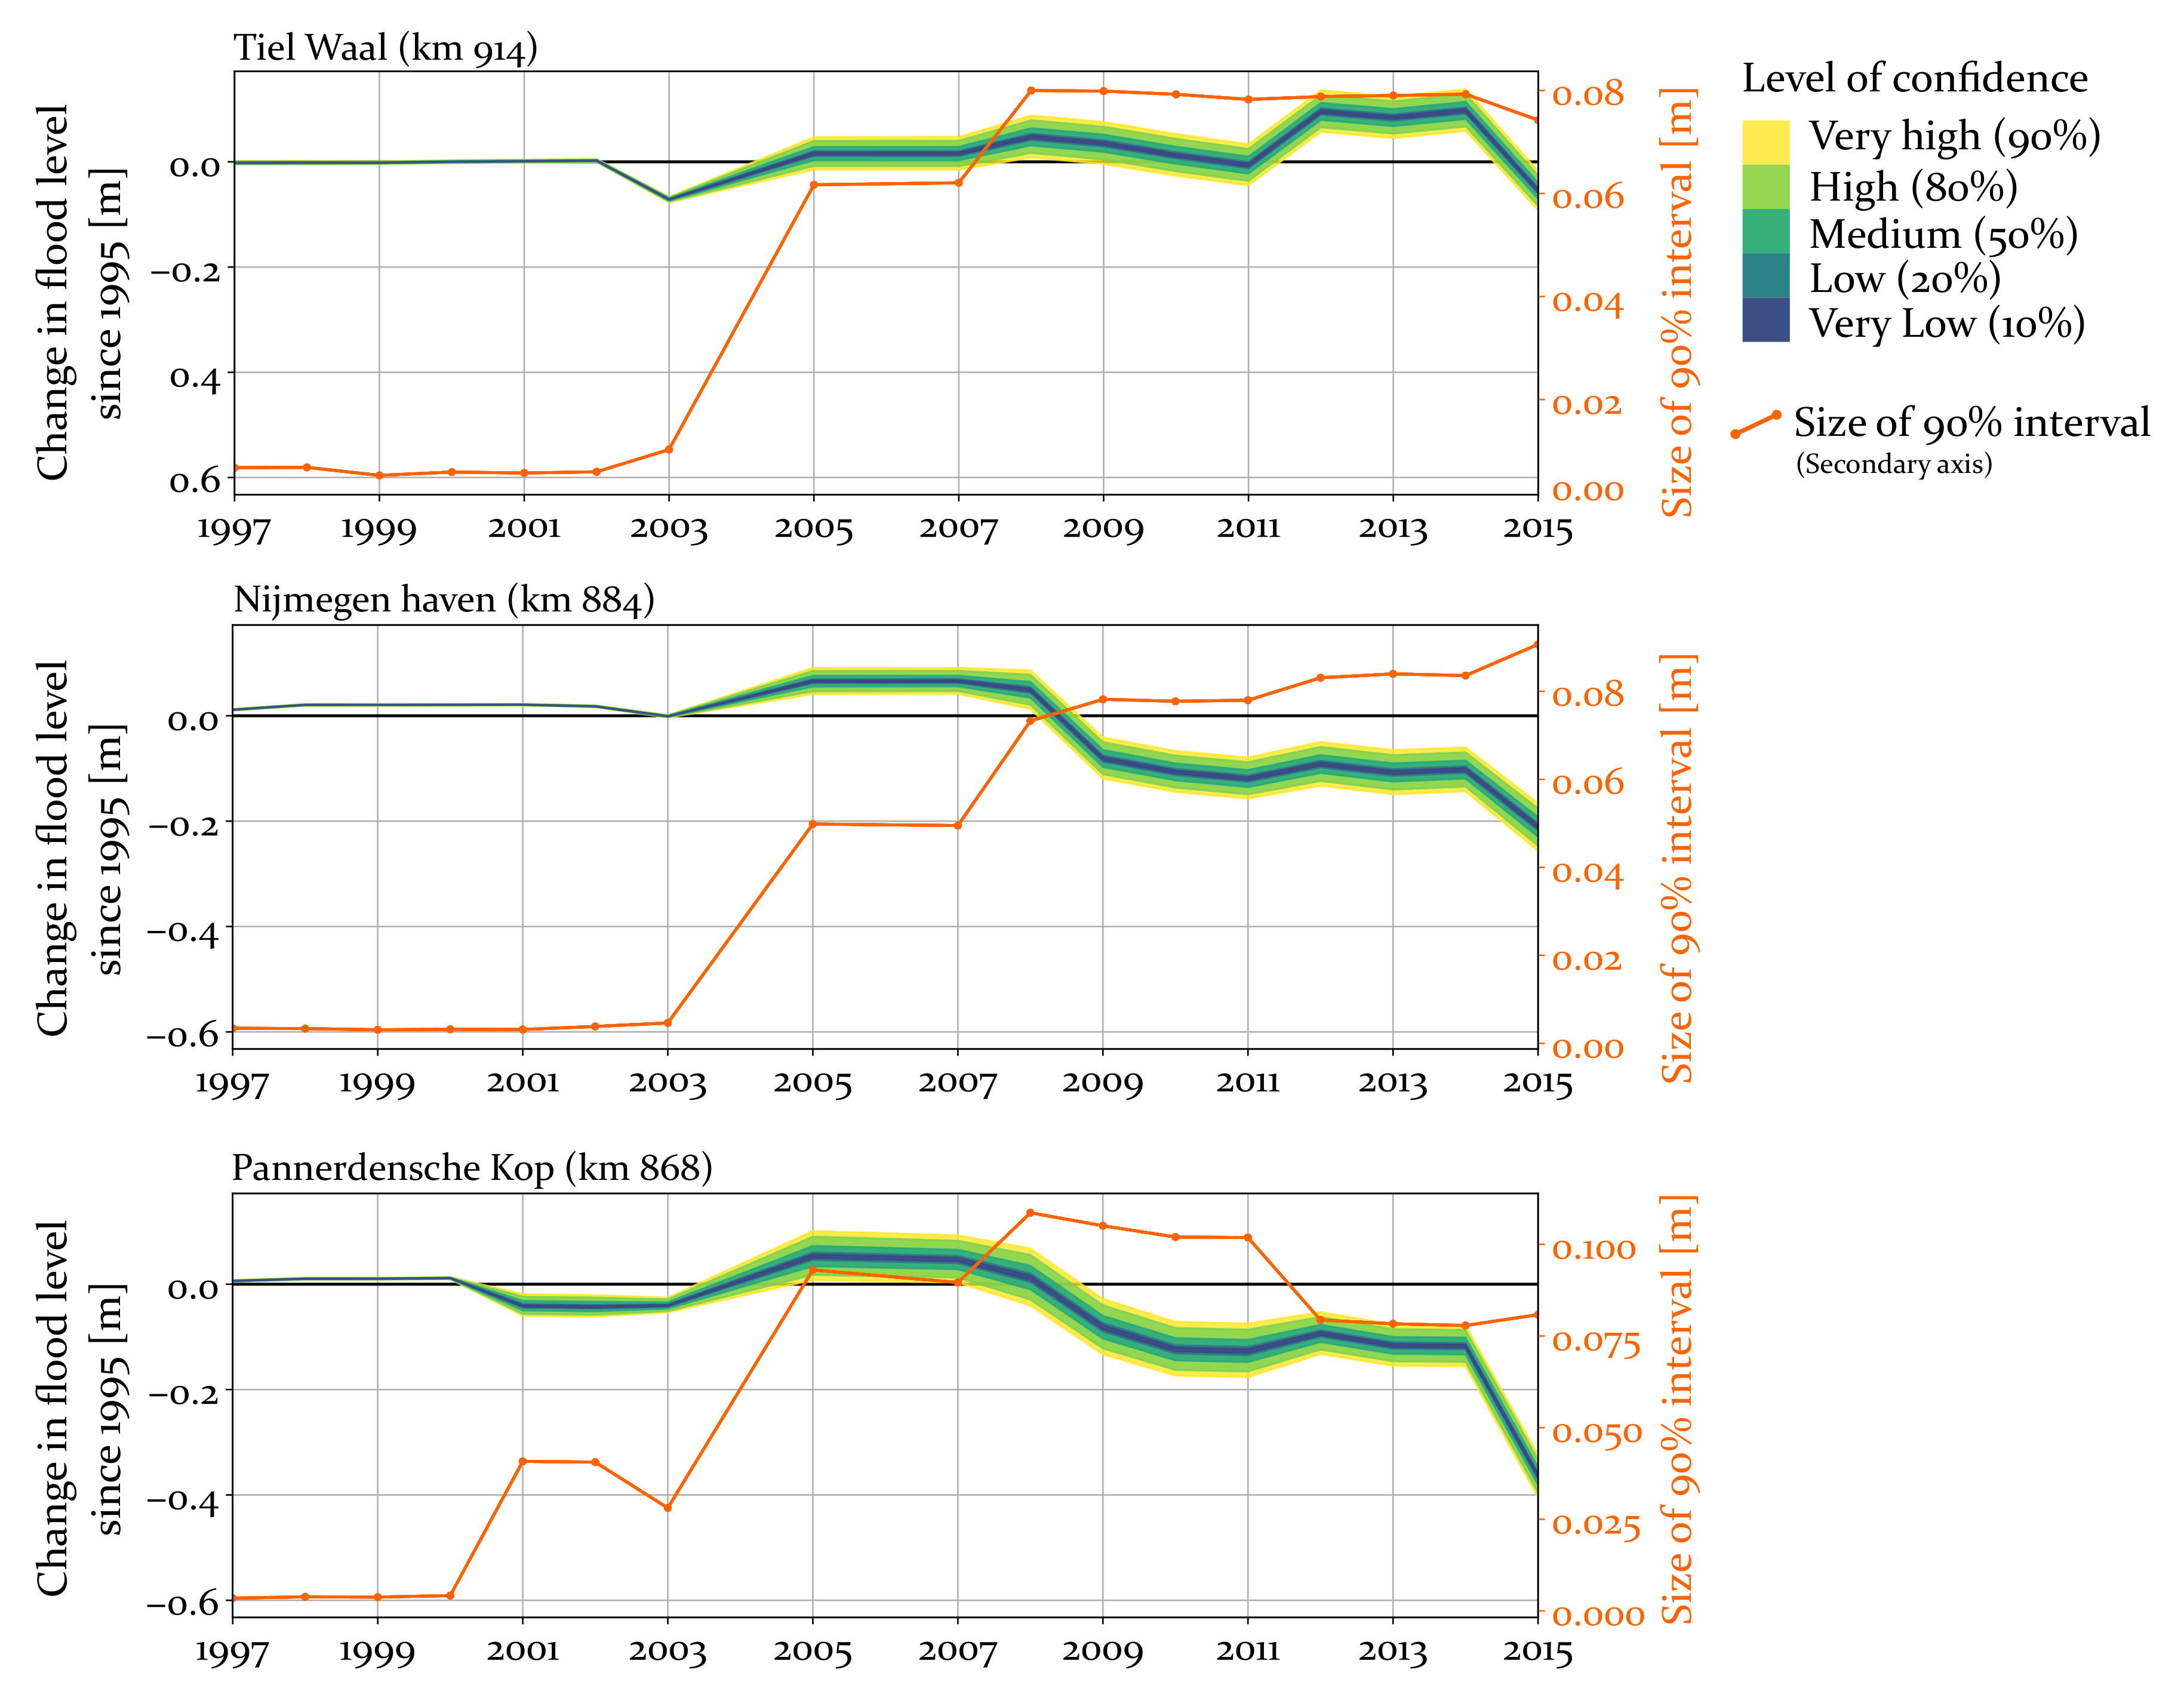
The changes in simulated water levels through time are shown in Figure 5 for the two measurement stations where we expect the largest change as well as for the more downstream Tiel Waal station.
The bandwidth in Figure 4 and Figure 5 shows relatively small uncertainty in the simulated change in water levels. For these three stations, the update to the vegetation map in 2005 not only increased the median water level but also increased the size of the confidence intervals as well. Generally speaking, an increase in model uncertainty in effect studies is caused by increasing deviance in the model response compared to the reference model [23]. Therefore, the uncertainty is small for 2003 because the model changes were small while the increase in 2005 shows a more significant system change. Subsequent updates to the vegetation maps in 2008 and 2012 did not result in further increases in water level but did increase the size of the confidence intervals. This can be regarded as an artefact of the underlying data having infrequently updated vegetation maps rather than an accurate prediction of reality. The size of the confidence intervals increases over time following increasing changes to the system, but the jumps following changes to the vegetation maps in 2005; 2008; and to lesser extent, 2012 indicate that the increase in model uncertainty is, to a large extent, caused by the vegetation maps.

4.2. Rating Curves

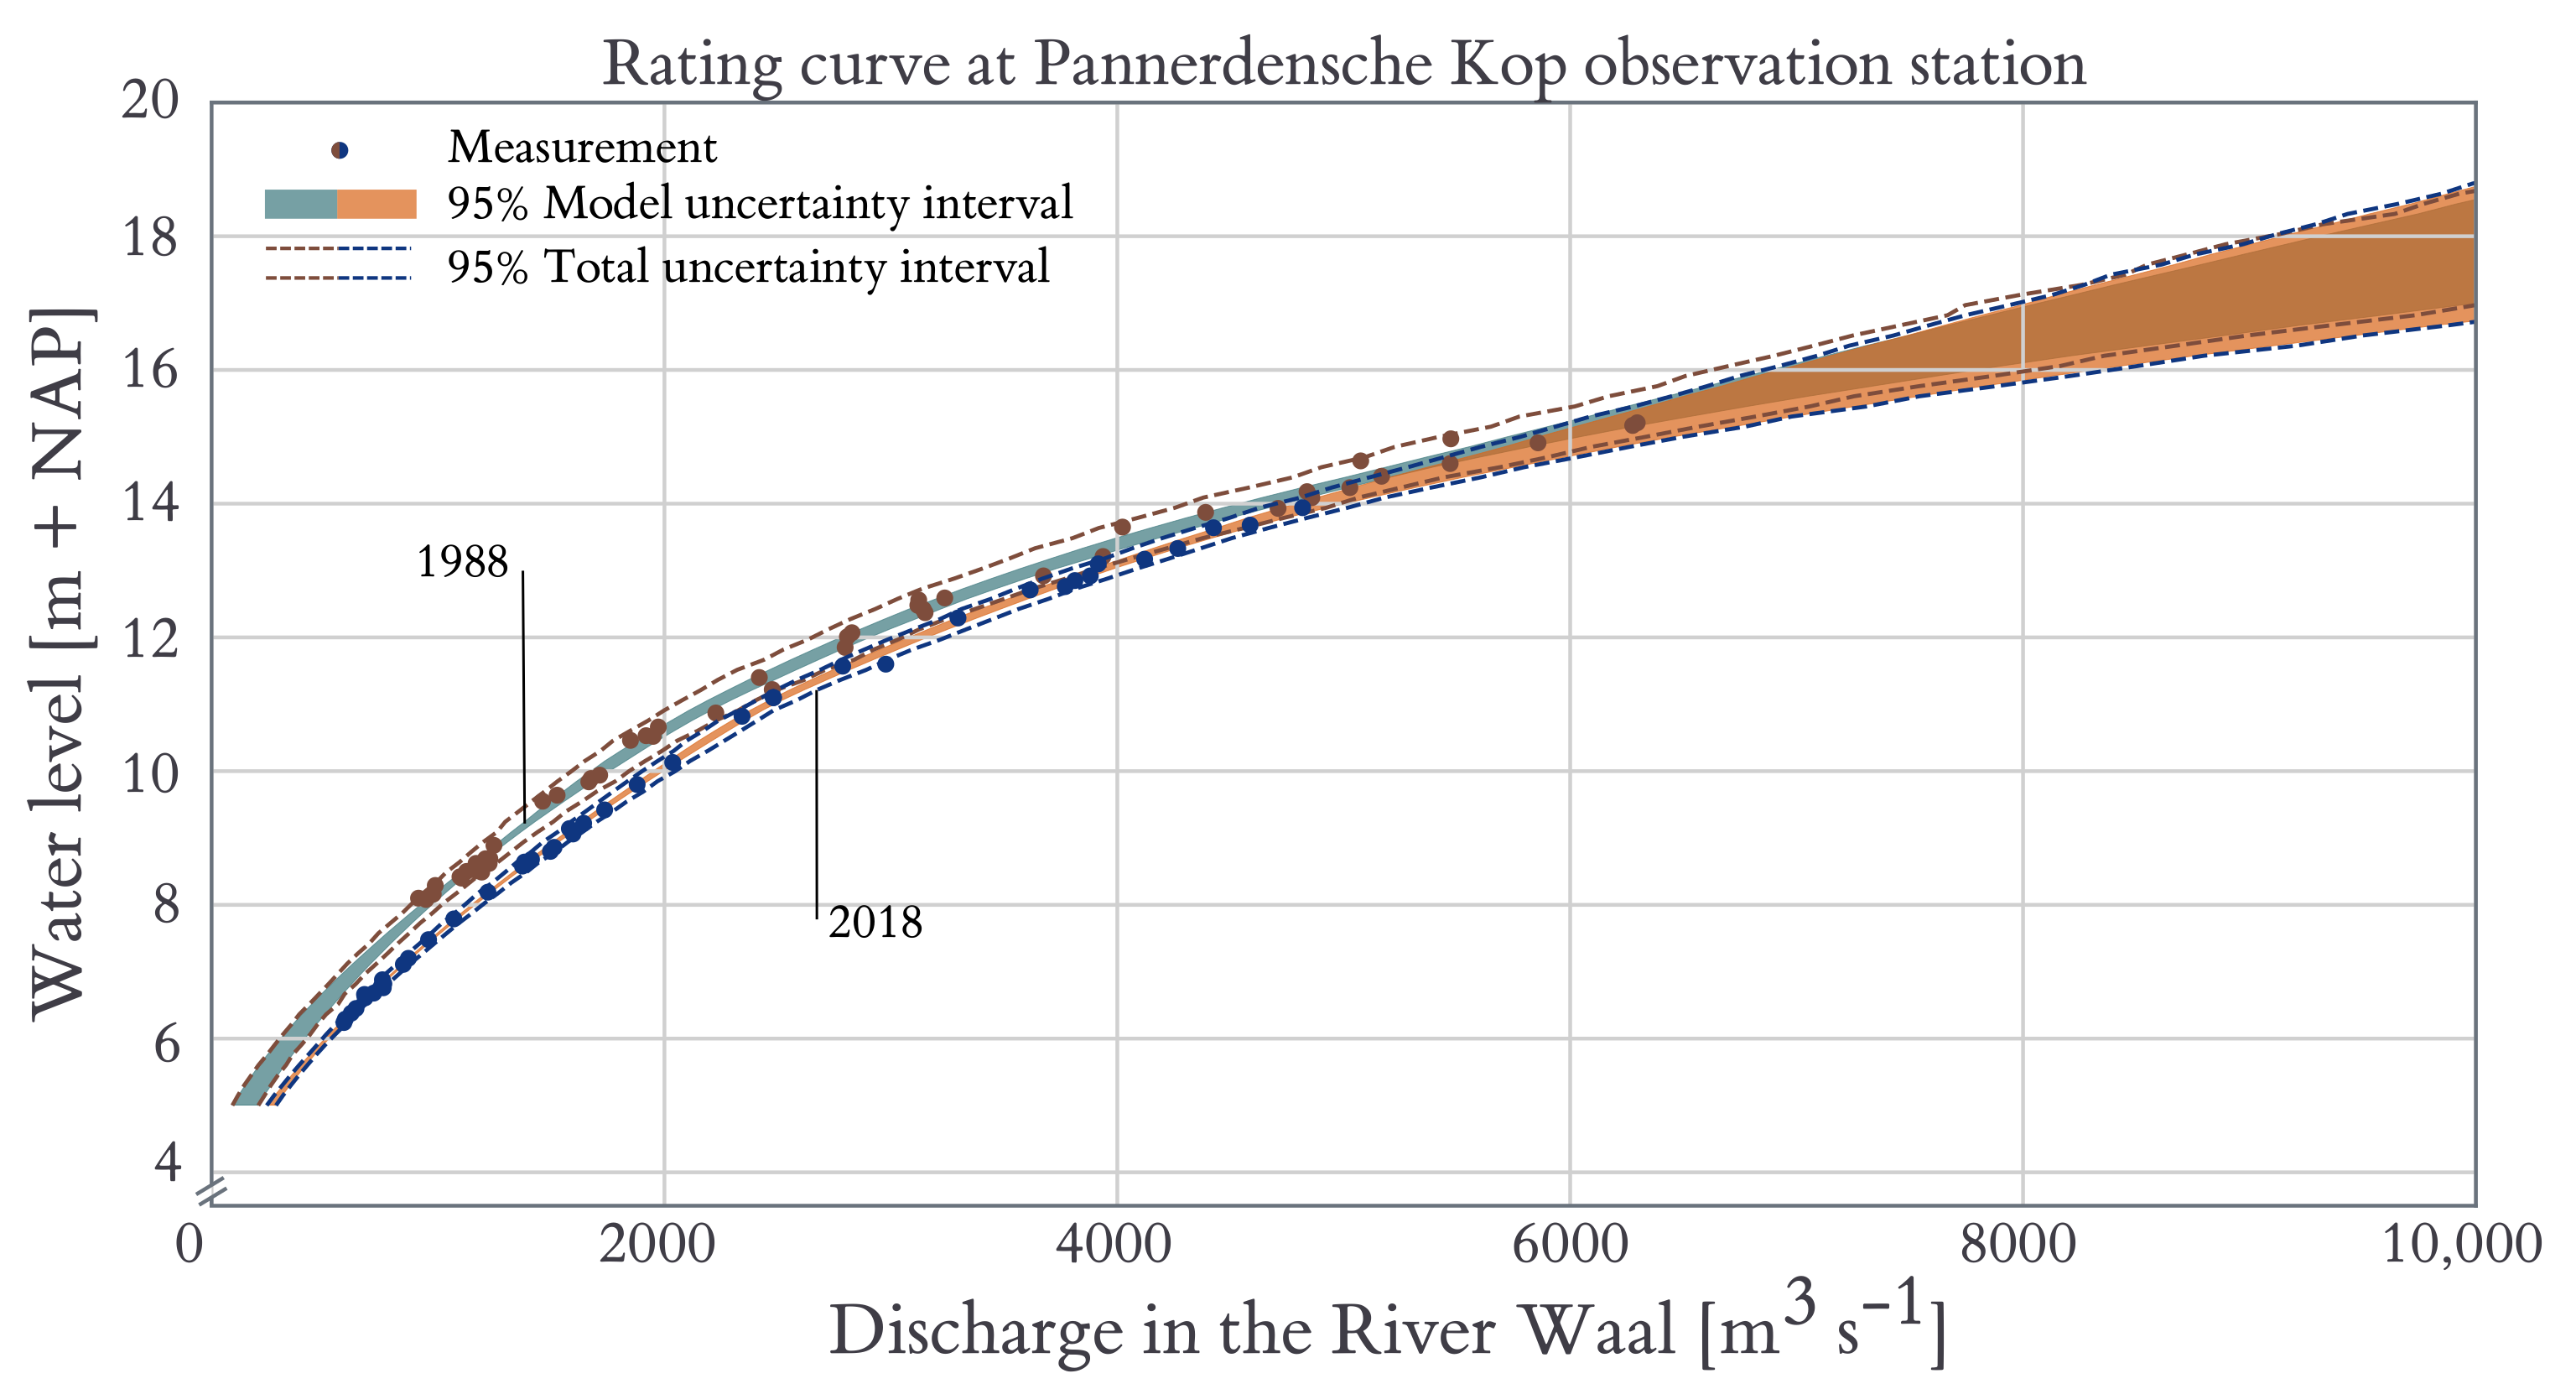
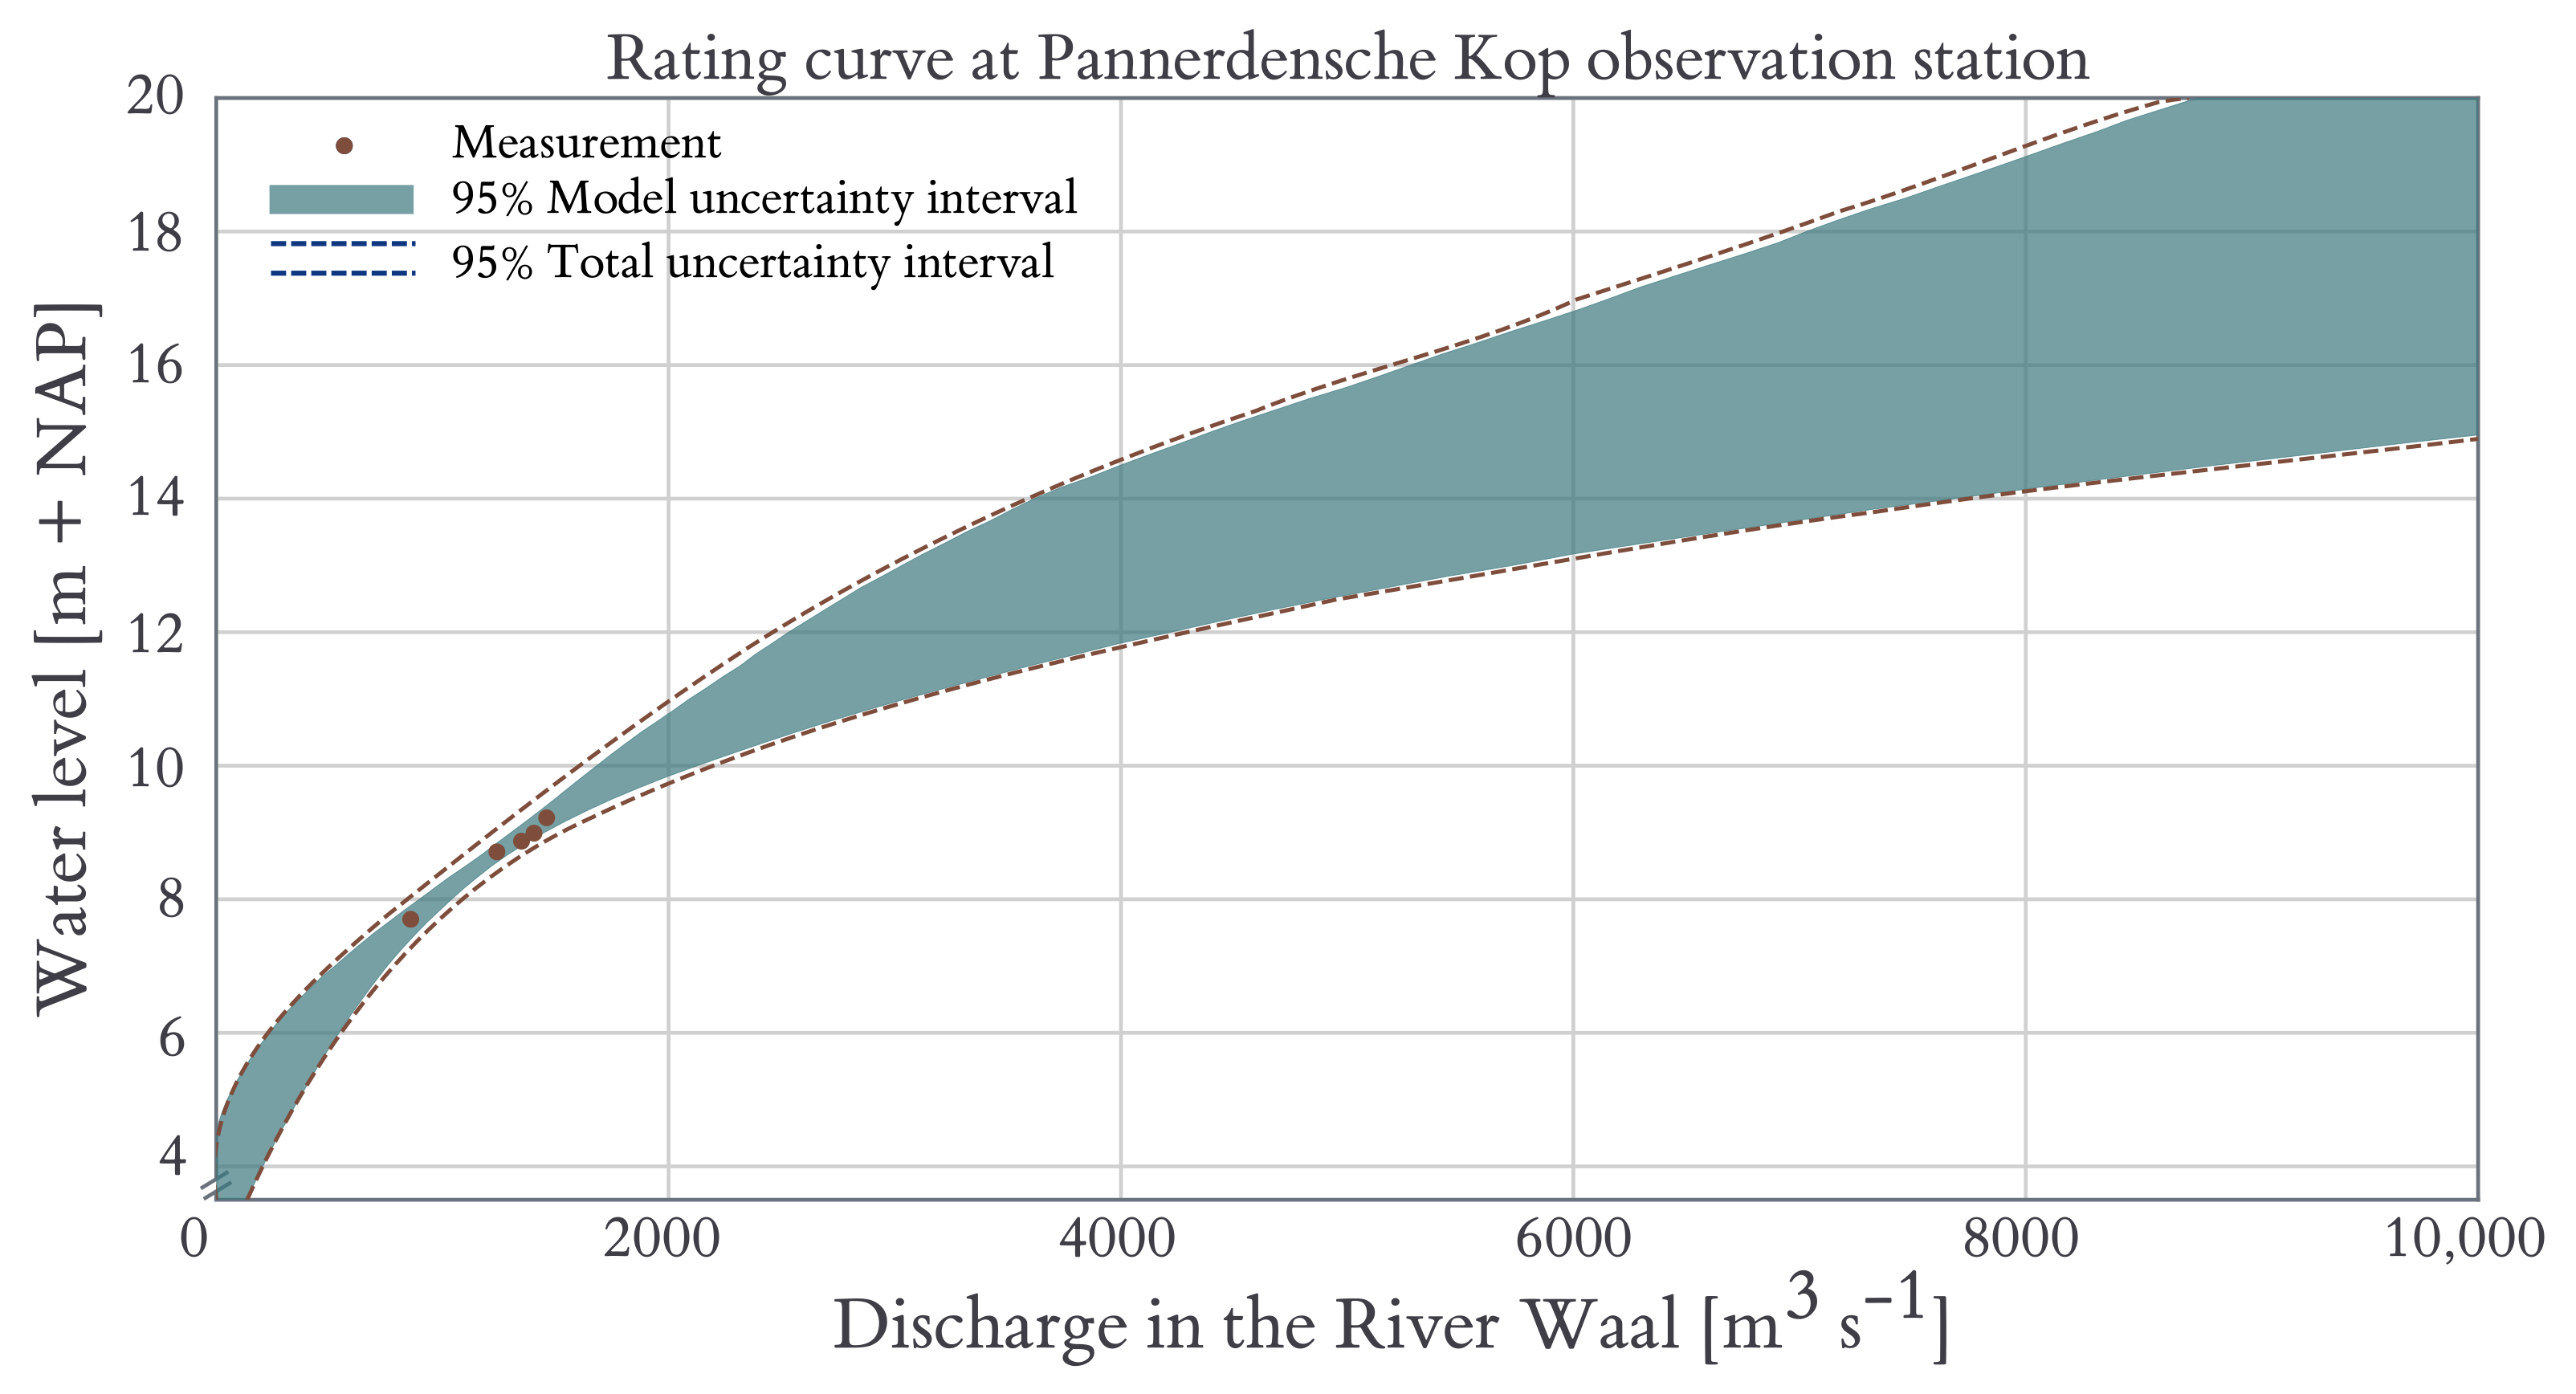
For each year, from the start of the data set in 1988 to the the last observations in 2018, a probabilistic rating curve was obtained through Bayesian inference. The resulting rating curves are depicted in Figure 6 for the first and final years in the data set. Both years have observations spanning a large range of discharges, including measurements from the range of the three flow regimes (main channel flow, submerged groynes and floodplain flow). Two 95% confidence intervals, for model uncertainty and total uncertainty, are shown for each year. The model uncertainty interval envelops 95% of the rating curves derived from the rating curve model (3), given the posterior distribution of θ . Model uncertainty arises from fitting the rating curve model for a limited number of measurements. Therefore, the interval is smallest if measurements are dense but gradually increases for sparse or unobserved ranges.
The total uncertainty interval includes both the model uncertainty and the Gaussian error term in (4). The difference between the model uncertainty and total uncertainty can be interpreted as the predictive uncertainty, which represents the variance in the observations that cannot be explained by the rating curve model. A non-exhaustive list of causes for this variance include seasonal changes, hysteresis effects or measurement error. In well-measured ranges (e.g., from 1000 m 3 s 1 to 2000 m 3 s 1 ), the model uncertainty is small relative to the total uncertainty. However, for extreme discharges (>8000 m 3 s 1 ), the model uncertainty dominates the total uncertainty.
It is clear that the water levels for lower discharges in 2018 have decreased since 1988 because the water levels in 2018 fall well below those for 1988 in Figure 6 for discharges up to 4000 m 3 s 1 . For higher discharges, this trend seems less well pronounced, although overall, the 2018 rating curve is still projected to be below the 1988 rating curve. For extreme discharges (>8000 m 3 s 1 ), Figure 6 does not show a discernable decrease in water levels, which expresses that the model uncertainty related to extrapolation is too large.
It should be noted that both 1988 and 2018 are years with a high number of measurements (50 and 44 respectively) and large range of measured discharges (1988: 914 m 3 s 1 to 6296 m 3 s 1 ; 2018: 584 m 3 s 1 to 4814 m 3 s 1 ). However, such extensive measurements are not available for every year. In Figure 7, we show the results for 1997, which had only five measurements over a limited range (860 m 3 s 1 to 1460 m 3 s 1 ). Here, we see that, while the model uncertainty is small in the limited measured discharge range, the uncertainty bands rapidly grow beyond those ranges. Compared to the relatively well-constrained intervals in Figure 6, here we see much larger intervals at higher discharges.

4.3. Long-Term Trends

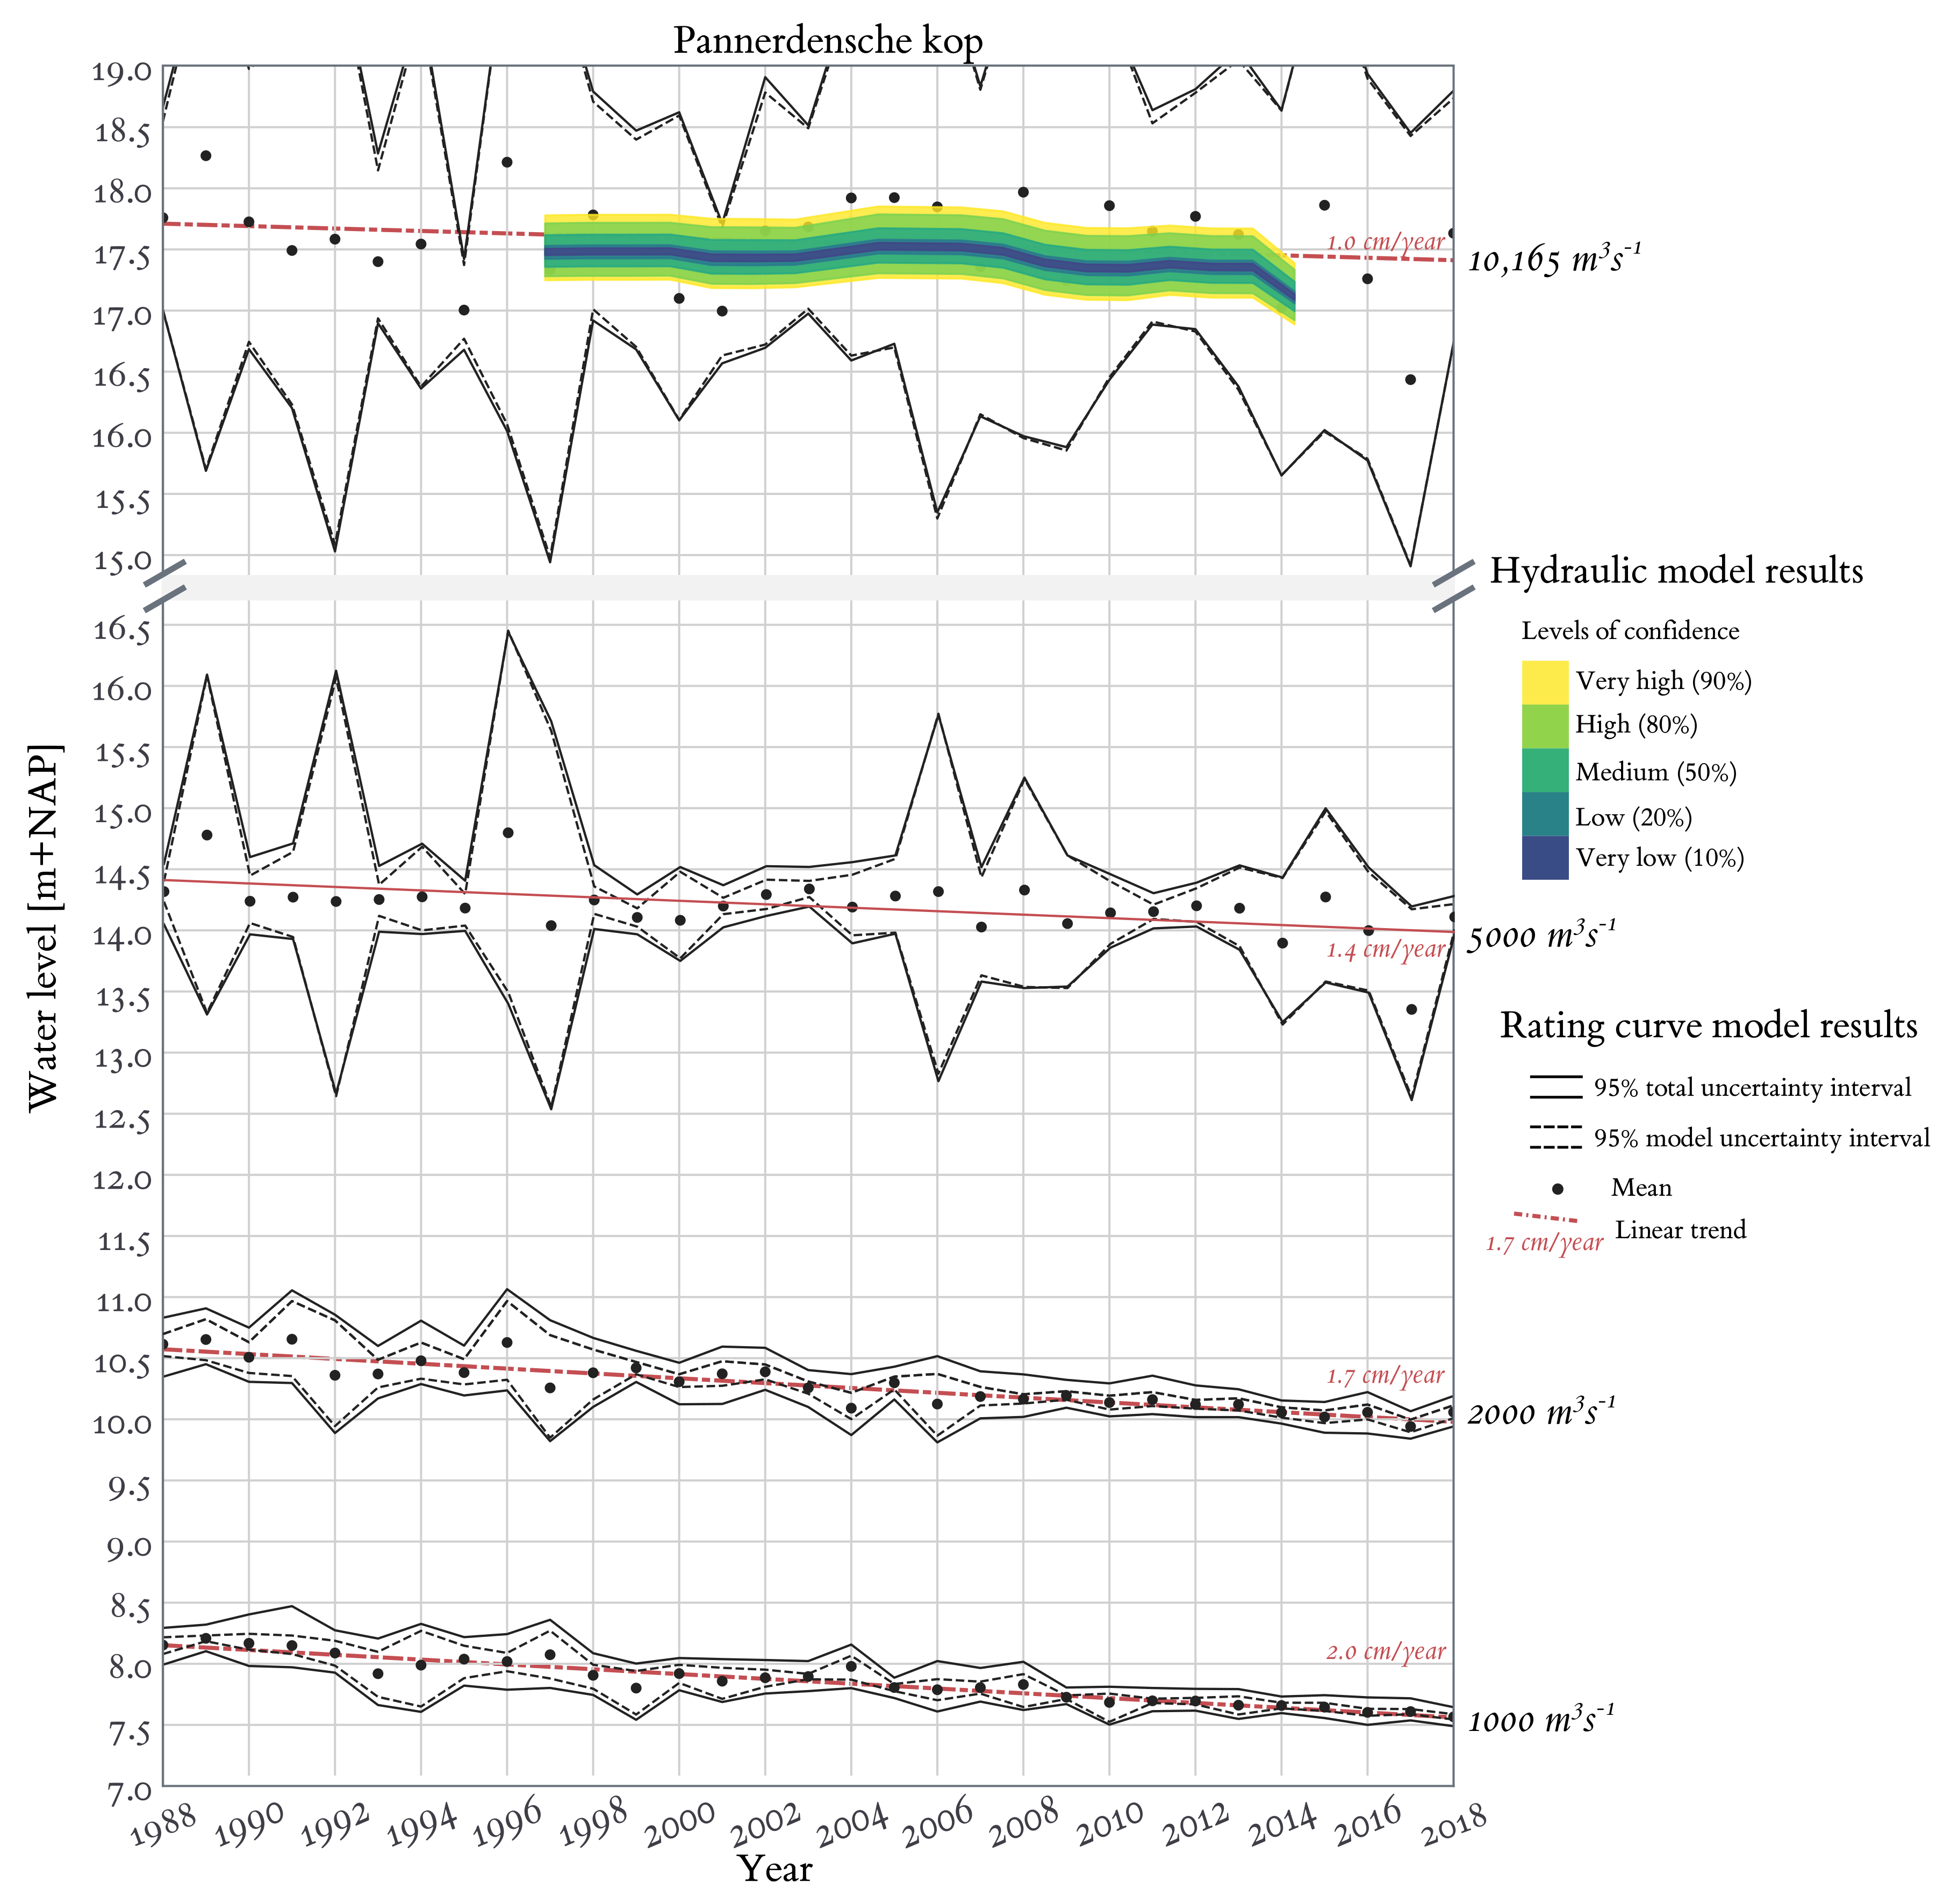
Rating curves, such as those shown in Figure 6 and Figure 7, were generated for all 30 years. We used these models to project the water levels at various discharges at the Pannerdensche Kop measurement station for each year, as shown in Figure 8. Four discharges were selected to monitor trends. At the lowest selected discharge of 1000 m 3 s 1 , the observed water levels are well below the start of the second regime (submerged groyne fields, around 10.5 m+NAP), indicating main channel flow without a strong influence of the groynes. A strong downward linear trend is observed with a rate of 2 cm per year lowering of the water levels. This rate is consistent with ongoing channel bed erosion in many parts of the River Rhine since 1934 [30]. At 2000 m 3 s 1 , the water levels are between 10 m+NAP and 11 m+NAP. At these discharges, the flow is still constrained to the main channel but is now influenced by the groynes, which represent the second flow regime. A linear downward trend is still observed, albeit at a slightly smaller rate of 1.7 cm/year.
The third discharge is 5000 m 3 s 1 , with average water levels between 13.5 m+NAP and 15 m+NAP. At these levels, river flow is high enough to extend to the floodplains yet low enough for there to be recent observations. Nonetheless, at various years (especially 1989, 1992, 1996, 1997, 2006 and 2017), the uncertainty intervals are higher due to extrapolation, a small number of measurements or a combination of both. The results show a decreasing trend of about 1.4 cm/year. Although work on the river carried out in the Room for the River programme are expected to affect water levels in this regime, Figure 8 does not clearly show deviations from the linear trend. An apparent outlier is 2017, which does not markedly deviate from the linear trend at lower discharges but does seem to indicate decreased water levels at 5000 m 3 s 1 . However, the maximum measured discharge in 2017 was 2249 m 3 s 1 , and the projection extrapolates from there. Given the large uncertainty intervals for 2017 and the return to the linear trend in 2018, no deviation from the linear trend can be concluded based on our results.
At the extreme discharge of 10,165 m 3 s 1 , no measurements are available. Therefore, all projections with the rating curve model are based on extrapolation. The 95% confidence intervals are quite large (around 3 m), with the notable exception of 1995 (about 0.7 m) and 2001 (about 1.2 m). Both of these years featured high discharges (1995: 7844 m 3 s 1 ; 2001: 6186 m 3 s 1 ). A linear trend can still be observed, although the rate (1 cm/year) is likely subject to significant uncertainty, given the high variance of the means.
A direct comparison of the trends from the rating curve model and hydraulic model for 10,165 m 3 s 1 does not yield clear evidence of changes in the rating curves that deviate from the linear trend, as would be expected for the Room for the River interventions. This is especially so for the Nijmegen Lent dike relocation in 2015, which seems to have had no discernable effect on the measured water levels at 5000 m 3 s 1 . Figure 8 serves to stress the importance of the 2018 measurements in supporting these findings. The years during construction and completion of the Nijmegen Lent dike relocation project have seen relatively low measured discharges (see Table A2), resulting in uncertainty when extrapolating to the floodplain flow regime. The 2018 data set, including the highest recorded discharge since 2011 (2011: 5451 m 3 s 1 ; 2018: 4818 m 3 s 1 ), is the first measurement after the completion of Room for the River in 2015, with discharges higher than 4000 m 3 s 1 . The results show water levels consistent with the linear trend.

5. Discussion

5.1. Explanations for the Discrepancy between Simulated and Observed Trends

The results of the hydraulic model simulations, accounting for uncertainty in roughness parameters, clearly show a significant effect of the Room for the River interventions. The Nijmegen Lent dike relocation and side channel is projected to locally reduce the water level, with more than 0.5 m and with almost 0.4 m at the Pannerdensche Kop at extreme discharge (Figure 5). However, from the analysis of measurements, we found no clear evidence of a reduction in water levels that can be attributed to Room for the River. Here, we reflect on some explanations for this discrepancy.
First, it is plausible that the effects of Room for the River only become significant at discharges higher than those currently observed. The interventions were designed for discharges with a return period of about once in 1250 years. However, the Nijmegen side channel is already active at much lower discharges. In January 2018, discharges in the River Waal reached almost 5000 m 3 s 1 and caused flooding of the newly constructed side channel (This event was reported by national news outlets, e.g., https://nos.nl/video/2211253-dronebeelden-zo-ziet-hoogwater-bij-nijmegen-eruit.html, accessed on 13 July 2021). Therefore, some effect on the rating curve was expected, although perhaps less pronounced compared to extreme discharges.
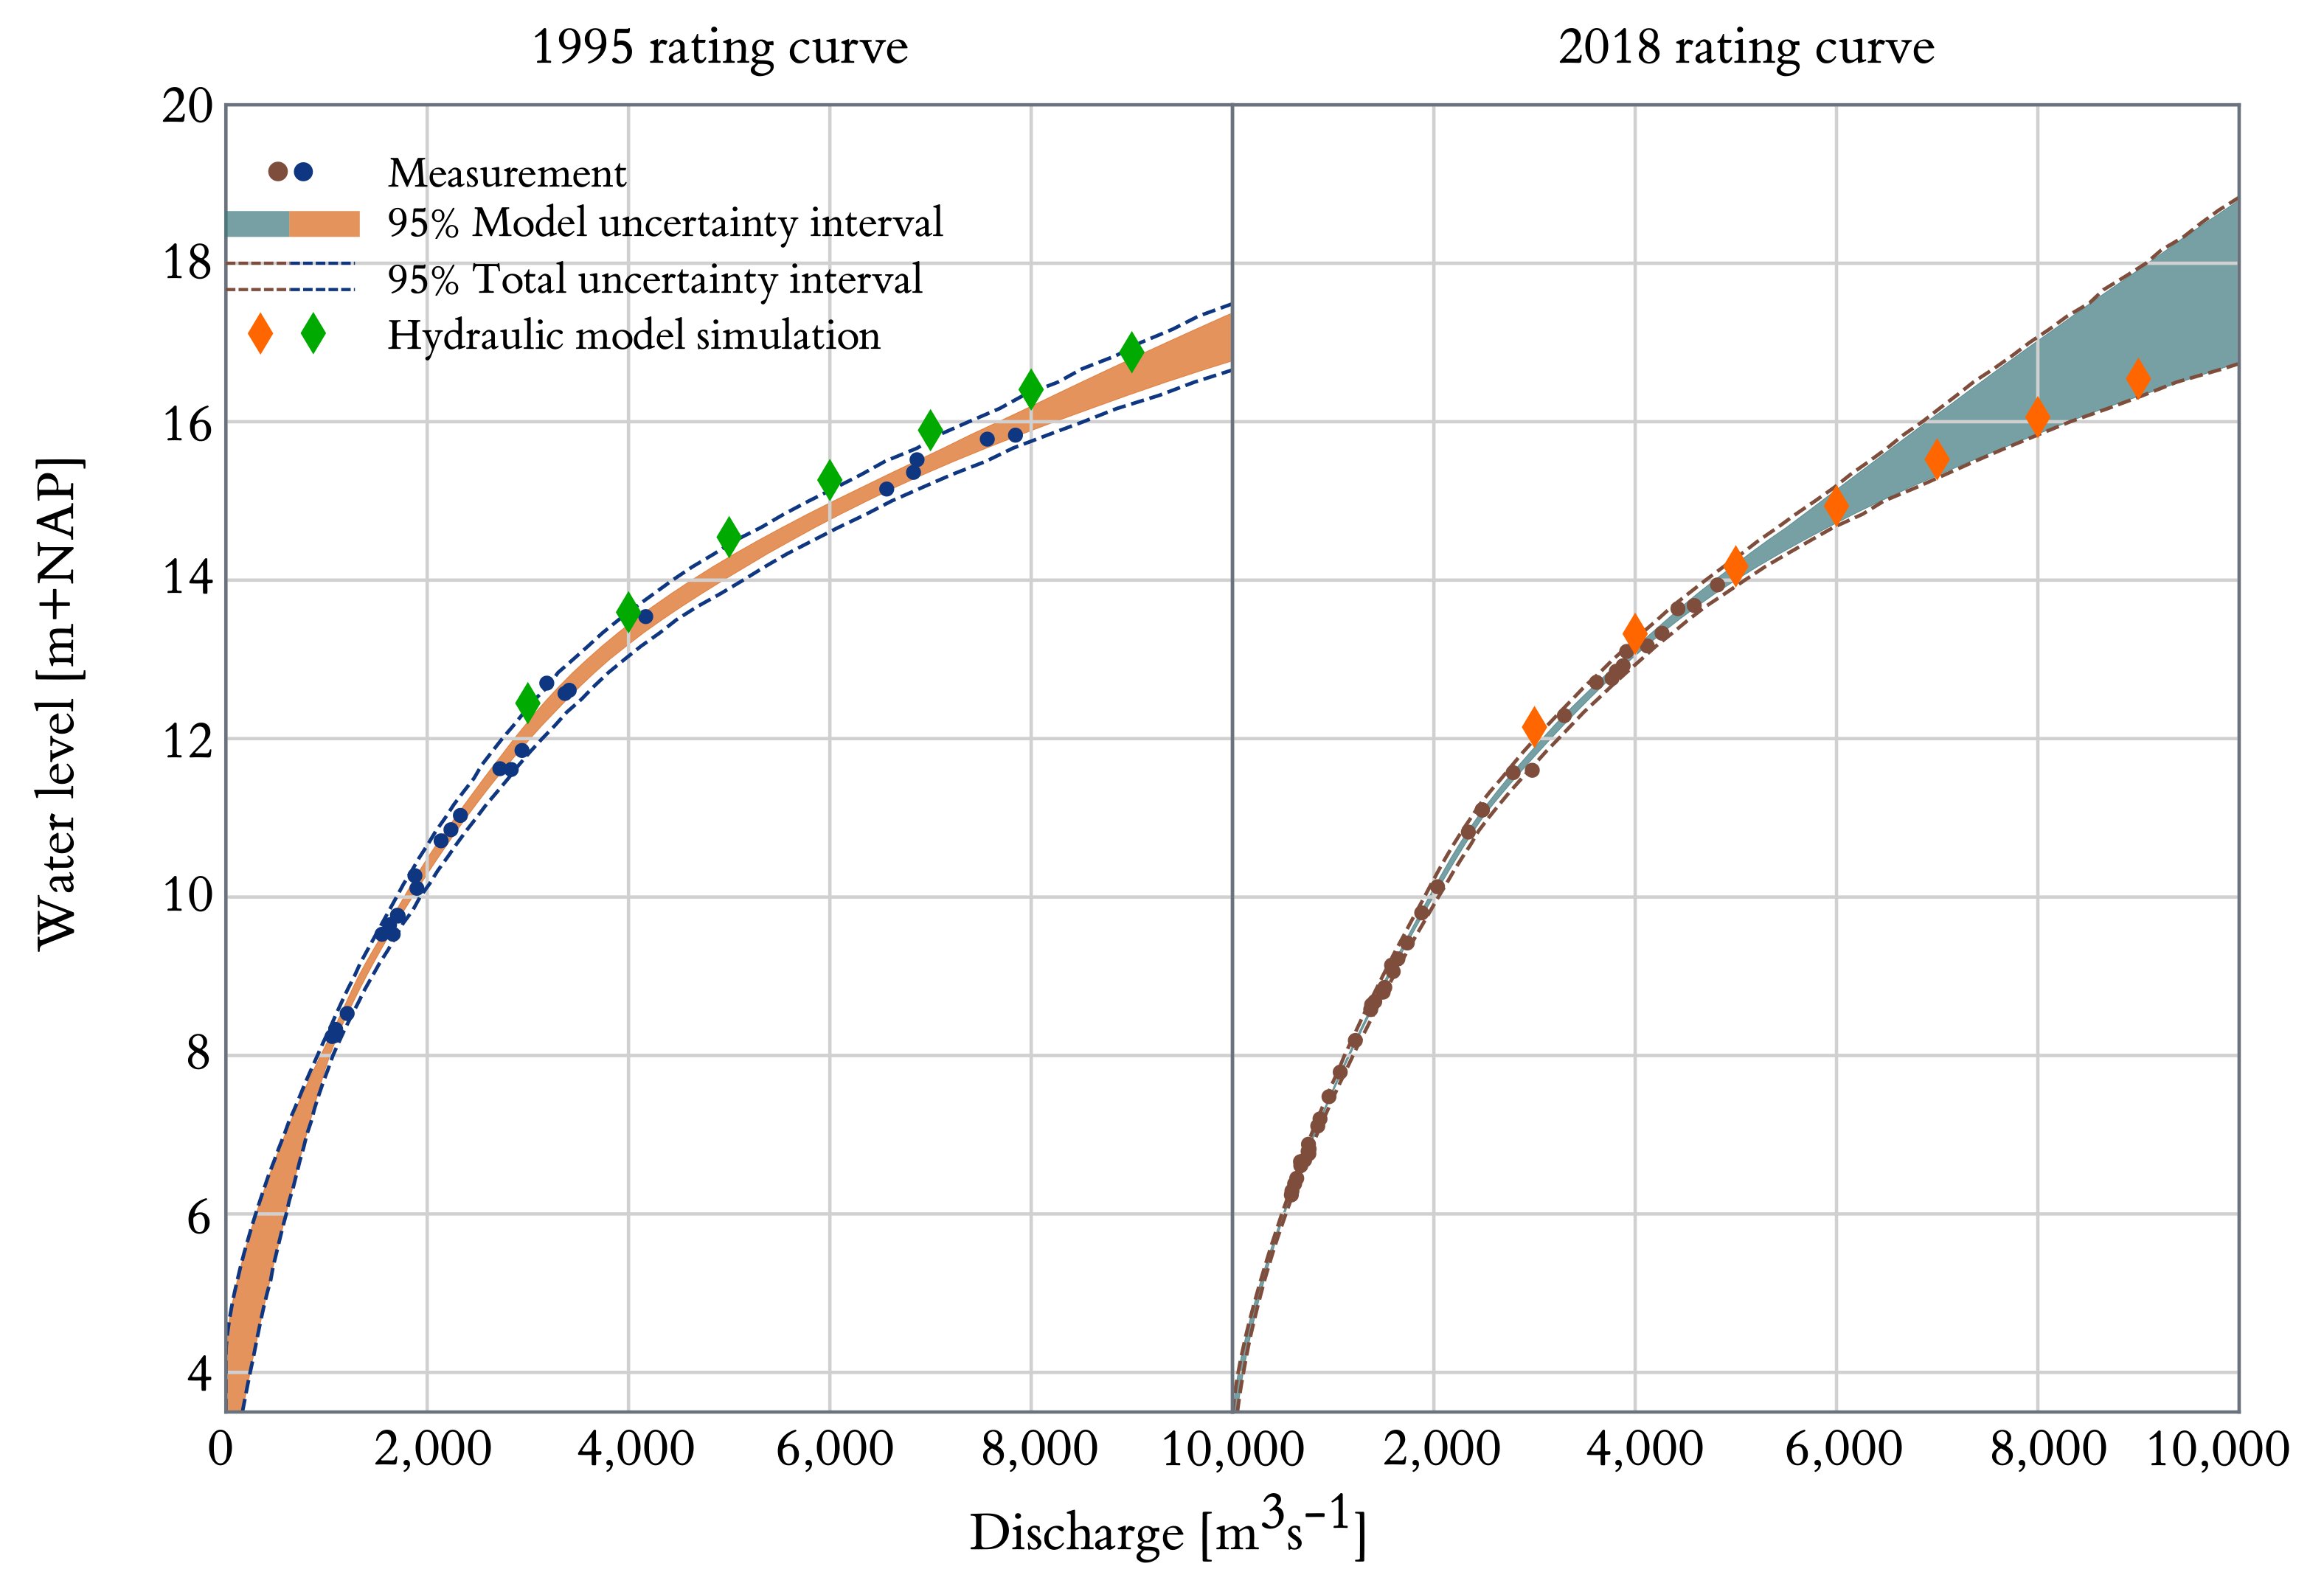
To further explore this, we made a number of exploratory hydraulic model simulations with the 1995 and 2015 models, forced with lower discharges, using the mean values for all stochastic variables and plotted the results over the rating curves for 1995 and 2018 (Figure 9). We note that the distribution of the main channel roughness parameter was determined for extreme discharges and is therefore expected to overestimate the roughness because the geometry and roughness of bed forms scale with discharge. The (uncalibrated) simulation results fall within the uncertainty intervals of the rating curves. However, for 1995, the simulations skirt the upper interval boundary, while they skirt the lower interval boundary for 2018. There are two ways to interpret this. First, one source of rating curve uncertainty is due to the fact that the water level is not only dependent on the discharge but also on the shape and phase of the flood wave. This is not captured by the rating curve model and may cause the true effect to be hidden in the rating curve uncertainty. Put differently, if the same hydrograph were to have occurred each year, such that the only difference between years was the change in geometry and roughness, we might have seen an effect. Second, there might not be enough informative data for the third stage in the rating curve to suggest the strong flattening of the curve for high discharge ranges as suggested by hydraulic model simulations. If this is the case, only discharges approaching the 1995 event are likely to produce the expected effect. The 1995 event is relatively rare (a once in 70 to 100 year event [31]), so it would follow that the probability of observing the effect is low.
Another possible explanation can be found in the uncertainty of the observations. Discharge measurements are generally not precise, and observational errors are likely to increase for high-discharge events [27,32,33]. In order for measurement uncertainty to change our findings qualitatively, i.e., other than increasing the uncertainty intervals, the error model for the measurement error has to be non-stationary. More precisely, the discharge measurement error has to be biased because of the system change. Given the estimated rating curves, this measurement bias has to be in the order of 500 m 3 s 1 or about 10% to account for 0.4 m at the peak of the 2018 discharge wave. We consider such a bias an implausible single explanation for the apparent discrepancy between measurement and model.
Alternatively, one could argue that the reason for the difference is because we did not calibrate our models to maintain independence between observations and model simulations. While it is true that hydraulic models are calibrated in practice, we argue that our uncalibrated model simulations are quite plausible (9) and that it is exceedingly unlikely that any calibration would result in the Nijmegen side channel having no effect on water levels at all.

5.2. Improvements to the Rating Curve Model

In this study, we used a relatively simple yet widely used rating curve model, which is conceptually based on steady, uniform flow and a three-stage channel. Despite its simplicity, the model does a good job explaining the observations. Improvements to the model, e.g., the Jones’ correction for hysteresis [34], would be aimed at reducing the part of the total uncertainty not covered by model uncertainty. However, the results show that a significant part of the total uncertainty—especially for the floodplain flow regime—is dominated by model uncertainty. Model uncertainty can be reduced by more observations or by reducing the number of parameters to be estimated. Introducing more complex models is therefore more likely to increase uncertainty than to decrease it.
Another way to decrease model uncertainty is to pool observations from multiple years. In this study, we assumed independence between the years, estimating a rating curve for each year without taking into account observations from previous years. The disadvantage of this approach is that well-gauged years but with a limited range of measured discharges will have high model uncertainty intervals for unseen high-discharge ranges. Model uncertainty can likely be reduced if measurements of previous years are taken into account. Given the non-stationarity of the rating curves, this would require a model for the time-dependence of the rating curve parameters. Here, we briefly discuss two possible approaches: (i) stability periods and (ii) hierarchical sub-models.
The key idea of stability periods is that rating curves can be considered stable for a certain period, after which a sudden change to the system forces a new rating curve. Within stable periods, all data can be pooled to estimate the parameters of the rating curve, thereby increasing the number of observations for parameter estimation. This approach has mainly been applied to rivers that undergo sudden (morphological) change following floods [25,35]. The challenge would be in objectively determining the boundary of these periods, considering that some intervention may already be effective during their construction.
A second approach is to adopt sub-models for some or all parameters in θ , effectively creating a hierachical probabilistic model. For example, the gradual change attributed to channel bed erosion observed in Figure 8 could be modelled by assuming that the offset parameter of the lowest flow regime ( b 0 ) is linearly dependent on time. However, the introduction of such parametric constraints to the model should be conducted with care, as unexpected changes may not be detected. A nonparametric approach was proposed by Reitan and Petersen-Øverleir [26], who used the Ornstein–Uhlenbeck stochastic process as a sub-model for the rating curve parameters. For the long-term, yearly changes in our case study, the AR(1) stochastic process [36] is a suitable candidate for future study.
However, even careful pooling of data may not result in an effect. In the previous paragraph (Section 5.1), we remarked that the model simulation suggest a flattening of the rating curve at very high discharges. These ranges are dominated by the third stage of the rating curve. It is likely that the available discharge record just does not contain enough informative data to result in this flattening, regardless of the pooling strategy chosen.

5.3. Reducing the Uncertainty of the Hydraulic Model

The input and parameters of the hydraulic models were derived from measured quantities such as geometry, vegetation density distributions and river dune dimensions. No parameters were calibrated on water levels or discharges. Therefore, the model simulations provide an independent estimation of the rating curve. Agreement between measurements and the uncalibrated model results is strong evidence that model simulations provide a credible projection of the effect of interventions.
In practice, calibration is often seen as a way to reduce model uncertainty by constraining model parameters to observed discharges [37]. In this paper, we showed that a relatively simple rating curve model with ten parameters exhibits model uncertainty. These uncertainty intervals are considerable, given both the relative change over the years and the absolute water levels: at the Pannerdensche Kop, the outer embankments have an approximate height of 18 m+NAP, at which the maximum water depth would be 15 m. The hydraulic model has more parameters, and previous studies have shown that the majority of those are not likely identifiable through probabilistic methods [38]. Therefore, parameter estimation may increase uncertainty instead of decreasing it. Nonetheless, hydraulic models should outperform statistical models in extrapolation to unseen and future conditions because they are constrained by the physical processes that underlie the mathematical model. Extrapolation to unseen conditions is generally tested using a differential split-sample test [39]. However, the ability of environmental models to extrapolate changing conditions is considered an open question in hydrology [7,9,40]. The data set presented in this paper provides an interesting case study to test hydraulic river models under changing conditions.

5.4. Interpreting the Implications of This Study

Although it is beyond the scope of this paper, we would like to make a note on the potential policy implications of our results to prevent our results from being misinterpreted. We emphasise that the results do not suggest that Room for the River had no effect. Not only is the absence of evidence not evidence of absence but also all of our hydraulic model simulations as well as our common sense and hydraulic theory tell us that water levels will be reduced by such large-scale interventions.
However, one might philosophise the relative importance and perceived precision of hydraulic model simulations in intervention design. In their opinion piece, Saltelli et al. [41] lay out five principles for mathematical modelling to remain useful to society. One of these is to assess uncertainty: to not “project with more certainty than (…) models deserve”. Therefore, we stress the importance of explicitly quantifying uncertainty, discussing model and data (in)adequacy, and working towards a good modelling practice for model-based intervention design.

6. Conclusions

The objective of this paper was to study to what extent the predicted reduction of flood levels by hydraulic models can be verified using the observational record.
The simulations of water levels show a general decrease in water levels since 1995 following the Room for the River program. Changes in water levels could be attributed to large-scale interventions (decrease) and periodical updates to the vegetation maps (increase). The results also show that the largest change in water levels occurred in between measurement stations, which complicates a verification of the model projections. The water level observations generally showed a linear decrease in water levels of about 1–2 cm per year, which is attributed to channel bed erosion. Clear deviations from the linear trend, which would indicate the effects of human intervention, were not found. We argued that the effect of the intervention may be hidden in the rating curve uncertainty and that, therefore, more measurements at high discharges may reveal a deviation from the autonomous linear trend. In our discussion, we emphasised that our results do not suggest that Room for the River had no effect but, rather, that our results reveal a challenge to incorporating uncertainty in the model-based design of human intervention.

Author Contributions

Conceptualisation, K.D.B. and M.R.A.G.; formal analysis, K.D.B. and M.R.A.G.; funding acquisition, J.J.W. and S.J.M.H.H.; investigation, K.D.B. and M.R.A.G.; methodology, K.D.B. and M.R.A.G.; project administration, J.J.W. and S.J.M.H.H.; software, K.D.B.; supervision, J.J.W. and S.J.M.H.H.; visualisation, K.D.B.; writing—original draft, K.D.B. and M.R.A.G.; writing—review and editing, J.J.W. and S.J.M.H.H. All authors have read and agreed to the published version of the manuscript.

Funding

This research is part of the RiverCare (project number 13520) and AllRisk research programmes, both supported by the Dutch Technology Foundation TTW, which is part of the Netherlands Organisation for Scientic Research (NWO). The programmes are partly funded by NWO under grant numbers P12-14 (RiverCare) and P15-21 (AllRisk) in collaboration with public and private partners.

Data Availability Statement

The hydraulic and geographical databases as well as the Baseline software (version 6.1.1.2041) were provided by Rijkswaterstaat and can be requested from Helpdesk Water (https://www.helpdeskwater.nl, accessed on 13 July 2021).

Acknowledgments

All simulations were performed on a computational cluster running CentOS-6 64 bit Linux, using D-FlowFM version 1.1.294.57252. Probabilistic analysis with the hydraulic model were performed using CORAL [24]. The MCMC sampler was implemented in PyMC3 [42].

Conflicts of Interest

The authors declare no conflict of interest.

Appendix A. Table of Stochasts

Table A1. Parameters of the floodplain roughness class distributions. Codes marked with an asterisk * are not used in the Waal model.
Class CodeNameParameters
Empirical distribution
612–637Alluvial bed
Uniform distribution
n/aClassification map
Triangular distributionsminmeanmax
102Deep bed0.0250.030.033
104Natural side channel0.030.0350.04
105Side channel0.0250.030.033
106Pond/Harbor0.0250.030.033
111Sand bank0.0250.030.033
121Field0.020.030.04
Lognormal distributions μ h v σ h v μ n v σ n v
1201Production meadow−3.180.472.400.77
1202Natural grass and hayland−0.740.53−2.640.93
1203Herbaceous meadow−1.640.322.590.33
1211 *Thistle herb. Veg.−1.290.331.050.43
1212Dry herbaceous vegetation−0.590.39−3.060.65
1213 *Brambles−0.670.21−0.730.36
1214 *Hairy willowherb−1.890.56−0.250.49
1215 *Reed herb. Veg.0.600.22−1.830.27
1221Wet herb. Veg.−1.080.38−1.490.44
1222 *Sedge−1.320.670.040.63
1223Reed-grass−0.920.86−2.190.16
1224Bulrush−0.810.670.040.63
1225 *Reed-mace0.370.23−1.120.57
1226Reed0.940.13−1.140.42
1231Softwood shrubs1.810.24−2.200.79
1232Willow plantation1.050.43−3.230.62
1233Thorny shrubs1.480.64−1.730.41
1241 *Hardwood production forestDeterministicDeterministic−4.680.67
1242Softwood production forestDeterministicDeterministic−4.720.66
1243 *Pine forestDeterministicDeterministic−4.180.54
1244Hardwood forestDeterministicDeterministic−3.450.77
1245Softwood forestDeterministicDeterministic−3.040.99
1246Orchard low1.100.10−3.720.25
1247Orchard high1.780.21−4.610.12
1250Pioneer vegetation−2.870.18−1.930.50

Appendix B. Table of Measurements

Table A2. Overview of discharge measurements from the hydraulic database.
Discharge [m 3 s 1 ]
YearnMin.Max.
1988509146296
1989537082042
1990417414881
1991296284258
199288891434
19932010396958
1994912314388
19952610567844
1996198651835
199758601461
1998249186077
19992911845397
20003812323736
20017111506186
20025511244652
2003685655863
2004308914623
2005348163740
2006118911596
2007478733690
20088710422812
2009626882804
20106610483894
2011736555451
2012769044440
20132912453881
2014409322092
2015317553050
2016387683006
2017447352249
2018445844818

References

  1. Van Denderen, R.P.; Schielen, R.M.J.; Westerhof, S.G.; Quartel, S.; Hulscher, S.J.M.H. Explaining artificial side channel dynamics using data analysis and model calculations. Geomorphology 2019, 327, 93–110. [Google Scholar] [CrossRef] [Green Version]
  2. Collas, F.P.L.; Buijse, A.D.; Van den Heuvel, L.; Van Kessel, N.; Schoor, M.M.; Eerden, H.; Leuven, R.S.E.W. Longitudinal training dams mitigate effects of shipping on environmental conditions and fish density in the littoral zones of the river Rhine. Sci. Total Environ. 2018, 619–620, 1183–1193. [Google Scholar] [CrossRef] [PubMed]
  3. De Ruijsscher, T.; Naqshband, S.; Hoitink, T. Flow Bifurcation at a Longitudinal Training Dam: Effects on Local Morphology. E3S Web Conf. 2018, 40, 05020. [Google Scholar] [CrossRef]
  4. Berends, K.D.; Straatsma, M.W.; Warmink, J.J.; Hulscher, S.J.M.H. Uncertainty quantification of flood mitigation predictions and implications for interventions. Nat. Hazards Earth Syst. Sci. 2019, 19, 1737–1753. [Google Scholar] [CrossRef] [Green Version]
  5. Straatsma, M.W.; Kleinhans, M.G. Flood hazard reduction from automatically applied landscaping measures in RiverScape, a Python package coupled to a two-dimensional flow model. Environ. Model. Softw. 2018, 101, 102–116. [Google Scholar] [CrossRef]
  6. Klijn, F.; De Bruin, D.; De Hoog, M.C.; Jansen, S.; Sijmons, D.F. Design quality of room-for-the-river measures in the Netherlands: Role and assessment of the quality team (Q-team). Int. J. River Basin Manag. 2013, 11, 287–299. [Google Scholar] [CrossRef]
  7. Thirel, G.; Andréassian, V.; Perrin, C. On the need to test hydrological models under changing conditions. Hydrol. Sci. J. 2015, 60, 1165–1173. [Google Scholar] [CrossRef]
  8. Beven, K. Facets of uncertainty: Epistemic uncertainty, non-stationarity, likelihood, hypothesis testing, and communication. Hydrol. Sci. J. 2016, 61, 1652–1665. [Google Scholar] [CrossRef] [Green Version]
  9. Blöschl, G.; Bierkens, M.F.P.; Chambel, A.; Cudennec, C.; Destouni, G.; Fiori, A.; Kirchner, J.W.; McDonnell, J.J.; Savenije, H.H.G.; Sivapalan, M.; et al. Twenty-three unsolved problems in hydrology (UPH)—A community perspective. Hydrol. Sci. J. 2019, 64, 1141–1158. [Google Scholar] [CrossRef] [Green Version]
  10. Oreskes, N.; Belitz, K. Philosphical issues in Model Assessment. In Model Validation: Perspectives in Hydrological Science; Anderson, M.G., Bates, P.D., Eds.; John Wiley and Sons Ltd.: New York, NY, USA, 2001; pp. 23–41. [Google Scholar]
  11. Van der Sluijs, J.P. A way out of the credibility crisis of models used in integrated environmental assessment. Futures 2002, 34, 133–146. [Google Scholar] [CrossRef] [Green Version]
  12. Jakeman, A.J.; Letcher, R.A.; Norton, J.P. Ten iterative steps in development and evaluation of environmental models. Environ. Model. Softw. 2006, 21, 602–614. [Google Scholar] [CrossRef] [Green Version]
  13. Uusitalo, L.; Lehikoinen, A.; Helle, I.; Myrberg, K. An overview of methods to evaluate uncertainty of deterministic models in decision support. Environ. Model. Softw. 2015, 63, 24–31. [Google Scholar] [CrossRef] [Green Version]
  14. Maier, H.R.; Guillaume, J.H.A.; Van Delden, H.; Riddell, G.A.; Haasnoot, M.; Kwakkel, J.H. An uncertain future, deep uncertainty, scenarios, robustness and adaptation: How do they fit together? Environ. Model. Softw. 2016, 81, 154–164. [Google Scholar] [CrossRef]
  15. Straatsma, M.W.; Van der Perk, M.; Schipper, A.M.; De Nooij, R.J.W.; Leuven, R.S.E.W.; Huthoff, F.; Middelkoop, H. Uncertainty in hydromorphological and ecological modelling of lowland river floodplains resulting from land cover classification errors. Environ. Model. Softw. 2013, 42, 17–29. [Google Scholar] [CrossRef]
  16. Warmink, J.J.; Booij, M.J.; Van der Klis, H.; Hulscher, S.J.M.H. Quantification of uncertainty in Design water levels due to uncertain bed form roughness in the Dutch rivier Waal. Hydrol. Process. 2013, 27, 1646–1663. [Google Scholar] [CrossRef]
  17. Becker, A.; Scholten, M.; Kerkhoven, D.; Spruyt, A. Das Behördliche Modellinstrumentarium der Niederlande. In 37. Dresdner Wasserbaukolloquium 2014 “Simulationsverfahren und Modelle für Wasserbau und Wasserwirtschaft”; Stamm, J., Ed.; Dresden, Germany, 2014; pp. 539–548. [Google Scholar]
  18. Kroekenstoel, D. Rivierkundig Beoordelingskader voor Ingrepen in de Grote Rivieren; v2.01; Technical Report; Rijkswaterstaat: Lelystad, The Netherlands, 2009; v2.01; Technical Report. [Google Scholar]
  19. Buschman, F.; Blom, A.; Van Dijk, T.; Kleinhans, M.; Van der Mark, R. Informatiebehoefte en Aanbevelingen voor Monitoring in de Bovendeltade Rijn; Technical Report; Deltares: Delft, The Netherlands, 2017. [Google Scholar]
  20. Warmink, J.J.; Straatsma, M.W.; Huhoff, F.; Booij, M.J.; Hulscher, S.J.M.H. Uncertainty of design water levels due to combined bed form and vegetation roughness in the Dutch River Waal. J. Flood Risk Manag. 2013, 6, 302–318. [Google Scholar] [CrossRef]
  21. Kernkamp, H.W.J.; Van Dam, A.; Stelling, G.S.; De Goede, E.D. Efficient scheme for the shallow water equations on unstructured grids with application to the Continental Shelf. Ocean. Dyn. 2011, 61, 1175–1188. [Google Scholar] [CrossRef]
  22. Warmink, J.J.; van der Klis, H.; Booij, M.J.; Hulscher, S.J.M.H. Identification and quantification of uncertainties in a hydrodynamic river model using expert opinion elicitation. Water Resour. Manag. 2011, 25, 601–622. [Google Scholar] [CrossRef] [Green Version]
  23. Berends, K.D.; Warmink, J.J.; Hulscher, S.J.M.H. Efficient uncertainty quantification for impact analysis of human interventions in rivers. Environ. Model. Softw. 2018, 107, 50–58. [Google Scholar] [CrossRef] [Green Version]
  24. Berends, K. CORAL: kdberends/coral: v0.1-PhD. 2020. Available online: https://doi.org/10.5281/ZENODO.3749855 (accessed on 13 July 2021).
  25. Mansanarez, V.; Renard, B.; Le Coz, J.; Lang, M.; Darienzo, M. Shift Happens! Adjusting Stage-Discharge Rating Curves to Morphological Changes at Known Times. Water Resour. Res. 2019, 55, 2876–2899. [Google Scholar] [CrossRef]
  26. Reitan, T.; Petersen-Øverleir, A. Dynamic rating curve assessment in unstable rivers using Ornstein-Uhlenbeck processes. Water Resour. Res. 2011, 47. [Google Scholar] [CrossRef]
  27. Le Coz, J.; Renard, B.; Bonnifait, L.; Branger, F.; Boursicaud, R.L. Combining hydraulic knowledge and uncertain gaugings in the estimation of hydrometric rating curves: A Bayesian approach. J. Hydrol. 2014, 509, 573–587. [Google Scholar] [CrossRef] [Green Version]
  28. Hoffman, M.D.; Gelman, A. The No-U-Turn Sampler: Adaptively Setting Path Lengths in Hamiltonian Monte Carlo. J. Mach. Learn. Res. 2014, 15, 1593–1623. [Google Scholar]
  29. Gelman, A. Prior distributions for variance parameters in hierarchical models. Bayesian Anal. 2006, 1, 515–533. [Google Scholar] [CrossRef]
  30. Ten Brinke, W.B.M.; Gölz, E. Bed Level Changes and Sediment Budget of the Rhine Near the German-Dutch Border; Technical Report; German Federal Institute of Hydrology (BFG), Institute for Inland Water Management and Waste Water Treatment = Ministerie van Verkeer en Waterstaat, Rijkswaterstaat, Rijksinstituut voor Integraal Zoetwaterbeheer en Afvalwaterbehandeling (RWS, RIZA): Lelystad, The Netherlands, 2001. [Google Scholar]
  31. Chbab, E.H. How extreme were the 1995 flood waves on the rivers Rhine and Meuse? Phys. Chem. Earth 1995, 20, 455–458. [Google Scholar] [CrossRef]
  32. Di Baldassarre, G.; Montanari, A. Uncertainty in river discharge observations: A quantitative analysis. Hydrol. Earth Syst. Sci. 2009, 13, 913–921. [Google Scholar] [CrossRef] [Green Version]
  33. Domeneghetti, A.; Castellarin, A.; Brath, A. Assessing rating-curve uncertainty and its effects on hydraulic model calibration. Hydrol. Earth Syst. Sci. Discuss. 2011, 8, 10501–10533. [Google Scholar] [CrossRef]
  34. Petersen-Øverleir, A. Modelling stage—Discharge relationships affected by hysteresis using the Jones formula and nonlinear regression. Hydrol. Sci. J. 2006, 51, 365–388. [Google Scholar] [CrossRef] [Green Version]
  35. McMillan, H.; Freer, J.; Pappenberger, F.; Krueger, T.; Clark, M. Impacts of uncertain river flow data on rainfall-runoff model calibration and discharge predictions. Hydrol. Process. 2010. [Google Scholar] [CrossRef]
  36. Romanowicz, R.; Beven, K.J.; Tawn, J. Bayesian Calibration of Flood Inundation Models. In Floodplain Processes; Anderson, M.G., Walling, D.E., Bates, P.D., Eds.; John Wiley and Sons Ltd.: London, UK, 1996; pp. 333–360. [Google Scholar]
  37. Pappenberger, F.; Beven, K.J. Ignorance is bliss: Or seven reasons not to use uncertainty analysis. Water Resour. Res. 2006, 42. [Google Scholar] [CrossRef]
  38. Werner, M.G.F.; Hunter, N.M.; Bates, P.D. Identifiability of distributed floodplain roughness values in flood extent estimation. J. Hydrol. 2005, 314, 139–157. [Google Scholar] [CrossRef]
  39. Klemes, V. Operational testing of hydrological simulation models. Hydrol. Sci. J. 1986, 31, 13–24. [Google Scholar] [CrossRef]
  40. Thirel, G.; Andréassian, V.; Perrin, C.; Audouy, J.N.; Berthet, L.; Edwards, P.; Folton, N.; Furusho, C.; Kuentz, A.; Lerat, J.; et al. Hydrology under change: An evaluation protocol to investigate how hydrological models deal with changing catchments. Hydrol. Sci. J. 2015, 60, 1184–1199. [Google Scholar] [CrossRef]
  41. Saltelli, A.; Bammer, G.; Bruno, I.; Charters, E.; Di Fiore, M.; Didier, E.; Espeland, W.N.; Kay, J.; Lo Piano, S.; Mayo, D.R.P., Jr.; et al. Five ways to ensure that models serve society: A manifesto. Nature 2020, 582, 482–484. [Google Scholar] [CrossRef]
  42. Salvatier, J.; Wiecki, T.V.; Fonnesbeck, C. Probabilistic programming in Python using PyMC3. PeerJ Comput. Sci. 2016, 2, e55. [Google Scholar] [CrossRef] [Green Version]
Figure 1. A selection of interventions carried out in the River Waal between 1995 and 2017. The River Waal splits from the River Rhine at 51.872 latitude, 6.038 longitude.
Civileng 02 00032 g001
Figure 2. Schematic outline of the methodology. The software used is indicated with red, italicised labels.
Civileng 02 00032 g002
Figure 3. Simulated changes in the water level at a constant 10,165 m 3 s 1 since 1995. (a) Annotation on how an intervention affects the water levels in time and space. (b) Annotation of the major changes to the river system.
Civileng 02 00032 g003
Figure 4. Simulated change in flood water level in 2015 compared to 1995. The location of the water level measurement stations are annotated.
Civileng 02 00032 g004
Figure 5. Confidence intervals for the simulated change in flood levels since 1995 (projected on the primary (left) axis) and the size of the 90% interval, projected onto the secondary (right) axis.
Civileng 02 00032 g005
Figure 6. The rating curves constrained on available data for 1988 (blue shaded area) and 2018 (orange shaded area), showing overall lower water levels in 2018 for the same discharge.
Civileng 02 00032 g006
Figure 7. Years with fewer measurements have comparatively large uncertainty intervals, especially in extrapolation. Shown here is the rating curve for 1997 (five measurements).
Civileng 02 00032 g007
Figure 8. Water levels trends for main channel flow (1000 m 3 s 1 ), bankful flow (2000 m 3 s 1 ), floodplain flow (5000 m 3 s 1 ) and extreme (10,165 m 3 s 1 ) discharge at Pannerdensche Kop. Note the break in the vertical axis to prevent overlap of the uncertainty intervals at 5000 m 3 s 1 and 10,165 m 3 s 1 .
Civileng 02 00032 g008
Figure 9. Comparing hydraulic model simulations with the rating curves for 1995 and 2018 shows that the model results fall within the uncertainty intervals of the rating curves. The decrease in water level due to human intervention may not be visible in the rating curves due to the uncertainty in extrapolation.
Civileng 02 00032 g009
Publisher’s Note: MDPI stays neutral with regard to jurisdictional claims in published maps and institutional affiliations.