Abstract
In this study, the early age thermal properties of a concrete mix containing ground granulated blast furnace slag (GGBFS) were investigated and incorporated in a finite-element model. A two-term exponential degree of hydration function was proposed to better capture the early age behavior. An FEM program (ABAQUS) was used to predict the temperature time-history of three 1.2-m (4-ft) cubes cast with a mix design containing 50% replacement of the cement by weight with GGBFS. The FEM predictions match well with the experimental temperature measurements. Results show that using the measurements of the thermal properties, an accurate estimation of the temperature difference can be obtained for a concrete mix containing GGBFS, and engineers can use the estimated temperature difference to take preventative measures to minimize the risk of thermal cracking.
1. Introduction
The chemical reaction of cement with water is an exothermal reaction that releases a large amount of heat. The generated heat is often called the heat of hydration and depends on the chemical composition and cement quantity. In large concrete structures, due to concrete’s low thermal conductivity, the interior temperature rise can approach the adiabatic temperature rise. The high temperatures can lead to delayed ettringite formation (DEF) and reduce the concrete’s strength and durability [1]. Furthermore, the surface of the concrete losses heat to the environment and cools rapidly. This phenomenon causes thermal gradients inside the structure. As the interior of the concrete attempts to expand, the exterior provides an internal restraint and causes thermal stresses at the surface. The thermal stresses are directly correlated to the temperature time history of the structure. Riding et al. reviewed the PCA, Schmidt, and ACI 207.2R methods to predict the temperature distribution in mass concrete structures [1]. They found that the PCA and ACI 207.R methods provided poor predictions. More recently, finite-element and finite-difference have been used to predict the temperature development of mass concrete structures by modeling the heat generation measured in adiabatic or isothermal conditions [2,3,4,5,6,7,8,9,10,11,12,13,14,15].
Commercial finite-element programs, such as DIANA, ANSYS and ABAQUS have been used to predict the temperature distribution of large concrete structures. Wu et al. (2011) used ANSYS to complete a parametric study of a concrete culvert [13]. Lin and Chen (2015) used ABAQUS to predict the temperature distribution of 1.2-m (4-ft) cubes cast with an ordinary Portland cement mix [9]. Do (2015) modeled concrete footers of different dimensions using DIANA and performed a parametric study [6]. Similarly, Lawrence et al. (2012) modeled the temperature distribution of concrete blocks using DIANA [8]. Recently, the early age heat of hydration and thermal properties of concrete mixes with ground-granulated blast furnace slag (GGBFS) have been studied extensively [16,17]. Typically, the heat of hydration of the binder is measured and simulated with analytical models. Analytical models originally proposed for binders with Portland cement have been adopted by researchers for concrete with GGBFS. Saeed et al. modeled the temperature profile of concrete blocks with only Portland cement and with 70% GGBFS replacement [10]; the GGBFS FEM predictions had a larger error compared to experimental measurements especially at an early age. Since the prediction of the temperature time history is directly related to the estimation of a structure’s cracking risk, it must be predicted accurately. Thus, this article proposes a better analytical model to simulate the heat of hydration of concrete containing GGBFS replacement, and therefore, increasing the accuracy of the temperature predictions.
In this study, the early age thermal properties of a mix containing 50% GGBFS was investigated and a methodology was developed to model its thermal properties. Afterwards the modeled thermal properties were incorporated into a finite-element program. Then, the temperature predictions were compared to experimental temperature measurements in 1.2-m (4-ft) concrete cubes. The temperature predictions were used in a stress analysis and will be described in a companion publication.
2. Thermal Analysis
The governing equation for a 3D heat transfer problem can be expressed as:
where T is the temperature (Kelvin, K), x, y and z are the coordinates, t is time, k is the thermal conductivity (), cp is the specific heat () and qv is the volumetric heat generation rate (W/m3).
For concrete, the complexity of the problem increases because the thermal conductivity, specific heat, and heat generation rate depend on the concrete’s maturity. Therefore, these properties must be expressed in terms of the degree of hydration. In this study, ABAQUS, a commercially available finite element software was used to solve for the concrete’s temperature distribution using user-defined subroutines. In the user-defined subroutines, the thermal conductivity, specific heat, and heat generation rate of the concrete were defined using a degree of hydration dependent functions.
The thermal energy released during the hydration process of the cementitious material with water depends on many factors such as the cementitious material’s chemical composition, mix proportions, and the concrete’s temperature-time history. The total cementitious content is the combination of the Portland cement and supplementary material such as GGBFS in the concrete mix. The heat generation rate is non-uniform and location dependent since the temperature varies within a large concrete structure. The total heat, , can be described mathematically using the degree of hydration, , in terms of the equivalent age as shown in Equation (2). The degree of hydration is defined as the fraction of cement that has already hydrated and can be related to the heat release [13,18]. The equivalent age, , depends on the temperature-time history of the concrete [19], , and can be calculated using Equation (3). Then, the heat generation rate at any given equivalent age, , can be found by taking the equivalent time derivative of Equation (2). The heat generation rate in equivalent age can then be converted to the actual time by multiplying by the time derivative of Equation (3). The heat generation rate in actual time, , can then be expressed with Equation (4).
where is the ultimate heat release (J/kg), is the total cementitious content (kg/m3), is the activation energy of the binder (J/mol), is the reference temperature ( and is the gas constant ().
Many researchers use one exponential term to mathematically describe the degree of hydration of concrete with Portland cement and blended binders [11,13,18,19,20,21,22]; however, the hydration of GGBFS with Portland cement produces an extra peak in the heat generation [21,23,24,25] and therefore a two-term exponential degree of hydration function, Equation (5), is needed to accurately capture the hydration behavior of the cement and slag binder. The coefficients and are the magnitude of each term and their sum is the ultimate degree of hydration of the entire cementitious binder, . The parameters , , and control the shape of the degree of hydration and can be fitted using experimentally measured heat from isothermal or adiabatic tests. After taking the equivalent time derivative of Equation (5), the heat generation rate, , can be expressed as Equation (6). The heat generation rate serves as the thermal loading in the thermal analysis of the concrete structure. The non-uniform heat rate was included in ABAQUS through a user subroutine called ‘DFLUX’. In the subroutine, the equivalent age of each element was calculated using the temperature-time history. Then, Equation (6) was used to calculate the thermal loading for each element and given to ABAQUS as a body heat flux at every time step.
The ultimate degree of hydration of the binder can be calculated using Equation (7) [22] which considers the influence of GGBFS, fly ash, and water to the cementitious ratio (). The ultimate degree of hydration of Portland cement developed by Mills [26] was modified using multivariable regression analysis to incorporate the presence of supplementary cementitious materials in the mix.
The ultimate heat of the binder, , can be found by adding the ultimate heat release of the Portland cement and GGBFS. Bogue’s equation, Equation (8), uses the chemical composition of the Portland cement to estimate its ultimate heat, . Later, Schindler and Folliard proposed Equation (9) to calculate the ultimate heat for a binder containing GGBFS, fly ash, and silica fume [22]. In their equation, the ultimate heat release of the GGBFS was assumed to be 461 J/g and 550 J/g for Grade 100 GGBFS and Grade 120 GGBFS, respectively. Maekawa et al. also used an ultimate heat release of 461 J/g for GGBFS [27].
where , , , , , and are the mass proportions of cement chemical compounds, , free and in Portland cement, is the percentage of cement, is the percentage of Grade 100 GGBFS, is the percentage of Grade 120 GGBFS, is the percentage of CaO in the fly ash and is the percentage of silica fume. The four main cement compounds C3S, C2S, C3A, and C4AF were calculated to be 60.13%, 12.95%, 7.27% and 9.71% by weight.
The thermal conductivity and specific heat adopted by Lin and Chen were used to model the early age concrete thermal properties [9]. Van Breugel reported that the thermal conductivity decreased by 33% throughout the hydration process and can be modeled using Equation (11) [28]. Lin and Chen reported that the specific heat of concrete is dependent on the concrete mix proportion, degree of hydration, and temperature [9]. Equation (10) was used to model the specific heat. The specific heat for the cementitious material was calculated by taking a weighted average between the Portland cement and GGBFS. The specific heat of cement and GGBFS are and [29,30], respectively. The specific heat ( for the cementitious material, fine aggregate, larger aggregate, and water were assumed to be 690, 710, 840 and 4184 , respectively. Like the “DFLUX” subroutine, a user subroutine called “USDFLD” was used to incorporate the degree of hydration dependent specific heat and thermal conductivity.
where is the concrete’s mass density, is the cementitious weight per unit volume of concrete is the fine aggregate weight per unit volume of concrete, is the coarse aggregate weight per unit volume of concrete, is the water weight per unit volume of concrete, is a fictitious specific heat of the hydrated cementitious material (, is the degree of reaction () and is the hardened concrete thermal conductivity at 28-days.
3. Experiments
A mix design with 50% GGBFS replacement of Portland cement by weight was investigated. The mixed design is shown in Table 1. An air-entraining agent and retarder/water reducer were added to the concrete mixes. The air-entraining agent meets ASTM specification C260, and the retarder/water meets ASTM C494 Type B and Type D specifications. The dosages are shown in Table 1. A laboratory batch (In-Lab) was made to test the thermal and mechanical properties including the Adiabatic Temperature Rise (ATR), heat generation, activation energy, and thermal conductivity. Then, batches delivered by a local concrete supplier (Batch 1, Batch 2, and Batch 3) were used to cast three 1.2-m (4-ft) cubes with steel formwork. The 1.2-m (4-ft) cubes were instrumented with temperature loggers to verify the thermal analysis described in the earlier sections. The air content, slump, and initial temperature of the batches can be found in Table 2.

Table 1.
50% GGBFS replacement mix design.

Table 2.
Fresh concrete properties.
The chemical compositions of the Portland cement and GGBFS used in the study are shown in Table 3. The GGBFS’s chemical composition is like Maekawa et al.’s slag (CaO = 43.3% and SiO2 = 31.3% by weight) [27]. Using the chemical composition of the Portland cement and Bogue’s equation, the ultimate heat of the Portland cement was calculated to be 485,101 J/kg. Then, with Equation (9), the ultimate heat of the binder in Table 1 was calculated to be 473,050 J/kg. Unlike the ultimate degree of hydration, the ultimate heat of the binder is solely dependent on the chemical composition of the cementitious material.

Table 3.
Chemical composition of cementitious material.
3.1. Thermal Properties
3.1.1. Activation Energy
The hydration parameters and activation energy needed to describe the degree of hydration of the cementitious material and the heat generation rate were experimentally measured. The hydration parameters and activation energy were found by using regression analysis similar to the methods employed by Xu et al. and D’Aloia [31,32]. The heat generation was measured using an isothermal calorimeter at three different temperatures. In the isothermal calorimeter, 20-g of the cementitious material (a blend of 10-g of Portland cement and 10-g of GGBFS) was hydrated at 23 °C, 33 °C, and 43 °C in a commercially available TAM Air calorimeter. The water-cementitious ratio of the isothermal samples was controlled to be 0.42. The heat generation and heat generation rate at each temperature are shown in Figure 1. The heat generation at different temperatures is equal at the same the equivalent age. Ideally, a superimposed figure of the heat generations yields the same curve. However, due to experimental measurement errors, the figure will have some deviations. The deviation can be minimized visually or preferably using a least-squares analysis. In this study, the activation energy of the concrete mix was found by minimizing Equation (12).
where , and are the curing temperature, is the equivalent age at a total heat and is the number of .

Figure 1.
Isothermal at three different temperatures: (a) Heat rate and (b) Heat.
Researchers have proposed that the activation energy depends on the degree of hydration [20,33,34]. In this study, a constant “apparent” activation energy of 39,778 J/mol obtained from the isothermal calorimeter testing was implemented because it can be measured more consistently than the activation energy determined from the compressive strength [20,35]. Poole et al. [20], Brooks et al. [36] and Riding et al. [35,37] reported the activation energy of concrete mix designs with 50% GGBFS replacement to be 39,900 J/mol, 41,000 J/mol and 41,200 J/mol. These values are close to the measured activation energy in this study. As shown in Figure 2, the activation energy, found using regression analysis, makes the heat rate and heat generation rate of all three-temperature match well when plotted in equivalent time.

Figure 2.
Isothermal at three different temperatures in equivalent age: (a) Heat rate and (b) Heat.
3.1.2. Adiabatic Temperature Rise
The adiabatic heat generation was measured using an adiabatic test setup similar to Lin and Chen [9]. A 150-mm × 150-mm cylinder in an insulated container was placed in a temperature-controlled water bath. An electric heating unit was designed to heat the water bath to match the concrete’s temperature using a temperature control mechanism. An embedded thermal couple measured the adiabatic temperature rise (ATR) of the specimen. The ATR reached 44 °C at 300 equivalent hours and had an initial temperature of 21.7 °C, Figure 3.
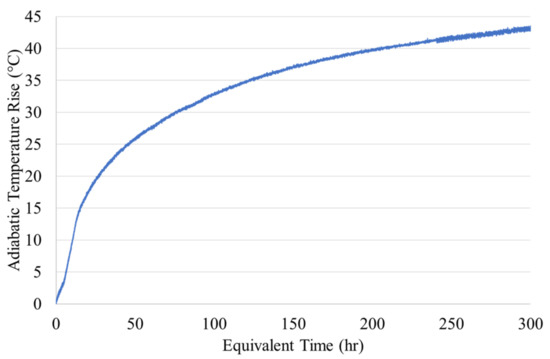
Figure 3.
Adiabatic Temperature Rise.
Then, the heat generation was calculated by multiplying the ATR by the concrete’s density and specific heat, Equation (10). Afterward, the hydration parameters were found by fitting Equation (5). The parameters are shown in Table 4 and a comparison between the experimental heat and Equation (2) is shown in Figure 4. Additionally, if the second term in Equation (5) is ignored, another set of hydration parameters can be found. These parameters correspond to the original degree of hydration proposed by Schindler and Folliard (2005) [22]. Unlike the one-term degree of hydration, Equation (5) can capture the early age behavior caused by the hydration of the GGBFS. Later, the hydration parameters will be used in the finite element analysis.

Table 4.
Hydration parameters for finite element analysis.

Figure 4.
Adiabatic measurement of heat: (a) Accumulated heat and (b) Heat rate
The ultimate thermal conductivity, , of the mix design shown in Table 1 was measured following CRD-C developed by the Army Corp [38]. A 150-mm by 300-mm concrete cylinder with an embedded thermal couple at the center was tested after it had cured for 28-days. The specimen was heated to approximately 80 °C and allowed to cool in cold running water. Following CRD-C, the temperature difference between the water bath and concrete temperature was used to calculate the ultimate thermal conductivity. The ultimate thermal conductivity of the 50% GGBFS replacement mix was measured to be 1.65 . A summary of the thermal properties is shown in Table 5.

Table 5.
Summary of thermal properties of 50% GGBFS mix design.
3.1.3. Cube Testing (1.2-m)
A 1.2-m (4-ft) concrete cube was cast from each batch delivered by a local concrete supplier at three different casting date (Batch 1, Batch 2, and Batch 3). During the casting, the slump and air content were measured, Table 2. Temperature loggers were embedded in the 1.2-m (4-ft) cube and tied to an aluminum cage. The cage provided minimal reinforcement and its only purpose was to secure the sensors. The temperature loggers’ locations were measured before each casting and set to record at 1-h intervals with a resolution of 1 °C. An additional temperature logger was placed in a shaded location to measure the ambient temperature. A picture taken during the casting is shown in Figure 5. The 1.2-m (4-ft) cube was cast in a steel formwork with a thickness of 3.175-mm. The steel formwork was kept in place for 10-days to minimize the drying of the concrete surface.
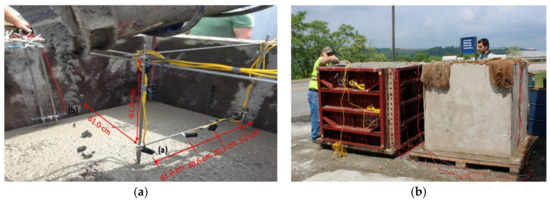
Figure 5.
The picture was taken during Batch 2: (a) Temperature loggers and (b) 1.2-m Cube casting.
The initial temperature of each 1.2-m (4-ft) cube was 26 °C, 29 °C, and 22 °C and the temperature logger at the center reached a maximum temperature of 50 °C, 53 °C, and 44 °C for Batch 1, Batch 2, and Batch 3, respectively. The measured concrete temperature-time histories of each 1.2-m (4-ft) cube with the measured ambient temperature are shown in Figure 6, Figure 7 and Figure 8. Note, the distances shown in the figures correspond to the temperature logger’s location from the inner surface of the steel formwork. These experimental temperature-time histories will be compared to the finite element analysis.
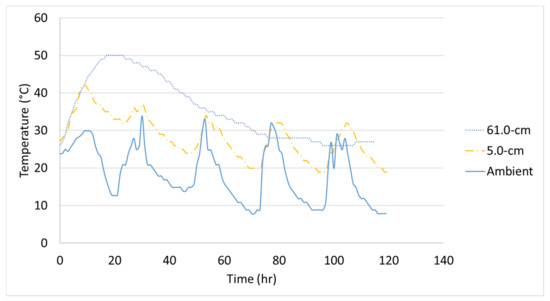
Figure 6.
Temperature-time history of Batch 1’s 1.2-m (4-ft) cube.
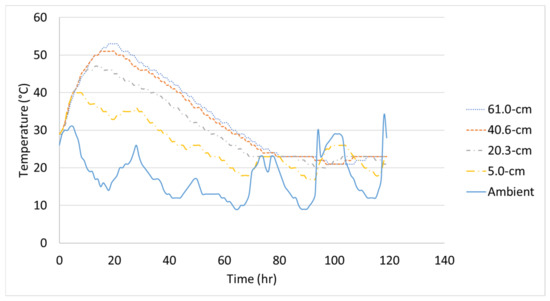
Figure 7.
Temperature-time history of Batch 2’s 1.2-m (4-ft) cube.
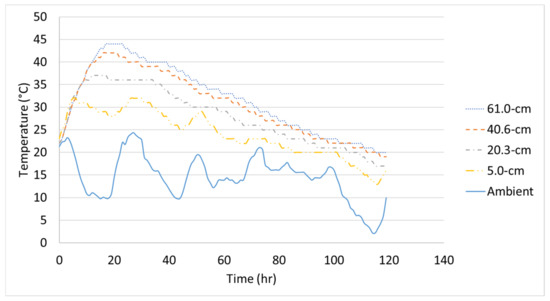
Figure 8.
Temperature-time history of Batch 3’s 1.2-m (4-ft) cube.
4. Finite Element Analysis
The 1.2-m (4-ft) cube finite-element model consisted of two parts: the concrete cube and the steel formwork, Figure 9. The concrete and steel formwork were modeled in the transient thermal analysis using 8-node linear heat transfer brick elements (DC3D8) with a uniform mesh size of 25-mm. The initial temperature of the steel formwork was assumed to be equal to the ambient temperature at the time of casting. The concrete block and steel formwork transferred heat to each other through thermal conductance. Lin and Chen (2015) measured the thermal conductance coefficient between concrete and steel to be 358- [9]. The outer surface of the formwork lost heat through convection where the measured ambient temperature served as the heat sink. The convection heat transfer coefficient, , depends on the ambient conditions, mainly wind [4,10,13], and therefore, must be adjusted based on the wind speed using Equation (13). The measured wind speed, from a local weather station was used in the thermal analysis. Based on the wind speed, the convection coefficient was updated at every time step in ABAQUS. The wind speeds for Batch 1, Batch 2, and Batch 3 are shown in Figure 10. Additionally, the steel formwork absorbs a large amount of heat from the sun radiation and should be included in the thermal analysis, therefore, Equation (14) was adopted [21,39,40]. In Equation (14), the solar intensity, , was assumed to be a sinusoidal function and negligible after the sunsets. The heat from the sun, , was given to ABAQUS as a surface heat flux, and updated at every time step, Figure 11. The solar absorptivity, , was assumed to be 0.47 [41]. A 0.25-h time step was used in the thermal analysis.
where is the convection coefficient () and is the wind speed (m/s).
where is the total heat of solar radiation (), is the solar absorptivity, is the intensity factor to account for the angle of the sun during a 24-h day and is the instantaneous solar radiation ().
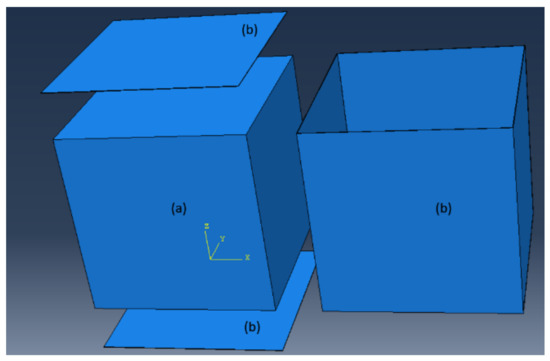
Figure 9.
Finite element model: (a) Concrete block and (b) Steel formwork.
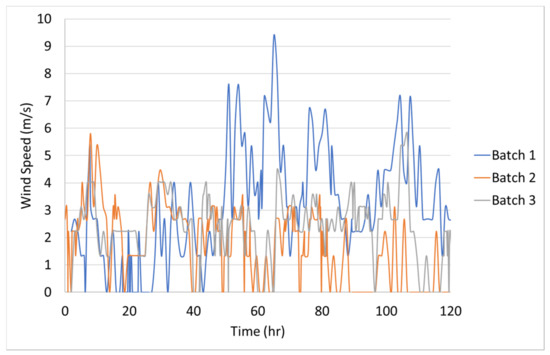
Figure 10.
Wind speed during 1.2-m (4-ft) cube casting.
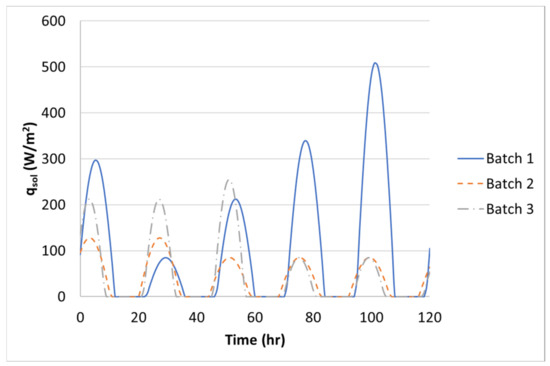
Figure 11.
Solar radiation for Batch 1, Batch 2, and Batch 3.
4.1. Verification of User Subroutines (DFLUX and USDFLD)
The user subroutines used in the thermal analysis were checked by analyzing the 1.2-m (4-ft) cube without any heat loss by eliminating the conductance and convection heat transfer. The temperature of the 1.2-m (4-ft) cube without heat loss should match the input adiabatic temperature rise calculated using the two-term hydration parameters in Table 4. As shown in Figure 12, the simulation compares well with the input ATR. Therefore, the degree of hydration, heat generation rate, and specific heat are working correctly in the user subroutines.
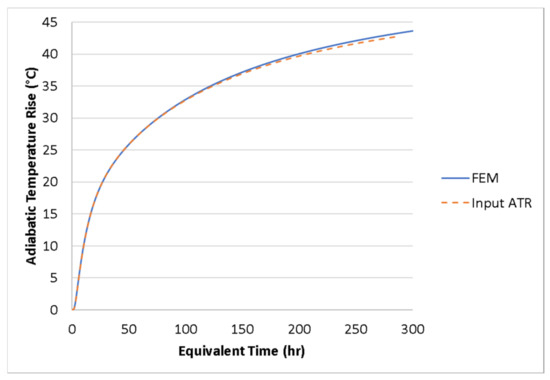
Figure 12.
Comparison of FE model and input ATR.
4.2. Temperature Analysis
Using the thermal material properties stated in Section 3, the temperature histories of the three 1.2-m (4-ft) cubes were predicted with the FEM model. The temperature distribution is shown in Figure 13, Figure 14, Figure 15 and Figure 16 show the comparison between the experiment and the FEM analysis. During the first day, the center temperature of the 1.2-m (4-ft) cube is not affected greatly by the environment. The percent differences between the experimental temperature measurements and the FEM model are shown in Table 6. The max temperature at the center was predicted with a maximum of 1.8% error. However, after the peak temperature, environmental factors such as sun radiation can cause discrepancies between the experimental and FEM model results, especially at the side surface location (5-cm from the side surface). Since the thermal stresses are caused by the temperature gradients inside the concrete structure, it is important that the temperature model can accurately predict the maximum temperature difference. A comparison of temperature difference is shown in Figure 17. Based on Figure 17, the maximum temperature difference between the experiment and the FEM prediction is about 2.4 °C, and it occurs approximately 1 to 2.5 h from the experiment’s peak temperature difference. Due to the GGBFS slow reaction rate, the temperature differences at the first few hours after casting were usually negative because the side surface warms faster than the center. Later, once the heat of hydration started the temperature difference becomes positive.
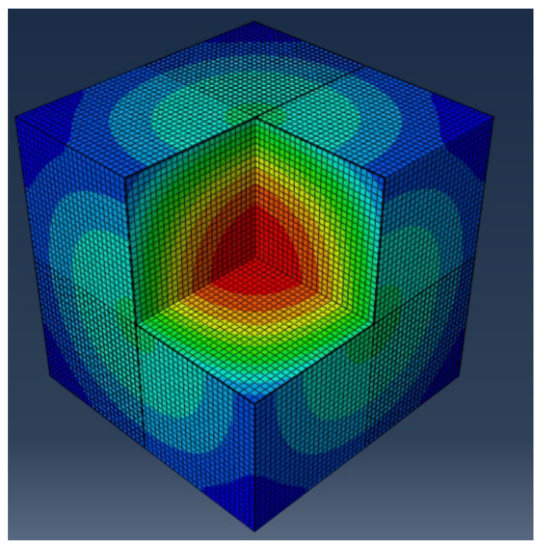
Figure 13.
Finite element model at 16.50 h: Temperature (Red = high temperature, Blue = low temperature).
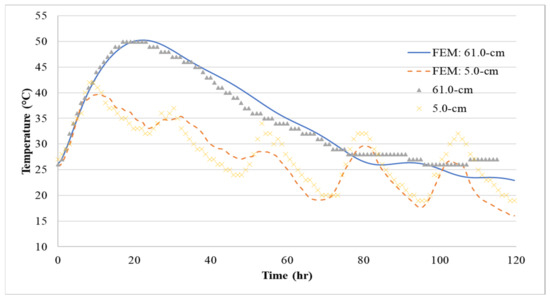
Figure 14.
Comparison between FEM model prediction and measured temperatures at center (61.0-cm) and side surface (5.0-cm) for Batch 1.
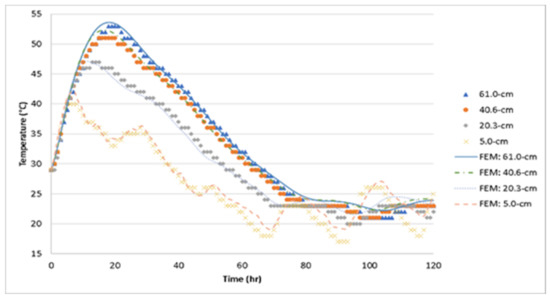
Figure 15.
Comparison between FEM model prediction and measured temperatures for Batch 2.
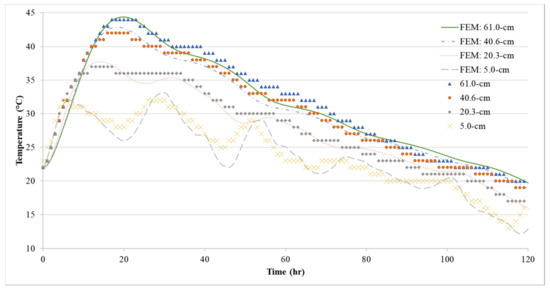
Figure 16.
Comparison between FEM model prediction and measured temperatures for Batch 3.

Table 6.
Percent difference for maximum temperature and temperature difference.
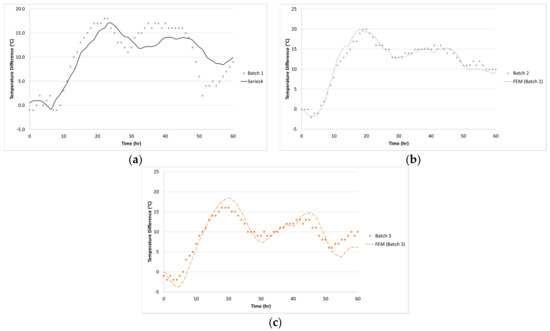
Figure 17.
Comparison of the temperature difference between FEM model and experiment: (a) Batch 1, (b) Batch 2 and (c) Batch 3.
5. Sensitivity Analysis
The thermal analysis depends greatly on the thermal properties of the mix. The purpose of the sensitivity analysis is to give an insight into which material properties should be measured with the delivered concrete. As a case study, the sensitivity of the maximum temperature and temperature difference to the different material properties was investigated. For the sensitivity study, the ambient conditions for Batch 3 were used as an example. The thermal conductivity, adiabatic temperature rise, and activation energy were each adjusted by ±10%. Since these material properties were determined during an In-Lab batch, it is reasonable that Batch 1, Batch 2, and Batch 3 might have slightly different properties. The difference in the properties might be due to the variation in water-cementitious ratio, chemical composition of the cementitious materials, air content or batching properties since the concrete was delivered by ready-mix trucks from the concrete supplier.
As shown in Figure 18, the variation of adiabatic temperature rise affects the maximum temperature and the temperature differential the largest. The thermal conductivity shifts the maximum temperature and increases/decreases the maximum temperature rise and temperature difference but has very little effect on the surface temperature. The effect of each thermal properties is tabulated in Table 7. A ± 10% variation of the thermal conductivity or activation energy causes the maximum temperature and maximum temperature difference to change by ± 1.9% and ±3.8%, respectively. A ± 10% variation in ATR would cause about ±6.6% deviation in the predicted maximum temperature and about ±9.2% deviation in the maximum temperature difference. It is recommended that the adiabatic temperature rise be measured using the delivered concrete on-site at each casting [29] to increase the accuracy of the prediction while the thermal conductivity and activation energy can be measured beforehand.
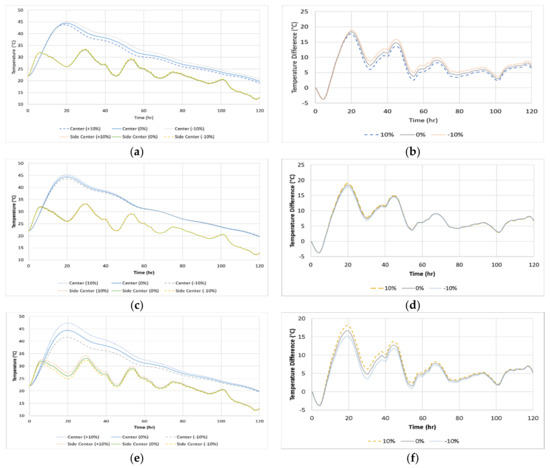
Figure 18.
Temperature analysis sensitivity due to measured thermal properties: (a) Thermal conductivity (Temperature) (b) Thermal conductivity (Temperature difference), (c) Activation energy (Temperature), (d) Activation energy (Temperature difference), (e) ATR (Temperature) and (f) ATR (Temperature difference).

Table 7.
Thermal analysis sensitivity.
6. Conclusions
In this study, laboratory experiments were completed to measure the thermal properties of a mix design containing 50% replacement of the cement by weight with ground granulated blast furnace slag. The material properties development was modeled using degree of hydration dependent functions. These properties include the adiabatic temperature rise, activation energy, and thermal conductivity. A two-term exponential function was proposed to better capture the hydration behavior of the cement and GGBFS binder which exhibits two peaks in the heat generation rate. The effects of the wind and sun were considered through the thermal convection coefficient and solar radiation as boundary conditions. ABAQUS program was used to predict the temperature time-history of three 1.2-m (4-ft) concrete cubes using user subroutines. The FEM model was compared to thermal loggers installed at critical locations in 1.2-m (4-ft) cubes, and the FEM simulations matched well with the experimental temperature measurement. The two-term degree of hydration was shown to better capture the early age and later-age behavior of concrete containing GGBFS. This improvement increased the accuracy of the maximum temperature and temperature difference prediction for concrete containing GGBFS. Results show that using the measurements of the thermal properties and the methods proposed in this study, an accurate estimation of the temperature difference can be achieved for a concrete mix containing GGBFS replacement. It was found that the adiabatic temperature of the delivered concrete should be measured for a more accurate estimation of the maximum temperature and temperature difference. Furthermore, the estimation of the temperature difference can enable engineers to take preventative actions to minimize the risk of thermal cracking.
Author Contributions
Conceptualization, G.L. and H.-L.C.; Formal analysis, G.L.; Funding acquisition, H.-L.C.; Investigation, G.L.; Methodology, H.-L.C.; Software, G.L.; Supervision, H.-L.C.; Validation, G.L. and H.-L.C.; Writing—original draft, G.L.; Writing—review and editing, H.-L.C. All authors have read and agreed to the published version of the manuscript.
Funding
This work was supported by the West Virginia Department of Transportation Research Project RP#312.
Data Availability Statement
The data that support the findings of this study are available from the corresponding author upon reasonable request.
Acknowledgments
The authors acknowledge the support provided by the West Virginia Transportation Division of Highways (WVDOH) and FHWA for Research Project WVDOH RP#312. Special thanks are extended to our project monitors, Mike Mance, Donald Williams, and Ryan Arnold of WVDOH. The authors thank Seyednavid Mardmomen for his help in the isothermal testing. The authors also appreciate the assistance from Yun Lin, Alper Yikici and Zhanxiao Ma.
Conflicts of Interest
The authors declare that they have no conflict of interest.
References
- Riding, K.A.; Poole, J.L.; Schindler, A.K.; Juenger, M.C.; Folliard, K.J. Evaluation of Temperature Prediction Methods for Mass Concrete Members. ACI Mater. J. 2006, 103, 357–365. [Google Scholar] [CrossRef]
- Amin, M.N.; Kim, J.-S.; Lee, Y.; Kim, J.-K. Simulation of the thermal stress in mass concrete using a thermal stress measuring device. Cem. Concr. Res. 2009, 39, 154–164. [Google Scholar] [CrossRef]
- Ballim, Y. A numerical model and associated calorimeter for predicting temperature profiles in mass concrete. Cem. Concr. Compos. 2004, 26, 695–703. [Google Scholar] [CrossRef]
- Bobko, C.P.; Seracino, R.; Zia, P.; Edwards, A. Crack Free Mass Concrete Footings on Bridges in Coastal Environments. Master’s Thesis, North Carolina State University, Raleigh, NC, USA, 2013. [Google Scholar]
- De Borst, R.; Boogaard, A.H.V.D. Finite-Element Modeling of Deformation and Cracking in Early-Age Concrete. J. Eng. Mech. 1994, 120, 2519–2534. [Google Scholar] [CrossRef]
- Do, T.A. Influence of Footing Dimensions on Early-Age Temperature Development and Cracking in Concrete Footings. J. Bridg. Eng. 2015, 20, 06014007. [Google Scholar] [CrossRef]
- Do, T.; Chen, H.; Leon, G.; Nguyen, T. A combined finite difference and finite element model for temperature and stress predictions of cast-in-place cap beam on precast columns. Constr. Build. Mater. 2019, 217, 172–184. [Google Scholar] [CrossRef]
- Lawrence, A.M.; Tia, M.; Ferraro, C.C.; Bergin, M. Effect of Early Age Strength on Cracking in Mass Concrete Containing Different Supplementary Cementitious Materials: Experimental and Finite-Element Investigation. J. Mater. Civ. Eng. 2012, 24, 362–372. [Google Scholar] [CrossRef]
- Lin, Y.; Chen, H.-L. Thermal analysis and adiabatic calorimetry for early-age concrete members. J. Therm. Anal. Calorim. 2015, 122, 937–945. [Google Scholar] [CrossRef]
- Saeed, M.K.; Rahman, M.K.; Baluch, M.H. Early age thermal cracking of mass concrete blocks with Portland cement and ground granulated blast-furnace slag. Mag. Concr. Res. 2016, 68, 1–17. [Google Scholar] [CrossRef]
- Sargam, Y.; Faytarouni, M.; Riding, K.; Wang, K.; Jahren, C.; Shen, J. Predicting thermal performance of a mass concrete foundation—A field monitoring case study. Case Stud. Constr. Mater. 2019, 11, e00289. [Google Scholar] [CrossRef]
- Wang, X.-Y.; Cho, H.-K.; Lee, H.-S. Prediction of temperature distribution in concrete incorporating fly ash or slag using a hydration model. Compos. Part B Eng. 2011, 42, 27–40. [Google Scholar] [CrossRef]
- Wu, S.; Huang, D.; Lin, F.-B.; Zhao, H.; Wang, P. Estimation of cracking risk of concrete at early age based on thermal stress analysis. J. Therm. Anal. Calorim. 2011, 105, 171–186. [Google Scholar] [CrossRef]
- Wang, X.Y.; Lee, H.S. Prediction of compressive strength of slag concrete using a blended cement hydration model. Comput. Concr. 2014, 14, 247–262. [Google Scholar] [CrossRef]
- Yikici, T.A.; Chen, H.L. Numerical Prediction Model for Temperature Development in Mass Concrete Structures. J. Transp. Res. Board 2015, 2508, 102–110. [Google Scholar] [CrossRef]
- Klemczak, B.; Batog, M.; Giergiczny, Z.; Żmij, A. Complex Effect of Concrete Composition on the Thermo-Mechanical Behaviour of Mass Concrete. Materials 2018, 11, 2207. [Google Scholar] [CrossRef] [PubMed]
- Moon, H.; Ramanathan, S.; Suraneni, P.; Shon, C.-S.; Lee, C.-J.; Chung, C.-W. Revisiting the Effect of Slag in Reducing Heat of Hydration in Concrete in Comparison to Other Supplementary Cementitious Materials. Materials 2018, 11, 1847. [Google Scholar] [CrossRef] [PubMed]
- De Schutter, G. Applicability of degree of hydration concept and maturity method for thermo-visco-elastic behaviour of early age concrete. Cem. Concr. Compos. 2004, 26, 437–443. [Google Scholar] [CrossRef]
- Freiesleben, H.P.; Pedersen, E.J. Måleinstrument til kontrol af betons haerdning. J. Nord. Concr. 1977, 1, 21–25. [Google Scholar]
- Poole, J.L.; Riding, K.A.; Folliard, K.J.; Juenger, M.C.G.; Schindler, A.K. Methods for Calculating Activation Energy for Portland Cement. ACI Mater. J. 2007, 104, 303–311. [Google Scholar]
- Robbins, M.E. Predicting the Early Age Temperature Response of Concrete Using Isothermal Calorimetry. Master Thesis, University of Toronto, Toronto, ON, Canada, 2007. [Google Scholar]
- Heat of Hydration Models for Cementitious Materials. ACI Mater. J. 2005, 102, 24–33. [CrossRef]
- Bougara, A.; Lynsdale, C.; Milestone, N. Reactivity and performance of blast furnace slags of differing origin. Cem. Concr. Compos. 2010, 32, 319–324. [Google Scholar] [CrossRef]
- Gruyaert, E.; Robeyst, N.; De Belie, N. Study of the hydration of Portland cement blended with blast-furnace slag by calorimetry and thermogravimetry. J. Therm. Anal. Calorim. 2010, 102, 941–951. [Google Scholar] [CrossRef]
- Woo, H.-M.; Kim, C.-Y.; Yeon, J.H. Heat of hydration and mechanical properties of mass concrete with high-volume GGBFS replacements. J. Therm. Anal. Calorim. 2018, 132, 599–609. [Google Scholar] [CrossRef]
- Mills, R.H. Factors Influencing Cessation of Hydration in Water Cured Cement Pastes, Highway Research Board Special Report. 1966. Available online: https://trid.trb.org/view/101449 (accessed on 2 August 2019).
- Maekawa, K.; Ishida, T.; Kishi, T. Multi-Scale Modeling of Structural Concrete; Routledge: London, UK, 2008. [Google Scholar]
- Van Breugel, K. Prediction of temperature development in hardening concrete. In Prevention of Thermal Cracking in Concrete at Early Ages; CRC Press: Boca Raton, FL, USA, 1998; Volume 51, pp. 51–75. [Google Scholar]
- Chen, H.-L.R.; Mardmomen, S.; Leon, G. On-site measurement of heat of hydration of delivered mass concrete. Constr. Build. Mater. 2021, 269, 121246. [Google Scholar] [CrossRef]
- Krishnaiah, S.; Singh, D. Determination of thermal properties of some supplementary cementing materials used in cement and concrete. Constr. Build. Mater. 2006, 20, 193–198. [Google Scholar] [CrossRef]
- Aloia, L.D. Early Age Kinetics: Activation Energy, Maturity and Equivalent Age. In Early Age Cracking in Cementitious System-Report of RILEM Technical Committe 181-EAS—Early Age Shrinkage Induced Stress and Cracking in Cementitious Systems; RILEM Publications SARL: Paris, France, 2003; pp. 127–148. Available online: https://www.rilem.net/publication/publication/89?id_papier=56 (accessed on 28 May 2020).
- Xu, Q.; Ruiz, J.M.; Hu, J.; Wang, K.; Rasmussen, R.O. Modeling hydration properties and temperature developments of early-age concrete pavement using calorimetry tests. Thermochim. Acta 2011, 512, 76–85. [Google Scholar] [CrossRef]
- Kim, J.K.; Han, S.H.; Lee, K.M. Estimation of compressive strength by a new apparent activation energy function. Cem. Concr. Res. 2001, 31, 217–225. [Google Scholar] [CrossRef]
- Kada-Benameur, H.; Wirquin, E.; Duthoit, B. Determination of apparent activation energy of concrete by isothermal calorimetry. Cem. Concr. Res. 2000, 30, 301–305. [Google Scholar] [CrossRef]
- Riding, K.A.; Poole, J.L.; Folliard, K.J.; Juenger, M.C.; Schindler, A.K. New Model for Estimating Apparent Activation Energy of Cementitious Systems. ACI Mater. J. 2011, 108, 550–557. [Google Scholar] [CrossRef]
- Brooks, A.G.; Schindler, A.K.; Barnes, R.W. Maturity Method Evaluated for Various Cementitious Materials. J. Mater. Civ. Eng. 2007, 19, 1017–1025. [Google Scholar] [CrossRef]
- Riding, K.A.; Poole, J.L.; Schindler, A.K.; Juenger, M.C.G.; Folliard, K.J. Statistical Determination of Cracking Probability for Mass Concrete. J. Mater. Civ. Eng. 2014, 26, 04014058. [Google Scholar] [CrossRef]
- US Army Corps of Engineers. Method of Test for Thermal Diffusivity of Concrete. 1973. Available online: https://www.wbdg.org/ffc/army-coe/standards/crd-c36 (accessed on 2 August 2019).
- Ge, Z. Predicting Temperature and Strength Development of the Field Concrete. Ph.D. Thesis, Iowa State University, Ames, IA, USA, 2005. [Google Scholar]
- Schindler, A.K. Concrete Hydration, Temperature Development and Setting at Early-Ages. Ph.D. Thesis, The University of Texas, Austin, TX, USA, 2002. [Google Scholar]
- Henninger, J.H. Solar Absorptance and Thermal Emittance of Some Common Spacecraft Thermal Control Coatings; NASA: Greenbelt, MD, USA, 1984.
Publisher’s Note: MDPI stays neutral with regard to jurisdictional claims in published maps and institutional affiliations. |
© 2021 by the authors. Licensee MDPI, Basel, Switzerland. This article is an open access article distributed under the terms and conditions of the Creative Commons Attribution (CC BY) license (http://creativecommons.org/licenses/by/4.0/).