Abstract
Alkali-activated materials have the potential to replace Portland cement in certain applications. To better understand these binders’ properties, it is relevant to study their rheological behaviour at early ages, like in the case of Portland cement paste. There are already many studies on the rheological behaviour of these materials in the available literature, using fly ash, metakaolin, and ground granulated blast furnace slag as precursors. However, this study discusses the rheological behaviour, mechanical properties, and porosity of ternary alkali-activated binders based on mining mud waste, waste glass, and metakaolin. The precursor consisted of a volume mix of 70% of tungsten mining waste mud, 15% glass waste, and 15% of metakaolin. The activator was a combination of sodium hydroxide and sodium silicate solution. Five activator/precursor (A/P) ratios (0.37, 0.38, 0.39, 0.40, and 0.4) were studied. The result showed that the activator/precursor ratio affects the rheology of paste and their rheological behaviour fit the Bingham model. The relative yield stress (g) and plastic viscosity (h) increased inversely with the A/P ratio, while the workability increased proportionally. Furthermore, some empirical models are proposed to describe the characteristic of yield stress: plastic viscosity and spread diameter versus the A/P ratio and time with a correlation between the rheological parameters and the spread diameter. The increase in A/P ratio has also followed a decrease in compressive strength in all tested samples for all the ages. As expected, an increase of the porosity accompanied the increase of the A/P ratio.
1. Introduction
Nowadays, the protection of the environment is the greatest challenge facing the building industry [1]. Indeed, 6% to 8% is the percentage of CO2 greenhouse gas emissions caused by Portland cement production [2]. In the European Union (EU), 63% of the total waste produced was mineral waste. The construction sector was responsible for about 33% of the total waste caused by economics activities (821 million tonnes in 2018). In parallel, the quantity of other hazardous solid waste is the major problem facing Europe in the last years. The increase of disquiet about waste disposal’s environmental consequences leads to renewing surveys on new uses or possibilities for reuse of these materials [3]. According to recent data from Eurostat [4], about 55 percent of the total industrial waste is generated by these activities. Other wastes and various ways for their reuse were explored in the literature. According to Sedira et al. [5], especially for alkali-activation, many mine tailings were used as precursors. Tungsten mining mud waste [6], iron ore tailing [7], copper mine tailings [8], chromite ore processing residues [9], and vanadium tailings [10] were studied. As all solid wastes, environmental risks can be caused by tungsten tailing generated from tungsten mine, like soil contamination, water pollution, and air in the surrounding areas [11]. There is a possibility of adverse effects on humans’ health caused by the solubility of tungsten and some of its compounds [12]. However, such tailing may contain some aluminosilicate minerals that can be used as a precursor for alkali-activation. For example, the mineralogy of mud waste from Panasqueira was mainly quartz and muscovite [13]. An alkali-activated material using mud waste from Panasqueira was obtained by Pacheco-Torgal et al. [14] mixed with calcium hydroxide, NaOH, and water glass solutions.
To increase the total amorphous SiO2 content, Kastiukas et al. [15] substituted 20% of tungsten mining waste with glass waste powder, which prevents calcination of mining mud waste. These studies proved the possible use of mining wastes as an alternative precursor, to form a material with good performance in terms of mechanical properties. However, the workability of such alkaline-activated mixtures remains challenging to control or predict. Indeed, the high viscosity of alkaline activators used to produce the alkali-activated mixtures affects its workability [16], which requires effective methods to improve such property. According to Alonso et al. [17], the type and content of precursors and activators impact the alkali-activated system’s rheology. Puertas et al. [18] observed that ordinary Portland cement (OPC) and alkali-activated fly ash paste have lower initial fluidity than that alkali-activated slag pastes. The use of admixture to prepare OPC concretes has often been unstable at high alkalinity, prevailing in alkali-activated systems [19]. Therefore, when using typical chemical additives, the workability of alkali-activated products could not be increased. Alternative methods were discussed too, such as creating new superplasticisers and rheological regulation by physical effects.
To better understand the alkali-activated materials’ behaviour (noted AAM), rheological properties have to be detailed. Let us note that rheology is the analysis of matter (deformation) on the hardness or the fresh state. It stresses that it flows with the relationships between strain, stress, strain rate, and time [20].
In OPC, to determine the rheological properties, generally we use a rheometer. A similar technique will be used to understand the processes occurring during the alkali-activation of precursor, consisting of material dissolution and condensation under a polymer form. Rheological checks consist of the sensitivity of the paste to shear stress at known shear rates. Also, many models were developed to describe the rheological behaviour of pastes, such as the Bingham model [20] given by Equation (1):
where, τ: the shear stress (Pa), τ0: the yield stress (Pa), μ: the plastic viscosity (Pa·s), and γ: the shear strain rate (s−1). These rheological parameters can be obtained in a relative and satisfactory degree of accuracy by testing pastes and mortars samples in a coaxial cylinder viscometer. The flow curve can be plotted from the viscometer data in the form of torque, T, against rotational speed, N, and expressed according to Equation (2):
where g and h are the constant characteristics of the material. The comparison of Equations (1) and (2) suggests, in principle, that g is related to the relative yield stress and h is associated with the relative plastic viscosity [21,22].
τ = τ0 + μγ
T = g + hN
Other models, such as the Ostwald de Waele and the Herschel–Bulkley models of equations given by Equations (3) and (4), may be used to evaluate the rheological activity of cement paste in particular:
where k: the consistency coefficient (Pa·sn) and n: the dimensionless fluidity index. Parallel to the numerous studies on cement pastes’ rheology, some studies exist on the alkali-activated materials’ rheology. Concerning the rheological models, the rheological behaviour of activated fly ash could be fitted with the Bingham model by Palomo et al. [23].
τ = kγn
τ = τ0 + kγn
Puertas et al. [18] contrasted the rheological parameters of OPC and AAM paste with various concentrations of alkali solutions. Some process parameters, such as the type and concentration of alkali solution, have been documented to have influenced AAM’s rheological properties. In comparison, the water-glass-activated slag was best suited to the Herschel–Bulkley model, while the paste activated with NaOH or combined with Na2CO3 acted like the Bingham model [18]. On the other hand, Torres-Carrasco et al. [24] showed that when the activator was a commercial water glass solution of NaOH/Na2CO3 combined with waste glass, the rheological behaviour of alkali-activated slag pastes was near the Herschel–Bulkley model. In other investigation, Palacios et al. [25] confirmed that the rheological curves obtained on water glass-activated slag presented a better fit with the Herschel–Bulkley model. Also, Sitarz et al. [26] investigated fresh state rheological properties of blended Fly Ash (FA) with Ground Granulated Blast Furnace Slag (GGBFS) geopolymer mortars. Their study aimed to obtain flow curves and to establish the correlation between shear stress and shear rate. They concluded that the geopolymer mortars’ rheological behaviour is similar to that of a pseudoplastic liquid representing shear thinning behaviour—roughly following the Herschel–Bulkley model.
Recently, the authors of Reference [27] showed that the type of alkali cation considerably affects the chloride binding behaviours of metakaolin-fly ash geopolymers and the sodium activator results in a higher strength development, stronger chloride binding capacity, and better resistance to chloride penetration compared to potassium. Also, the authors of Reference [28] found that hardened alkali-activated slag paste has an approximately 70–150% stronger chloride binding capacity than ordinary Portland cement (OPC) pastes.
The purpose of this paper is to contribute to a better understanding of the rheological behaviour of an alkali-activated material, made of several precursors, consisting of mining mud waste, waste glass, and metakaolin. The study aims to understand the effect of activator/precursor ratio on the rheology, mechanical properties, and porosity. To reach this goal, this paper presents experimental results of rheological parameters, flow table test, compressive strength at 7, 14, and 28 days, and porosity.
2. Materials and Experimental Methods
2.1. Materials
2.1.1. Precursors
Tungsten mining mud waste (TMMW), glass waste (GW), and metakaolin (MK) were the components used in this study.
The TMMW was obtained from the mud waste deposits of the Panasqueira mine and was first dried in the oven for 24 h at 100 °C. Then, a milling system was used for 7 h to get more refined and more reactive powders. The mud was mechanically disaggregated, accompanied by sieving to obtain particles of sizes under 500 μm.
The glass waste was obtained from the collection of glass bottles. The material was ground and sieved after washing and drying, to pass through a 250 μm sieve. Metakaolin (MK) was supplied by Badische Anilin & Soda Fabrik (BASF) company and referred to as “MASTERLIFE Mk”.
TMMW, GW, and MK specific gravity values were determined using a gas displacement pycnometer (AccuPyc1340, Micromeritics, Norcross, GA, USA) and were 3.10, 2.49, and 2.50 g/cm3, respectively.
The Blaine fineness of the powders used in this study was determined by using Acmel Labo BSA1 semi-automatic Blaine apparatus according to European Standard EN 196-6 standard. The obtained values were 742, 2665, and 4467 cm2/g, respectively (which corresponded to the average value of three tests for each material).
Table 1 presents the chemical compositions of the GW, MK, and TMMW components that were determined by a Bruker Xflash 5010 Energy Dispersive X-ray Spectrometer. The results were determined in another study, in which several separate locations were randomly chosen for each sample for the chemical composition of the raw materials [29].

Table 1.
Chemical composition of tungsten mining mud waste (TMMW), glass waste (GW), and metakaolin (MK) in wt%.
Grain size distributions of the retained fractions of GW, MK, and TMMW were calculated using both the sieving process and sedimentation test used to test soils in compliance with BS1377 part 2 (1990) of the British Standards. The particle size distribution on Figure 1 showed that 90% of metakaolin was less than 0.01 mm and just 50% of waste glass was less than 0.01 mm. However, only 13% of the tungsten mining mud waste was less than 0.01 mm. This result corresponds with Blaine fineness result of those materials.
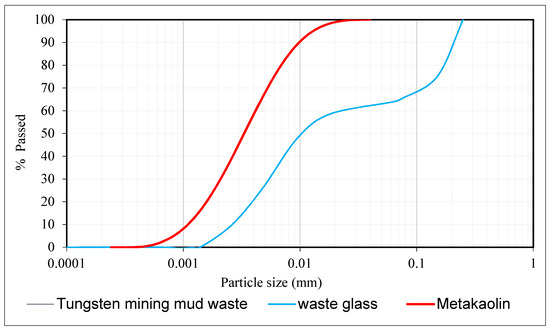
Figure 1.
Particle size distribution of TMWM, WG and MK.
2.1.2. Alkaline Activator Solution
The activator was a mix of sodium hydroxide NaOH (noted SH) and sodium silicate Na2SiO3 (noted SS). A sodium hydroxide solution at 10 M was prepared by dissolving sodium hydroxide pellets (98% purity obtained from Fisher Scientific, Schwerte, Germany) in deionised water. It required to be cooled before use. The sodium silicate solution Na2SiO3 was obtained from Solvay SA Póvoa de Santa Iria in Portugal. It was a commercial solution with the characteristics given in Table 2 that presents the chemical composition in weight (g) and the density of activators and their mixture. The NaOH and Na2SiO3 solutions were mixed with a ratio Na2SiO3/NaOH equal to 4 for 3 to 5 min to form the final activator solution.

Table 2.
Chemical composition (%) and density of sodium hydroxide (SH) and sodium silicate (SS) in (g/cm3).
2.2. Experimental Methods
2.2.1. Preparation of the Paste
The alkali-activated (AA) paste was a mix of 70% TMMW, 15% GW, and 15% MK powder precursors. After dry-mixing for 5 min to obtain the powders’ homogeneity, the activator solution containing a NaOH and Na2SiO3 mixture was added. The paste was stirred for 2.5 min at 200 rpm, followed by 2.5 min at 400 rpm at 20 °C. The activator to precursor ratio (noted A/P) varied from one preparation to another. The A/P ratios were chosen equal to 0.37, 0.38, 0.39, 0.40, and 0.41, respectively. The first A/P ratio was fixed to 0.37 because lower values (i.e., 0.36, 0.35, 0.34, 0.33, and 0.32) of the rheological measurements were not possible due to the high viscosity of the mix. The maximum A/P value equal to 0.41 was chosen because a higher A/P ratio resulted in a drop of the compressive strength.
2.2.2. Rheological Measurement
A Viskomat NT rheometer supplied by Schleibinger Measuring Systems was used in this research. This apparatus calculates a range of torque (T) and rotational speed (N) data points automatically. T and N are connected by the straight line for a Bingham material, conforming to Equation (2). G (the intercept) in this equation is proportional to the relative yield stress, and h (the gradient) is proportional to the relative plastic viscosity of the materials [21].
The calculation begins directly after mixing the paste and puts it in the rheometer cup. If the cylindrical sample jar rotates in the rheometer, the paste passes through the impeller’s blades and exerts a torque determined by the transducer. The speed of rotation of the container was set to change over time as the ramp’s speed profile.
The measurement starts immediately after mixing the paste and putting it in the rheometer cup. As the cylindrical sample container rotates in the rheometer, the paste flows through the impeller’s blades and exerts a torque measured by a transducer. The rotation speed of the container was set to vary with time as a ramp speed profile. The rotational speed was modified to shift over time in the sequential ramp profile (Figure 2). The procedure consisted of pre-shearing at 100 rpm for 2 min followed by ramping up from 0 to 10 rpm in 1 min and from 10 to 100 rpm in 1 min, and then ramping down from 100 to 50 rpm in 1 min and from 50 to 0 rpm in 1 min [30]. This cycle was repeated six times, with 5 min pauses in between cycles This speed profile was used to assess plastic viscosity and yield stress-related coefficients (h and g, respectively).
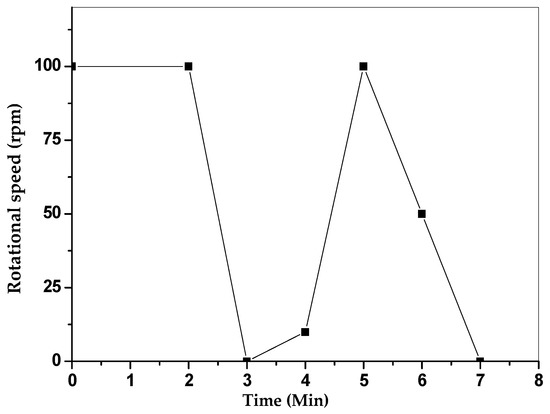
Figure 2.
Ramp speed time profile for Viskomat NT rheometer.
2.2.3. The Flow Table Test
The paste fluidity was evaluated by a standard flow table test, following EN 1015-3 [31], where the spread diameter was measured, in mm, on the samples let stand for 7, 16, 25, 34, and 52 min after mixing. The spread diameter value, in mm, is the average of paste measurements in two directions at right angles to one another using callipers. This measurement is performed after jolting the flow table 15 times with paste sample moulded on the flow table disc centre.
2.2.4. Mercury Intrusion Porosimetry Test
The most common tool used to define pore and size distribution is mercury intrusion porosimetry (MIP). MIP is based on the capillary law that rules the penetration of mercury into small pores. The Washburn Equation (Equation (5)) expresses this law in a non-wetting liquid such as mercury:
where Vt is the total pore volume, St is the total capillary pore surface, and D is the average pore diameter. A Micromeritics Auto Pore IV 9500 V1.07 mercury porosimeter was used to determine the minimum pore diameter of 0.005 mm. The sample tested weight varied between 1.5 and 2.2 g.
D = 4Vt/St
2.2.5. Compressive Strength Test
By the EN 196-1 standard, compressive strength tests were carried out using the 3000 KN electro-hydraulic mechanical testing machine ADR Touch 3000 BS EN Compression Machine with digital reading and self-centring plates. From a test of five 40 mm cubic specimens, the compressive strength value was calculated.
3. Results and Discussion
Figure 3 shows the torque variations over the time of AA pastes at constant rotational speed (100 rpm) for different A/P ratios (0.37, 0.38, 0.39, 0.40, and 0.41). The torque T decreased for each AA paste. For A/P equal to = 0.37, 0.38, 0.39, 0.40, and 0.41, the initial torque was around 180, 170, 152, 140, and 115 N·mm, respectively. Then, the torque values declined slightly over time, and by the end of the test, they returned close to the initial values. This reduction in T is due to the originally developed rupture of the flocs, while its subsequent increase is due to creating new reaction products [19].
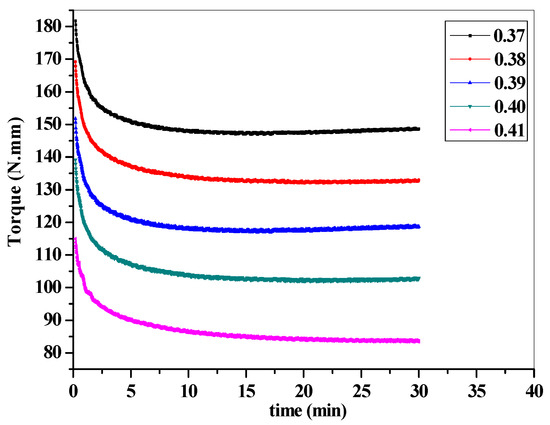
Figure 3.
Torque versus time.
Figure 4 demonstrates the difference in torque versus the rotational speed for AA pastes with varying A/P ratios. For very low rotational speeds (such as the speed progression up to 20 rpm), the variation of the magnitude of the torque is small and the device was not able register it. Above that, all the checked pastes behaved in line with the Bingham model (Equation (1)). It can be seen from the modelling of the values obtained in Figure 4 that the torque decreases as the A/P ratio increases, e.g., it needed around 97 N·mm in the paste with A/P = 0.41. In comparison, the mix of A/P = 0.37 required the maximum torque of 171 N·mm. Indeed, the shear stress to split the interparticle forces was lower when the paste was very fluid than when the paste provided a higher viscosity paste. These results do not agree with Puertas et al. [18]. Their study on the activation of very reactive slag concluded that the rheological behaviour of AA pastes activated with NaOH and water glass (50/50 wt%) fit the Herschel–Bulkley model. They concluded that AA pastes activated with water glass fit this model, while AA pastes activated only with NaOH fit the Bingham model. The different behaviour found in this study can be explained as follows. Although the activator solution was made of 20/80 wt% of NaOH/Na2SiO3 (also containing water glass), a much lower content of highly reactive precursor was used, leading to more fluid and less viscous pastes.
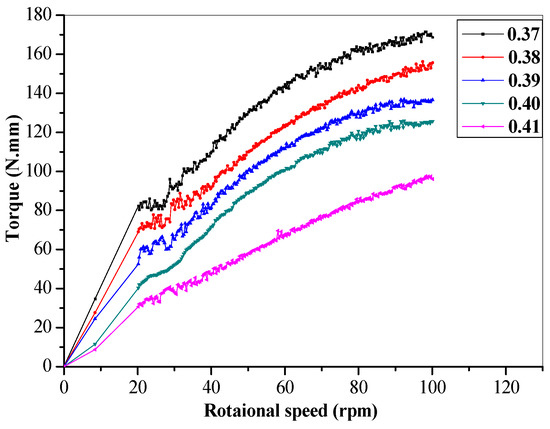
Figure 4.
Torque versus rotational speed.
In this study, pastes were made of 15 wt% metakaolin, 15 wt% of waste glass, and 70 wt% of mining mud waste, of which the metakaolin is the most reactive, due to the tiny size of its particles—followed by waste glass (particle size is between 0 and 250 µm) and mining mud waste (particle size is between 0 and 500 µm). Besides, mining mud waste does not have a fully amorphous structure [32,33]. Mining mud waste is much less reactive than waste glass and metakaolin. Thus, in this study, the rheology was not mainly affected by the alkaline activator’s nature but by the characteristics, granular skeleton and reactivity of precursor materials, which affected the rheological behaviour, which is the reason why it fits the Bingham model.
The activator concentration was also held stable in this analysis, and the A/P ratios ranged from 0.37 to 0.41 to cover rheological activity between high and low consistency.
The relative yield stress, g, and the relative plastic viscosity, h, were graphically determined from torque versus rotational speed curve, where the intercept is proportional to yield stress, and the gradient is proportional to plastic viscosity.
3.1. Evaluation of Yield Stress
Figure 5 indicates the change in relative yield stress, g, versus time. The relative yield stress of all mixtures increased with time, which could be clarified by beginning the formulation of Calcium aluminosilicate hydrate C-A-S-H or Sodium aluminosilicate hydrate (N-A-S-H) gel, taking into account the presence of Ca cation in the waste glass during this alkali-activation [32]. The paste is getting more and more viscous, e.g., 84.2 N·mm was the value of yield stress with a ratio of 0.37 A/P in the first 7 min, but after 52 min, it was near 98.4 N·mm. On the contrary, the relative yield stress decreases with the rise in the A/P ratios. This is due to the reduced number of direct particle interactions and the increased thickness of the lubricating layer around the solid particles in the higher water-containing specimens, making it easier for them to slip past each other during the shearing process. When A/P ratio was equal to 0.37, the value of yield stress was near 98.4 N·mm after 52 min and was near 40.1 N·mm after the same time as when the A/P ratio was equal to 0.41. These results concur the results obtained by References [18,34,35].
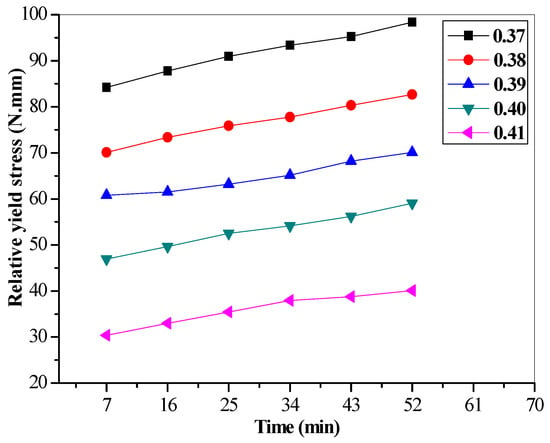
Figure 5.
Relative yield stress versus time.
In Figure 5, it is observed that the yield stress results are aligned in a linear trend that represents on average 99% of the cases. In this way, it becomes interesting from a practical point of view to obtain an empirical model that from the experimental data will simultaneously express the influence of the variable A/P ratio and time. A multiple linear regression model presented by Equation (6) allows to predict, in more than 99% of cases, yield stress over time with different A/P ratios. Figure 6 shows this variation graphically.
Yield stress = 583.627 − 1350.506 × A/P + 0.254 × Time.
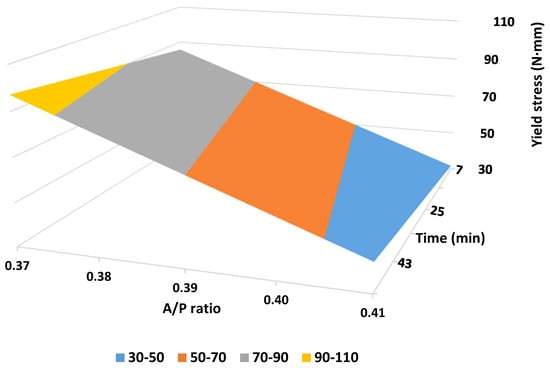
Figure 6.
Relative yield stress as a function of activator /precursor A/P ratio and time.
3.2. Evaluation of Relative Plastic Viscosity
Many factors affect the plastic viscosity, such as temperature, particle size, aggregate, and others. The interparticle forces and content of solid one of these factors. The empirical expression in Equation (7) proposed in Reference [36] can describe the relationship between the relative plastic viscosity, h, and the solid volume, Φ:
where h0: the solution viscosity, Φ: the actual solid volume fraction, and Φ max: the maximum solid volume fraction. Figure 7 presents the changes in plastic viscosity with time for all the A/P ratios. The A/P ratio on the relative plastic viscosity was observed, and found an increase of A/P ratio accompanied by a decrease of relative plastique viscosity. Also, the relative plastic viscosity increased proportionally with time. According to Equation (7), the plastic viscosity increases with the rise of the solid material, for example, after 52 min, it is clear that the plastic viscosity with A/P ratio equal to 0.38 is greater than the paste with a ratio of 0.40 (for A/P = 0.38, the plastic viscosity was near to 0.47 N·mm·min, and for A/P = 0.40, it was near to 0.40 N·mm·min). Figure 7 shows the relative plastic viscosity in the paste, which is more fluid, requiring higher shear stress to break the interparticle forces.
h = h0 (1 − (Φ/Φ max)) n
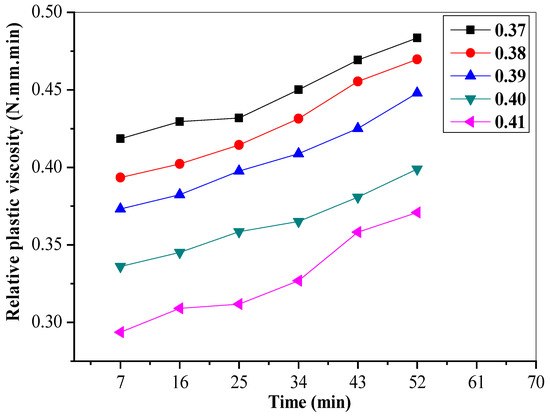
Figure 7.
Relative plastic viscosity versus time.
Applying the analysis of variance (ANOVA) to the results of relative plastic viscosity, one can find the forecast model described by Equation (8), which represents 99% of the cases. A graphical view of the variation of the plastic viscosity over time with the change of the A/P ratio is shown in Figure 8. Here, it is possible to easily observe the decrease in plastic viscosity with the increase in the A/P ratio and its growth over time.
Plastic viscosity = 1.522 − 3.010 × A/P + 0.0016 × Time.
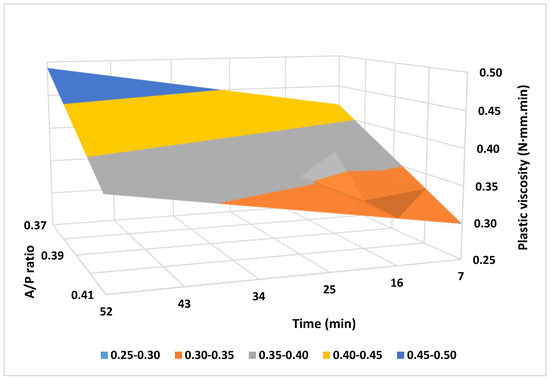
Figure 8.
Relative plastic viscosity as a function of A/P ratio and time.
3.3. The Flow Table Results
The difference between the spread diameter of pastes with a different A/P ratio versus time is seen in Figure 9. The reduction of the spread diameter over time could be seen, and it decreased as the A/P ratios increased. This diameter reduction was due to C-A-S-H and N-A-S-H formation, considering the presence of Ca in the waste glass. The spread diameter reduction is inversely proportional to the A/P ratio. It is observed that for an A/P ratio equal to 0.37, the drop between the time of 7 to 52 min is 17%, while for A/P equal to 0.41, this reduction is only 9%. It also results from the fact that by increasing A/P ratio, the interparticle forces between grains of paste decrease. Comparing the results obtained for relative plastic viscosity, in this paper, they were obviously similar to the results found in References [17,35].
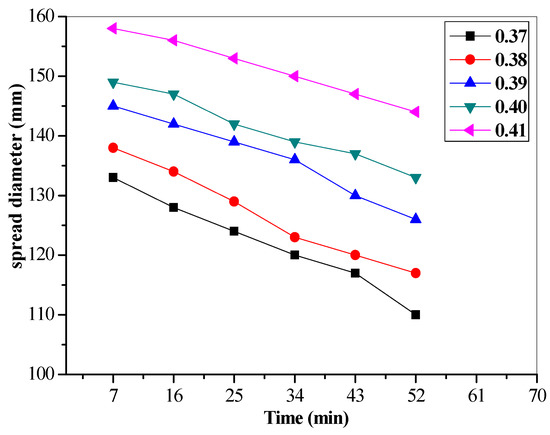
Figure 9.
Spread diameter versus time.
Equation (9) presents the empirical model for predicting the workability measured by the spread diameter over time, which represents 99% of the cases, depending on the A/P ratio. This multivariable correlation can be seen in Figure 10, where it is easy to see that the diameter is reduced over time and with the decrease in A/P ratio.
Spread diameter = −136.95 + 730.00 × A/P − 0.414 × Time.
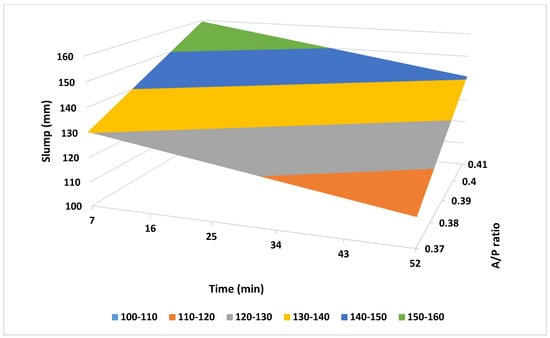
Figure 10.
Spread diameter as a function of A/P ratio and time.
Some authors [22,30] have studied the correlations between slump, flow table tests, and the cement-based mortars’ rheological parameters, observing some affinity in these workability evaluation methods. From a practical point of view, it is interesting to estimate the rheological parameters of mixtures through a quick and simple test such as the flow table. In this sense, Figure 11 shows a correlation between the flow table test results and the rheometer. There is a trend of proportional reduction in the rheological parameters’ values with the increase in the spread diameter. A higher correlation was found between the spread diameter and the plastic viscosity for the mixtures under study. More than 95% of the observed cases are represented by the equation presented in the area of Figure 11.
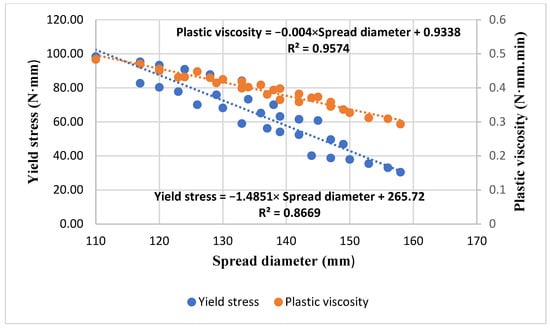
Figure 11.
Correlation of the spread diameter with rheological parameters.
The high correlation found between spread diameter and relative plastic viscosity can be attributed to the similarity actions that occur during the tests that determine the spread diameter and those that determine the relative plastic viscosity. The spreading diameter is obtained on the flow table after a successive dynamic impact over a predefined time. After each impact, the height of the paste pile decreases with spread. As the height decreases, the driver for spreading also decreases. Therefore, the incremental spread decreases with the number of drops. On the other hand, the plastic viscosity, characterized by the resistance of the paste to flow, is determined by a deformation sequence imposed on the paste by increasing the rotational speed on the rheometer, which requires a sequential increase in torque, i.e., force × distance. So, in both tests, results express a resistance to the paste continuous flow, whereas the yield stress represents only the minimum force that must be applied to those samples that start to flow.
3.4. Mercury Intrusion Porosimetry Test
Five alkali-activated pastes were tested with A/P equal to 0.37, 0.38, 0.39, 0.4, and 0.41, respectively. MIP results were obtained by measuring the mercury’s penetration volume inside the sample’s pores with the pressure-applied variation. MIP measurement allowed to determine the pore structure, such as the total porosity (accessible to mercury and considering the parameters of measures) and the pore size distribution.
These measures are to clarify the difference between the porosity and microstructure of all the AA pastes tested. Figure 12 and Figure 13 present the pore characteristics of samples after 28 days. For all the samples, the total porosity between 25% and 41% was relatively high, which can be explained by the high A/P ratios used for this study. Indeed, as the rheometer did not work with a ratio lower than 0.37, only the ratios higher than 0.37 were investigated. Also, the AA pastes’ implementation into moulds under their gravity (without compacting) could be responsible for the increase of the total porosity [37]. The total porosity increased proportionally with the increase of the A/P ratio (the liquid). Such results agreed with Portland cement pastes’ behaviour when water is added to cement/water mixture. Table 3 shows the total porosity of all mixes at 28 days.
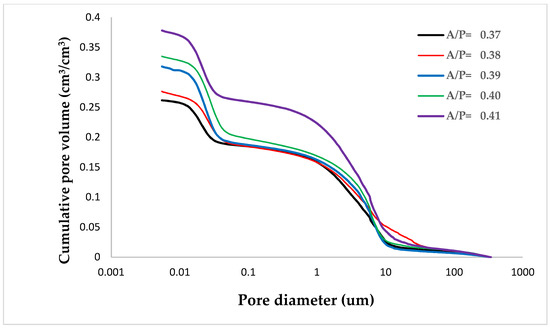
Figure 12.
The cumulative pore volume curve for specimens cured for 28 days.
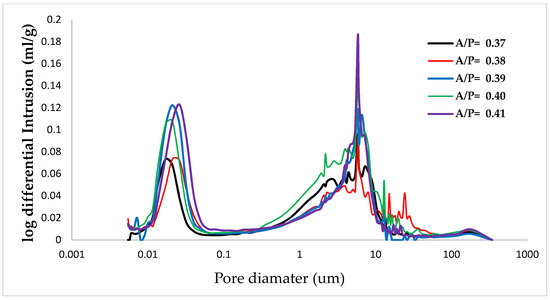
Figure 13.
The differential distribution curve for the specimens cured for 28 days.

Table 3.
Total porosity in Alkali-activated AA paste at 28 days.
According to the International Union of Pure and Applied Chemistry (IUPAC) scheme, there are four pore size ranges [34]. Pores in cementitious materials can be categorized as micropores (d < 2 nm), mesopores (2 nm < d < 50 nm), macropores (50 nm < d < 10 μm), and voids and microcracks (d > 10 μm). The hardened paste presented a bimodal behaviour with the presence of a double type of pores, mesopores between 0.01 and 0.1 μm, while the macro-pores are between 1 and 10 μm.
The average pore diameter of the samples decreased when the A/P ratios increased, whereas the sample A/P 0.37 had the value of 0.045 μm of the average pore diameter. This value increased to 0.060 μm for the sample A/P 0.41. The pastes average pore diameter values with A/P ratio equal to 0.38, 0.39, and 0.40, were 0.047, 0.051, and 0.054 μm, respectively.
3.5. Compressive Strength
Many factors can modify the compressive strength (Rc), such as liquid/solid ratio and the concentration of the activator. Figure 14 presents the compressive strength of alkali-activated hardened paste measured at 7, 14, and 28 days for the 0.37, 0.38, 0.39, 0.40, and 0.41 A/P ratios. Compressive strength results are an average of five tests. The standard deviation for each group of tests for a particular A/P ratio and curing time, varies from 0.59 to 1.52, as indicated in Table 4. In this figure, as expected, the curing time favoured the increase of Rc for each mixture. The compressive strength decreased with the increase of A/P ratios at 7, 14, and 28 days. The lowest value obtained at 7 days for A/P ratio equal to 0.41 was 12.5 MPa, and the highest value obtained for the same curing time for A/P = 0.37 was 20.7 MPa. While the decrease of A/P ratio favoured the cohesion increase between particles during the curing (hardening) time, the extra amount of liquid activator created pores. At 14 days, the increase of the compressive strength compared to the one at 7 days was greatly improved. The compressive strength for A/P = 0.38 after 7 days was 18.4 MPa and at 14 days was 22.1 MPa. At 28 days, the compressive strength was 29.2 MPa for A/P ratio = 0.37 and was 19.3 MPa for A/P ratio = 0.41, and for the A/P = 0.38, 0.39, and 0.40, the compressive strength was 26.7, 25.1, and 22.4 MPa, respectively. The increase in paste porosity explains these effects, which reflect a reduction in compressive strength of about 34% at 28 days from 0.37 to 0.41 A/P ratios. However, it also decreases due to an increase in the A/P effect on the cohesion between paste grains.
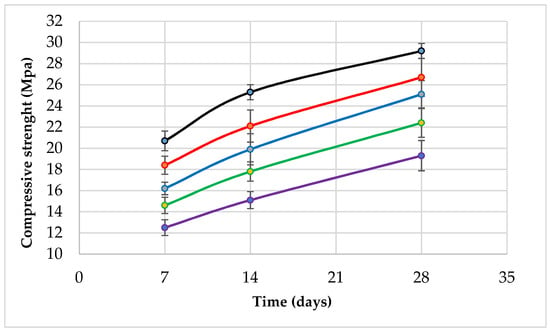
Figure 14.
Compressive strength versus time.

Table 4.
Compressive strength standard deviation.
4. Conclusions
This study focused on the effect of A/P ratio on the rheological behaviour, the mechanical properties, and the porosity of AA pastes based on tungsten mining mud waste, waste glass, and metakaolin.
The results obtained in this work confirm that the A/P ratio has an effect on rheology, compressive strength, and porosity of paste, which is confirmed by the following results:
- The rheological behaviour of all the AA pastes tested fit the Bingham model, and the rheological parameters (yield stress and plastic viscosity) were affected by the activator/precursor ratios. This rheological behaviour was similar to the OPC behaviour since both fit the Bingham model and are characterized as non-Newtonian fluid. Likewise, the A/P ratio had a similar effect to the water/cement ratio, that is, the decrease in the liquid portion in the mixtures increased the viscosity of the pastes, increased the compressive strength, and decreased the porosity.
- The relative yield stress and relative plastic viscosity increased proportionally with time, which was explained by the starting of C-A-S-H or N-A-S-H gel considering the presence of Ca cation in the waste glass during this alkali-activation, and they decreased inversely with the increase of the A/P ratio, which was explained by the relation between interparticle forces and A/P ratio (the interparticle forces in the viscous paste are higher than in the fluid paste), and also due to the solid content and the quantity of the liquid activator.
- Some empirical models to preview yield stress, plastic viscosity, and spread diameter were developed, considering the variables A/P ratio and time.
- The spread diameter in all the AA pastes affected by the A/P (an increase of spread diameter proportionally with A/P ratio) can be explained by the decrease of the cohesion between the grains in paste caused by the rise of liquid content. Furthermore, the reduction of spread diameter over time was caused by the processing of alkali-activation (formation of C-A-S-H or N-A-S-H gel).
- The flow table test appears to be a good method to evaluate the resistance to flow or the workability of AAM pastes.
- A proportional reduction in the rheological parameters’ values with the increase in the spread diameter can explain a higher correlation between the spread diameter and the plastic viscosity, with R2 near to 0.95, and a good correlation between spread diameter and yield stress, with R2 near to 0.86.
- The paste porosity was high in all the samples (25% with A/P ratio equal to 0.37 and 41% when A/P ratio was equal to 0.41), which was explained by the high A/P ratios used for this study. Indeed, the rheometer did do not work with a ratio lower than 0.37, and also due to the nature of mud waste that does not react completely.
- The compressive strength was modified by A/P ratio: a reduction of about 34% at 28 days for 0.37 to 0.41 A/P ratios was found.
Finally, the authors would like to stress that although there are already several studies on rheology, this field has primary practical importance for the broader application of AA materials. Consistency and workability are of significance for their ease of casting or placement, and the rheological properties have a strong influence on their microstructure.
Author Contributions
Conceptualization, A.B. and J.C.-G.; methodology, A.B.; writing—original draft preparation, A.B.; writing—review and editing, J.C.-G. and L.P.-d.-O. All authors have read and agreed to the published version of the manuscript.
Funding
The European Commission partially supported this research under Horizon 2020, Marie Skłodowska-Curie Actions, Research and Innovation Staff Exchange (RISE), and REMINE—project No. 645696, for Reuse of Mining Waste into Innovative Geopolymeric-based Structural Panels, Precast, Ready Mixes and in situ Applications (https://reminemsca.wordpress.com accessed on 13 January 2021). This work was also financed by Portuguese national funds through FCT (Foundation for Science and Technology), within the research unit C-MADE, Centre of Materials and Building Technologies (CIVE-Central Covilhã-4082), the University of Beira Interior, Portugal.
Institutional Review Board Statement
Not applicable.
Informed Consent Statement
Not applicable.
Data Availability Statement
Not applicable.
Conflicts of Interest
The authors declare no conflict of interest.
References
- European Parliament Council Directive 2013/59/Euratom of 5 December 2013 laying down basic safety standards for protection against the dangers arising from exposure to ionising radiation, and repealing Directives 89/618/Euratom, 90/641/Euratom, 96/29/Euratom, 97/43/Euratom a. Off. J. Eur. Commun. 2014, L13, 1–73.
- Bignozzi, M.C.; Manzi, S.; Natali, M.E.; Rickard, W.D.; van Riessen, A. Room temperature alkali activation of fly ash: The effect of Na 2 O/SiO 2 ratio. Constr. Build. Mater. 2014, 69, 262–270. [Google Scholar] [CrossRef]
- Hardjito, D.; Wallah, S.E.; Sumajouw, D.M.J. On the Development of Fly AshBased Geopolymer Concrete. ACI Mater. J. 2004, 101, 467–472. [Google Scholar]
- Blumenthal, K. Generation and treatment of municipal waste. Eurostat Stat. Focus Environ. 2011, 1–12. Available online: http://www.eds-destatis.de/en/downloads/sif/KS-SF-11-031-EN-N (accessed on 13 January 2021).
- Sedira, N.; Castro-Gomes, J.; Kastiukas, G.; Zhou, X.; Vargas, A. A review on mineral waste for chemical-activated binders: Mineralogical and chemical characteristics. Min. Sci. 2017, 24, 29–58. [Google Scholar]
- Pacheco-Torgal, F.; Castro-Gomes, J.; Jalali, S.; Castro-Gomes, J. Investigations of tungsten mine waste geopolymeric binder: Strength and microstructure. Constr. Build. Mater. 2008, 22, 2212–2219. [Google Scholar] [CrossRef]
- Duan, P.; Yan, C.; Zhou, W.; Ren, D. Fresh properties, compressive strength and microstructure of fly ash geopolymer paste blended with iron ore tailing under thermal cycle. Constr. Build. Mater. 2016, 118, 76–88. [Google Scholar] [CrossRef]
- Sun, T.; Chen, J.; Lei, X.; Zhou, C. Detoxification and immobilization of chromite ore processing residue with metakaolin-based geopolymer. J. Environ. Chem. Eng. 2014, 2, 304–309. [Google Scholar] [CrossRef]
- Huang, X.; Huang, T.; Li, S.; Muhammad, F.; Xu, G.; Zhao, Z.; Yu, L.; Yan, Y.; Li, D.; Jiao, B. Immobilization of chromite ore processing residue with alkali-activated blast furnace slag-based geopolymer. Ceram. Int. 2016, 42, 9538–9549. [Google Scholar] [CrossRef]
- Jiao, X.; Zhang, Y.; Chen, T. Thermal stability of a silica-rich vanadium tailing based geopolymer. Constr. Build. Mater. 2013, 38, 43–47. [Google Scholar] [CrossRef]
- Wilson, B.; Pyatt, F.B. Bio-availability of tungsten in the vicinity of an abandoned mine in the English Lake District and some potential health implications. Sci. Total Environ. 2006, 370, 401–408. [Google Scholar] [CrossRef]
- Kraus, T.; Schramel, P.; Schaller, K.H.; Zöbelein, P.; Weber, A.; Angerer, J. Exposure assessment in the hard metal manufacturing industry with special regard to tungsten and its compounds. Occup. Environ. Med. 2001, 58, 631–634. [Google Scholar] [CrossRef] [PubMed]
- Castro-Gomes, J.; Silva, A.P.; Cano, R.P.; Suarez, J.D.; Albuquerque, A. Potential for reuse of tungsten mining waste-rock in technical-artistic value added products. J. Clean. Prod. 2012, 25, 34–41. [Google Scholar] [CrossRef]
- Pacheco-Torgal, F.; Gomes, J.P.C.; Jalali, S. Tungsten mine waste geopolymeric binder: Preliminary hydration products investigations. Constr. Build. Mater. 2009, 23, 200–209. [Google Scholar] [CrossRef]
- Kastiukas, G.; Zhou, X.; Castro-Gomes, J. Development and optimisation of phase change material-impregnated lightweight aggregates for geopolymer composites made from aluminosilicate rich mud and milled glass powder. Constr. Build. Mater. 2016, 110, 201–210. [Google Scholar] [CrossRef]
- Yang, T.; Zhu, H.; Zhang, Z.; Gao, X.; Zhang, C.; Wu, Q. Effect of fly ash microsphere on the rheology and microstructure of alkali-activated fly ash/slag pastes. Cem. Concr. Res. 2018, 109, 198–207. [Google Scholar] [CrossRef]
- Alonso, M.; Gismera, S.; Blanco, M.; Lanzón, M.; Puertas, F. Alkali-activated mortars: Workability and rheological behaviour. Constr. Build. Mater. 2017, 145, 576–587. [Google Scholar] [CrossRef]
- Puertas, F.; Varga, C.; Alonso, M. Rheology of alkali-activated slag pastes. Effect of the nature and concentration of the activating solution. Cem. Concr. Compos. 2014, 53, 279–288. [Google Scholar] [CrossRef]
- Puertas, F.; Palacios, M. Estabilidad de aditivos superplastificantes y reductores de la retracción en medios fuertemente básicos. Mater. Constr. 2004, 54, 65–86. [Google Scholar] [CrossRef]
- Banfill, P.F.G. The Rheology of Fresh Concrete. 2003. Available online: https://books.google.pt/books?id=fa1RAAAAMAAJ (accessed on 13 January 2021).
- Banfill, P. Rheological methods for assessing the flow properties of mortar and related materials. Constr. Build. Mater. 1994, 8, 43–50. [Google Scholar] [CrossRef]
- Palomo, A.; Banfill, P.F.G.; Fernández-Jiménez, A.; Swift, D.S. The influence of wastes materials on the rheol-ogy of rendering mortars. Appl. Rheol. 2013, 23, 1. [Google Scholar] [CrossRef]
- Palomo, A.; Banfill, P.F.G.; Fernández-Jiménez, A.; Swift, D.S. Properties of alkali-activated fly ashes determined from rheological measurements. Adv. Cem. Res. 2005, 17, 143–151. [Google Scholar] [CrossRef]
- Torres-Carrasco, M.; Rodríguez-Puertas, C.; Alonso, M.D.M.; Puertas, F. Alkali activated slag cements using waste glass as alternative activators. Rheological behaviour. Boletín de la Sociedad Española de Cerámica y Vidrio 2015, 54, 45–57. [Google Scholar] [CrossRef]
- Palacios, M.; Banfill, P.F.; Puertas, F. Rheology and Setting of Alkali-Activated Slag Pastes and Mortars: Effect of Organ Admixture. ACI Mater. J. 2008, 140–148. Available online: https://www.researchgate.net/publication/283026701_Rheology_and_setting_of_alkali-activated_slag_pastes_and_mortars_Effect_of_organ_admixture (accessed on 19 October 2020).
- Sitarz, M.; Urban, M.; Hager, I. Rheology and Mechanical Properties of Fly Ash-Based Geopolymer Mortars with Ground Granulated Blast Furnace Slag Addition. Energies 2020, 13, 2639. [Google Scholar] [CrossRef]
- Fu, C.; Ye, H.; Zhu, K.; Fang, D.; Zhou, J. Alkali cation effects on chloride binding of alkali-activated fly ash and metakaolin geopolymers. Cem. Concr. Compos. 2020, 114, 103721. [Google Scholar] [CrossRef]
- Ye, H.; Huang, L.; Chen, Z. Influence of activator composition on the chloride binding capacity of alkali-activated slag. Cem. Concr. Compos. 2019, 104, 103368. [Google Scholar] [CrossRef]
- Beghoura, I.; Castro-Gomes, J. Design of alkali-activated aluminium powder foamed materials for precursors with different particle sizes. Constr. Build. Mater. 2019, 224, 682–690. [Google Scholar] [CrossRef]
- Palacios, M.; Houst, Y.; Bowen, P.; Puertas, F. Adsorption of superplasticizer admixtures on alkali-activated slag pastes. Cem. Concr. Res. 2009, 39, 670–677. [Google Scholar] [CrossRef]
- CEN—EN 1015-3—Methods of Test for Mortar for Masonry—Part 3: Determination of Consistence of Fresh Mortar (by Flow Table) Engineering 360. 1999. Available online: https://standards.globalspec.com/std/733841/EN1015-3 (accessed on 16 October 2020).
- Kastiukas, G.; Zhou, X.; Castro-Gomes, J. Preparation Conditions for the Synthesis of Alkali-Activated Binders Using Tungsten Mining Waste. J. Mater. Civ. Eng. 2017, 29, 04017181. [Google Scholar] [CrossRef]
- Sedira, N.; Castro-Gomes, J. Microstructure Features of Ternary Alkali-activated Binder Based on Tungsten Mining Waste, Slag and Metakaolin. KnE Eng. 2020, 2020, 195–206. [Google Scholar] [CrossRef]
- Vance, K.; Dakhane, A.; Sant, G.; Neithalath, N. Observations on the rheological response of alkali activated fly ash suspensions: The role of activator type and concentration. Rheol. Acta 2014, 53, 843–855. [Google Scholar] [CrossRef]
- Mehdizadeh, H.; Kani, E.N. Rheology and apparent activation energy of alkali activated phosphorous slag. Constr. Build. Mater. 2018, 171, 197–204. [Google Scholar] [CrossRef]
- Krieger, I.M.; Dougherty, T.J. A Mechanism for Non-Newtonian Flow in Suspensions of Rigid Spheres. Trans. Soc. Rheol. 1959, 3, 137–152. [Google Scholar] [CrossRef]
- Sedira, N.; Castro-Gomes, J.; Magrinho, M. Red clay brick and tungsten mining waste-based alkali-activated binder: Microstructural and mechanical properties. Constr. Build. Mater. 2018, 190, 1034–1048. [Google Scholar] [CrossRef]
Publisher’s Note: MDPI stays neutral with regard to jurisdictional claims in published maps and institutional affiliations. |
© 2021 by the authors. Licensee MDPI, Basel, Switzerland. This article is an open access article distributed under the terms and conditions of the Creative Commons Attribution (CC BY) license (http://creativecommons.org/licenses/by/4.0/).