1. Introduction
Functional alignment (FA) has gained increasing interest in the context of robotic-assisted (RA) total knee arthroplasty (TKA) for its potential to preserve native anatomy and replicate physiological knee mechanics [
1,
2,
3]. Early clinical results suggest that restoring native alignment may improve short-term outcomes [
4,
5,
6]. Although recent advancements have focused mainly on the coronal plane, emerging literature highlights the importance of considering both coronal and sagittal alignment to fully restore natural knee kinematics and optimize clinical performance [
7,
8,
9,
10,
11].
Among sagittal parameters, the posterior tibial slope (PTS) plays a central role in shaping knee biomechanics, including joint kinematics, soft-tissue balance, and implant function following TKA [
12,
13]. While studies increasingly support alignment strategies that replicate a patient’s native anatomy, the optimal target for postoperative PTS remains uncertain. There is ongoing debate over whether to restore native PTS or adopt standardized targets to improve surgical reproducibility and consistency [
8,
11,
14,
15]. Although native PTS demonstrates considerable anatomical variability, current imaging and surgical technologies often lack the precision needed to restore individualized slopes reliably [
16,
17,
18,
19]. As a result, most implant systems continue to promote standardized slope targets, representing a pragmatic compromise between anatomical accuracy and technical feasibility. A posterior tibial slope of approximately 3° has commonly been used as a nominal sagittal target in conventional and robotic-assisted TKA workflows, including procedures performed with NAVIO/CORI systems and the JOURNEY II implant.
However, it remains unclear whether small variations in achieved postoperative PTS within a FA workflow have clinically meaningful effects on knee mechanics and patient perception. In particular, the clinical relevance of maintaining a moderate slope compared with flatter configurations remains poorly defined. While excessive PTS has been associated with increased flexion and instability, and insufficient slope with limited flexion and altered kinematics, the impact of small deviations within a narrow range of slope values remains uncertain.
The aim of this study was to evaluate whether achieved postoperative PTS is associated with differences in flexion–extension mechanics and patient-reported outcomes following RA-TKA performed according to FA principles. We hypothesized that differences in achieved PTS would be associated with variations in extension behavior and subjective functional perception, without resulting in clinically meaningful differences in overall patient-reported outcomes.
2. Methods
2.1. Study Design
We conducted a retrospective observational cohort study including consecutive patients who underwent primary RA-TKA between 1 July 2022, and April 2024. All procedures were performed by a single high-volume surgeon using a FA workflow within an established imageless robotic program. Given the observational design, no predefined PTS target was assigned, and all analyses were based on achieved postoperative alignment. The study was conducted in accordance with the Declaration of Helsinki and approved by the Local Ethics Committee Palermo 1 (protocol “Robotic Knee Prosthesis”; Minutes No. 03/2024). Written informed consent was obtained from all participants for the use of anonymized clinical and radiographic data.
2.2. Patient Selection
Patients were eligible for inclusion if they were aged ≥ 50 years and underwent primary RA-TKA for primary or post-traumatic osteoarthritis, with a minimum follow-up of 12 months.
Exclusion criteria included inflammatory or neuropathic arthropathy, prior ipsilateral knee arthroplasty, previous ligament reconstruction, severe bone loss requiring stems, augments, cones or constrained implants, and periprosthetic joint infection during follow-up. Patients with preoperative flexion contracture > 15° or incomplete radiographic or clinical data were also excluded.
Patients were stratified according to their achieved postoperative PTS, as measured on standardized postoperative radiographs. This stratification reflects the final postoperative alignment rather than a predefined surgical strategy and therefore represents an observational comparison of achieved PTS values.
Two groups were defined: a near-3° PTS group, including patients with an achieved postoperative PTS between 2.5° and 3.5°, and an outside-range comparator group. Because the comparator group predominantly comprised patients with postoperative PTS values below 2.5°, with only minimal representation of values above 3.5°, it is referred to throughout the manuscript as the predominantly lower-PTS comparator group. Accordingly, the present comparison should not be interpreted as representative of all postoperative PTS configurations outside the near-3° interval. The 3° reference value was selected because it represents a commonly used nominal posterior tibial slope target in conventional and robotic-assisted TKA workflows. The 2.5–3.5° interval was used as an operational analytical window to identify patients whose achieved postoperative PTS was closest to this nominal target and to maintain a relatively homogeneous exposure group. This interval was not intended to represent a biologically validated threshold, a minimal clinically important difference, or a universally optimal postoperative PTS.
2.3. Surgical Technique
All procedures were performed using the NAVIO™ Surgical System (Smith & Nephew, Memphis, TN, USA) following a FA workflow [
16]. A standard mid-vastus approach was used in all cases. Optical tracking arrays were fixed to the distal femur and proximal tibia using bicortical pins.
Patient-specific anatomical mapping was performed by registering key osseous landmarks and articular surfaces, enabling the creation of a three-dimensional model. Dynamic kinematic assessment was conducted throughout the range of motion (ROM) with applied varus–valgus stress to characterize ligament behavior.
Intraoperative planning allowed real-time adjustments of component positioning, alignment, and balancing to achieve FA targets. Tibial resection was performed using a twin-peg cutting guide positioned according to robotic planning. Femoral resections were executed using a handheld robotic burr.
Trial components were used to assess stability and ROM before implantation of cemented JOURNEY™ II BCS components (Smith & Nephew, Memphis, TN, USA). Patellar resurfacing was performed selectively.
The final PTS used for analysis corresponded to the achieved postoperative alignment measured radiographically rather than the intraoperative planned value.
2.4. Clinical Evaluation
Demographic and clinical data, including age, sex, body mass index (BMI), laterality, and comorbidities, were collected from electronic medical records.
Postoperative clinical assessment included knee flexion, extension, and total ROM, measured in degrees using a standardized goniometric examination. Extension values were recorded such that negative values indicate knee hyperextension.
Postoperative knee extension at the latest follow-up was defined as the primary outcome. Postoperative flexion, total ROM, global PROMs, and PASS achievement were considered secondary outcomes. Analyses of individual KOOS items were not prespecified and were conducted post hoc; therefore, they were considered exploratory and hypothesis-generating.
Patient-reported outcomes were evaluated using validated instruments, including the Knee Injury and Osteoarthritis Outcome Score (KOOS), the KOOS for Joint Replacement (KOOS-JR), and the Forgotten Joint Score (FJS), as previously described [
20,
21,
22]. All scores were normalized to a 0–100 scale, with higher values indicating better outcomes.
Patient Acceptable Symptom State (PASS) thresholds were applied according to previously published criteria [
20,
21,
22]. Additionally, selected KOOS single-item questions were analyzed to assess flexion–extension function and stiffness, including full extension, full flexion, stair negotiation, and stiffness symptoms or mechanical catching.
2.5. Radiographic Assessment
Standardized postoperative anteroposterior and short-leg lateral radiographs were obtained with the knee in full extension and the limb in neutral rotation. Radiographic acquisition followed the same institutional protocol for all patients to minimize variability related to knee positioning and limb rotation.
All measurements were performed using digital PACS “Synapse PACS (FUJIFILM Corporation, Tokyo, Japan)” by a single trained assessor who was blinded to clinical outcomes. On lateral radiographs, the tibial anatomical axis was constructed using the midpoints between the anterior and posterior cortices of the visible tibial shaft. Postoperative posterior tibial slope (PTS) was defined as the posterior inclination of the tibial baseplate relative to a line perpendicular to the constructed tibial anatomical axis. The same anatomical reference and measurement procedure were applied consistently to all patients.
Coronal alignment parameters, including the mechanical lateral distal femoral angle (mLDFA), mechanical medial proximal tibial angle (mMPTA), and arithmetic hip–knee angle (aHKA), were evaluated according to the Coronal Plane Alignment of the Knee (CPAK) classification [
23].
Preoperative aHKA was available and was included as a baseline coronal alignment parameter. However, standardized preoperative lateral radiographs suitable for reliable measurement of native PTS were not consistently available. Consequently, native preoperative PTS, postoperative change in PTS, and deviation from native PTS could not be calculated. Individual preoperative mLDFA and mMPTA measurements were also not consistently available according to the standardized study protocol and were therefore not included in the analysis. Accordingly, the present study evaluates associations with absolute achieved postoperative PTS and does not assess restoration of individual native sagittal anatomy [
24].
2.6. Statistical Analysis
Descriptive statistics were used to summarize demographic, clinical, and radiographic variables. Continuous variables were reported as mean ± standard deviation or median and interquartile range, as appropriate, after assessment of their distribution using the Shapiro–Wilk test. Categorical variables were reported as n (%).
Between-group comparisons were performed using Welch’s t-test or the Mann–Whitney U test for continuous variables and the chi-square test or Fisher’s exact test for categorical variables, as appropriate. Comorbidities were considered non-mutually exclusive because individual patients could have more than one condition. Each comorbidity was therefore reported separately as n (%) and compared between groups using a two-sided Fisher’s exact test because of the small expected cell counts. No omnibus comparison across comorbidity categories was performed.
Postoperative extension at the latest follow-up was considered the principal outcome of the present analysis. Postoperative flexion, total ROM, global PROMs, and PASS achievement were considered secondary outcomes. The individual KOOS-item analyses were not prespecified and were conducted post hoc; therefore, they were considered exploratory and hypothesis-generating. To account for multiplicity among secondary outcomes, the corresponding p-values were adjusted using the Benjamini–Hochberg false discovery rate (FDR) procedure. The item-level KOOS analyses were treated as a separate exploratory family and were independently subjected to FDR correction.
Postoperative extension at the latest follow-up was used as the principal dependent variable in the multivariable regression analyses. Two complementary models were constructed. In the categorical model, the predominantly lower-PTS comparator group was coded as 0 and used as the reference category, whereas the near-3° PTS group was coded as 1. In the continuous model, achieved postoperative PTS was entered per 1° increase. Sex was coded as female = 0 and male = 1. Age, sex, BMI, and preoperative extension were entered simultaneously as covariates selected a priori according to clinical relevance. No automated or stepwise model-selection procedure was used. Complete-case analysis was performed separately for each regression model. The categorical model included patients with complete data for postoperative extension, age, sex, BMI, preoperative extension, and PTS-group assignment. The continuous model additionally required an available numerical value for achieved postoperative PTS. Consequently, one additional patient was excluded from the continuous model because an evaluable continuous postoperative PTS measurement was unavailable.
Additional exploratory continuous models were constructed for postoperative flexion, total ROM, and global PROMs. The flexion and ROM models were adjusted for age, sex, BMI, and the corresponding preoperative measurement. Models evaluating global PROMs were adjusted for age, sex, and BMI. The resulting p-values were subjected to FDR correction.
Regression coefficients were reported with their corresponding units, 95% confidence intervals, and p-values. Model fit was assessed using R2 and adjusted R2. Multicollinearity was evaluated using variance inflation factors. Residual distribution, heteroscedasticity, and influential observations were assessed using residual diagnostics, the Breusch–Pagan test, and Cook’s distance, respectively. HC3 robust standard errors were calculated as a sensitivity analysis to account for potential deviations from model assumptions. Potential nonlinearity in the relationship between continuous PTS and postoperative extension was assessed by adding a centered quadratic PTS term and comparing the linear and quadratic models. Given the observational design, all regression models were used to evaluate associations and not to infer causality.
Because this retrospective study included all consecutive eligible patients treated during the study period, no a priori sample-size calculation was performed. A post hoc power analysis was conducted for the primary outcome of postoperative extension. Based on the final group sizes of 78 and 22 patients, the observed mean values of 0.82° ± 2.85° and −1.69° ± 2.80°, respectively, and a two-sided alpha level of 0.05, the standardized effect size was Cohen’s d = 0.88. Using a two-sided Welch’s t-test framework, the achieved statistical power was approximately 94.9%.
Statistical significance was set at a two-sided p-value < 0.05. For analyses subjected to multiple-comparison correction, an FDR-adjusted p-value < 0.05 was considered statistically significant. All statistical analyses were performed using Python version 3.10.3.
3. Results
3.1. Patient Characteristics
A total of 100 patients were included, with 78 patients in the near-3° PTS group and 22 patients in the predominantly lower-PTS comparator group.
The two groups were comparable with respect to demographic and baseline clinical characteristics. Mean age was 67.8 ± 7.5 years in the near-3° group and 66.9 ± 6.9 years in the comparator group (
p = 0.562), while mean BMI was 29.3 ± 4.2 and 29.5 ± 3.9 kg/m
2, respectively (
p = 0.812). No significant differences were observed in sex distribution or laterality (
Table 1). Preoperative ROM and alignment parameters were similar between groups (all
p > 0.05).
Comorbidities were non-mutually exclusive and were analyzed separately. Diabetes was present in 14 of 78 patients (17.9%) in the near-3° PTS group and 6 of 22 patients (27.3%) in the comparator group (p = 0.370). Hypertension was reported in 11 patients (14.1%) and 5 patients (22.7%), respectively (p = 0.336); vascular disease in 7 (9.0%) and 4 (18.2%) patients (p = 0.252); peripheral neuropathy in 5 (6.4%) and 2 (9.1%) patients (p = 0.647); and rheumatic disorders in 6 (7.7%) and 3 (13.6%) patients (p = 0.408). All comparisons were performed using a two-sided Fisher’s exact test, and no statistically significant between-group differences were identified.
3.2. Radiographic Outcomes
Preoperative aHKA was comparable between groups and is reported in
Table 2. Native preoperative PTS and individual preoperative mLDFA and mMPTA measurements were not consistently available and were therefore not included in the analysis.
Postoperative coronal alignment parameters were comparable between groups, with no statistically significant differences in aHKA, mLDFA, or mMPTA (all p > 0.05). Postoperative femoral component flexion was also similar between the near-3° PTS group and the predominantly lower-PTS comparator group (3.86° ± 1.54° vs. 4.14° ± 1.83°, respectively; p = 0.522).
Consistent with the group definitions, achieved postoperative PTS differed significantly between groups, with a mean value of 3.00° ± 0.25° in the near-3° PTS group and 1.82° ± 1.10° in the predominantly lower-PTS comparator group (
p < 0.001) (
Table 2).
The comparator group predominantly comprised patients with flatter postoperative PTS values. Therefore, the categorical comparison primarily reflects a near-3° PTS configuration versus a predominantly lower-slope configuration and should not be interpreted as representative of all postoperative PTS values outside the 2.5–3.5° interval.
3.3. Flexion–Extension Mechanics
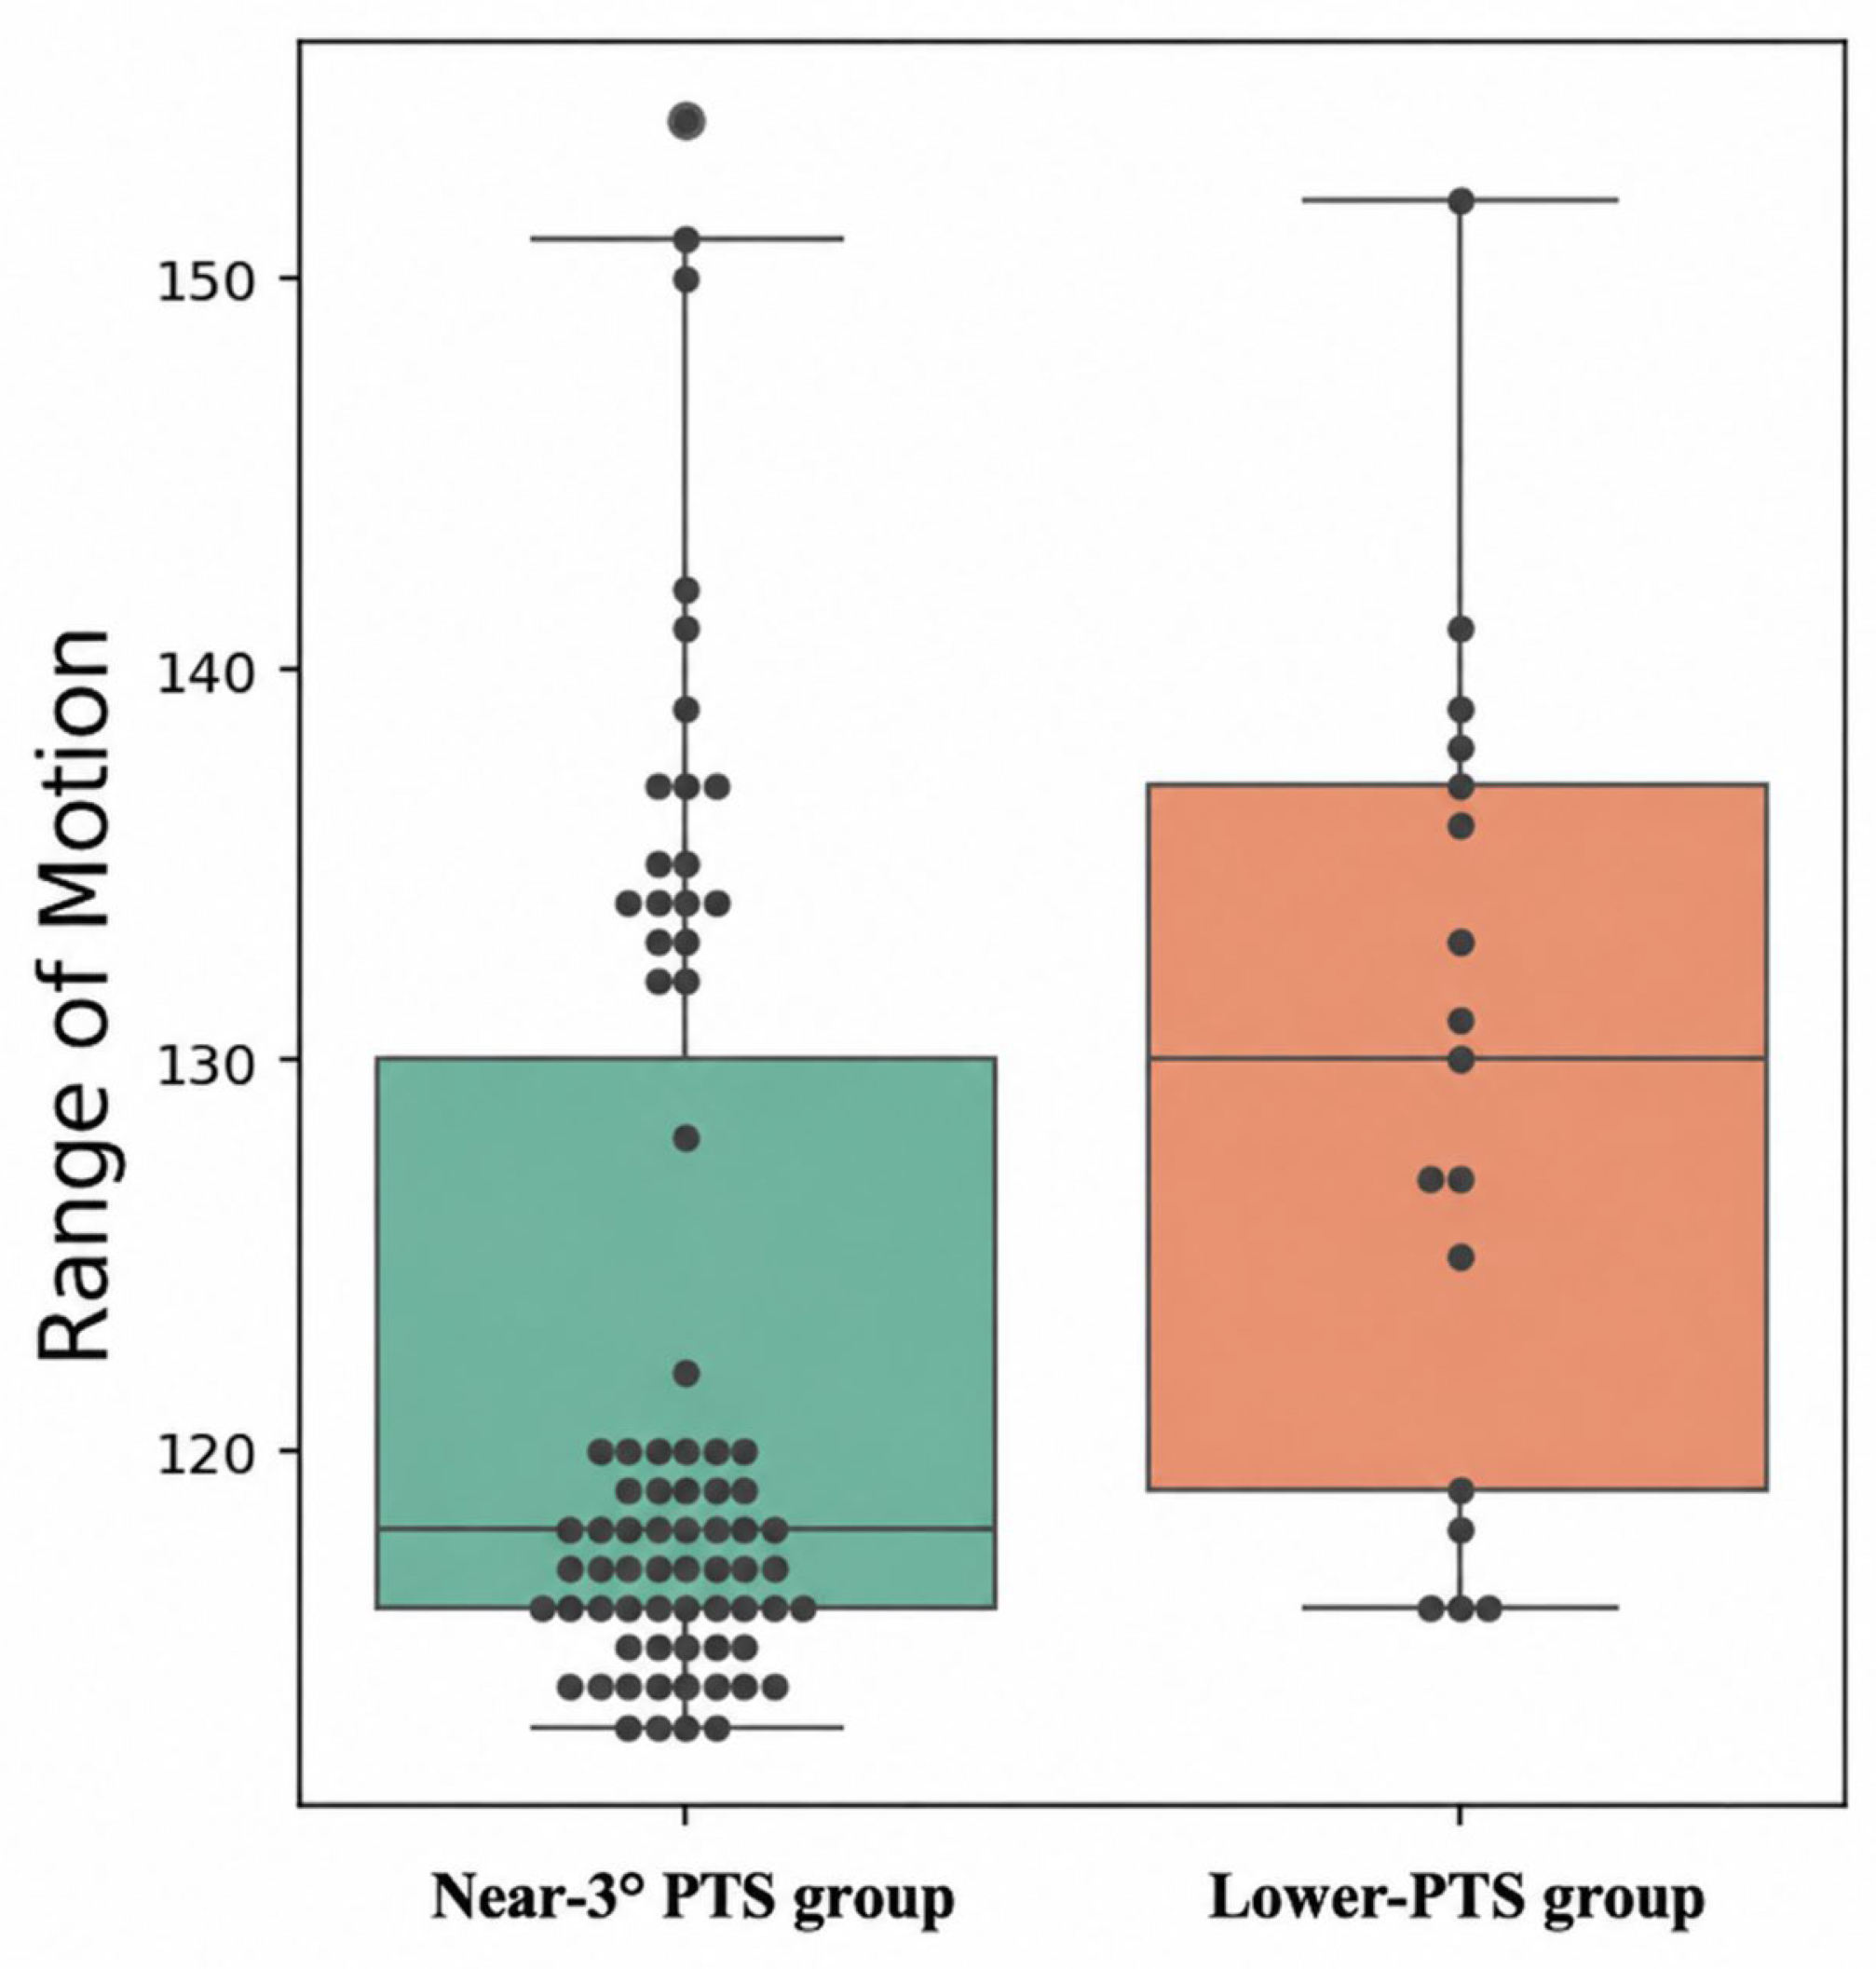
Postoperative flexion–extension parameters differed between groups. The predominantly lower-PTS comparator group demonstrated greater overall ROM compared with the near-3° group (129.5° ± 10.4° vs. 122.2° ± 10.1°;
p = 0.007; adjusted
p = 0.056,
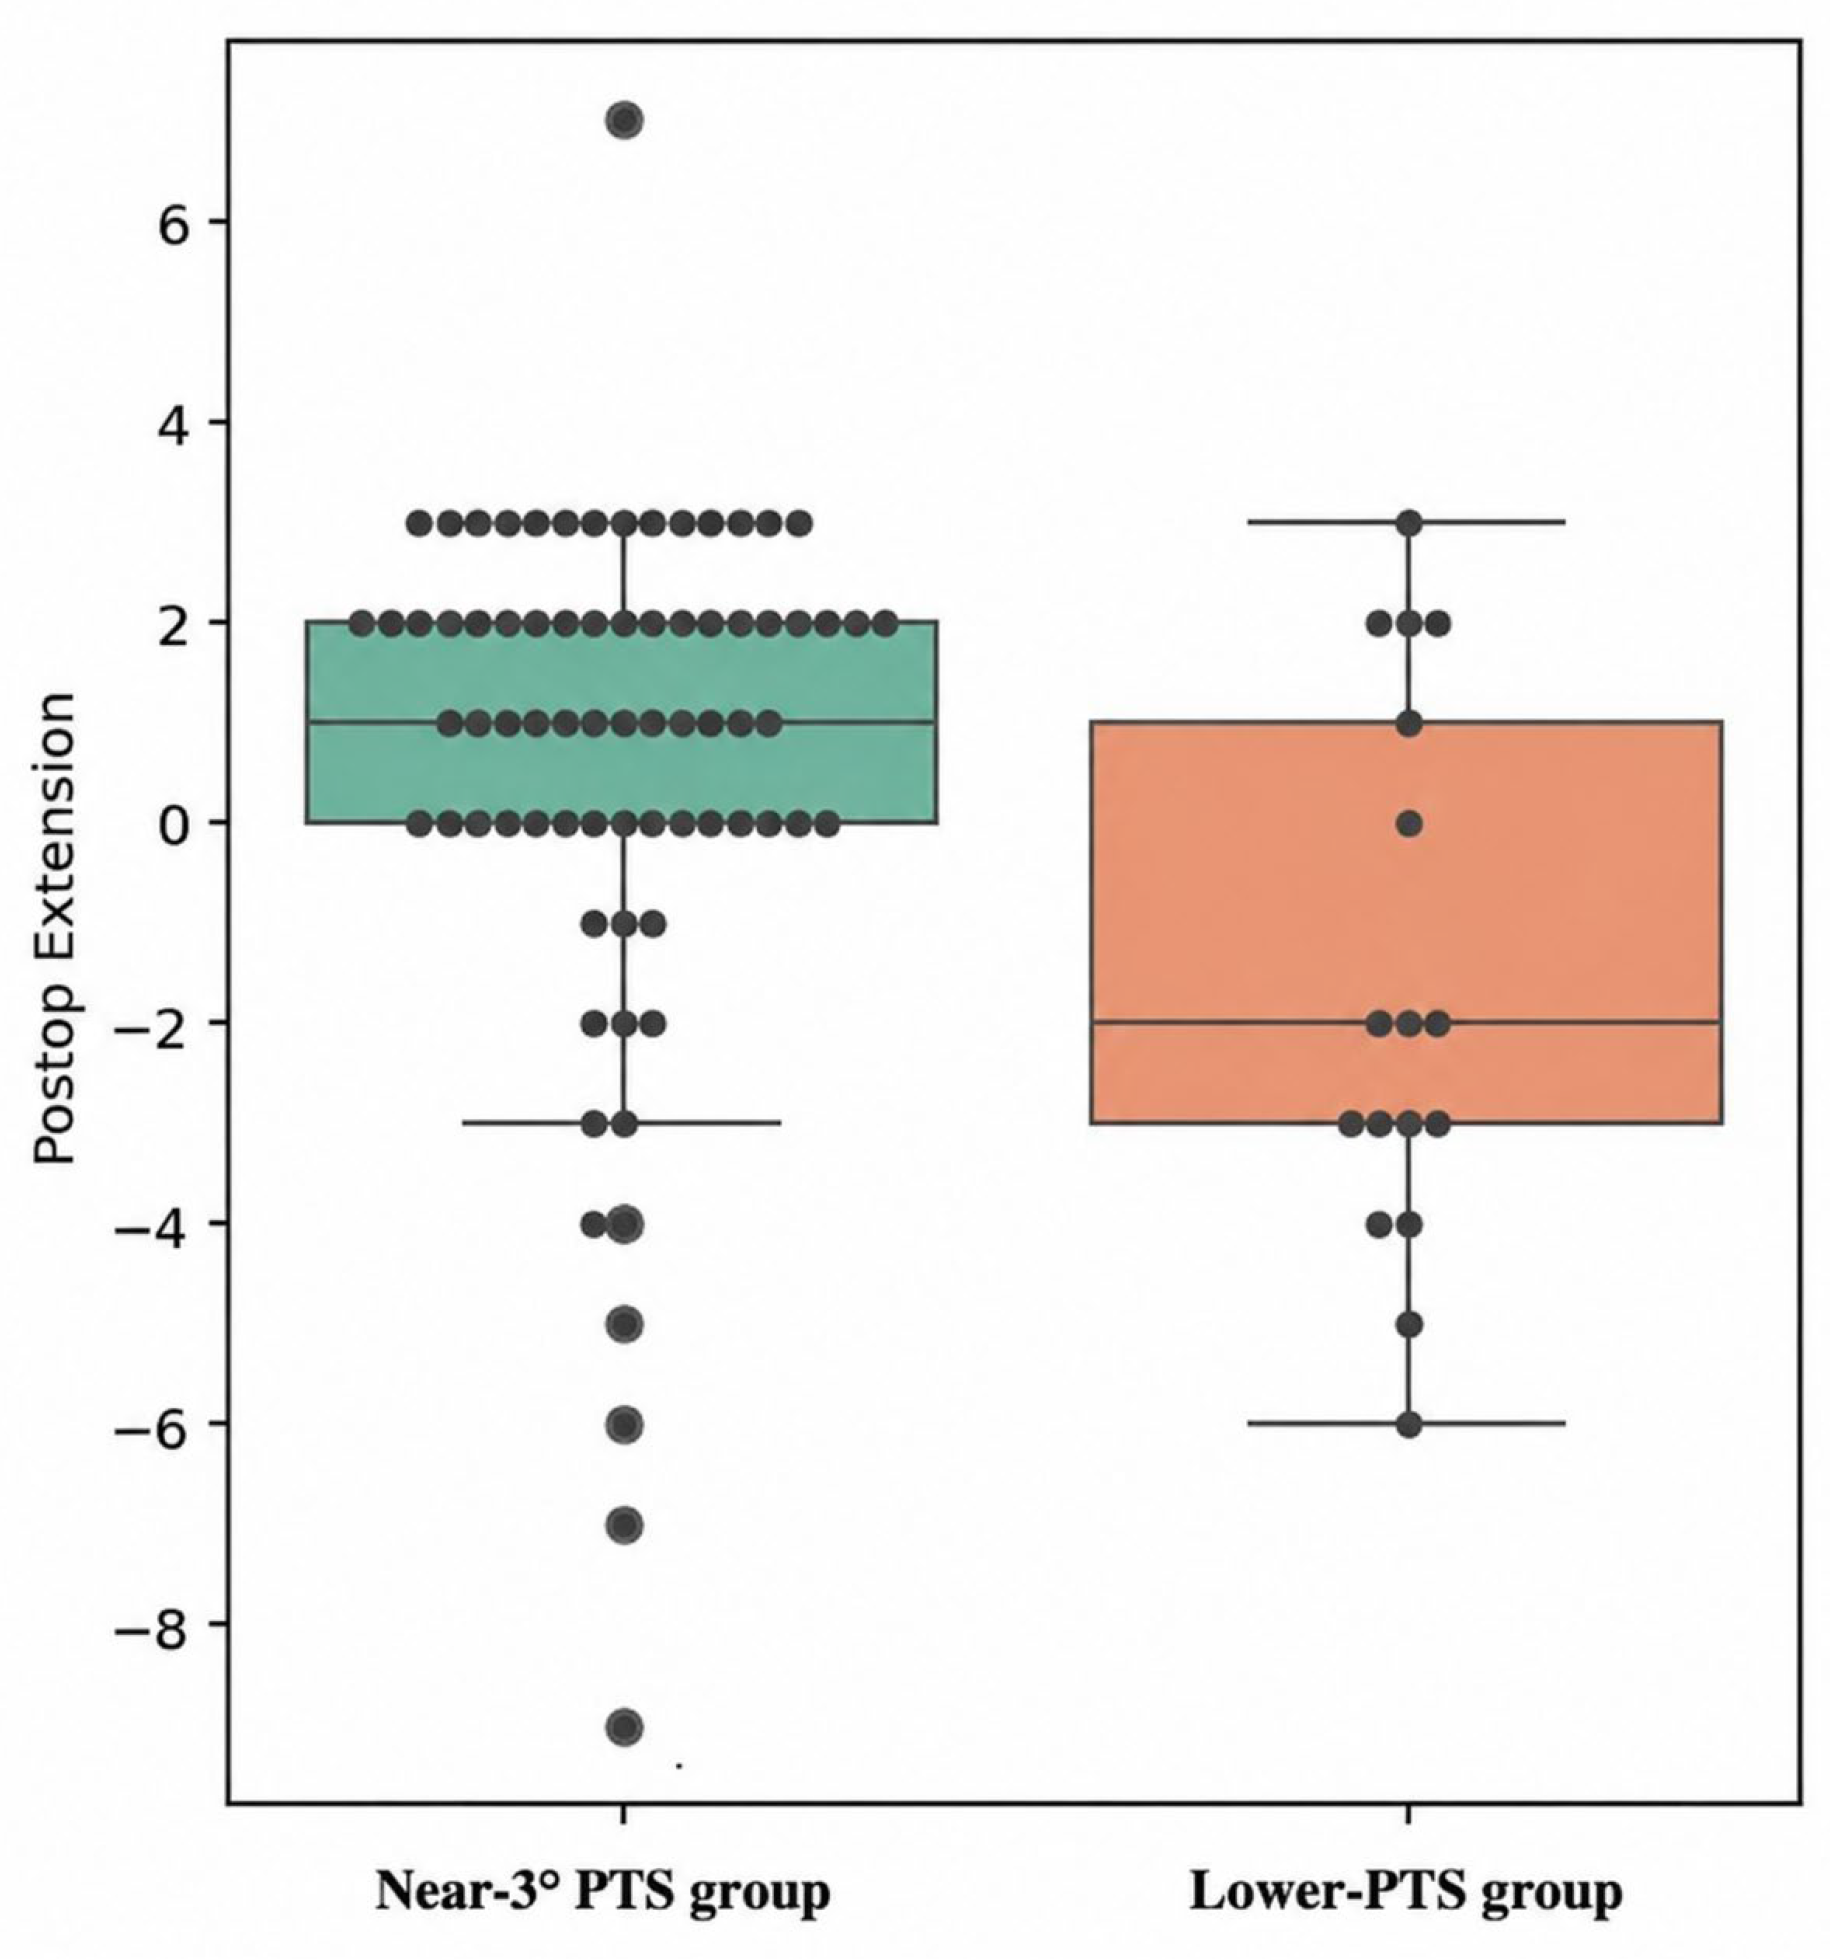
Figure 1). This difference was primarily driven by increased postoperative hyperextension. Specifically, patients in the predominantly lower-PTS comparator group showed a mean postoperative extension of −1.69° ± 2.80°, indicating hyperextension, whereas those in the near-3° group demonstrated a mild extension deficit (0.82° ± 2.85°;
p = 0.003).
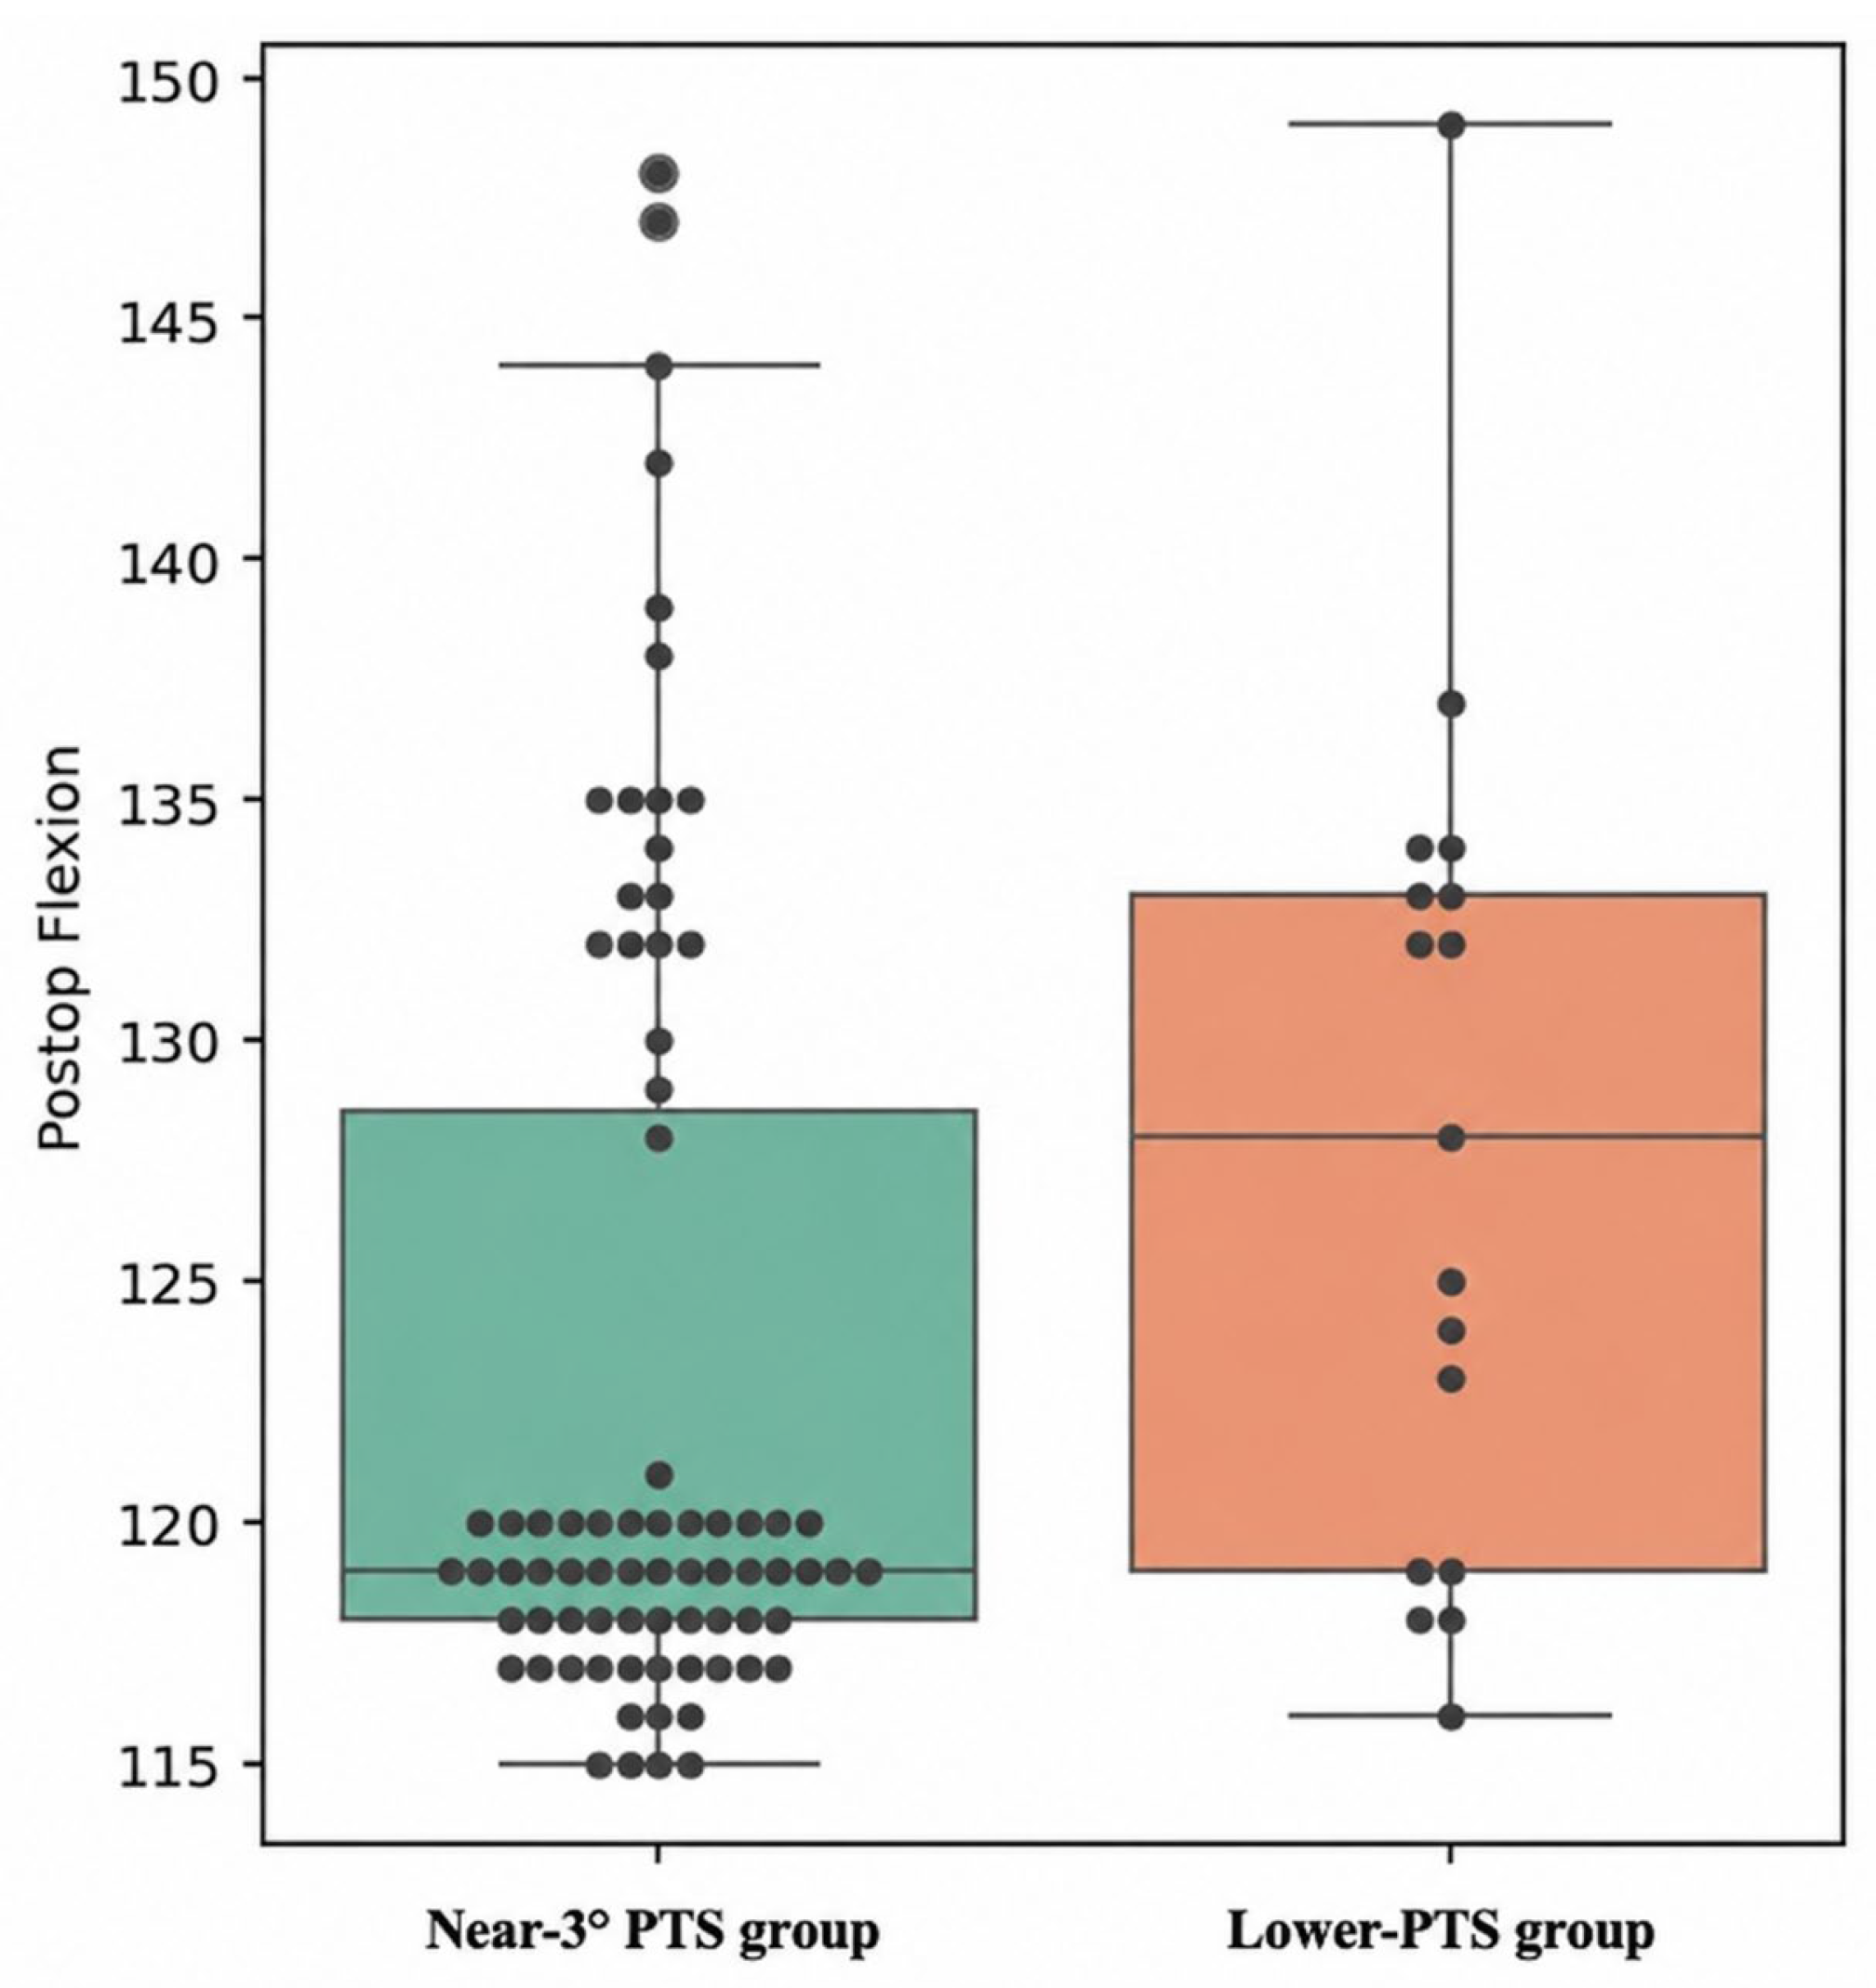
Postoperative flexion was slightly higher in the Lower-PTS comparator group (127.9° ± 8.77° vs. 122.9° ± 8.37°;
p = 0.026), although this difference did not remain significant after adjustment (adjusted
p = 0.130) (
Table 3,
Figure 2).
These findings indicate that differences in achieved posterior tibial slope were associated with distinct extension profiles, with flatter slopes linked to increased hyperextension (
Figure 3).
3.4. Patient-Reported Outcomes
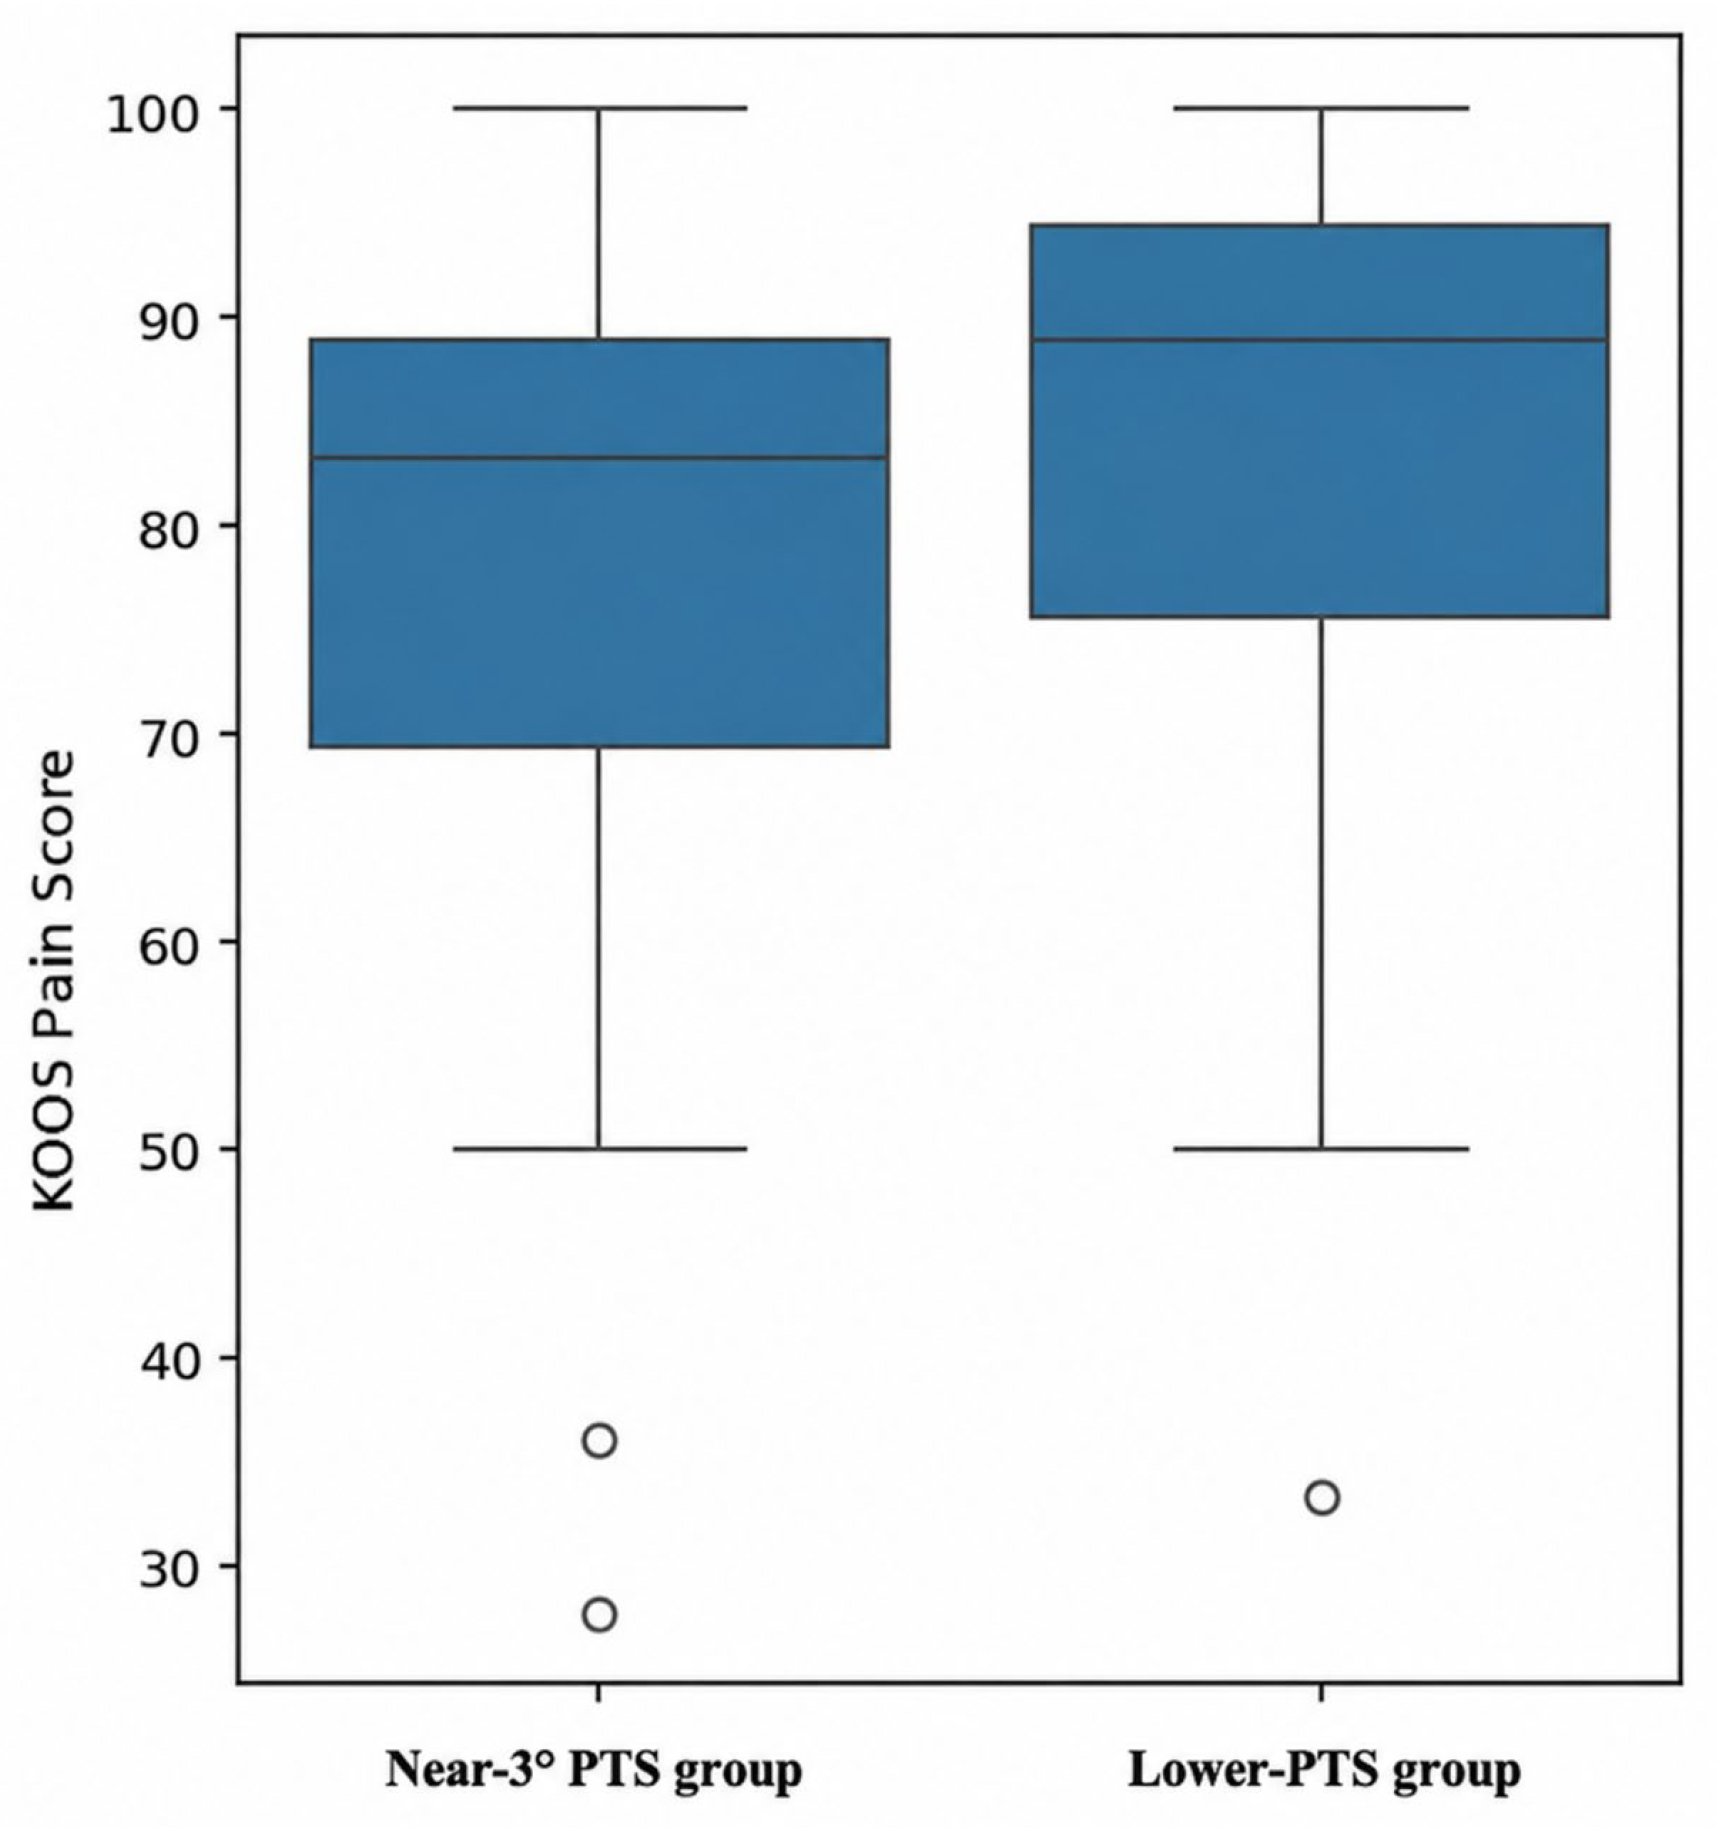
Overall, patient-reported outcomes were comparable between groups. No statistically significant differences were observed in total KOOS (67.0 ± 14.77 vs. 71.5 ± 16.11), KOOS Pain, KOOS Symptoms, ADL, QoL, KOOS-JR (81.2 ± 15.25 vs. 84.6 ± 16.87), or FJS (69.8 ± 22.51 vs. 74.9 ± 25.57) after adjustment for multiple comparisons (all adjusted
p > 0.20) (
Table 3,
Figure 4). Similarly, the proportion of patients achieving PASS thresholds did not differ significantly between groups across all domains (all adjusted
p > 0.55) (
Table 4).
3.5. Item-Level Functional Outcomes
The selected item-level KOOS analyses were considered exploratory and were treated as a separate family for Benjamini–Hochberg FDR correction.
Patients in the near-3° PTS group reported less difficulty with stair negotiation (question 6: β = −1.23; 95% CI −2.15 to −0.31; raw p = 0.009; FDR-adjusted p = 0.027). This association remained statistically significant after correction for multiple comparisons.
The nominal association with fewer locking or catching symptoms did not remain statistically significant after FDR correction (question 14: β = −0.82; 95% CI −1.58 to −0.06; raw p = 0.036; FDR-adjusted p = 0.054). Similarly, the association with reduced afternoon stiffness was not statistically significant (question 11: raw and FDR-adjusted p = 0.087).
Accordingly, these isolated item-level findings should be considered exploratory and hypothesis-generating and should not be interpreted as evidence of overall functional superiority, particularly given the absence of significant between-group differences in global PROMs and PASS achievement.
3.6. Multivariable Analysis
Complete-case analysis resulted in 87 patients being included in the categorical model. The continuous PTS model included 86 patients because one additional patient lacked an evaluable numerical postoperative PTS measurement. In the categorical multivariable model, the predominantly lower-PTS comparator group was coded as 0 and used as the reference category, whereas the near-3° PTS group was coded as 1. After adjustment for age, sex, BMI, and preoperative extension, membership in the near-3° PTS group was associated with a 2.42° higher postoperative extension value compared with the reference group (β = 2.42°; 95% CI 1.06–3.78; p = 0.001; n = 87). Because negative extension values represented hyperextension, the positive coefficient indicates less terminal hyperextension in the near-3° group and is consistent with the direction of the unadjusted group means. The categorical model had an R2 of 0.173 and an adjusted R2 of 0.122.
When achieved postoperative PTS was analyzed as a continuous variable, each 1° increase in PTS was associated with a 1.23° increase in the recorded postoperative extension value after adjustment for age, sex, BMI, and preoperative extension (β = 1.23° per 1° increase in PTS; 95% CI 0.49–1.97; p = 0.001; n = 86). This result indicates progressively less terminal hyperextension with increasing postoperative PTS. The continuous model had an R2 of 0.156 and an adjusted R2 of 0.103.
No evidence of nonlinearity was identified after inclusion of a centered quadratic PTS term (p for nonlinearity = 0.588). Variance inflation factors were below 1.21, indicating no relevant multicollinearity, and the Breusch–Pagan test did not indicate heteroscedasticity (p = 0.603). Although residuals deviated from normality, an analysis using HC3 robust standard errors confirmed the association between continuous PTS and postoperative extension (β = 1.23°; robust 95% CI 0.16–2.30; p = 0.025). Five observations exceeded the conventional Cook’s distance threshold of 4/n; however, a sensitivity analysis excluding these observations produced a consistent association (β = 1.71°; 95% CI 1.02–2.40; p < 0.001).
Exploratory associations between continuous PTS and postoperative flexion, total ROM, KOOS, KOOS-JR, and FJS did not remain statistically significant after FDR correction. Accordingly, the continuous and categorical analyses consistently support an association between greater postoperative PTS and reduced terminal hyperextension, without demonstrating a discrete threshold effect at 3° or superiority in global patient-reported outcomes.
3.7. Complications
The overall complication rate was low and comparable between groups. Three patients required manipulation under anesthesia for postoperative stiffness (two in the near-3° group and one in the predominantly lower-PTS comparator group). One revision for patellar maltracking occurred in the near-3° group at 5 months, and one revision for tibial component loosening occurred in the Lower-PTS comparator group at 1 year. No cases of deep infection, thromboembolic events, or periprosthetic fracture were recorded during follow-up (
Table 5).
4. Discussion
The principal finding of this study was that achieved postoperative PTS was associated with static postoperative extension measurements, particularly terminal hyperextension, rather than with overall functional superiority following RA-TKA performed according to FA principles. Patients in the near-3° PTS group demonstrated less terminal hyperextension than those in the predominantly lower-PTS comparator group, whereas global PROMs and PASS achievement were comparable between groups.
Importantly, the continuous analysis demonstrated a graded association between increasing achieved postoperative PTS and reduced terminal hyperextension, without evidence of nonlinearity. This finding argues against interpreting 3° as a discrete biomechanical threshold and supports considering the categorical comparison as an exploratory and clinically interpretable representation of the continuous relationship between PTS and postoperative extension.
PTS is an important determinant of sagittal-plane biomechanics and has been shown to influence femorotibial kinematics, quadriceps efficiency, and implant behavior after TKA [
2,
25,
26,
27]. Most previous studies investigating postoperative PTS have focused primarily on postoperative flexion or total ROM [
1,
14,
25,
26,
27,
28]. The present study extends this literature by specifically examining terminal extension and identifying an association between flatter achieved postoperative slopes and greater terminal hyperextension. However, extension was assessed using static goniometric measurements. Therefore, these findings should not be interpreted as direct evidence of sagittal instability, altered ligament tension, mid-flexion instability, abnormal dynamic knee kinematics, fluoroscopic translation, or gait abnormalities, none of which were directly evaluated.
The difference in mean achieved postoperative PTS between the groups was relatively small, approximately 1.2°, and may be of a magnitude similar to the technical and radiographic variability expected with short-leg lateral radiographic measurements. Because a study-specific standard error of measurement and smallest detectable change were not available, it cannot be determined conclusively whether the observed between-group separation exceeded measurement error. Accordingly, both the magnitude of the PTS difference and its association with terminal extension should be interpreted cautiously.
Increased posterior slope has traditionally been associated with greater postoperative flexion and posterior tibial translation, whereas reduced slope has been considered a potential contributor to restricted flexion and altered joint kinematics [
1,
14,
28]. In the present study, however, the predominantly lower-PTS comparator group demonstrated numerically greater postoperative flexion. This difference did not remain statistically significant after FDR correction and should therefore be interpreted as an exploratory finding. Postoperative flexion is multifactorial and may be influenced by implant geometry and sagittal constraint, the FA balancing workflow, soft-tissue tension, femoral component positioning, preoperative mobility, and other unmeasured anatomical or intraoperative factors. Moreover, the limited difference in mean PTS between the groups may have been insufficient to produce a clinically distinguishable effect on flexion. The present observational analysis cannot isolate the independent contribution of each of these factors.
The predominantly lower-PTS comparator group also demonstrated greater overall ROM, although this difference was primarily attributable to greater terminal hyperextension and did not remain statistically significant after FDR correction. Because only static goniometric ROM was assessed, this observation cannot establish the presence of sagittal laxity, instability, altered ligament tension, or abnormal dynamic kinematics. Although biomechanical studies have suggested possible relationships between terminal hyperextension, posterior capsular loading, sagittal constraint, and knee kinematics [
29,
30,
31], these mechanisms were not directly investigated in the present cohort. Consequently, greater terminal hyperextension should not necessarily be interpreted as either a functional advantage or evidence of pathological instability.
Despite the observed differences in terminal extension, global patient-reported outcomes, including KOOS, KOOS-JR, FJS, and PASS achievement, were comparable between groups. This represents the principal clinically balanced interpretation of the findings and indicates that small variations in achieved postoperative PTS did not translate into detectable differences in overall patient-reported function at short-term follow-up. These findings are consistent with previous studies reporting limited sensitivity of global PROMs to relatively subtle variations in postoperative alignment and knee behavior [
8,
15]. Nevertheless, the absence of statistically significant differences should not be interpreted as evidence of equivalence, particularly given the unequal group sizes and the possibility that the study was underpowered to detect smaller differences in secondary outcomes.
Exploratory item-level KOOS analyses suggested that patients in the near-3° PTS group experienced less difficulty with stair negotiation, and this association remained statistically significant after separate FDR correction. In contrast, the nominal association with fewer locking or catching symptoms did not remain significant after correction. These findings suggest that specific aspects of patient-perceived function may not always be reflected in aggregate PROM scores. Nevertheless, because the individual KOOS-item analyses were conducted post hoc and no significant differences were identified in global KOOS, KOOS-JR, FJS, or PASS achievement, these isolated findings should be regarded as hypothesis-generating and should not be interpreted as confirmatory evidence of clinical superiority. Previous studies have similarly highlighted the potential value of granular outcome measures for capturing specific aspects of patient-perceived function after TKA [
5,
18].
From a clinical perspective, the present results do not support the existence of a universally optimal postoperative PTS or the use of 3° as a discrete threshold. Instead, they indicate an association between achieved postoperative PTS and terminal extension within the limited range of slope values observed in this cohort. The 2.5–3.5° interval should therefore be regarded as an operational analytical window around a commonly used nominal target rather than as a biologically or clinically validated range. Furthermore, the absence of clear differences in global clinical outcomes suggests that selection of postoperative PTS should remain individualized and considered together with implant design, native anatomy, soft-tissue balance, and the overall alignment strategy.
The implant-specific nature of the findings should also be emphasized. All patients received the JOURNEY II BCS implant, whose articular geometry and sagittal constraint may have influenced the observed flexion–extension pattern. Therefore, the present findings should not be directly generalized to cruciate-retaining, posterior-stabilized, medial-pivot, or differently constrained TKA designs [
32]. Further comparative studies are required to determine whether similar associations between achieved postoperative PTS and terminal extension are observed with other implant designs.
This study has several strengths. It included a relatively homogeneous cohort treated by a single high-volume surgeon using a standardized robotic-assisted FA workflow and the same implant design, thereby limiting some sources of procedural variability. Radiographic measurements were performed using a consistent methodology by a trained assessor blinded to the clinical outcomes [
23,
24]. The analysis also evaluated achieved postoperative PTS both categorically and continuously, reducing reliance on an isolated threshold-based comparison. In addition, the inclusion of multiple validated PROMs and PASS thresholds allowed the clinical findings to be interpreted beyond statistical significance, while the exploratory item-level analysis provided additional hypothesis-generating information regarding specific aspects of patient perception.
Several limitations should nevertheless be acknowledged. First, the retrospective observational design introduces the possibility of selection bias, residual confounding, and unmeasured differences between groups and does not permit causal inference. Group stratification was based on achieved postoperative PTS rather than on prospectively assigned surgical targets; consequently, the findings represent associations with postoperative alignment and not the effects of intentionally targeting a specific slope. Known confounders were addressed through multivariable adjustment, but unknown or unavailable confounders, including detailed intraoperative soft-tissue balance and patient-specific anatomical factors, could not be controlled.
Second, the relatively small sample size, unequal group distribution, and short-term follow-up limited the ability to detect small differences and assess longer-term outcomes such as implant survivorship. Although the post hoc analysis indicated adequate power to detect the observed difference in postoperative extension, post hoc power estimates depend on the observed effect size and should be interpreted cautiously. The study may have remained underpowered to detect smaller differences in secondary outcomes, particularly global PROMs and PASS achievement. Therefore, nonsignificant findings should not be interpreted as evidence of equivalence.
Third, the relatively narrow and uneven distribution of achieved postoperative PTS values limited the ability to investigate complex nonlinear relationships. Although no significant quadratic association was identified, the absence of evidence of nonlinearity should be interpreted cautiously. Similarly, because the comparator group predominantly comprised patients with PTS values below 2.5°, the findings primarily reflect a comparison between a near-3° configuration and a flatter postoperative slope rather than all possible PTS values outside the 2.5–3.5° interval.
Fourth, PTS was measured on short-leg lateral radiographs, which provide a more limited representation of the tibial shaft than full-length lateral imaging and may introduce variability in the construction of the tibial anatomical axis. Although the same radiographic protocol, anatomical reference, and measurement procedure were applied consistently, residual variability related to limb rotation and axis definition cannot be excluded. Because study-specific measurement-error parameters were unavailable, it was not possible to determine conclusively whether the approximately 1.2° difference between groups exceeded the smallest detectable change.
Fifth, standardized preoperative lateral radiographs suitable for reliable measurement of native PTS were not consistently available. Consequently, native PTS, postoperative change in PTS, and deviation from native sagittal anatomy could not be evaluated. It therefore remains unclear whether the achieved postoperative PTS represented restoration or alteration of each patient’s native anatomy. The present findings should be interpreted as associations with absolute achieved postoperative PTS and not as evidence supporting restoration of either a universal or patient-specific sagittal target. Similarly, individual preoperative mLDFA and mMPTA measurements were not consistently available, although preoperative aHKA was included as a baseline coronal alignment parameter.
Finally, because all procedures were performed by a single high-volume surgeon using a specific robotic-assisted FA workflow and the JOURNEY II BCS implant, the external validity of the findings may be limited. The results may not be generalizable to other surgeons, robotic platforms, conventional instrumentation, alignment philosophies, or implant designs.
Future prospective multicenter studies should include standardized preoperative and postoperative lateral and full-length weight-bearing radiographs, formal assessment of radiographic measurement error, and evaluation of both absolute postoperative PTS and deviation from the patient’s native sagittal anatomy. Larger cohorts with a broader distribution of postoperative PTS values would allow more robust assessment of nonlinear relationships. Future investigations should also incorporate dynamic or instrumented measurements of sagittal laxity, mid-flexion behavior, gait, and in vivo knee kinematics and should evaluate whether the observed association with terminal hyperextension is reproducible across different implant designs and alignment strategies. Such multicenter studies will also require secure management and sharing of imaging and robotic datasets; blockchain has been proposed as one possible approach to orthopedic data management [
33].





 ,
,