Abstract
Biogenic nanoparticles have recently emerged as promising bacterial growth inhibitors, requiring low concentrations and not producing harmful byproducts. However, knowledge gaps remain regarding how different extraction techniques affect nanoparticle synthesis, thereby influencing their replicability and scalability across various applications. To address these knowledge gaps, this study compared six extracts derived from Moringa oleifera biomass for the synthesis of iron oxide nanoparticles. Multivariate statistical analyses correlated extraction methods with biomolecule content (polyphenols, flavonoids, carbohydrates, proteins), iron percentage, and E. coli growth inhibition. All extracts showed varying concentrations of biomolecules, and different extraction methods were preferable for specific components. Flavonoids were best extracted by salting-out, while infusion methods were better for obtaining carbohydrates. Higher percentages of iron (22.77%) were linked to the presence of polyphenols and flavonoids. Nanoparticles prepared using salting-out and infusion extraction from leaf biomass displayed the highest efficiency in inhibiting E. coli growth, up to a dilution factor of 4. The outcomes of this research study provide an in-depth understanding of the role of specific biomolecules in biogenic nanoparticle synthesis, confirming that both synthesis yield and application effectiveness depend on the extract preparation method.
1. Introduction
In recent years, the synthesis of nanoparticles has gained significant attention due to their high surface area-to-volume ratio, which endows them with a wide array of beneficial properties, such as catalytic, adsorptive, and magnetic capabilities. These properties enable their use in diverse industrial applications. One of the most notable applications of nanoparticles is the inhibition of bacterial growth. Their antimicrobial properties allow them to interact directly with microbial cells, causing physical changes in the cell membrane [1] and thereby avoiding the generation of byproducts commonly associated with conventional disinfection methods (e.g., trihalomethanes with chlorine use) [2].
Iron oxide nanoparticles have gained broad interest in this area. In addition to their antibacterial capabilities [3,4], the presence of iron can reduce the cytotoxicity often associated with nanoparticles, balancing antimicrobial activity and biocompatibility [5]. However, conventional nanoparticle synthesis methods, such as chemical and physical synthesis, including procedures for coprecipitation, the sol–gel method, hydrothermal synthesis, solid-state synthesis, flame spray synthesis, thermal decomposition, and solvothermal methods [6,7], though effective, are unsustainable in the long term due to the use of toxic reagents and costly procedures. Consequently, the exploration of alternative, environmentally friendly approaches for synthesizing nanomaterials is an active area of research [8,9].
Biogenic methods have emerged as a promising alternative. These methods are simple, relatively low-cost, and efficient at producing a wide array of nanomaterials. These methods use biomolecules such as polyphenols, vitamins, amino acids, and carbohydrates extracted from various biological sources (e.g., plants, bacteria, algae, fungi, or yeast) as reducing, stabilizing, and capping agents in the synthesis of nanoparticles [10,11,12,13].
Consequently, plant-based biogenic synthesis has attracted significant interest because biomolecules can be obtained via conventional extraction methods, such as infusion and maceration, without requiring sterile conditions. However, plant-based synthesis also entails the use of a wide array of phytochemical compounds [10,14], which in some cases have not been investigated [15], making replicability and scaling up complex. In this regard, many studies rely on FT-IR for biomolecule identification [16,17,18,19], which mainly focuses on functional groups that may be present in various types of biomolecules [14] and is advised to be used in conjunction with alternative techniques [20] to determine specific biomolecules. Alternatively, some studies include analysis using High-Resolution Liquid Chromatography (HPLC) [21] or Gas chromatography-mass spectrometry (GC-MS) [22] to determine specific biomolecules, and other studies have investigated the biogenic synthesis of nanoparticles, determining their composition, size, shape, and properties (i.e., antimicrobial, antifungal, antioxidant, catalytic). However, despite these findings, to the best of the authors’ knowledge, there are limited studies that focus on biomolecules in plant extracts and their direct effects on the synthesized nanoparticles [14].
For this reason, the present study investigated the effect of biomass (i.e., Moringa oleifera leaf and seed) and extraction conditions (i.e., infusion, salting-out, and infusion-salting-out) on the formation of iron oxide nanoparticles, and the findings were supported with multivariate statistical analysis (i.e., Principal Component Analysis (PCA), Hierarchical Cluster Analysis (HCA), and Preference Ranking Organization Method for Enrichment Evaluations (PROMETHEE) together with Graphical Analysis for Interactive Assistance (GAIA)). The biomolecules obtained from different extracts were also statistically correlated with the nanoparticles’ chemical properties. The results showed that the extraction method can yield different biomolecule concentrations and that iron oxide nanoparticles with different characteristics are formed. Additionally, the optimally formed iron oxide nanoparticles were evaluated for their ability to inhibit bacterial growth, with E. coli serving as the bacterial control. The study outcomes will contribute to the broader adoption of safe, sustainable methods for synthesizing biogenic iron nanoparticles and to their use in environmental applications, including water disinfection.
2. Materials and Methods
2.1. Materials
FeSO4·7H2O (Meyer, Ciudad de Mexico, Mexico >99%), Moringa oleifera dry leaf powder (Hieba dorada, Puebla, Mexico) and seed (Hieba dorada, Puebla, Mexico), Methanol (Karal, Guanajuato, Mexico), NaNO2, AlCl3·6H2O (Fermont, Monterrey, Mexico 99.5%), NaOH (Karal, 97%), Folin’s reagent (Merck, Ciudad de Mexico, Mexico, 2N concerning acid), Na2CO3, Bradford reagent (Biorad, Ciudad de Mexico, Mexico), Bovine Serum Albumin (BSA) (Biorad, Ciudad de Mexico, Mexico), Quercetin (Sigma, Ciudad de Mexico, Mexico ≥95%), Gallic Acid (Sigma, Ciudad de Mexico, Mexico ≥98%), Glucose (Sigma, Ciudad de Mexico, Mexico ≥98%), Anthrone (Sigma, Ciudad de Mexico, Mexico 97%), 96% v/v ethanol (Karal, Guanajuato, Mexico), Sulfuric acid (Fisher Scientific, Ciudad de Mexico, Mexico, 93–98%) used were reagent grade. All the reagents were used as received.
2.2. Preparation of Moringa Oleifera Extract
Variations in biomass (i.e., dry leaf powder and seed) and extraction techniques (e.g., infusion, salting-out, infusion-salting-out) were used to obtain six different extracts. An infusion method was used for the first extract. Dried and pulverized M. oleifera biomass (i.e., leaf or seed) was added to distilled water at a concentration of 0.1 g mL−1, heated to 80 °C, and stirred for 1 h. For the second extract, a salting-out method was used: a 5% saline solution was prepared, M. oleifera biomass powder was added at a concentration of 0.1 g mL−1, and the mixture was stirred for 1 h at room temperature. Finally, a mixture of the two methods was used to prepare the third extract. The solution was prepared following the salting-out method steps, but was stirred for 1 h at 80 °C.
2.3. Biogenic Synthesis
A solution of FeSO4·7H2O [0.1 M] was prepared and added to the extract at a 2:8 volumetric ratio to 15 mL Falcon tubes. The samples were stirred for 48 h. Finally, the samples were separated into various tubes, each containing 1 mL, and lyophilized for 24 h to characterize the resulting material.
2.4. Extract Characterization
For the extract characterization, the total flavonoid, total polyphenol, protein, and total carbohydrate concentrations were analyzed using modified methodologies of AlCl3 [23], the Folin–Ciocalteu method [24], the Bradford method [25,26,27], and the Anthrone method [28], respectively. For the assays, six replicates were performed: two statistical duplicates and three biological triplicates. All were measured for absorbance using a Thermo Scientific MULTISKAN SkyHigh instrument (Thermo Scientific, Paisley, UK) in a 96-well microplate. Finally, the absorbance values obtained from the samples were substituted into the equation obtained from the calibration curve prepared for each test.
2.4.1. Determination of Flavonoid Concentration
For the flavonoid concentration determination, the samples were initially pretreated. The samples were lyophilized and mixed with 70% methanol at a ratio of 1 mL per 50 mg. Secondly, the samples were stirred for 24 h in the dark at room temperature and then centrifuged at 10,000 rpm for 15 min to recover the supernatant. The process was repeated until a clear solution, free of suspended particles, was obtained.
Once the samples were pretreated, 12.5 μL of the sample in methanol was placed on the plate to quantify flavonoids, and 7.5 μL of 5% NaNO2 was added. The samples were incubated for 5 min at room temperature in the dark. Subsequently, 15 µL of 10% AlCl3·6H2O was added, and the mixture was incubated for 5 min at room temperature in the dark. Finally, 50 μL of NaOH [1 M] and 165 μL of sterile distilled H2O were added. The samples were measured at 510 nm. A calibration curve was prepared from a stock solution of quercetin at 0.5 mg mL−1, following the method described in the Supporting Information.
2.4.2. Determination of Polyphenol Concentration
The samples were pretreated for polyphenol analysis by adding 250 µL of 70% methanol to the lyophilized sample in an Eppendorf tube and stirring in the dark for 24 h. The samples were then centrifuged for 15 min at 10,000 rpm to recover the supernatant. Once the samples were pretreated, 237 µL of sterile distilled water, 45 µL of 15% Na2CO3, and 15 µL of 10% Folin’s reagent were added to 3 µL of the sample containing methanol. The mixture was incubated at room temperature for 5 min in dark conditions. Finally, the samples were measured at 760 nm. Similarly, a calibration curve was prepared using a stock solution of gallic acid at 2 mg mL−1, as described in the Supporting Information.
2.4.3. Determination of Protein Concentration
For the Determination of protein concentration, the lyophilized samples were resuspended by vortex shaking in sterile distilled water. Then, 10 μL of the resuspended samples were placed in their respective wells, and 200 μL of a Bradford reagent solution prepared in a 1:4 volumetric ratio was added. These were incubated in dark conditions for 5 min at room temperature. Finally, the samples were measured at 595 nm. Similarly, a calibration curve was prepared using a Bovine Serum Albumin (BSA) stock solution at 2 mg mL−1 and following the method described in the Supporting Information.
2.4.4. Determination of Total Carbohydrate Concentration
For the total carbohydrate concentration, the lyophilized samples were pretreated by mixing with 96% ethanol at a ratio of 1.5 mL per 100 mg and incubated at 4 °C for 15 min. Then, 40 µL of the pretreated sample, 100 µL of an anthrone solution, and a 2 mg mL−1 H2SO4 solution were added to each well. The plate was incubated at 92° C for 3 min in a water bath and left at room temperature for 5 min. Then, it was dried in an oven at 45° C for 15 min. Finally, the samples were measured at 630 nm. The calibration curve was performed using a 0.4 g L−1 glucose stock solution and following the method described in the Supporting Information.
2.5. Characterization of Nanomaterials
For UV-visible spectral analysis, Moringa oleifera leaf extract was analyzed before and after biogenic synthesis. For the analysis, 10 mg of the lyophilized sample was resuspended in 3 mL of distilled water and scanned from 200 to 900 nm using a Thermo Scientific Evolution 300 UV-Vis spectrophotometer (Thermo Scientific, Paisley, UK). Fourier transform infrared spectroscopy was performed using a Thermo Scientific Nicolet iS10 FT-IR ATR (Nicolet iS10, Thermo Fisher Scientific, Waltham, MA, USA) on solid samples over the range 500–4000 cm−1.
Scanning electron microscopy (SEM) and X-ray energy-dispersive spectroscopy (EDS) were performed to characterize the material’s morphology and elemental composition. For the SEM-EDS analysis, a JEOL JXA-8530F (EPMA, Peabody, MA, USA) was used. The equipment was operated at 15 kV, with micrographs taken at 1000 to 2000 magnifications, producing a scale of 25 to 2.5 mm, while the EDS analysis was performed using the same microscope at 15 kV.
XPS nanoparticles were measured at a temperature of 25 °C in an ESCALAB 250 Xi (Thermo Scientific, Paisley, UK) using Kα excitation radiation (hm = 1486.6 eV). The pass energy was set at 4.2 eV. The angle employed was 45°, and the vacuum pressure of analysis was ~10–8 mbar. Raman spectroscopy characterization was performed using a Horiba LabRAM HR Evolution spectrometer (Horiba Jobin Yvon, Longjumeau, France). Spectra were acquired in the range from 200 to 1100 cm−1 using a helium-neon (He-Ne) 632.8 laser as excitation source. Additionally, a signal deconvolution was performed to identify the sub-bands present using OriginPro 8.5 software.
For the micrographs, a sample dispersion was prepared in isopropyl alcohol and placed on copper grids with a continuous carbon membrane (200 mesh), and subsequently characterized by transmission electron microscopy (TEM) on a Hitachi 7700 (Hitachi, Tokyo, Japan), operated at an accelerating voltage of 120 kV.
2.6. Antimicrobial Activity Test
After synthesis, the antibacterial activity of all samples was assessed against E. coli ATCC 8739 using a microdilution assay. For this purpose, a 96-well plate was used, and samples from the six extracts before and after synthesis were prepared at dilution factors of 2, 4, 8, 16, and 32. Subsequently, 100 μL of E. coli inoculum, whose absorbance was equal to the absorbance of 0.5 on the McFarland scale, was added to each solution and was left to incubate for 24 h. Additionally, the concentrated sample, culture, and inoculum were incubated as controls. After 24 h of incubation, the samples’ absorbance was measured at 625 nm. All tests and controls were performed in triplicate.
2.7. Multivariate Statistical Analysis
The data analysis was undertaken using Principal Component Analysis (PCA), which is a statistical technique used to assess similarities between samples in a data set visually [29], as well as a Hierarchical Cluster Analysis (HCA), and Preference Ranking Organization Method for Enrichment Evaluations (PROMETHEE), together with Graphical Analysis for Interactive Assistance (GAIA). These methods are described in the Supporting Information [30,31].
3. Results and Discussion
3.1. Characterization of the Extract
The samples were labeled according to the biological source and the extraction method used to obtain them. Accordingly, samples will be referred to as follows: Leaf extract prepared via infusion, labeled as IH; the biomass using salting-out was labeled as SH, and the combination of both methods using leaf powder is referred to as SIH. Samples using the same methods but incorporating seed powder instead of leaf powder were labeled IS, SS, and SIS, respectively. Iron nanoparticles (FeNPs) prepared from each extract were labeled by adding the extract’s name, e.g., FeNPs-IH, FeNPs-SH, FeNPs-SIH, FeNPs-IS, FeNPs-SS, and FeNPs-SIS (Figure 1).
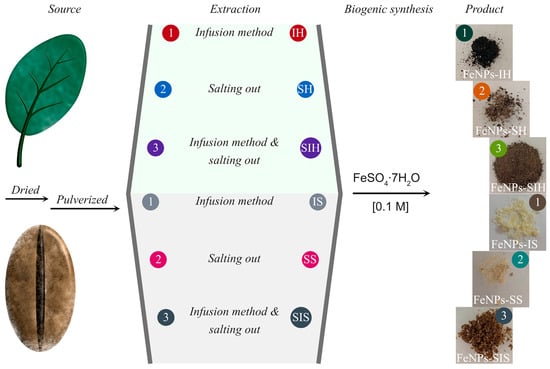
Figure 1.
Schematic of the various materials produced using different biomass and extraction methods, Infusion method Leaf (IH), Salting out Leaf (SH), Infusion method & salting out Leaf (SIH), Infusion method Seed (IS), Salting out Seed (SS), Infusion method & salting out Seed (SIS).
The biogenic synthesis of nanoparticles (NPs) typically requires reducing agents, capping agents, stabilizers, and a reaction medium. For plant extracts, a wide range of biomolecules can be used to synthesize nanoparticles. Proteins, polyphenols, carbohydrates, and flavonoids are molecules of interest due to their potential as reducers, stabilizers, and coatings [32]. The concentrations of the molecules mentioned above in the six extracts were determined. Table 1 presents the average concentrations of total protein, polyphenols, flavonoids, and carbohydrates for each extract.

Table 1.
Average concentrations of total flavonoids, proteins, total polyphenols, and total carbohydrates present in the Moringa oleifera extracts.
Leaf extracts tended to have higher concentrations of polyphenols and flavonoids than seed extracts, similar to the results obtained by Patil et al. [33], in which the concentration of flavonoids and polyphenols of MO leaf extract was found to be significantly higher than in the seed extract. Additionally, the other biomolecules obtained are highlighted because they have been reported to be involved in NPs production using a biogenic method. For example, Adil et al. [34] reported that flavonoids and polyphenols are reducing and stabilizing agents, while Sidhu et al. [35] noted that polysaccharides serve as coating agents or reagents in the production pathway, albeit not exclusively.
A PCA was undertaken to identify correlations between extraction conditions and biomolecules (Figure 2). The results showed that the concentrations of carbohydrates (TS) and proteins (TP) are strongly correlated, as evidenced by the acute angle between the vectors. Additionally, both are correlated with Temperature (Temp), meaning that extractions conducted at higher temperatures would yield higher yields of these two types of biomolecules. In the case of TS, this is because the solubility of carbohydrates and polysaccharides increases with rising temperature, making it easier for the molecules to be transported into the aqueous phase during infusion [36,37]. Similarly, proteins can be extracted by thermal treatment [38]. However, to achieve significant yields, more advanced techniques are required (such as enzyme-assisted extractions, microwave, ultrasound, pulse electric field, and high-pressure homogenization) [39]. This explains why protein concentrations in all extracts were low and did not tend to vary.
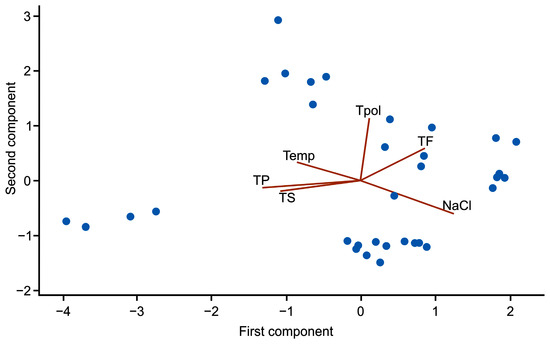
Figure 2.
PCA of the extraction conditions and the biomolecules obtained.
In contrast, neither TF nor Tpol is strongly correlated with temperature. However, this does not necessarily mean that temperature does not affect phenolic compound extraction; rather, it may aid the extraction of certain compounds while simultaneously reducing the extraction of others. An example of this is shown by Li et al. [40], who determined that thermal processing increases the content of insoluble-bound phenolic compounds while significantly decreasing total soluble phenolic content. These findings are also supported by a recent literature review by Antony & Farid [41], which showed that various studies report fluctuations in total polyphenol and flavonoid concentrations across differing temperature ranges. In this regard, it may be relevant to study extracts prepared at different temperatures to understand their effects on total phenolic compounds better.
Further, flavonoids (TF) are only weakly correlated with NaCl, meaning that salting-out methods aided their extraction, but not for polyphenols (Tpol). These results are supported by a study by Jia et al. [42], which compared different extraction methods and found that salting-out extractions yielded higher flavonoid concentrations and antioxidant activity than Soxhlet extractions, noting that this method requires less organic solvent and a shorter extraction time.
3.2. Characterization of Iron Nanoparticles
Figure S1 displays the UV-vis spectra of the original extracts and the solution after synthesis was carried out. Samples of FeNPs-SIS, Fe-NPs-IH, and FeNPs-SS did not display an increase in absorbance compared to their extracts. FeNPs-SH and FeNPs-SIH samples displayed an absorbance increase after 296 nm.
Figure S2 displays the deconvolution of the FeNPs-SIH. It shows that four signals with similar absorbance are obtained, along with a wide signal with a maximum absorbance of about 0.4 (Figure S2a). Figure S2b shows the deconvolution of FeNPs-SIH, highlighting a shift and an increase in the absorbance of these signals. However, it also displays a new signal with a maximum absorbance peak at 335 nm. Biogenic iron oxide NPs have been shown to exhibit an increase in absorbance between 330 and 350 nm, as reported by Devi et al. [12] when they synthesized Fe3O4 NPs using P. orientalis extract, and by Lakshminarayanan et al. [43] who biogenically synthesized Fe2O3 NPs displaying absorbances at 350 nm and 328 nm, respectively.
Energy-dispersive spectroscopy (EDS) of the samples was performed at three points to determine Fe concentration (Table S1). The FeNPs-IH and FeNPs-SS samples had no Fe when analyzed. The lack of Fe in sample FeNPs-SS is due to insufficient stabilizing agents in the extract, as evidenced by the low concentration of flavonoids, which leads to agglomeration and precipitation of the oxidized iron. A similar phenomenon was observed by Baruah et al. [17] by varying the amount of extract used in the biogenic synthesis of nanoparticles. In that study, the researchers noted that the low extract amounts led to agglomeration and, in one case, to the precipitation of the synthesized particles. Similarly, the insufficient capping and stabilizing agents in the FeNPs-IH extract would not have allowed for adequate capping, leading to microparticle formation that precipitates rather than nanoparticles.
EDS analyses showed that samples of FeNPs-SIS, FeNPs-IS, and FeNPs-SH indicate the presence of Fe, albeit at low concentrations (i.e., between 0.35% and 0.44% on average). It is important to note that FeNPs-SIS had the lowest overall concentration, which explains why an absorbance increase was not observed in earlier tests. Low Fe concentrations in these three samples are attributed to the same reasons as those discussed above for FeNPs-IH and FeNPs-SS. However, FeNPs-SIH displayed a higher Fe concentration than all the other samples, averaging 22.77%, which is similar to the results reported by Kahlil et al. [4], who synthesized Fe3O4 nanoparticles using stevia plant extract and reported 33.64% Fe. Additionally, the increase in iron content due to higher bioactive compound levels isupported by the findings of Carvalho & Carvalho [44]. In that study, the researchers observed an increase in iron content (i.e., from 1.81 wt% to 4.17 wt%) of biogenic nanoparticles when the extract volume was doubled. This supports the conclusion that an adequate concentration of capping-stabilizing agent is required to biogenically synthesize NPs, as is also true for their chemical counterparts.
A PCA was undertaken to determine the correlation between Fe presence and the capping and stabilizing agents (i.e., biomolecules) (Figure 3). Results showed that Fe% in the samples correlates positively with TPol and TF (acute angles between vectors) but not with TP or TS (obtuse angles with these vectors), suggesting that polyphenols and flavonoids may be more actively involved in the capping and stabilization of the nanoparticles rather than carbohydrates. These conclusions are supported by a previous study by Jegadeesan et al. [45], who investigated the total phenolic content and reducing power of various extracts used for biogenic Fe nanoparticle synthesis. The researchers noted that the extract with the higher polyphenol concentration had greater reducing power and yielded the maximum nanoparticles and the highest iron percentage.
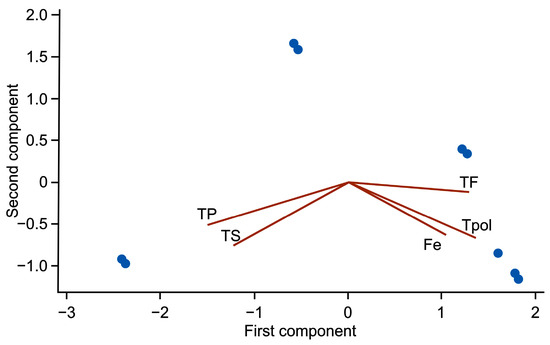
Figure 3.
PCA of Fe% and biomolecules.
Figure 4 illustrates the TEM micrographs of the nanoparticles of the four samples mentioned in Table S1. Figure 4a shows irregularly shaped, polydisperse nanoparticles with an average size of 63.77 ± 21.98 nm and smoother, more defined borders than those of the other samples. In Figure 4b,c, nanoparticles surrounded by mainly sponge-like structures can be observed. Figure 4d confirms that insufficient capping agent leads to agglomeration and the subsequent formation of microstructures rather than nanostructures. Further analyses were carried out on FeNPs-SIH. The general mapping shown in Figure S3 indicates that Fe is homogeneously distributed throughout the sample’s organic matrix.
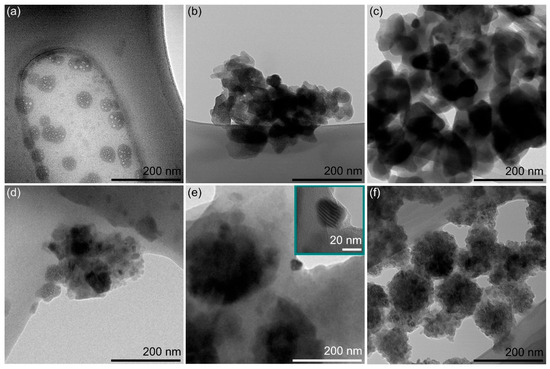
Figure 4.
TEM micrographs of (a) FeNPs-IH, (b) FeNPs-SH, (c) FeNPs-SIH, (d) FeNPs-IS, (e) FeNPs-SS, and (f) FeNPs-SIS.
The micrographs exhibit various morphologies because each method yields a different concentration of flavonoids and polyphenols, as shown in Table 1. For example, the polyphenol content in IH is higher compared to the other extracts. Therefore, it is evident that there is no stabilization of FeNPs-IH due to the hydrophobic nature of polyphenols. In contrast, the SH sample has the highest flavonoid concentration among the extracts, indicating agglomeration of FeNPs-SH. Both samples were obtained from the leaves utilizing the infusion method and salting out. Nonetheless, the combination of these methods produces close concentrations of flavonoids and polyphenols, favoring the synthesis of FeNPs-SIH. These results confirm that an adequate concentration of a capping-stabilizing agent is required to synthesize FeNPs biogenically.
Figure S4 corresponds to the FT-IR analysis of FeNPs-SIH and SIH samples. Similar absorbance peaks are observed between the two extracts, corresponding to the extract with nanoparticles and the pure extract. Both show broad bands at 3310 cm−1 corresponding to the stretching of O-H groups [46], a signal at 2931 cm−1 attributed to asymmetric stretching of C-H groups found in aliphatic carbon compounds [47], and peaks around 1617 cm−1 corresponding to C=C stretching of aromatic rings [48]. Both samples also displayed peaks at 1395 cm−1 and 1105 cm−1, associated with C-O stretching vibrations [8,49,50]. The bands identified are typically associated with the organic capping present in biogenic nanoparticles. Finally, the appearance of a signal at 620 cm−1 was identified in the FeNPs-SIH (Figure S4a) and is attributed to the stretching of Fe-O groups [46,50].
To obtain more in-depth information about the structure of the synthesized NPs, an XPS analysis of the sample FeNPs-SIH was carried out, as well as a deconvolution of its signals (Figure 5). From this process, binding peaks were observed at 727.9, 726.1, 723, 710.5, and 708.9 eV, characteristic of Fe 2p1/2 and 2p3/2, respectively, and commonly associated with Fe2O3 and Fe3O4 [51,52]. These results are supported by the findings of Sharmila et al. [53] who synthesized α-Fe2O3 biogenic nanoparticles and observed binding energies of 711.4 and 724.5 eV. Similar results were also observed by Sundar & Ganesh [54] when analyzing γ-Fe2O3 nanostructures (i.e., binding energies of ~710.5 and 724.8 eV).
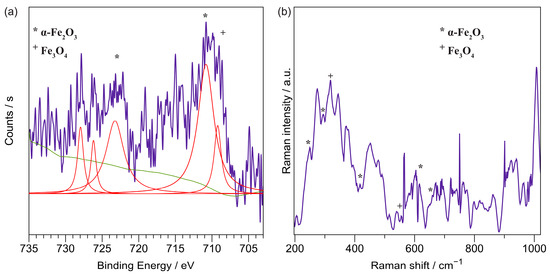
Figure 5.
(a) XPS spectrum of the FeNPs-SIH (Blue line), its deconvolution (red line) and deconvolution baseline (green line); (b) Raman spectrum of the FeNPs-SIH.
Raman spectroscopy is another spectroscopic technique for characterizing these nanoparticles. The seven peaks characteristics of hematite are at 229 (A1g), 249 (Eg), 295 (Eg), 302 (Eg), 414 (Eg), 500 (A1g), 615 (Eg), 660 (LO Eu); while the magnetite displays at 310 (T2g), 554 (T2g) and 672 (A1g) according to Jubb and Allen [55]. In this study, the peaks were found at 249, 295, 318, 343, 370, 378, 418, 453, 556, 566, 616, 660, and 671 cm−1; therefore, this methodology produces hematite (α-Fe2O3) and magnetite (Fe3O4).
3.3. Antibacterial Performance Against E. coli
For inhibition analysis, the absorbance of all samples was compared with that of E. coli growth, which was 0.421 ± 0.9. The FeNPs-SIH extract showed a lower absorbance than the E. coli control for all dilution factors (Figure S5). However, a zero absorbance value, indicating the absence of bacterial growth, was observed only up to a dilution factor of 4, suggesting that at this dilution the nanoparticles are most effective at inhibiting E. coli growth.
Samples FeNPs-SH and FeNPs-IS also displayed absorbances lower than that of the control. However, the lowest values, 0.241 and 0.227, respectively, observed for the 2-fold dilution were still twice as high as those for FeNPs-SIH. This could be because the samples, while still functional, are less efficient at inhibiting E. coli growth due to their low iron content. These results confirm conclusions from previously reported studies [4,56], i.e., that high concentrations of nanoparticles are required to inhibit the growth of E. coli.
In samples that did not show an absorbance below 0.412, absorbance values were high at the start and then decreased to a value similar to that of the control after dilution. This is attributed to the nutrients provided by the extract, which allowed for increased bacterial growth, and to the greater sample dilution, which made the environment more similar to the culture medium. In addition, the extract samples were tested according to the same methodology. Samples IH, SH, and IS showed lower absorbance values than the E. coli control at dilution factors of 2 and 4, confirming the antibacterial properties of M. oleifera [57].
Finally, GAIA plots were used to identify the best overall sample for inhibiting E. coli growth. A total of 36 samples were used (i.e., triplicates of the nanoparticles that were synthesized from the extracts listed in Table S1), and the extracts used for each sample are listed in Table S2.
GAIA plots given in Figure 6 were generated using iron percentage and absorbance data (i.e., the first 12 samples in Table S2) using nanoparticle samples, which displayed the presence of iron in elemental analysis.
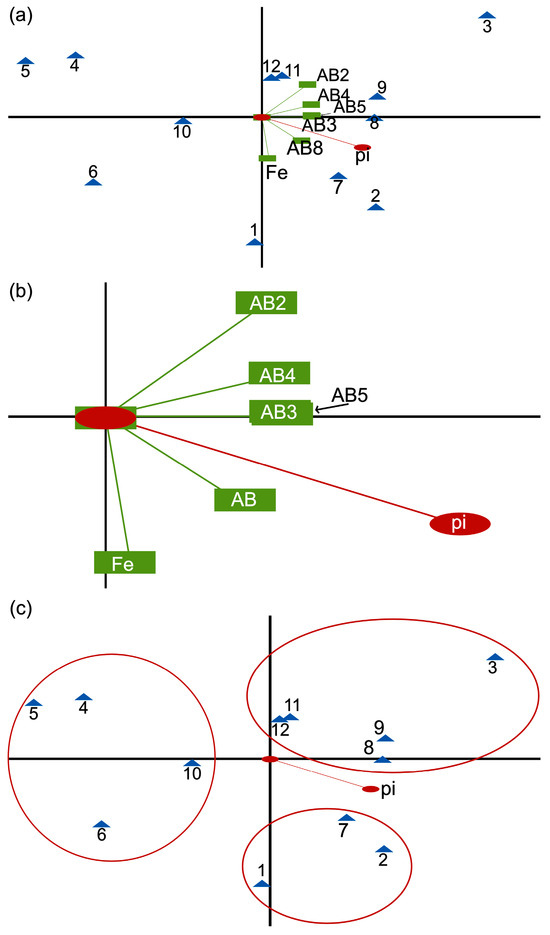
Figure 6.
(a) GAIA plots based on iron percentage and absorbance of the first 12 samples (blue triangle); (b) Isolation of the relationships among the variables; (c) Isolation of the relationships among the samples.
For this analysis (Figure 6a), the iron was maximized (i.e., higher concentrations were preferred) while the absorbances were minimized (i.e., lower absorbances were preferred). The triangles represent the samples (or measurements) while the vectors represent the variables—Fe and absorbance modes. The red pi line is the decision axis; the best measurements are in the direction of this axis, and the worst measurements are positioned in the opposite direction. Figure 6a shows how the samples are related to each other, and the percentage of variance explained by the first two principal components is 86.05%.
Figure 6b shows the isolation of the relationships among the variables from those displayed in Figure 6a. This plot is the equivalent of a loadings plot. The variable with the highest correlation with iron is AB8 (i.e., the absorbance at a dilution factor of 8). Therefore, it is the absorbance that enhanced Fe the most. AB8 also had the highest correlation to the decision axis (pi). However, all other absorbance modes correlate well with each other.
Figure 6c shows the isolation of the relationships among the samples from those displayed in Figure 6b. This plot is the equivalent of a scores plot. There are broadly three clusters—with one consisting of samples 5, 4, 6, and 10; another consisting of samples 1, 7, and 2; and the last consisting of samples 8, 9, 3, 11, and 12. However, sample 3 is the most preferred, being in the direction of the decision axis, pi, and farthest from the origin. This result is also confirmed by the PROMETHEE analysis (Figure S6), where the best-ranked samples are on the left and the worst on the right.
In Figure 7, the GAIA plot used biomolecules and absorbance data for the 12 samples, with the biomolecules maximized and absorbance minimized. Figure 7a shows that the first two PCs explain 86.02% of the variance, and the plot shows how the variables are related to each other. In this case, TF and TPOL are correlated and broadly negatively correlated with TP. Additionally, Figure 7b displays three clusters (red circles): one consisting of samples 7, 8, and 9; another consisting of samples 4, 5, and 6; and the third consisting of the remaining samples. As in Figure 6, sample 3 is the most preferred, as confirmed by the PROMETHEE analysis (Figure S7).
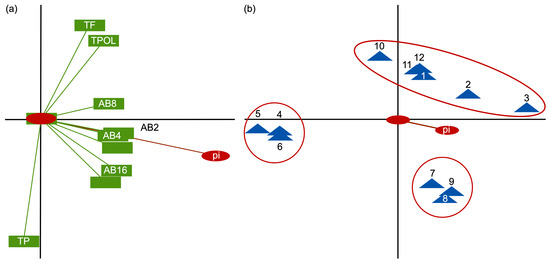
Figure 7.
GAIA plots based on biomolecule concentration and absorbance of the first 12 samples (blue triangle). (a) Isolation of the relationships among the variables; (b) Isolation of the relationships among the samples.
In Figure 8, the GAIA plot used biomolecules and absorbance data for all 12 samples, with the biomolecules maximized and absorbance minimized, and has a 72.23% percentage of variance explained by the first two PCs. Both plots show how the samples are related to each other, and the variables are related to each other and the samples. Once again, sample 3 was the best-ranked, as confirmed by the PROMETHEE analysis of the 36 samples (Figure S8). Results from all PROMETHEE and GAIA analyses confirmed that a sample of nanoparticles prepared using SIH extract was the best overall for inhibiting E. coli growth.
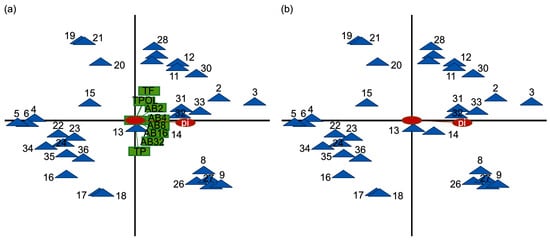
Figure 8.
GAIA plots based on biomolecule concentration and absorbance of all 36 samples (blue triangle). (a) Isolation of the relationships among the variables; (b) Isolation of the relationships among the samples.
4. Conclusions
Based on the research undertaken, an optimized process for extracting biomolecules from MO leaves is proposed: simple, scalable, and free of toxic reagents. The following conclusions were derived from the study:
Multivariate statistical analysis showed that salting-out extractions are preferable for obtaining phenolic compounds compared to infusion extractions. This implies that, though it is the most popular method of extraction in biogenic synthesis, other methods may be more efficient for obtaining these biomolecules.
Though many biomolecules in plant extract are cited as being associated with biogenic synthesis, not all biomolecules are required to form different types of nanoparticles. The iron content present is related to the amount of polyphenols and flavonoids present in the extract.
Iron oxide nanoparticles with a high iron content are effective at inhibiting E. coli growth. Therefore, the effectiveness of the synthesized iron oxide nanoparticles is dose-dependent. Material synthesized with the salting-out-infusion extract using leaf biomass had optimal characteristics, including maintaining low absorbance of E. coli.
Overall, both the effectiveness of the synthesis and the application are related to the conditions of extract preparation. This underlines the need for further research on extract preparation in biogenic synthesis, as this step influences the effectiveness and, therefore, scaling-up possibilities of this method.
Supplementary Materials
The following supporting information can be downloaded at: https://www.mdpi.com/article/10.3390/suschem7010004/s1, Methodology; Figure S1: UV-vis spectra of (a) FeNPs-SIH, (b) FeNPs-SH, (c) FeNPs-SIH, (d) FeNPs-IS, (e) FeNPs-SS and (f) FeNPs-SIS and their respective extracts.; Figure S2: Deconvolution of UV-vis spectra of (a) SIH extract and (b) FeNPs-SIH.; Figure S3. (a) SEM image and mapping of (b) Fe and (c) O in FeNPs-SIH; Figure S4. FT-IR of (a) FeNPs-SIH, (b) FeNPs-SH, (c) FeNPs-SIH, (d) FeNPs-IS, (e) FeNPs-SS and (f) FeNPs-SIS and their respective extracts; Figure S5. Absorbance values of nanoparticles at different dilution factors; Figure S6. PROMETHEE plot using iron and absorbance data of the first 12 samples; Figure S7. PROMETHEE plot using biomolecules and absorbance data of the first 12 samples; Figure S8. PROMETHEE plot using biomolecules and absorbance data of all 36 samples; Table S1: Elemental analysis of nanoparticles synthesized in the various extracts; Table S2. Sample ID numbers used for statistical analysis.
Author Contributions
Conceptualization, O.M.R.-N., N.V.-E. and L.F.M.-G.; methodology, A.V.-R. and A.S.C.-D.; software, G.A.A.; validation, O.M.R.-N., A.S.C.-D. and E.B.; formal analysis, N.V.-E., A.V.-R., O.M.R.-N. and L.F.M.-G.; investigation, O.M.R.-N., N.V.-E. and L.F.M.-G.; resources, O.M.R.-N. and A.V.-R.; data curation, G.A.A.; writing—original draft preparation, N.V.-E., L.F.M.-G. and A.S.C.-D.; writing—review and editing, A.G., E.B. and O.M.R.-N.; supervision, O.M.R.-N. All authors have read and agreed to the published version of the manuscript.
Funding
This research received no external funding.
Institutional Review Board Statement
Not applicable.
Informed Consent Statement
Not applicable.
Data Availability Statement
The original contributions presented in this study are included in the article/Supplementary Material. Further inquiries can be directed to the corresponding authors.
Acknowledgments
O.M. Rodriguez-Narvaez, Alain S. Conejo-Dávila, Neali Valencia-Espinoza, Alejandro Vega-Rios and Luisa F., Medina-Ganem would like to thank SECIHTI for the fellowship to undertake this research study. Additionally, the authors wish to thank the Laboratorio Nacional de Nanotecnología (Nanotech), in particular to Raúl Ochoa for the TEM micrographs, Pedro Piza and Mónica Mendoza Duarte for technical support.
Conflicts of Interest
Erick Bandala is employed by DASCO Inc. and Alain Salvador Conejo-Dávila is employed by MicroPrime S. R. L. de C.V. All authors declare no conflicts of interest.
Abbreviations
The following abbreviations are used in this manuscript:
| MO | Moringa oleifera |
| NPs | Nanoparticles |
| FeNPs-IH | Iron nanoparticles synthesized from infusion method using leaves |
| FeNPs-SH | Iron nanoparticles synthesized from salting out using leaves |
| FeNPs-SIH | Iron nanoparticles synthesized from infusion method & salting out using leaves |
| FeNPS-IS | Iron nanoparticles synthesized from infusion method using seeds |
| FeNPs-SS | Iron nanoparticles synthesized from salting out using seeds |
| FeNPs-SIS | Iron nanoparticles synthesized from infusion method & salting out using seeds |
References
- Cunha, F.A.; da C.S.O. Cunha, M.; da Frota, S.M.; Mallmann, E.J.J.; Freire, T.M.; Costa, L.S.; Paula, A.J.; Menezes, E.A.; Fechine, P.B.A. Biogenic Synthesis of Multifunctional Silver Nanoparticles from Rhodotorula Glutinis and Rhodotorula Mucilaginosa: Antifungal, Catalytic and Cytotoxicity Activities. World J. Microbiol. Biotechnol. 2018, 34, 127. [Google Scholar] [CrossRef]
- Al-Issai, L.; Elshorbagy, W.; Maraqa, M.A.; Hamouda, M.; Soliman, A.M. Use of Nanoparticles for the Disinfection of Desalinatedwater. Water 2019, 11, 559. [Google Scholar] [CrossRef]
- Madubuonu, N.; Aisida, S.O.; Ali, A.; Ahmad, I.; Zhao, T.k.; Botha, S.; Maaza, M.; Ezema, F.I. Biosynthesis of Iron Oxide Nanoparticles via a Composite of Psidium Guavaja-Moringa Oleifera and Their Antibacterial and Photocatalytic Study. J. Photochem. Photobiol. B 2019, 199, 111601. [Google Scholar] [CrossRef]
- Khalil, A.T.; Ovais, M.; Ullah, I.; Ali, M.; Khan Shinwari, Z.; Maaza, M. Biosynthesis of Iron Oxide (Fe2O3) Nanoparticles via Aqueous Extracts of Sageretia thea (Osbeck.) and Their Pharmacognostic Properties. Green Chem. Lett. Rev. 2017, 10, 186–201. [Google Scholar] [CrossRef]
- Gudkov, S.V.; Burmistrov, D.E.; Serov, D.A.; Rebezov, M.B.; Semenova, A.A.; Lisitsyn, A.B.; Serov, D.E.; Rebezov, D.A.; Semenova, M.B.; Lisitsyn, A.A.; et al. Do Iron Oxide Nanoparticles Have Significant Antibacterial Properties? Antibiotics 2021, 10, 884. [Google Scholar] [CrossRef]
- Ijaz, I.; Gilani, E.; Nazir, A.; Bukhari, A. Detail Review on Chemical, Physical and Green Synthesis, Classification, Characterizations and Applications of Nanoparticles. Green Chem. Lett. Rev. 2020, 13, 59–81. [Google Scholar] [CrossRef]
- Ramírez-Sánchez, I.M.; Bandala, E.R. Photocatalytic Degradation of Estriol Using Iron-Doped TiO2 under High and Low UV Irradiation. Catalysts 2018, 8, 625. [Google Scholar] [CrossRef]
- Khan, Y.; Ahmad, A.; Ahmad, N.; Mir, F.R.; Schories, G. Biogenic Synthesis of a Green Tea Stabilized PPy/SWCNT/CdS Nanocomposite and Its Substantial Applications, Photocatalytic Degradation and Rheological Behavior. Nanoscale Adv. 2020, 2, 1634–1645. [Google Scholar] [CrossRef]
- Adeeyo, A.O.; Odiyo, J.O. Biogenic Synthesis of Silver Nanoparticle from Mushroom Exopolysaccharides and Its Potentials in Water Purification. Open Chem. J. 2018, 5, 64–75. [Google Scholar] [CrossRef]
- Khan, Y.; Sadia, H.; Ali Shah, S.Z.; Khan, M.N.; Shah, A.A.; Ullah, N.; Ullah, M.F.; Bibi, H.; Bafakeeh, O.T.; Ben Khedher, N.; et al. Classification, Synthetic, and Characterization Approaches to Nanoparticles, and Their Applications in Various Fields of Nanotechnology: A Review. Catalysts 2022, 12, 1386. [Google Scholar] [CrossRef]
- Irum, S.; Jabeen, N.; Ahmad, K.S.; Shafique, S.; Khan, T.F.; Gul, H.; Anwaar, S.; Shah, N.I.; Mehmood, A.; Hussain, S.Z. Biogenic Iron Oxide Nanoparticles Enhance Callogenesis and Regeneration Pattern of Recalcitrant Cicer arietinum L. PLoS ONE 2020, 15, e0242829. [Google Scholar] [CrossRef]
- Devi, H.S.; Boda, M.A.; Shah, M.A.; Parveen, S.; Wani, A.H. Green Synthesis of Iron Oxide Nanoparticles Using Platanus Orientalis Leaf Extract for Antifungal Activity. Green Process. Synth. 2019, 8, 38–45. [Google Scholar] [CrossRef]
- Attallah, N.G.M.; Elekhnawy, E.; Negm, W.A.; Hussein, I.A.; Mokhtar, F.A.; Al-Fakhrany, O.M. In Vivo and In Vitro Antimicrobial Activity of Biogenic Silver Nanoparticles against Staphylococcus Aureus Clinical Isolates. Pharmaceuticals 2022, 15, 194. [Google Scholar] [CrossRef]
- Ortiz-Tirado, A.; Medina-Ganem, L.F.; Bandala, E.R.; Conejo-Davila, A.S.; Vega-Rios, A.; Goonetilleke, A.; Rodriguez-Narvaez, O.M. Biogenic Nanoparticles: Synthesis, Characterization, Applications and Scaling up Limitations in Water Treatment. J. Environ. Chem. Eng. 2025, 13, 117730. [Google Scholar] [CrossRef]
- Kiwumulo, H.F.; Muwonge, H.; Ibingira, C.; Lubwama, M.; Kirabira, J.B.; Ssekitoleko, R.T. Green Synthesis and Characterization of Iron-Oxide Nanoparticles Using Moringa Oleifera: A Potential Protocol for Use in Low and Middle Income Countries. BMC Res. Notes 2022, 15, 149. [Google Scholar] [CrossRef]
- Singh, K.; Nancy; Singh, G.; Singh, J. Sustainable Synthesis of Biogenic ZnO NPs for Mitigation of Emerging Pollutants and Pathogens. Environ. Res. 2023, 219, 114952. [Google Scholar] [CrossRef]
- Baruah, D.; Goswami, M.; Yadav, R.N.S.; Yadav, A.; Das, A.M. Biogenic Synthesis of Gold Nanoparticles and Their Application in Photocatalytic Degradation of Toxic Dyes. J. Photochem. Photobiol. B 2018, 186, 51–58. [Google Scholar] [CrossRef]
- Balasubramanian, S.; Kala, S.M.J.; Pushparaj, T.L. Biogenic Synthesis of Gold Nanoparticles Using Jasminum Auriculatum Leaf Extract and Their Catalytic, Antimicrobial and Anticancer Activities. J. Drug. Deliv. Sci. Technol. 2020, 57, 101620. [Google Scholar] [CrossRef]
- Katata-Seru, L.; Moremedi, T.; Aremu, O.S.; Bahadur, I. Green Synthesis of Iron Nanoparticles Using Moringa Oleifera Extracts and Their Applications: Removal of Nitrate from Water and Antibacterial Activity against Escherichia coli. J. Mol. Liq. 2018, 256, 296–304. [Google Scholar] [CrossRef]
- Pasieczna-Patkowska, S.; Cichy, M.; Flieger, J. Application of Fourier Transform Infrared (FTIR) Spectroscopy in Characterization of Green Synthesized Nanoparticles. Molecules 2025, 30, 684. [Google Scholar] [CrossRef]
- Pungle, R.; Nile, S.H.; Makwana, N.; Singh, R.; Singh, R.P.; Kharat, A.S. Green Synthesis of Silver Nanoparticles Using the Tridax Procumbens Plant Extract and Screening of Its Antimicrobial and Anticancer Activities. Oxidative Med. Cell. Longev. 2022, 2022, 9671594. [Google Scholar] [CrossRef]
- Al-Karagoly, H.; Rhyaf, A.; Naji, H.; Albukhaty, S.; Almalki, F.A.; Alyamani, A.A.; Albaqami, J.; Aloufi, S. Green Synthesis, Characterization, Cytotoxicity, and Antimicrobial Activity of Iron Oxide Nanoparticles Using Nigella Sativa Seed Extract. Green Process. Synth. 2022, 11, 254–265. [Google Scholar] [CrossRef]
- Zhang, L.; Ravipati, A.S.; Koyyalamudi, S.R.; Jeong, S.C.; Reddy, N.; Smith, P.T.; Bartlett, J.; Shanmugam, K.; Münch, G.; Wu, M.J. Antioxidant and Anti-Inflammatory Activities of Selected Medicinal Plants Containing Phenolic and Flavonoid Compounds. J. Agric. Food Chem. 2011, 59, 12361–12367. [Google Scholar] [CrossRef]
- Lamuela-Raventós, R.M. Folin–Ciocalteu Method for the Measurement of Total Phenolic Content and Antioxidant Capacity. In Measurement of Antioxidant Activity and Capacity: Recent Trends and Applications; John Wiley & Sons, Inc.: Hoboken, NJ, USA, 2017; pp. 107–115. [Google Scholar] [CrossRef]
- Bradford, M.M. A Rapid and Sensitive Method for the Quantitation of Microgram Quantities of Protein Utilizing the Principle of Protein-Dye Binding. Anal. Biochem. 1976, 72, 248–254. [Google Scholar] [CrossRef]
- Kruger, N.J. The Bradford Method for Protein Quantitation. In The Protein Protocols Handbook; Humana Press: Totowa, NJ, USA, 2002; pp. 15–21. [Google Scholar] [CrossRef]
- Kruger, N.J. The Bradford Method For Protein Quantitation. In The Protein Protocols Handbook; Humana Press: Totowa, NJ, USA, 2009; pp. 17–24. [Google Scholar] [CrossRef]
- Leyva, A.; Quintana, A.; Sánchez, M.; Rodríguez, E.N.; Cremata, J.; Sánchez, J.C. Rapid and Sensitive Anthrone–Sulfuric Acid Assay in Microplate Format to Quantify Carbohydrate in Biopharmaceutical Products: Method Development and Validation. Biologicals 2008, 36, 134–141. [Google Scholar] [CrossRef] [PubMed]
- Ringnér, M. What Is Principal Component Analysis? Nat. Biotechnol. 2008, 26, 303–304. [Google Scholar] [CrossRef]
- Ayoko, G.A.; Singh, K.; Balerea, S.; Kokot, S. Exploratory Multivariate Modeling and Prediction of the Physico-Chemical Properties of Surface Water and Groundwater. J. Hydrol. 2007, 336, 115–124. [Google Scholar] [CrossRef]
- Ayoko, G.A.; Morawska, L.; Kokot, S.; Gilbert, D. Application of Multicriteria Decision Making Methods to Air Quality in the Microenvironments of Residential Houses in Brisbane, Australia. Environ. Sci. Technol. 2004, 38, 2609–2616. [Google Scholar] [CrossRef]
- Bukhari, A.; Ijaz, I.; Gilani, E.; Nazir, A.; Zain, H.; Saeed, R.; Alarfaji, S.S.; Hussain, S.; Aftab, R.; Naseer, Y. Green Synthesis of Metal and Metal Oxide Nanoparticles Using Different Plants’ Parts for Antimicrobial Activity and Anticancer Activity: A Review Article. Coatings 2021, 11, 1374. [Google Scholar] [CrossRef]
- Patil, S.; Chandrasekaran, R. Biogenic Nanoparticles: A Comprehensive Perspective in Synthesis, Characterization, Application and Its Challenges. J. Genet. Eng. Biotechnol. 2020, 18, 67. [Google Scholar] [CrossRef] [PubMed]
- Adil, S.F.; Assal, M.E.; Khan, M.; Al-Warthan, A.; Siddiqui, M.R.H.; Liz-Marzán, L.M. Biogenic Synthesis of Metallic Nanoparticles and Prospects toward Green Chemistry. Dalton Trans. 2015, 44, 9709–9717. [Google Scholar] [CrossRef]
- Sidhu, A.K.; Verma, N.; Kaushal, P. Role of Biogenic Capping Agents in the Synthesis of Metallic Nanoparticles and Evaluation of Their Therapeutic Potential. Front. Nanotechnol. 2022, 3, 801620. [Google Scholar] [CrossRef]
- Cheng, S.; He, F.; Fu, L.; Zhang, Y. Polysaccharide from Rubescens: Extraction, Optimization, Characterization and Antioxidant Activities. RSC Adv. 2021, 11, 18974–18983. [Google Scholar] [CrossRef] [PubMed]
- Wang, Y.; Yang, J.; Li, X.; Yang, J.; Wang, H. Optimization of the Process of Extracting Polysaccharides from Agrocybe Aegerita and In Vitro Antioxidant and Anti-Aging Tests. Molecules 2024, 29, 4992. [Google Scholar] [CrossRef]
- Tamayo Tenorio, A.; Gieteling, J.; De Jong, G.A.H.; Boom, R.M.; Van Der Goot, A.J. Recovery of Protein from Green Leaves: Overview of Crucial Steps for Utilisation. Food Chem. 2016, 203, 402–408. [Google Scholar] [CrossRef] [PubMed]
- Furia, K.A.; Majzoobi, M.; Torley, P.J.; Farahnaky, A. Innovative Approaches in Leaf Protein Extraction: Advancements, Challenges, and Applications in Sustainable Food Formulation and Design. Crit. Rev. Food Sci. Nutr. 2025, 1–33. [Google Scholar] [CrossRef]
- Li, M.; Chen, X.; Deng, J.; Ouyang, D.; Wang, D.; Liang, Y.; Chen, Y.; Sun, Y. Effect of Thermal Processing on Free and Bound Phenolic Compounds and Antioxidant Activities of Hawthorn. Food Chem. 2020, 332, 127429. [Google Scholar] [CrossRef]
- Antony, A.; Farid, M. Effect of Temperatures on Polyphenols during Extraction. Appl. Sci. 2022, 12, 2107. [Google Scholar] [CrossRef]
- Jia, M.Z.; Fu, X.Q.; Deng, L.; Li, Z.L.; Dang, Y.Y. Phenolic Extraction from Grape (Vitis Vinifera) Seed via Enzyme and Microwave Co-Assisted Salting-out Extraction. Food Biosci. 2021, 40, 100919. [Google Scholar] [CrossRef]
- Lakshmnarayanan, S.; Shereen, M.F.; Niraimathi, K.L.; Brindha, P.; Arumugam, A. One-Pot Green Synthesis of Iron Oxide Nanoparticles from Bauhinia Tomentosa: Characterization and Application towards Synthesis of 1, 3 Diolein. Sci. Rep. 2021, 11, 8643. [Google Scholar] [CrossRef]
- Carvalho, S.S.F.; Carvalho, N.M.F. Dye Degradation by Green Heterogeneous Fenton Catalysts Prepared in Presence of Camellia Sinensis. J. Environ. Manag. 2017, 187, 82–88. [Google Scholar] [CrossRef]
- Jegadeesan, G.B.; Srimathi, K.; Santosh Srinivas, N.; Manishkanna, S.; Vignesh, D. Green Synthesis of Iron Oxide Nanoparticles Using Terminalia Bellirica and Moringa Oleifera Fruit and Leaf Extracts: Antioxidant, Antibacterial and Thermoacoustic Properties. Biocatal. Agric. Biotechnol. 2019, 21, 101354. [Google Scholar] [CrossRef]
- Biswas, A.; Vanlalveni, C.; Lalfakzuala, R.; Nath, S.; Rokhum, S.L. Mikania mikrantha Leaf Extract Mediated Biogenic Synthesis of Magnetic Iron Oxide Nanoparticles: Characterization and Its Antimicrobial Activity Study. Mater. Today Proc. 2020, 42, 1366–1373. [Google Scholar] [CrossRef]
- Kirdat, P.N.; Dandge, P.B.; Hagwane, R.M.; Nikam, A.S.; Mahadik, S.P.; Jirange, S.T. Synthesis and Characterization of Ginger (Z. Officinale) Extract Mediated Iron Oxide Nanoparticles and Its Antibacterial Activity. Mater. Today Proc. 2021, 43, 2826–2831. [Google Scholar] [CrossRef]
- Minakshi, M.; Samayamanthry, A.; Whale, J.; Aughterson, R.; Shinde, P.A.; Ariga, K.; Kumar Shrestha, L. Phosphorous—Containing Activated Carbon Derived From Natural Honeydew Peel Powers Aqueous Supercapacitors. Chem. Asian J. 2024, 19, e202400622. [Google Scholar] [CrossRef]
- Bhuiyan, M.S.H.; Miah, M.Y.; Paul, S.C.; Aka, T.D.; Saha, O.; Rahaman, M.M.; Sharif, M.J.I.; Habiba, O.; Ashaduzzaman, M. Green Synthesis of Iron Oxide Nanoparticle Using Carica Papaya Leaf Extract: Application for Photocatalytic Degradation of Remazol Yellow RR Dye and Antibacterial Activity. Heliyon 2020, 6, e04603. [Google Scholar] [CrossRef] [PubMed]
- Schulz, H.; Baranska, M. Identification and Quantification of Valuable Plant Substances by IR and Raman Spectroscopy. Vib. Spectrosc. 2007, 43, 13–25. [Google Scholar] [CrossRef]
- Biesinger, M.C.; Payne, B.P.; Grosvenor, A.P.; Lau, L.W.M.; Gerson, A.R.; St, R.; Smart, C. Applied Surface Science Resolving Surface Chemical States in XPS Analysis of First Row Transition Metals, Oxides and Hydroxides: Cr, Mn, Fe, Co and Ni. Appl. Surf. Sci. 2011, 257, 2717–2730. [Google Scholar] [CrossRef]
- Chastain, J.; King, R.C., Jr. Handbook of X-Ray Photoelectron Spectroscopy; Perkin-Elmer Corporation: Eden Prairie, MN, USA, 1992. [Google Scholar]
- Sharmila, M.; Mani, R.J.; Parvathiraja, C.; Kader, S.M.A.; Siddiqui, M.R.; Wabaidur, S.M.; Islam, M.A.; Lai, W.C. Photocatalytic Dye Degradation and Bio-Insights of Honey-Produced α-Fe2O3 Nanoparticles. Water 2022, 14, 2301. [Google Scholar] [CrossRef]
- Sundar, S.; Ganesh, V. Bio-Assisted Preparation of Efficiently Architectured Nanostructures of γ-Fe2O3 as a Molecular Recognition Platform for Simultaneous Detection of Biomarkers. Sci. Rep. 2020, 10, 15071. [Google Scholar] [CrossRef]
- Jubb, A.M.; Allen, H.C. Vibrational Spectroscopic Characterization of Hematite, Maghemite, and Magnetite Thin Films Produced by Vapor Deposition. ACS Appl. Mater. Interfaces 2010, 2, 2804–2812. [Google Scholar] [CrossRef]
- Aisida, S.O.; Madubuonu, N.; Alnasir, M.H.; Ahmad, I.; Botha, S.; Maaza, M.; Ezema, F.I. Biogenic Synthesis of Iron Oxide Nanorods Using Moringa Oleifera Leaf Extract for Antibacterial Applications. Appl. Nanosci. 2020, 10, 305–315. [Google Scholar] [CrossRef]
- van den Berg, J.; Kuipers, S. The Antibacterial Action of Moringa Oleifera: A Systematic Review. S. Afr. J. Bot. 2022, 151, 224–233. [Google Scholar] [CrossRef]


Disclaimer/Publisher’s Note: The statements, opinions and data contained in all publications are solely those of the individual author(s) and contributor(s) and not of MDPI and/or the editor(s). MDPI and/or the editor(s) disclaim responsibility for any injury to people or property resulting from any ideas, methods, instructions or products referred to in the content. |
© 2026 by the authors. Licensee MDPI, Basel, Switzerland. This article is an open access article distributed under the terms and conditions of the Creative Commons Attribution (CC BY) license.