1. Introduction
Portland cement, despite its environmental challenges, remains the most widely utilized construction material globally, primarily due to its durability, ease of application, and advantageous thermal and mechanical properties [
1]. The annual production of Portland cement is estimated at around 4.1 billion tons, which is incorporated into approximately 10–12 billion tons of concrete produced globally each year [
1,
2,
3]. The manufacturing process is resource-intensive, requiring around 1.5 tons of raw materials to produce just 1 ton of Portland cement. This production ranks as the third most energy-intensive industrial high-temperature process, following steel and aluminum production, and accounts for approximately 7% of global electricity consumption [
4]. Moreover, the production of Portland cement is a significant source of greenhouse gas emissions. These emissions occur through two primary mechanisms: directly from the decarbonization of limestone and indirectly from the energy consumed in the production process. Specifically, the production of 1 ton of Portland cement results in the emission of approximately 1 ton of carbon dioxide (CO
2). Collectively, this translates to an estimated annual emission of about 13,500 tons of CO
2 [
5,
6,
7]. These factors underscore the critical need for advancements in cement production technologies and the exploration of alternative materials to mitigate the environmental impact of this essential construction resource.
The exploration of alternative materials for construction is vital in addressing the environmental challenges posed by traditional resources. One promising avenue is the development of alkaline-activated materials, which offer a more sustainable approach to construction without compromising performance. Alkaline-activated materials, synthesized through the activation of aluminosilicates, represent a significant advancement in sustainable construction technology. Unlike conventional cement, their production does not necessitate costly chemical reagents or high-temperature thermal treatments; instead, the process is conducted at temperatures below 100 °C, making it energy-efficient [
8,
9]. These materials can be categorized into two subgroups based on their calcium content: geopolymers, which contain minimal calcium, and other alkaline-activated materials [
10].
Geopolymers, in particular, are inorganic ceramic polymer composites that serve as an eco-friendly substitute for traditional cement [
11,
12,
13,
14]. They exhibit remarkable properties, including high compressive strength, excellent resistance to acids, low shrinkage, thermal stability, nonflammability, and resilience against freezing and corrosion [
7,
11,
12,
15,
16,
17]. These attributes not only enhance the durability and lifespan of construction projects but also contribute to reducing the overall carbon footprint associated with building materials. As such, the integration of geopolymers and other alkaline-activated materials into construction practices represents a crucial step towards sustainable development in the industry.
The basic structural unit of the geopolymer structure consists of the Si-O-Al bond, i.e., a network of SiO
44− and AlO
45− tetrahedra interconnected by covalent bonds through oxygen atoms, thus forming a typical structure of polysilane [
16,
18,
19]. Such a structure is divided into three phases: amorphous, semi-crystalline, and one or more crystalline phases [
8]. The empirical formula of geopolymers can be represented by the formula
where M represents the metal cation with which balances the negatively charged structure (Na
+, K
+, Li
+, Ca
2+, Ba
2+),
n represents the degree of polymerization of the resulting molecule, and
z is the ratio of silicon and aluminum atoms (Si/Al), while
w represents the amount of water present in the geopolymer structure [
6,
20].
The synthesis of geopolymers is performed by mixing two main components: solid-state components that include materials with a high content of SiO
2 and Al
2O
3, and components that are added in the liquid phase—a mixture of a concentrated solution of NaOH or KOH with a solution of sodium silicate (Na
2SiO
3) [
18]. The basic role of hydroxide ions is to break the glassy structure in the initial aluminosilicate material and to enable the release of aluminosilicate species [
21]. The amount of silicon and aluminum present in the Earth’s crust is approximately 75% [
22], so natural minerals such as kaolin, metakaolin, clay, zeolite, alunite micas, and spinel can be used as raw materials for obtaining geopolymers. In recent years, much attention has been directed to the use of waste materials such as fly ash, bottom ash, silica fume, ground granulated blast furnace slag, rice husk ash, ash from the burning of plant mass, volcanic rock powders, red mud, and flotation tailing [
7,
11,
12,
13,
18,
20,
23,
24,
25].
A careful selection of raw materials and experimental conditions may significantly affect the physical–chemical and mechanical properties of the obtained materials [
26]. The properties of geopolymers are primarily influenced by the type of initial material, i.e., its chemical composition, mineral composition, particle size, concentration of the alkaline solution used for activation, ratio of components (NaOH/KOH/Na
2SiO
3), curing time, curing temperatures, and possibly any additives present [
15,
16,
27].
More recent research refers to the use of organic polymer fibers to improve the physical–mechanical properties of geopolymers. For this purpose, polyvinyl alcohol, polypropylene, steel fibers, and carbon fiber were used [
4,
11,
28]. In addition to inorganic additives, Kljajević et al. tested the impact of zircon (ZrSiO
4) on the physical–mechanical properties of geopolymers [
29]. Industrial waste materials were also tested as potential additives. In the works of Gudiel et al. [
28], recycled fibers from used car tires were examined as an additive, while Kozub et al. [
26] examined the influence of new and used oils. Some studies bring up the possibility of using agricultural waste and waste from restaurants as possible additives to geopolymer materials. In their work, Paneru et al. [
30] tested the possibility of applying Corn Stover; Deutou Nemaleu et al. [
31] examined the option of using banana peel; while in the work of Kua et al., spent coffee was used for that purpose [
32]. In addition, Gupta et al. [
33] investigated the addition of rice husks, while Riyap et al. [
34] used waste chicken eggshells.
The primary objective of this study was to synthesize geopolymers utilizing fly ash, slag, and diatomaceous earth, augmented with organic polymeric materials as additives. Through the systematic variation of mass ratios, a total of 19 distinct geopolymeric formulations were developed. Comprehensive characterization of these materials was conducted, focusing on the determination of their physical and mechanical properties. A novel aspect of this investigation is the formulation of mathematical regression models, which facilitate a deeper understanding of the relationships between the compositional variables and the resultant material properties. Additionally, the application of chemometric multivariate analysis methods provides insights into the correlations between the initial raw material mixtures and the physical–mechanical characteristics of the synthesized geopolymers. This multifaceted approach not only enhances the interpretative framework of the results but also contributes to the broader field of geopolymer research by elucidating the interplay between material composition and performance.
2. Materials and Methods
2.1. Reagents and Chemicals
The fly ash (FA) and slag (S) that were used for the synthesis of geopolymers in this research were collected from the Nikola Tesla thermal power plant in Obrenovac (Serbia). These substances were obtained as by-products during the burning of lignite in the thermal power plant. Diatomaceous earth produced by Centrochem was used in the composition of the raw material mixture for the production of geopolymers. In order to improve the mechanical properties, the following compounds were used: polyvinyl alcohol (Sigma Aldrich, Saint Louis, MO, USA), chitosan (Thermo Scientific, Waltham, MA, USA), and starch (Superlab, Belgrade, Serbia). Alkaline activation of the initial materials was performed using a sodium hydroxide (Centrochem, Stara Pazova, Serbia) and sodium silicate solution (Beohemik, Belgrade, Serbia). Demineralized water (18 MΩ·cm−1), acetic acid (Betachem, Belgrade, Serbia), and nitric acid (NPK Engineering, Utterson, ON, Canada) were used for heavy metal leaching from the obtained geopolymers.
2.2. Synthesis of Geopolymers
A schematic representation of the synthesis of geopolymers, as well as the type of testing of the initial materials and the obtained geopolymer materials, is shown in
Figure 1.
The synthesis of 19 different series of geopolymers was performed. They differed based on the composition of the mixture of components added in the solid phase. The compositions of the raw material mixtures in terms of components that are added in the solid phase are presented in
Table 1. The synthesis was performed by homogenizing the total raw material mixtures in a glass, into which 100.0 mL of alkaline activation solution was added. A mixture of NaOH—concentration
c = 8 mol dm
−3, density
ρ = 1.2 g cm
−3—and NaSiO
3 solution, density
ρ = 1.2 g cm
−3, in the volume ratio NaOH:NaSiO
3 = 1:2 was used as the alkaline activation solution. Upon mixing the components that are added in the solid phase with the solution for alkaline activation, the mixture was homogenized by manual mixing and then by stirring in a mixer for 5 min (500 min
−1). The resulting paste samples were poured into cube-shaped molds with dimensions of 30 mm × 30 mm × 30 mm. The molds with paste samples were left at room temperature (25 ± 5 °C) for 24 h, after which they were placed in a drying oven (furnace) and gradually heated to 80 ± 2 °C for 6 h. The obtained geopolymer material was left at room temperature and pressure for 28 days for aging. After that time, the testing of these materials was conducted.
2.3. Methods
Identification of the granulometric composition was performed using the CISA BA200N device (CISA, Faenza, Italy), through sieves with mesh sizes of 250 µm, 180 µm, 125 µm, and 63 µm. The sieving time was 5 min, while the oscillation amplitude was 2.0 mm.
The appearance of the surface of the initial raw materials and the obtained geopolymers was identified using optical microscopy, i.e., using an optical microscope—OPTIKA B-193PL (Ponteranica, Italy). An N-PLAN objective 4×/0.10 was used. Scanning electron microscopy (SEM (SEM Mira3, Tescan Orsay Holding, Brno, Czech Republic)) was used to analyze the morphology of selected geopolymer samples. The magnifications of the SEM micrographs were 1000×, 5000×, and 10,000×.
The identification of macrocomponents and trace elements in the initial raw materials (fly ash, slag, and diatomaceous earth) was performed using energy-dispersive X-ray fluorescence techniques—EDXRF (Spectro Xepos, Kleve, Germany). The samples were prepared in accordance with the pressed powder method. About 5.0 g of the tested initial materials were weighed and mixed with 1.0 g of wax. The resulting mixture was transferred to a pallet with a 40.0 mm diameter, which was then pressed with a 40 t press. The EDXRF was controlled by the Spectro XRF Analyzer Pro, Xepos C Software 2.2.2, while recording was performed using a standardless FP oxide pellet (A) (JRRM) method [
35]. The obtained results, determined in triplicate, were converted to loss by annealing at 1000 °C, and the elements present were expressed as a percentage content—SiO
2, Al
2O
3, Fe
2O
3, CaO, MgO, Na
2O, K
2O, SO
3, P
2O
5, MnO, and Cr
2O
3—while the concentrations of V, Co, Ni, Cu, Zn, As, Sr, Mo, Sn, Hg, W, and Pb are shown in units of mg/kg.
The identification of the minerals present in the initial raw materials was conducted using the X-ray powder diffraction method—XRPD. For that purpose, an APD 2000 Ital Structures diffractometer was used. The intensities of diffracted CuKα (λ = 0.154 nm) radiation were measured at room temperature in the interval 2θ from 10° to 70°, with a stepped increase of 0.02° and a counting time of 1 s per step. The voltage of the X-ray tube was 40 kV, while the electricity current was 30 mA. The Powder Cell software 2.4 was used to determine and quantify crystalline phase composition.
The analysis of the present functional groups was conducted using the method of Fourier transform infrared spectroscopy (FTIR). A Nicolet™ iS™10 FT-IR spectrometer (Thermo Fisher Scientific, Waltham, MA, USA) equipped with an ATR diamond crystal accessory was used in the wavenumber interval from 400 to 4000 cm−1, with a spectral resolution of 4 cm−1, averaging 32 scans per sample.
The thermal properties of the obtained materials were examined by thermogravimetric analysis and differential thermogravimetric analysis in an atmosphere of synthetic air with a flow rate of 100 cm3 min−1. An SDT Q-600 instrument (TA Instruments, New Castle, DE, USA) was used. The samples were heated in standard alumina sample cups at a heating rate of 10 °C min−1 from room temperature to a temperature of 800 °C.
2.4. Physical–Chemical and Mechanical Properties of Obtained Materials
The following physical–chemical properties of the obtained materials were identified: the density of the material (by the Archimedean method), the amounts of adsorbed water after 30 days, and the percentage of shrinkage of the material after aging.
The compressive strength of the obtained samples was tested after 28 days. The compressive strength testing was performed on an AMSELER hydraulic press until the material broke completely.
2.5. Leaching of Heavy Metals from Geopolymers
Leaching of heavy metals was conducted by immersing the obtained geopolymer materials in 40.0 mL of different solutions: demineralized water, acetic acid at a concentration of 1 mol dm−3, and nitric acid at 0.5 mol dm−3. After 30 days, the solutions were filtered using a 25 µm filter, and the pH value was adjusted (pH around 4). The concentration of leached elements was identified by the method of inductively coupled plasma with optical emission spectrometry—ICP-OES (5800 Agilent Technologie, Santa Clara, CA, USA). Cr, Cu, Mn, Ni, Pb, Zn, and Fe were identified at wavelengths of 205.560 nm, 324.754 nm, 257.610 nm, 231.604 nm, 220.353 nm, 213.857 nm, and 259.940 nm, respectively.
2.6. Modeling and Chemometrics
The obtained parameters were modeled using the Minitab software package, version 20.3. A linear mixture regression analysis was performed in order to study the impact of individual components on the compressive strength value of the obtained geopolymers.
In this work, a chemometric analysis— cluster analysis and principal component analysis were performed using the Python program, version 3.13.3. The graphical interpretation of the obtained results was performed using the OriginPro 2025b software package.
3. Results and Discussion
3.1. Characterization of Initial Materials
Waste materials such as fly ash, slag, and diatomaceous earth were used as initial raw materials for the synthesis of geopolymer materials. The structure of the initial materials was examined using optical microscopy. The presentation of the initial materials, fly ash, slag, and diatomaceous earth, under an optical microscope is shown in
Figure 2.
The structure of thermal power plant waste, fly ash, and slag, is very heterogeneous. The particles of these raw materials are of different colors and sizes. The color of fly ash particles ranges from yellow to gray, while the color of slag ranges from dark gray to black. In contrast to the other raw materials, diatomaceous earth is a fairly homogeneous, powdery substance with a uniform particle size of a light yellow color. The particle size distribution of the starting raw materials may influence the mechanical properties of the obtained materials [
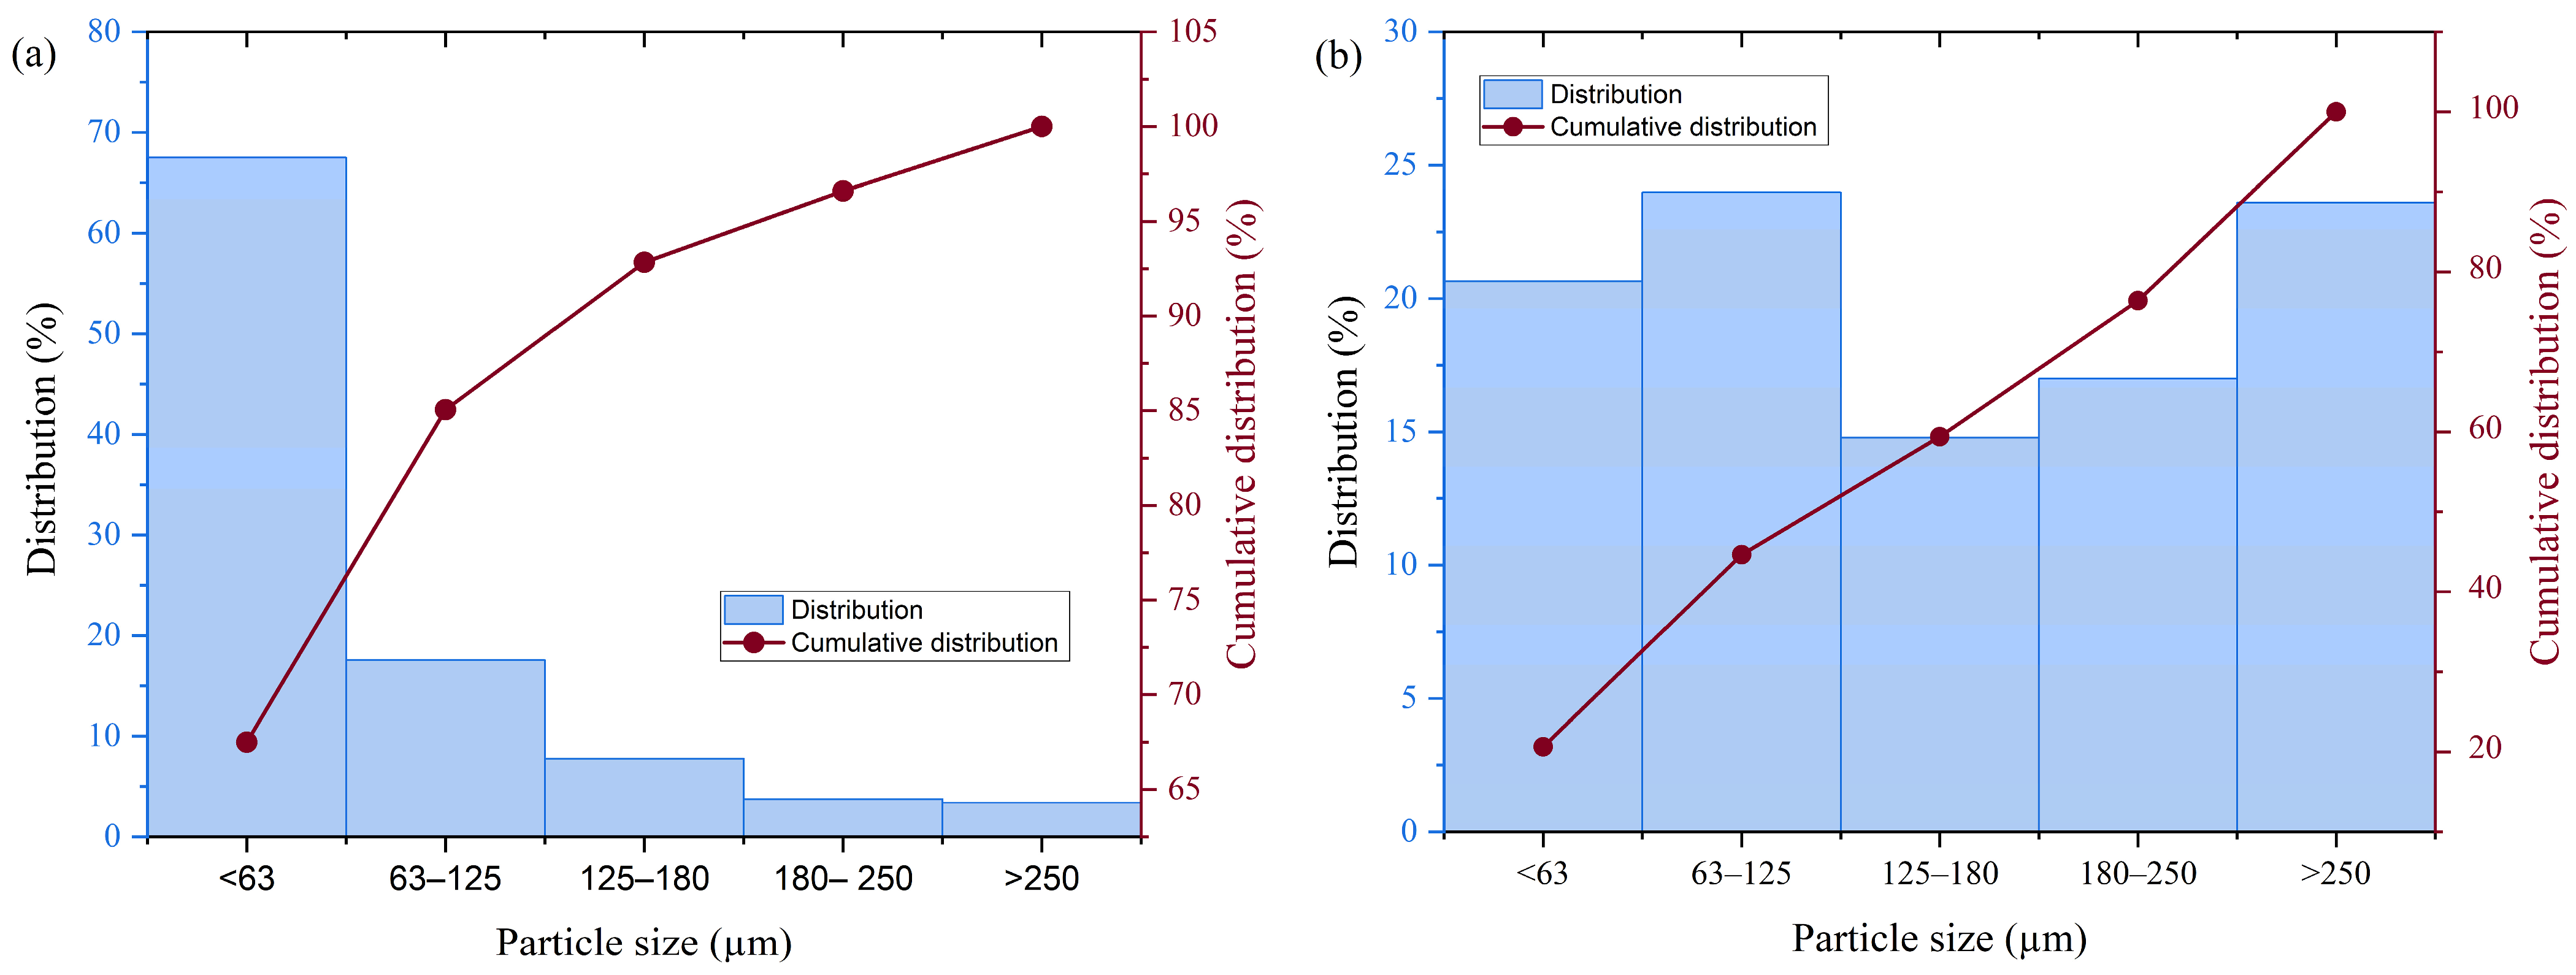
36]. The particle size distribution of the starting raw materials is shown in
Figure 3.
The largest fraction in the fly ash sample had a particle size smaller than 63 µm, accounting for 67.5% of the sample, whereas the amount of particles in the larger fractions decreased. In the ground slag sample, almost equal amounts of particles were present in all fractions. The diatomaceous earth sample contained only particles smaller than 63 µm.
The results of ED-XRF analysis showing the mean values of macrocomponents and trace elements in the initial raw materials are presented in
Table 2 and
Table 3.
The basic macrocomponents present in the initial materials are SiO
2, Al
2O
3, Fe
2O
3, and CaO. Their ratio in the initial raw material mixture dictates the behavior of the synthesized geopolymer materials. The highest content of detected oxides in the initial materials was for SiO
2, which ranged from 38.86% to 90.03%, followed by Al
2O
3, which ranged from 3.18% to 23.24%, Fe
2O
3 (from 1.22% to 9.80%), and CaO (from 1.69% to 6.63%). MgO, K
2O, and SO
3 were found in concentrations lower than 5%, while Na
2O, P
2O
5, MnO, and Cr
2O
3 were found in concentrations lower than 1%. The total amount of SiO
2, Al
2O
3, Fe
2O
3, and CaO in the initial samples is over 65%, which shows that these oxides are found to the greatest extent in the newly synthesized materials, and therefore significantly affect their properties. According to the ASTM C618 standard [
37], fly ash and slag belong to class F, which indicates their high pozzolanic activity, indicating that these materials are suitable for the synthesis of geopolymers. Similarly, all these materials differ in mass loss at 1000 °C, which is most visible in the slag sample and least visible in the case of diatomaceous earth. This loss occurs due to the decomposition of inorganic constituents (such as carbonates), the decomposition of organic substances, or the loss of water in these materials.
In addition to macrocomponents, trace elements are also present in the initial material samples, which, due to inadequate processing, can have a negative impact on the environment. Some of these elements that attract more attention are Pb, Cd, Ni, and Co. The presence of these elements was recorded in larger amounts in the industrial waste, fly ash, and slag, while a small amount was present in the diatomaceous earth. The amount of Co present ranges from 25.5 mg kg−1 to 31.5 mg kg−1, and Ni is present in amounts from 148.4 mg kg−1 to 187.5 mg kg−1, while Pb ranges from 65.3 mg kg−1 to 85.7 mg kg−1.
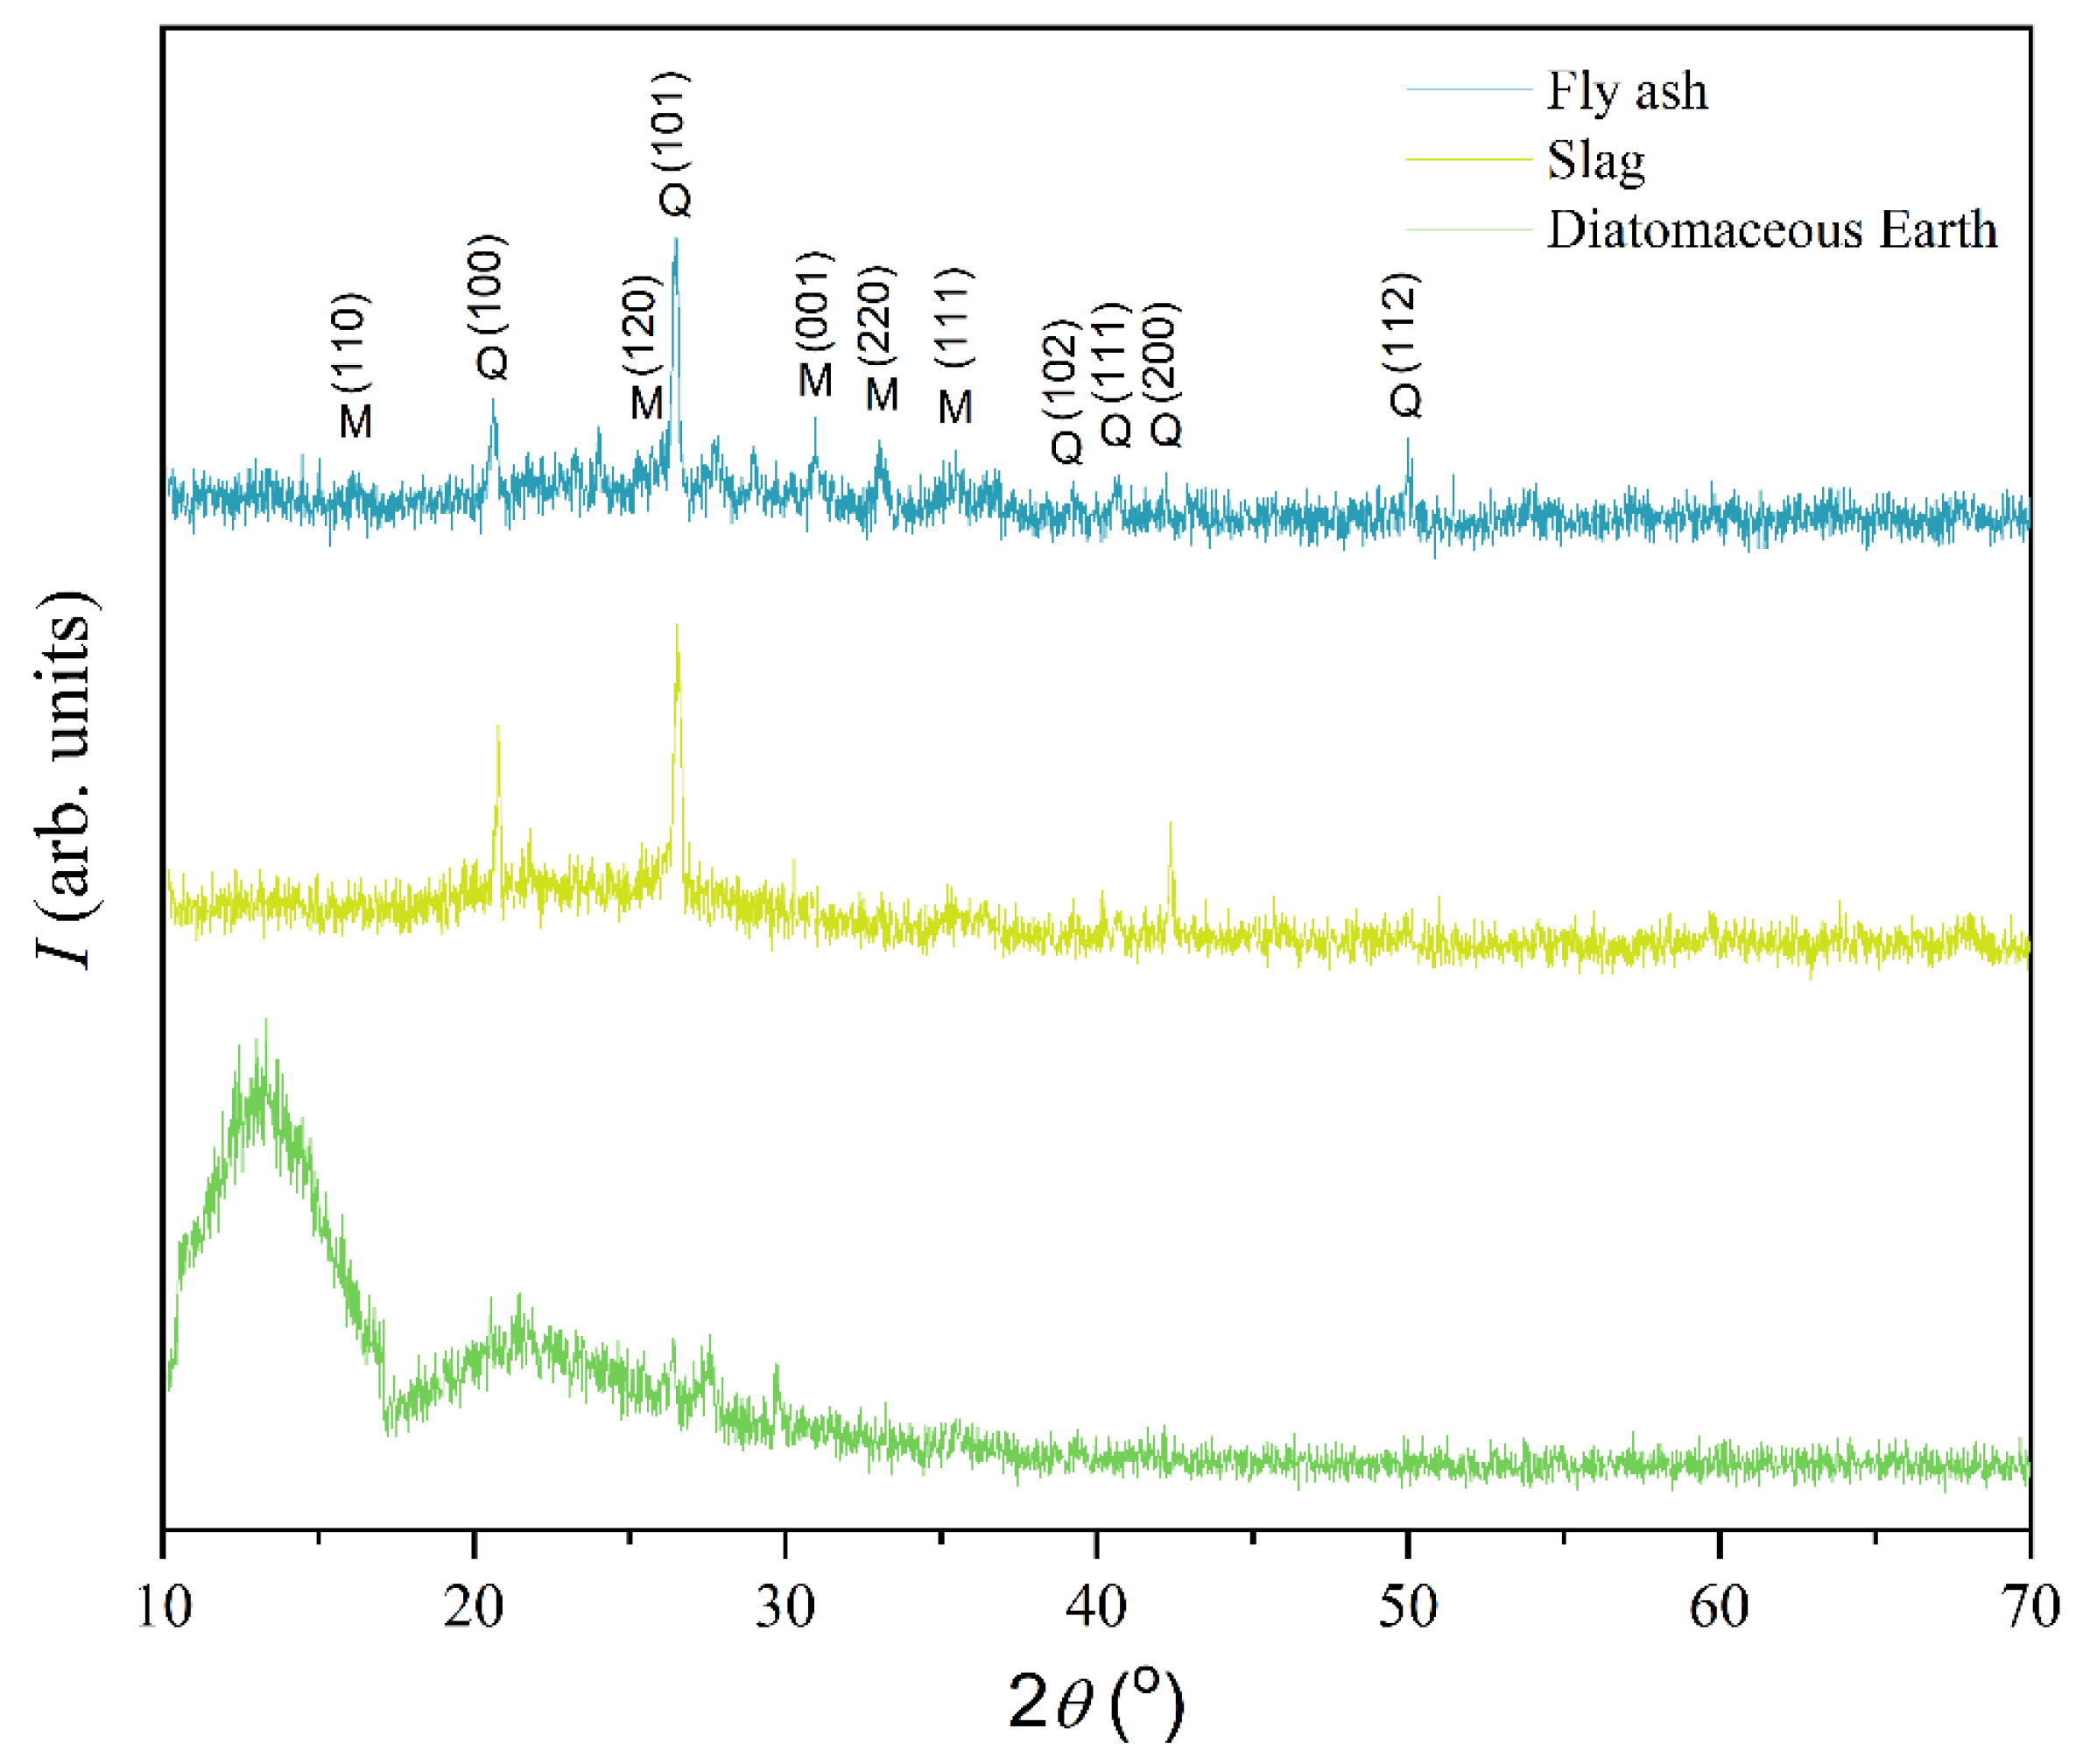
Figure 4 shows the results obtained using X-ray powder diffraction to analyze the minerals present in the initial samples.
The samples of slag and fly ash show very similar XRPD patterns, with diffraction maxima characteristic of the minerals quartz (hexagonal crystal system, space group
P3
221) and mullite (orthorhombic crystal system, space group
Pbam) according to PDF #46-1045 and PDF #15-0776, respectively. However, those samples differ in the content of established crystalline phases. The slag sample mainly comprised quartz as the dominant phase and mullite in a mass ratio of 87:13, while the fly ash sample contained quartz and mullite in a mass ratio of 53:47. Unlike the other tested samples, two “bumps” were identified on the diffractogram of diatomaceous earth in the 2
θ interval from 10° to 17° and in that from 17° to 28°, which indicates that this material is mainly composed of an amorphous phase [
38,
39,
40].
3.2. Characterization of the Obtained Geopolymer Materials
After the successfully completed synthesis of geopolymers, three materials (GP1—100% fly ash; GP8—70% fly ash and 30% slag; GP17—70% fly ash and 30% diatomaceous earth) were selected for structure characterization and physical–mechanical property testing. The appearance of the selected geopolymer materials under an optical microscope is shown in
Figure 5.
The results shown in
Figure 5 reveal that the structure of the obtained geopolymers is porous and heterogeneous. The resulting materials contain a large number of pores of different dimensions, which could be a consequence of an intensive mixing process during material synthesis or rapid solidification. This porous structure affects the density of the obtained materials and the adsorption of water. Research related to the ratio of pore sizes and the mechanical strength of geopolymers was carried out by Yang et al. [
41], and they state that the compressive strength of the obtained materials and the pore size are in direct correlation. Also, the same research indicated higher porosity of fly-ash-based geopolymer materials compared to cement paste materials. The above-mentioned studies are in agreement with the results obtained in this study.
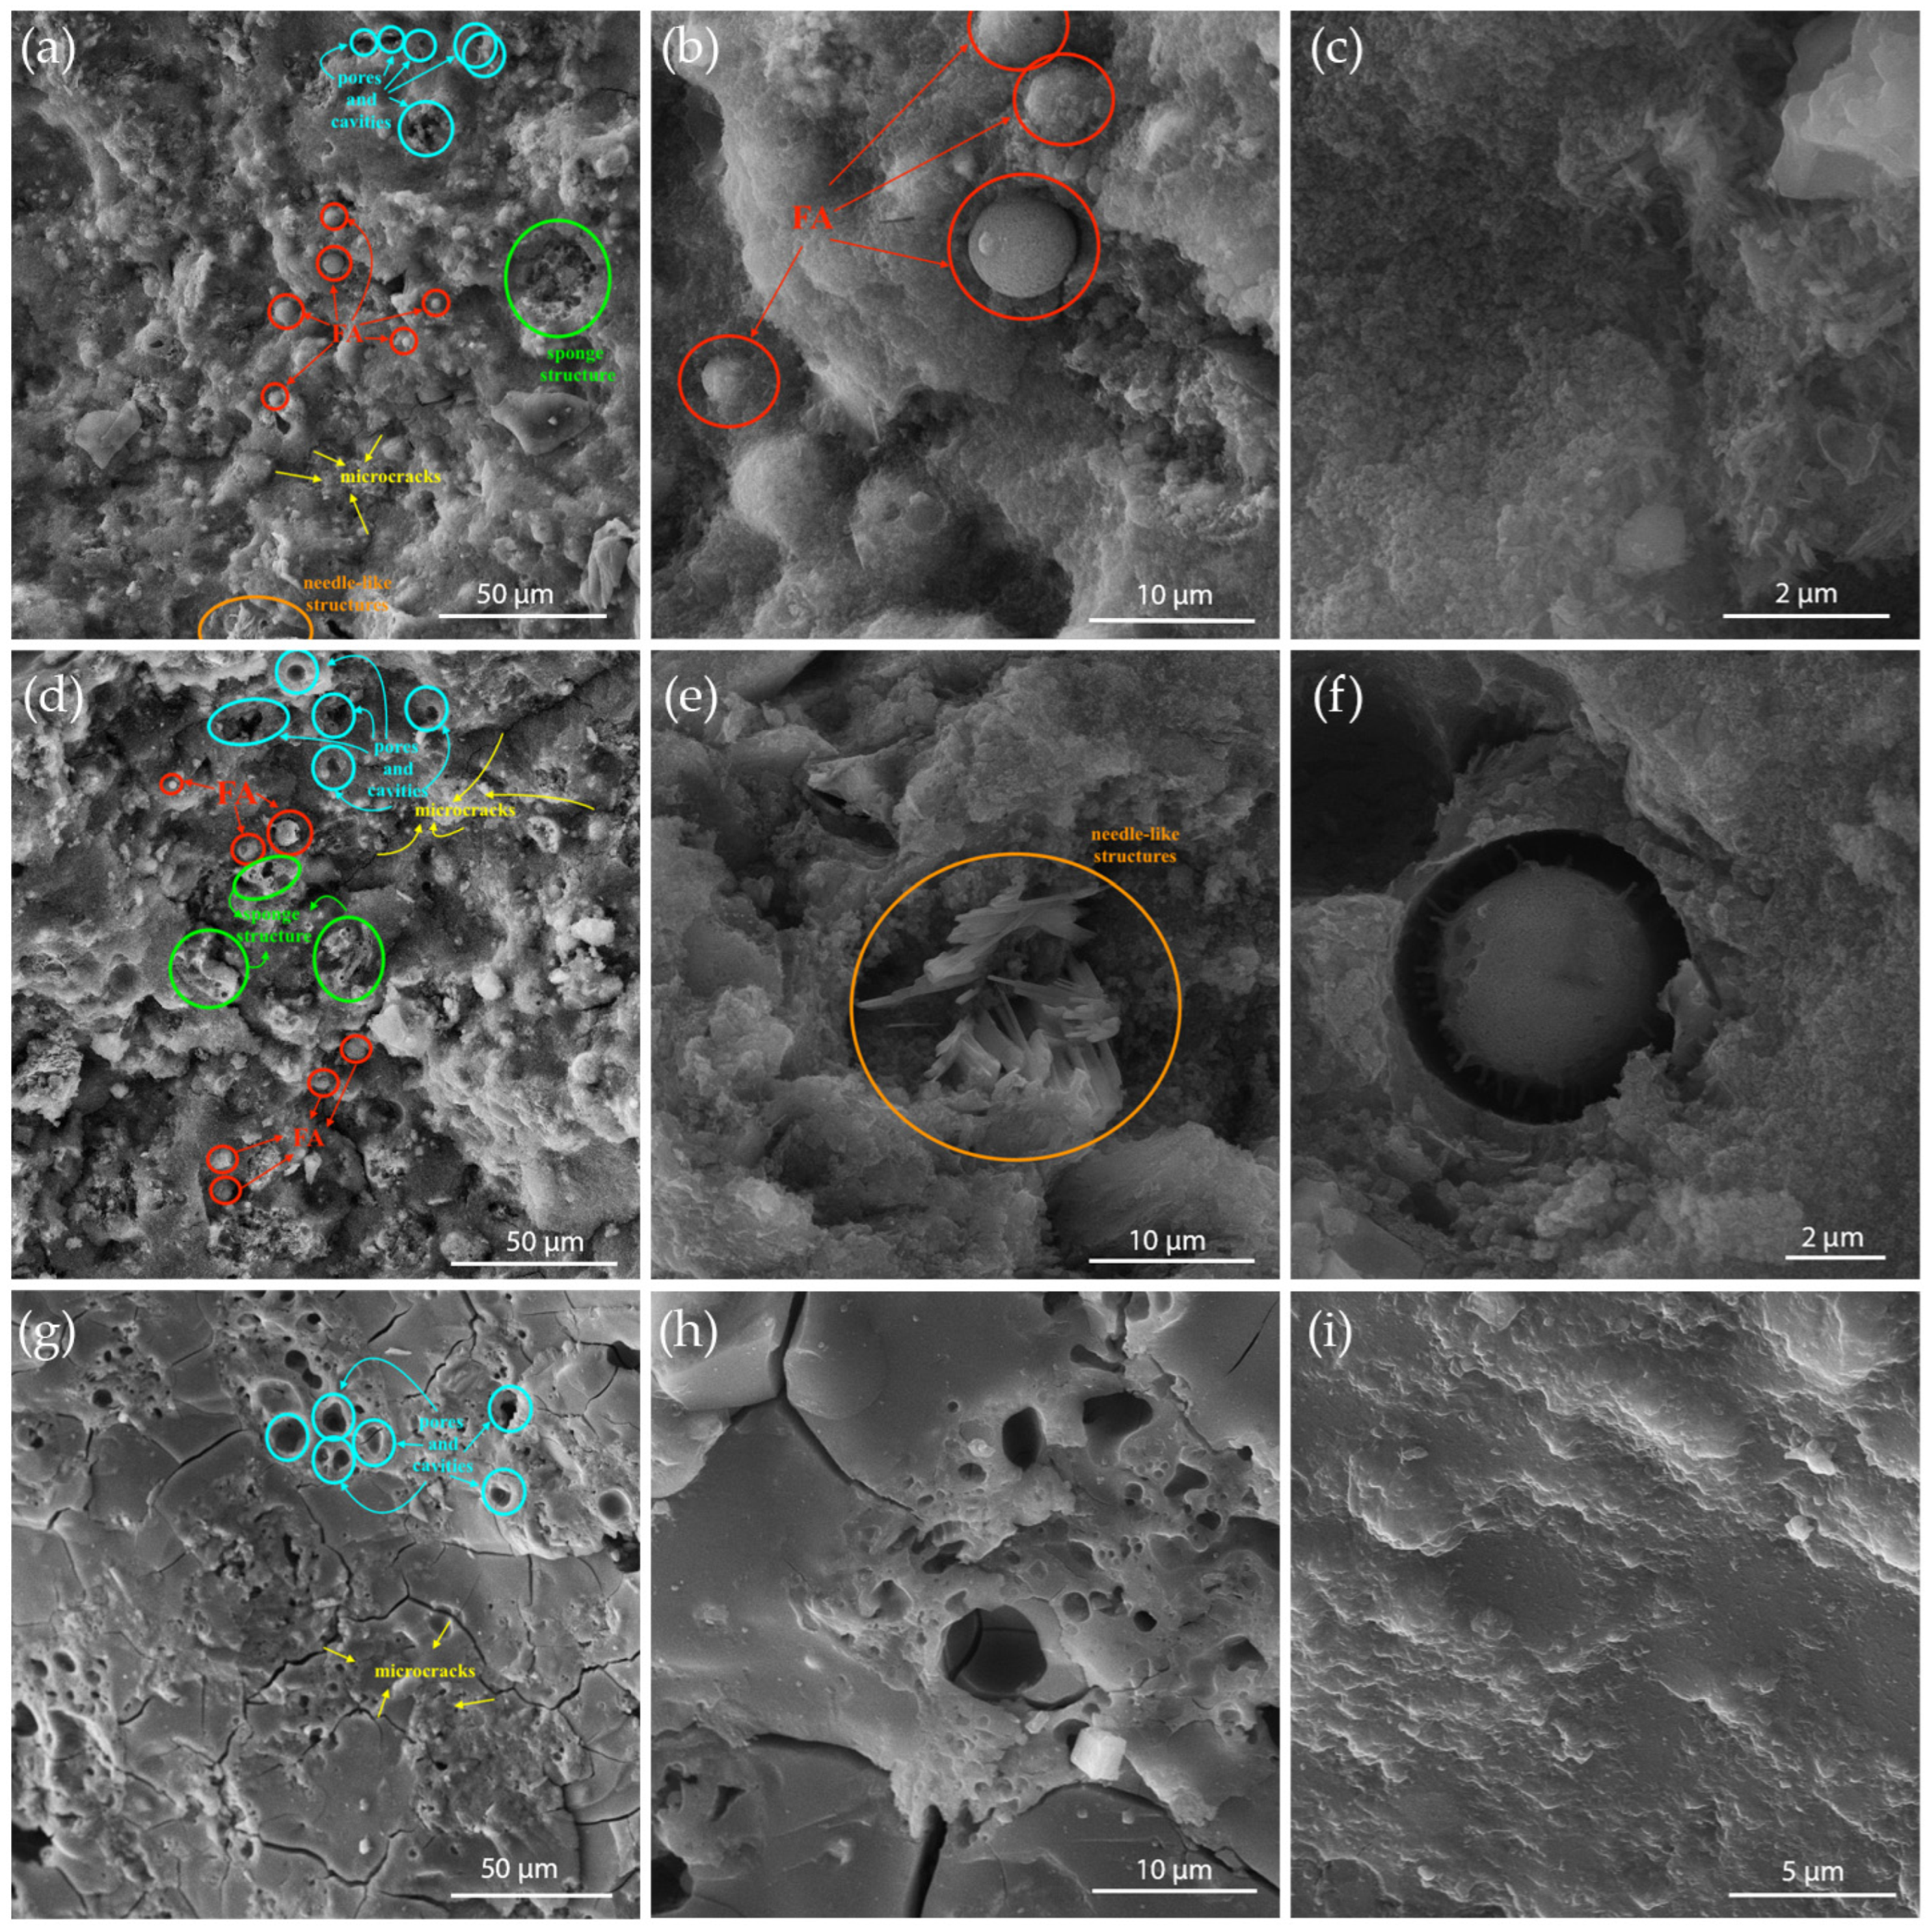
Figure 6 shows the morphology of the obtained geopolymer materials (GP1, GP8, and GP17) using scanning electron microscopy.
Figure 6 reveals a very dense, uniform, yet heterogeneous material structure. The structures of samples GP1 and GP8 are similar and consist of an irregularly distributed porous geopolymer matrix (sodium aluminosilicate hydrate (N-A-S-H) gel) with a large number of pores, cavities, sponge structures, and microcracks that arise from volume changes occurring during the transition from amorphous to semi-crystalline N-A-S-H gel [
42,
43]. Additionally, their structure also contains unreacted and partially reacted fly ash particles (in the form of cenospheres), which results from the rapid setting of the binder. The needle-like structures present in GP1 and GP8 may indicate the presence of sodium or calcium carbonates (present in the starting slag sample) within the geopolymer structure [
42]. Since these materials function as composites, the presence of unreacted particles and microcracks is expected to affect the physical and mechanical properties of the material [
44]. Unlike GP1 and GP8, the structure of GP17 shows significant differences due to the presence of diatomite in the starting raw material mixture. Specifically, geopolymer GP17 is a more homogeneous material with good cohesion, more pronounced connected microcracks, fewer irregular cavities, and a denser microstructure. Although GP17 contains a large amount of fly ash in the initial raw mixture, within its structure, fly ash particles are firmly embedded in the gel, while the diatomite structure is not detected; in other words, no unreacted raw material particles can be identified in this homogenous structure [
45].
The presence of functional groups in initial materials and in the synthesized geopolymer materials were examined using Fourier transform infrared spectroscopy (FTIR) in the wavenumber interval from 400 cm
−1 to 4000 cm
−1. The obtained results are shown graphically in
Figure 7.
The obtained infrared spectra of the raw materials and synthesized geopolymers are very similar, which proves that there was no formation of new chemical structures, but that a “reorganization” of the existing structures happened. The results obtained by the ED-XRF method for the initial raw materials indicate a substantial presence of the elements Si, Al, Fe, and O, which implies that connections formed between these elements in these structures are expected. The most intense bands in these initial raw materials appear in the interval of wavenumbers from 1015 cm
−1 to 1046 cm
−1; they result from the asymmetric stretching of the bonds Si–O–Si and Si–O–Al. Geopolymer samples contain bands at wavenumbers around 990 cm
−1 which also result from asymmetric stretching of Si–O–Si and Si–O–Al bonds, but due to alkaline activation, they are shifted towards lower wavenumber values. This shift in the band may also be caused by the possible penetration of aluminum ions into the original structure; it may depend on the Na
2SiO
3/NaOH ratio, as well as on the temperature at which the geopolymer was synthesized [
38,
46,
47,
48,
49]. The bands present in the wavenumber interval from 500 cm
−1 to 800 cm
−1 represent the symmetric stretching of Si–O–Si and Si–O–Al bonds. In addition, a band that occurs in the interval of wavenumbers from 400 cm
−1 to 500 cm
−1 is also characteristic and it represents the bending vibration of the Si–O–Si and O–Si–O bonds. Diatomaceous earth exhibits a characteristic band at 800 cm
−1. Bands originating from water adsorbed on the surface of the material have been observed in geopolymer samples, as well. They appear at wavenumbers around 1645 cm
−1, which originate from the bending vibration of the -O-H bonding, but a broad band also occurs in the wavenumber interval from 3650 cm
−1 to 3000 cm
−1, which is a result of the stretching vibration of the -O-H bonding [
38,
46,
47,
48]. During the synthesis of geopolymers, water is introduced together with the NaOH solution; hence, during the synthesis process it can be retained in the material. These bands may also originate from other –OH groups present within the investigated structures.
3.3. Mechanical and Physical Properties of the Obtained Materials
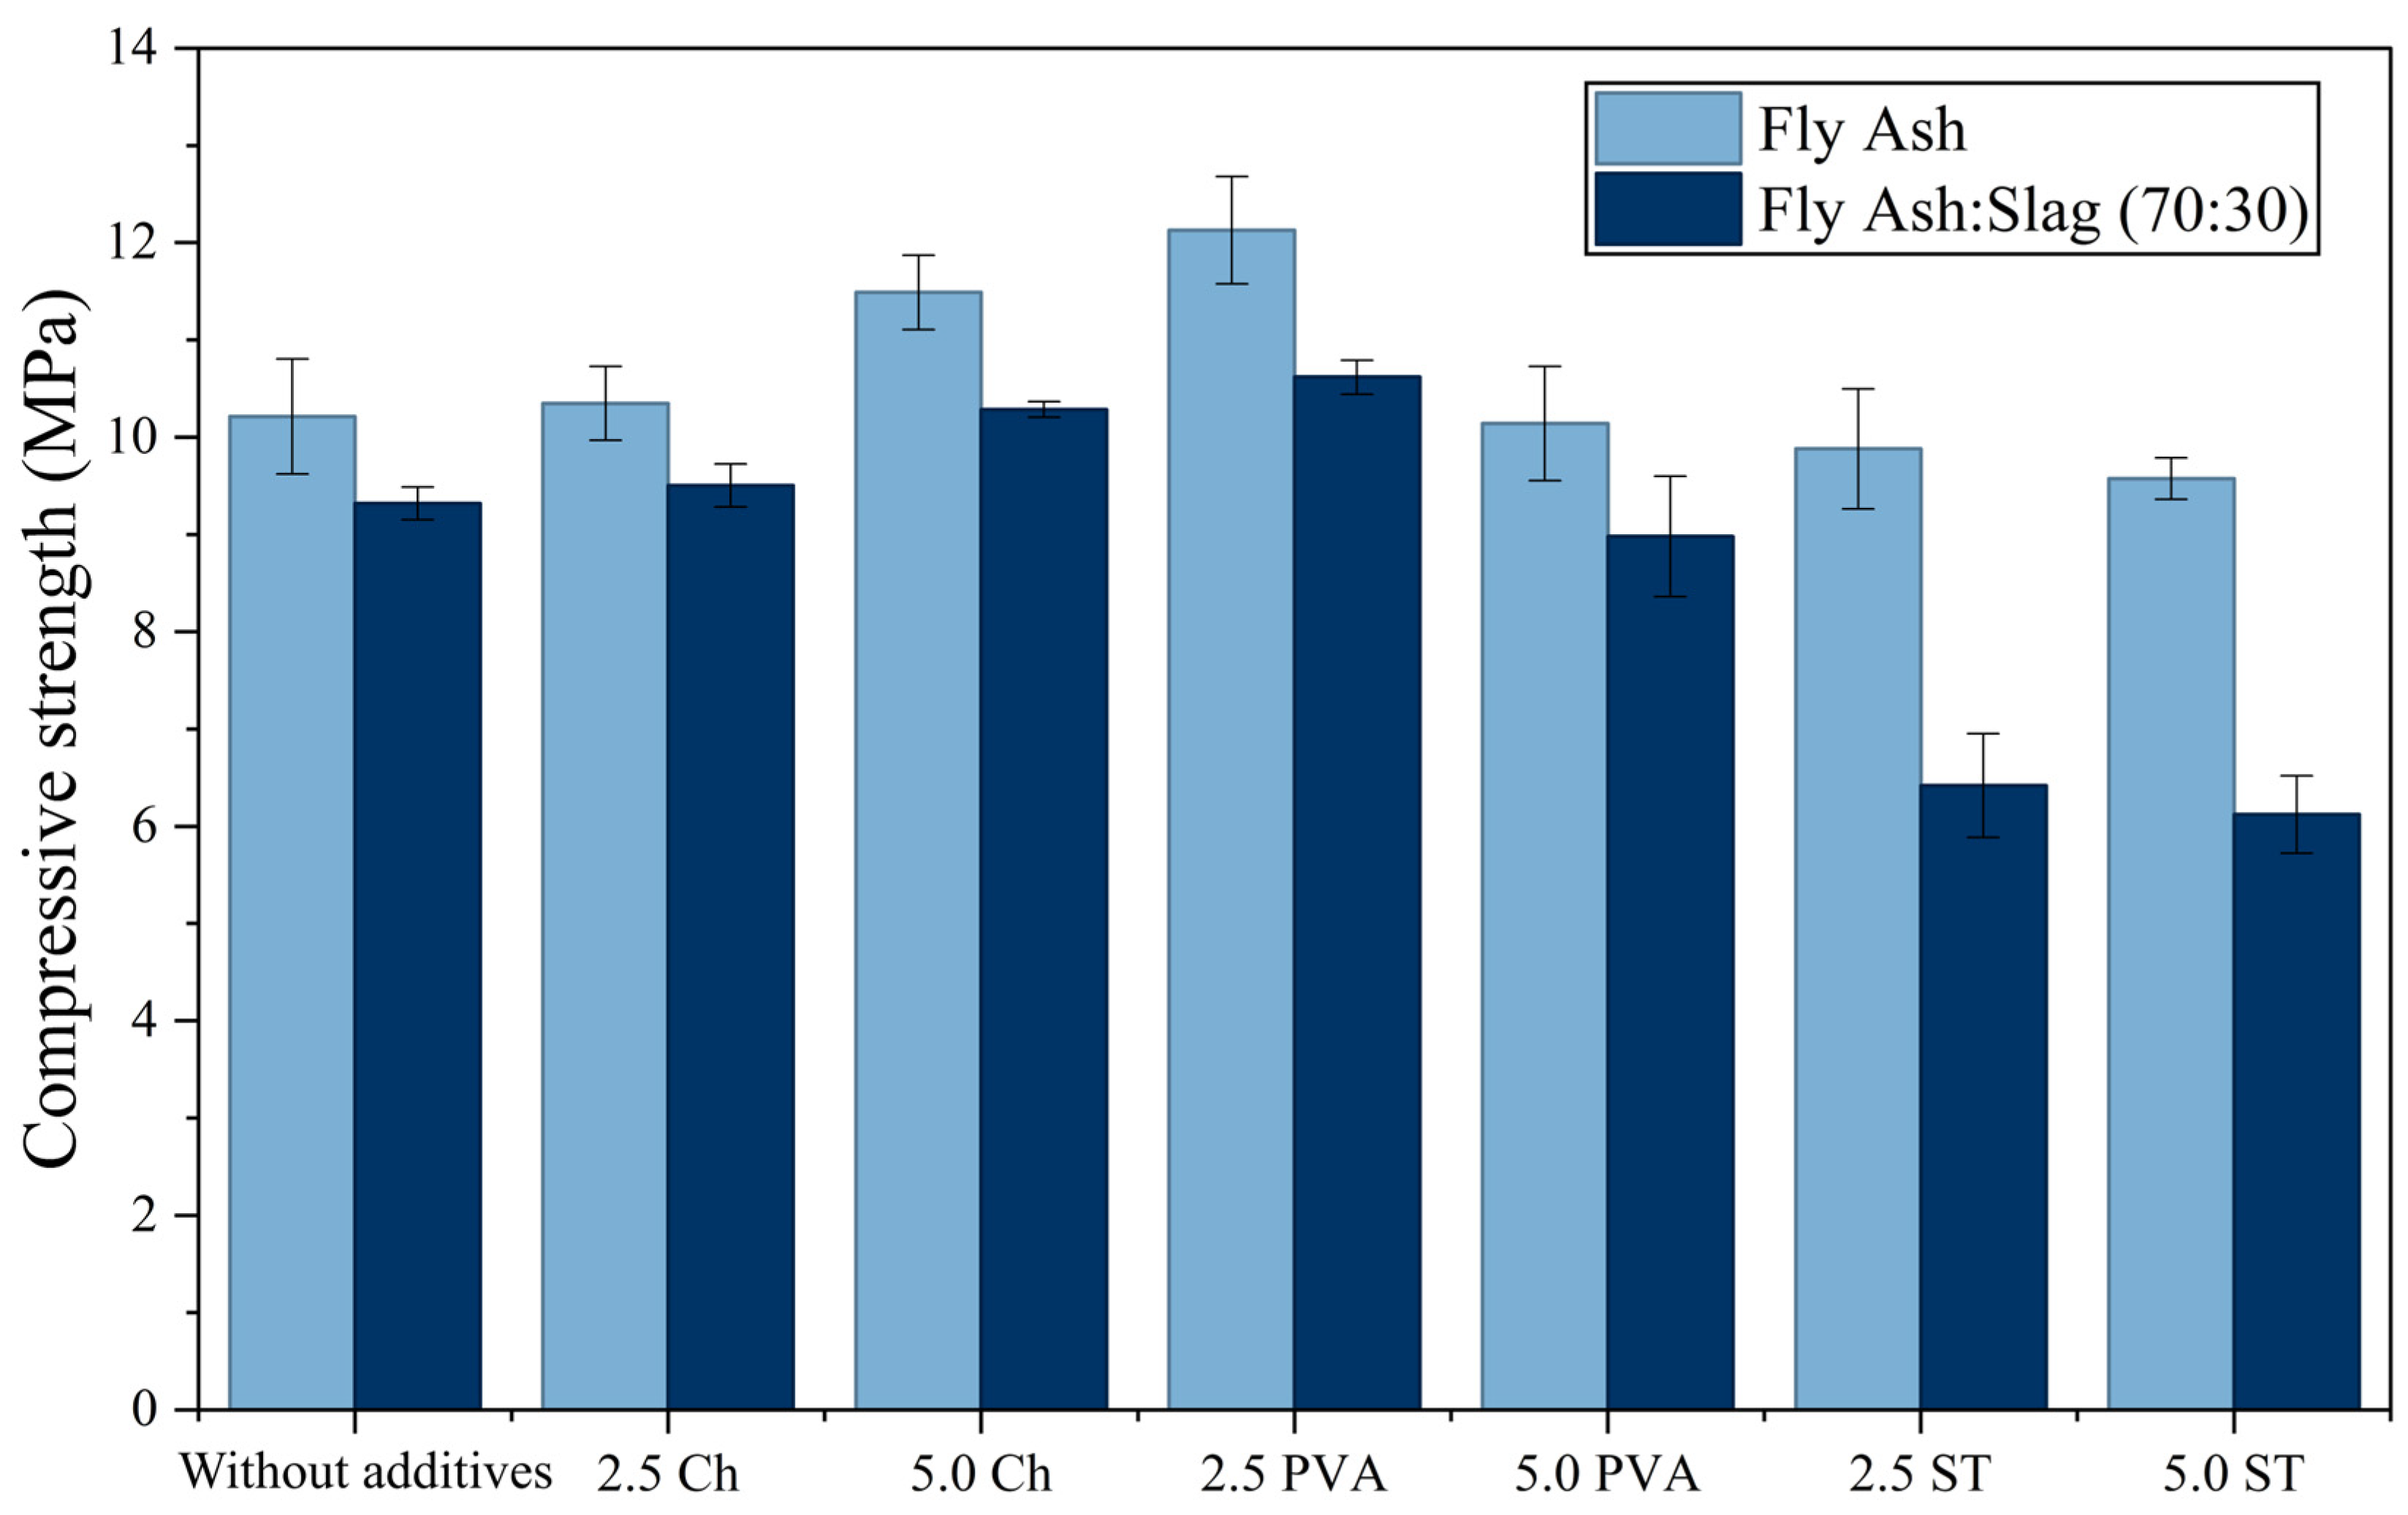
Geopolymers samples GP1 to GP7 basically contain only fly ash, while geopolymers samples GP8 to GP14 basically contain a mixture of fly ash and slag in a mass ratio of 70:30. The difference between these materials is based on the addition of different amounts of additives (PVA, Ch, ST). The obtained results of the compressive strength tests are shown in the diagram in
Figure 8.
The obtained results suggest that the most significant increase in compressive strength occurred due to the addition of PVA in the amount of 2.5%, while further addition of this compound resulted in a decrease in the compressive strength of the geopolymers. The effect of Ch on the increase in compressive strength of the material also proved to be favorable—addition of a larger amount of this substance resulted in a bigger increase, i.e., the material containing 5.0% Ch showed better mechanical properties than that to which 2.5% was added. Contrary to PVA and Ch, the addition of ST had a negative effect on the mechanical properties of the obtained geopolymers; more precisely, the material to which ST was added showed poorer mechanical properties than the one in which no additive was present. The organic polymeric materials in these structures crosslink with the aluminosilicate matrix through the formation of hydrogen bonds between the sodium polyaluminosilicate gel and the functional groups of the organic polymers (amino groups in Ch and hydroxyl groups in PVA and Ch) [
50]. This crosslinking may explain the increased strength resulting from the presence of organic additives.
Tests concerning the effect of PVA addition to the raw material mixture on the strength of geopolymers were studied in the works of Zhang et al. [
51], where the amount of added PVA was examined in the interval from 0% to 1%, and in the work of Cai et al. [
52], where the amount of added PVA was studied in the interval from 0% to 3%. In both studies, it has been concluded that an increase in the amount of added PVA simultaneously increases the compressive strength of the obtained geopolymers. The results of this work are in agreement with the results shown in the above-mentioned studies, with the newly derived conclusion that if PVA is added in larger quantities, the strength of the geopolymers may decrease. The literature reveals that the early addition of Ch in the geopolymerization process increases the cohesion of the matrix, which has a positive effect on the compressive strength and toughness of the obtained material [
53]. Qin et al. [
54] examined the influence of Ch on the mechanical properties of metakaolin geopolymers, and the obtained results showed a similar trend—with the addition of 1% Ch, the compressive strength increased, while in the interval from 1% to 2%, the compressive strength gradually decreased. The results presented by Wang et al. [
55] show that in geopolymers consisting only of metakaolin or of metakaolin and blast furnace slag an increase in compressive strength occurs up to 5% and then a decrease in strength occurs. These observations are consistent with the results obtained in this study.
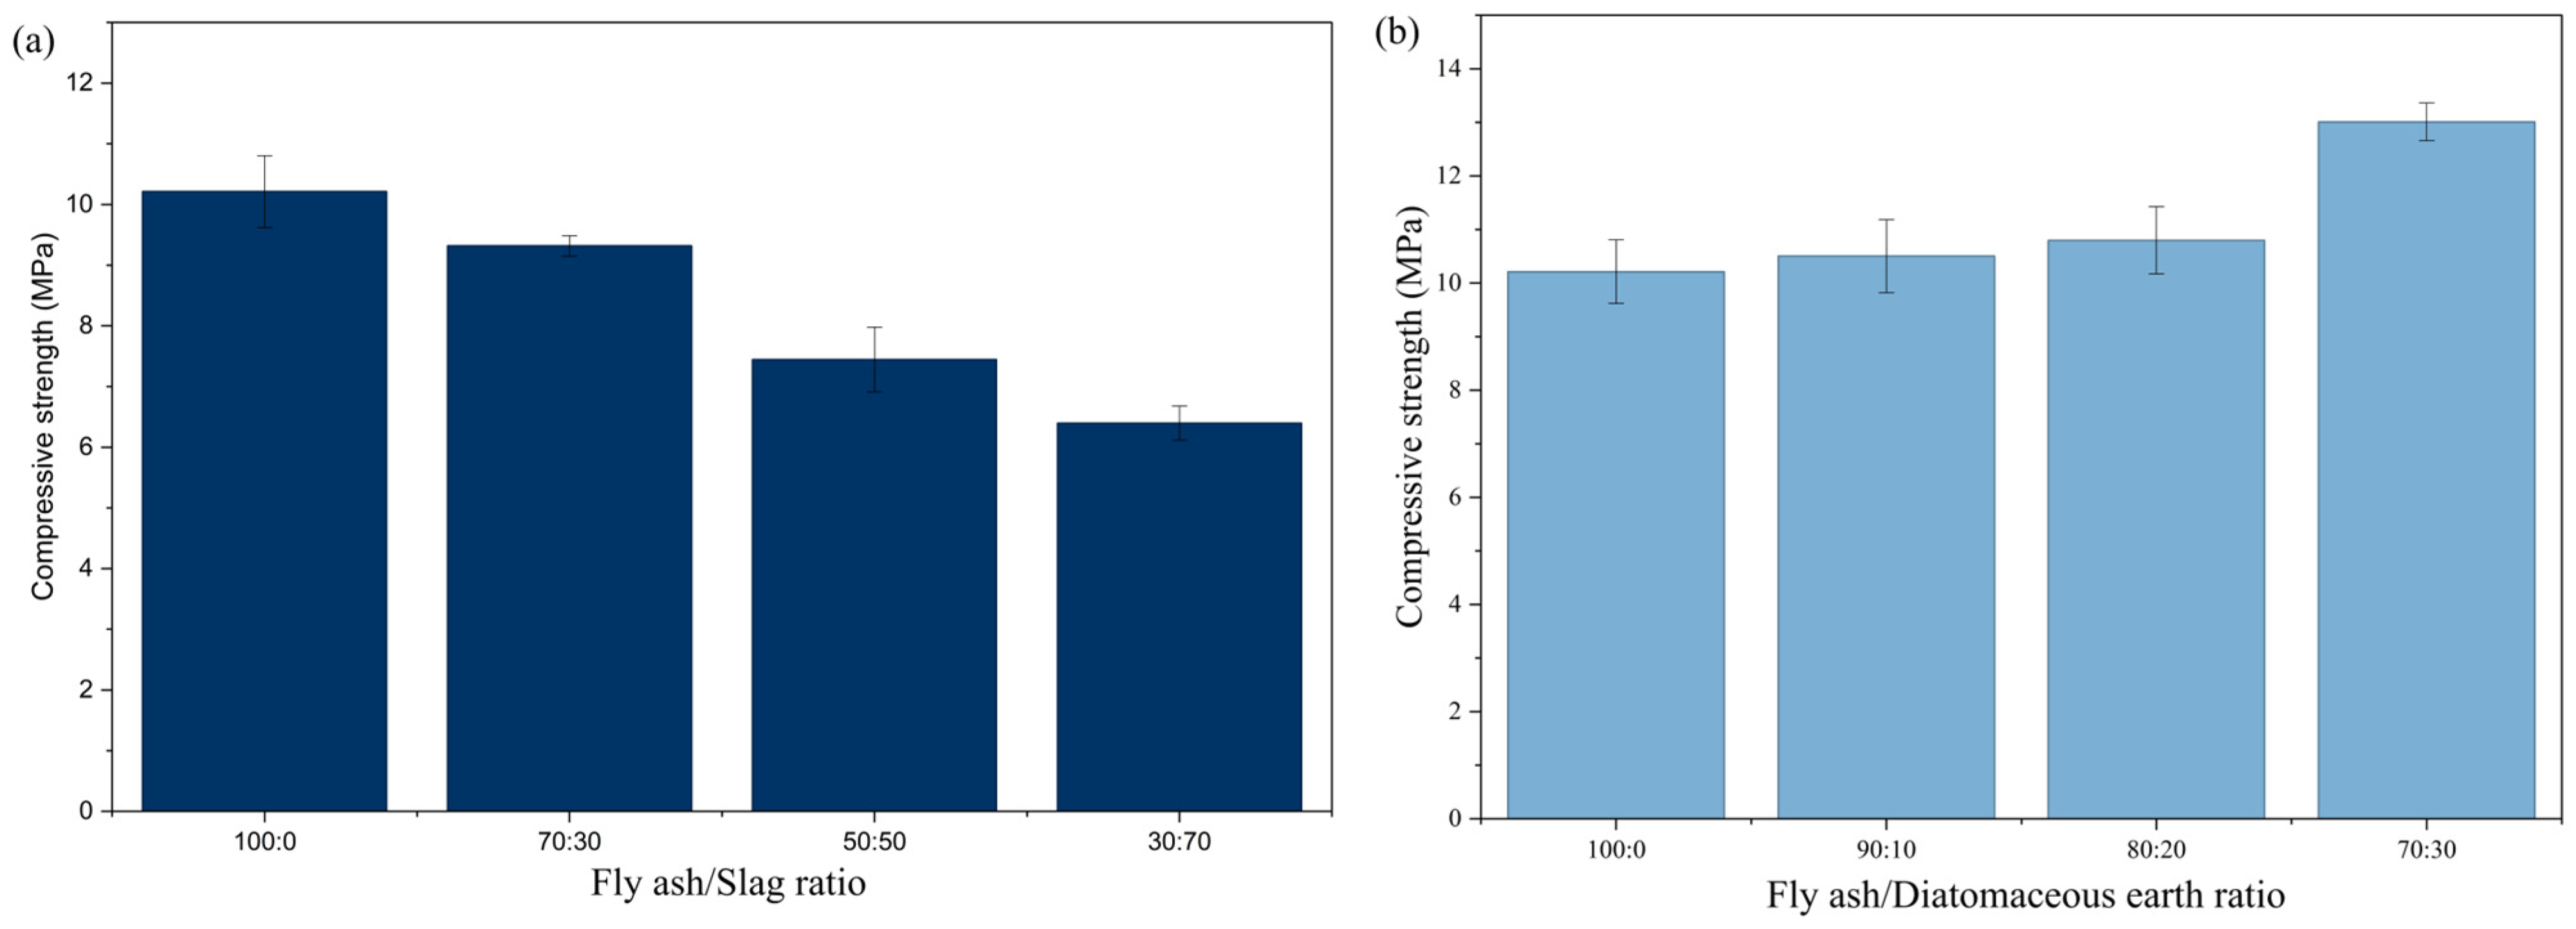
In this work, the synthesis of geopolymers was performed from a raw material mixture with different mass fractions of initial components. Geopolymers were synthesized where the ratios of fly ash and slag were 70:30, 50:50, and 30:70, while the proportions of fly ash and diatomaceous earth were 90:10, 80:20, and 70:30. The results from testing the compressive strength of the obtained materials are shown in
Figure 9.
The major difference between fly ash, slag, and diatomaceous earth lies in their composition, elemental composition, and mineral composition. The results shown in
Figure 9 indicate that the increase in the proportion of slag in geopolymer materials results in a gradual decrease in their compressive strength. This conclusion is further supported by the fact that it was not possible to synthesize a geopolymer that contained 100% slag. The reduction in the strength of the obtained materials can also be a consequence of the particle size; namely, the slag particles are the largest particles of all the components added in the solid phase. The geopolymer containing 30% fly ash had a 41.1% lower compressive strength than that formed from fly ash alone. The diatomaceous earth contained very fine particles, predominantly of amorphous nature. The compressive strength of the obtained materials increased with the increasing proportion of diatomaceous earth—from 10.5 ± 0.68 MPa for the sample containing 10% diatomaceous earth to 13.0 ± 0.35 MPa for the sample containing 30% diatomaceous earth. These results are consistent with the observed morphology of the tested samples: the number of microcracks was significantly reduced, and the morphology of the obtained materials was more uniform and denser, which, as expected, resulted in higher compressive strength.
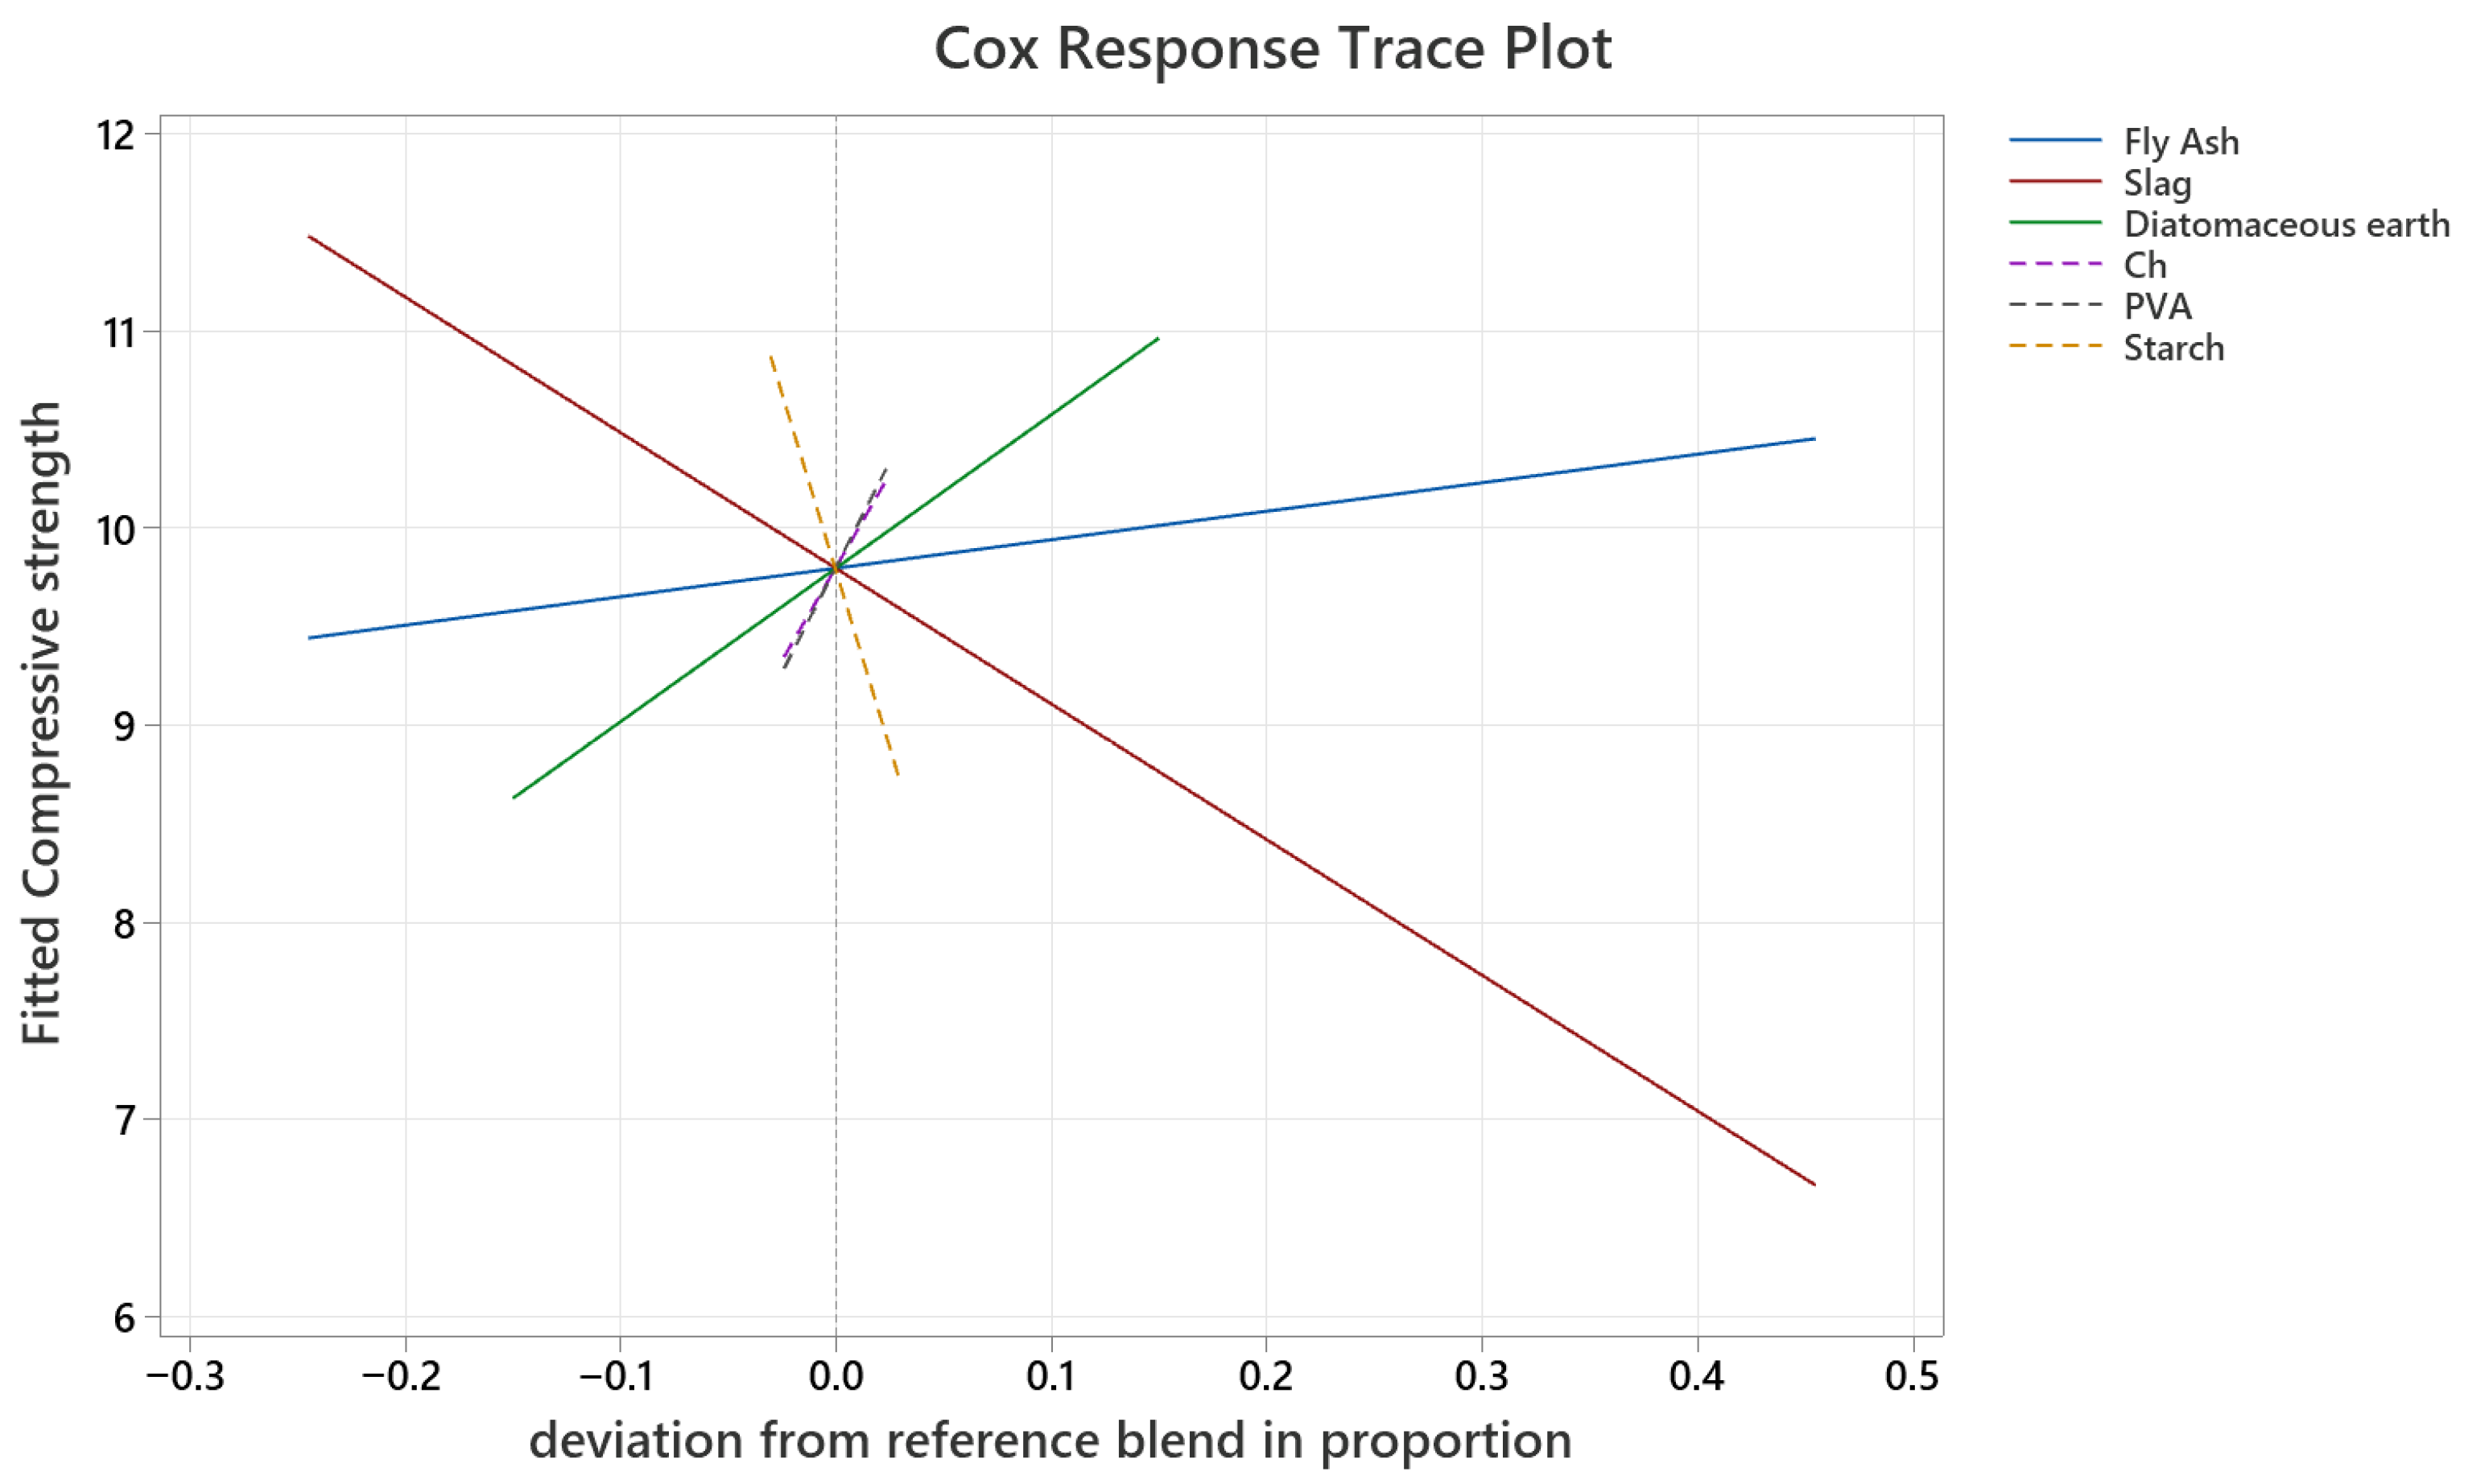
The results of the compressive strength tests were used to create and analyze the mixture designs. The linear dependence between all components of the mixture was tested. The analysis of variance (ANOVA) of the obtained model is presented in
Table 4, while the Linear Response Trace Plot is shown in
Figure 10.
The coefficient of determination (R
2) of the obtained regression model was 79.76%, which can be considered very good. The ANOVA test showed a high value of
F = 10.25, indicating the good predictive power of the model, and a
p-value < 0.001, confirming the statistical significance of the obtained results. The residual error of the regression model was 0.9991, which is of the same order of magnitude as the standard deviation in the experimentally obtained data. This indicates that the obtained model can adequately describe the experimental data to a considerable extent. The graph shown in
Figure 10 displays a slight positive slope for the lines representing fly ash (
β = 0.105) and diatomaceous earth (
β = 0.164), with diatomaceous earth exhibiting a somewhat steeper slope. This indicates that as the proportion of these components in the initial mixture increases, the compressive strength correspondingly increases, with diatomaceous earth having a stronger effect. On the contrary, slag shows a negative slope, meaning that increasing its proportion decreases the compressive strength of the geopolymer. PVA (
β = 0.306) and Ch (
β = 0.282) exhibit a very positive slope within the tested ranges, suggesting that small additions of these additives improve the compressive strength of the materials. Conversely, ST has an extremely negative slope, and its addition reduces compressive strength. All the results obtained through the Mixture Design Experiment are in agreement with the earlier findings.
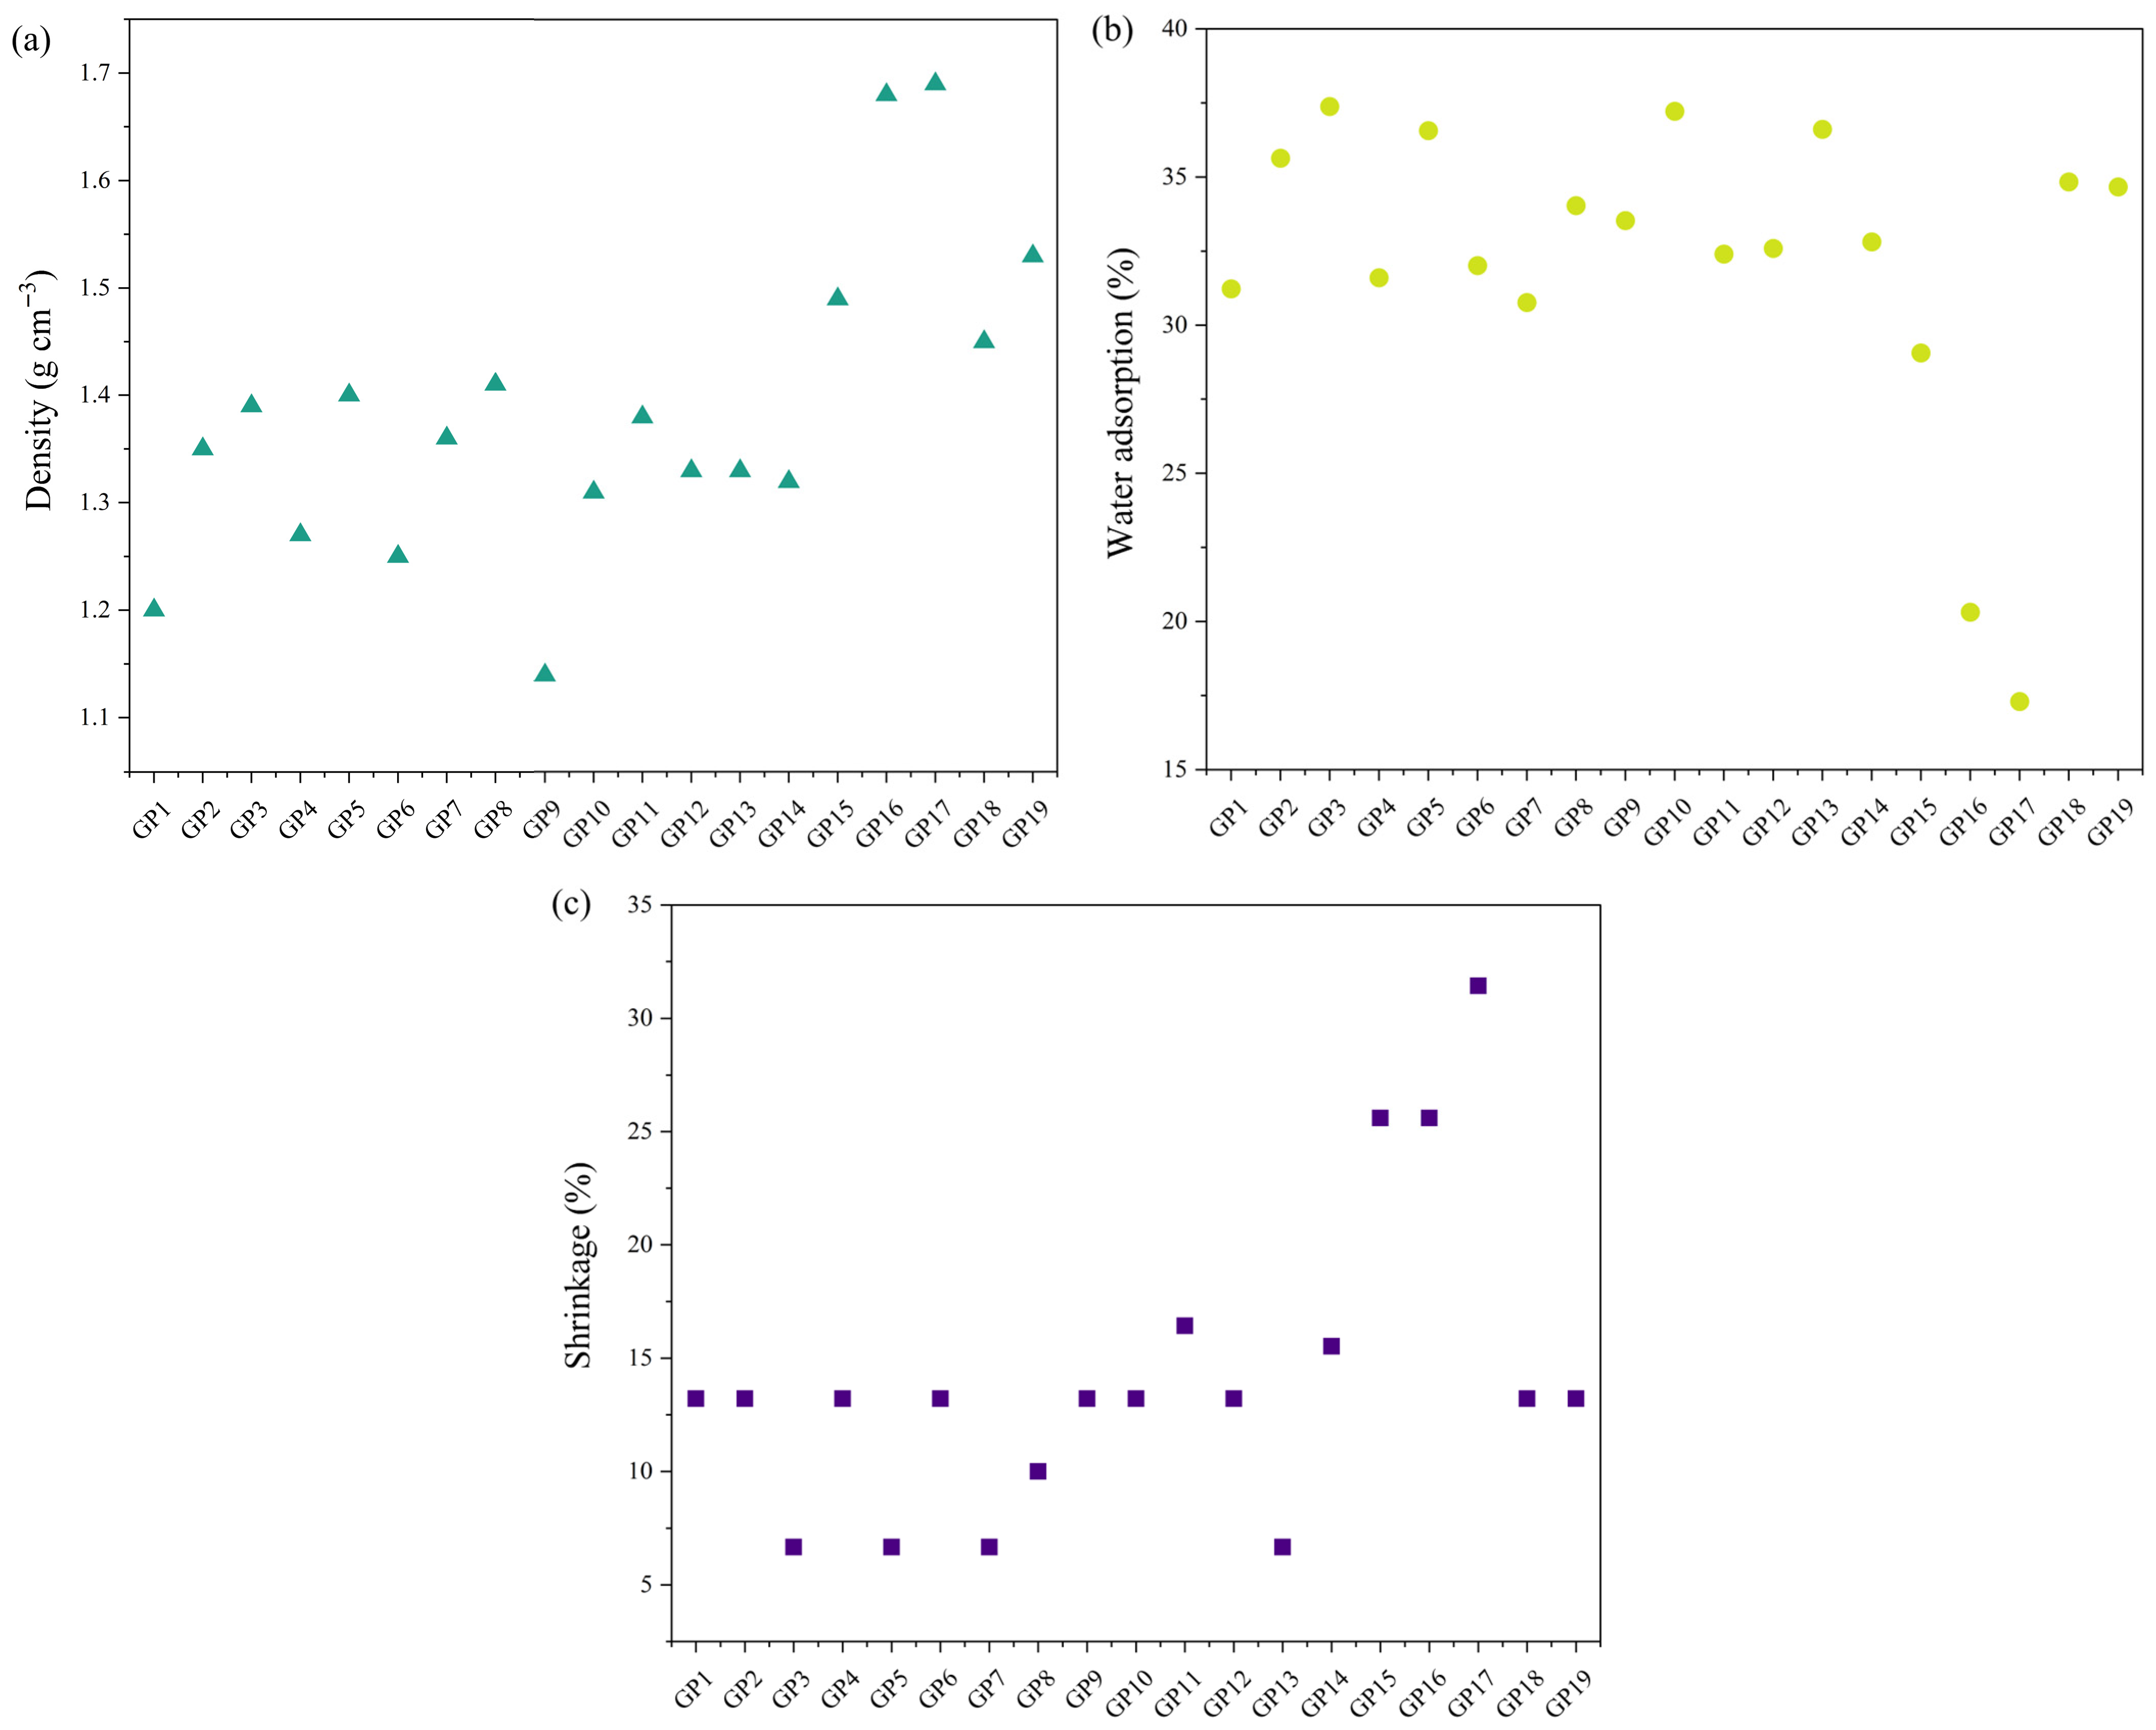
Figure 11 is a graph presenting physical–chemical properties of the obtained materials: density, water adsorption, and shrinkage percentage.
Physical–chemical properties show a very similar trend in behavior with small deviations. The density of the geopolymers formed from slag and/or fly ash ranged from 1.2 g cm−3 to 1.4 g cm−3, and the amount of adsorbed water ranged from 30% to 38%. The samples where diatomaceous earth was added in the amount of 10% to 30% showed a much higher density (from 1.5 g cm−3 to 1.7 g cm−3) and a much lower amount of adsorbed water (from 17.3% to 29%). The obtained results are consistent with the observed microstructural characteristics and indicate that there is a certain correlation between the behavior and microstructure of the synthesized geopolymer materials. Namely, the higher the density was, the lower the amount of adsorbed water and higher the percentage of initial material shrinkage observed.
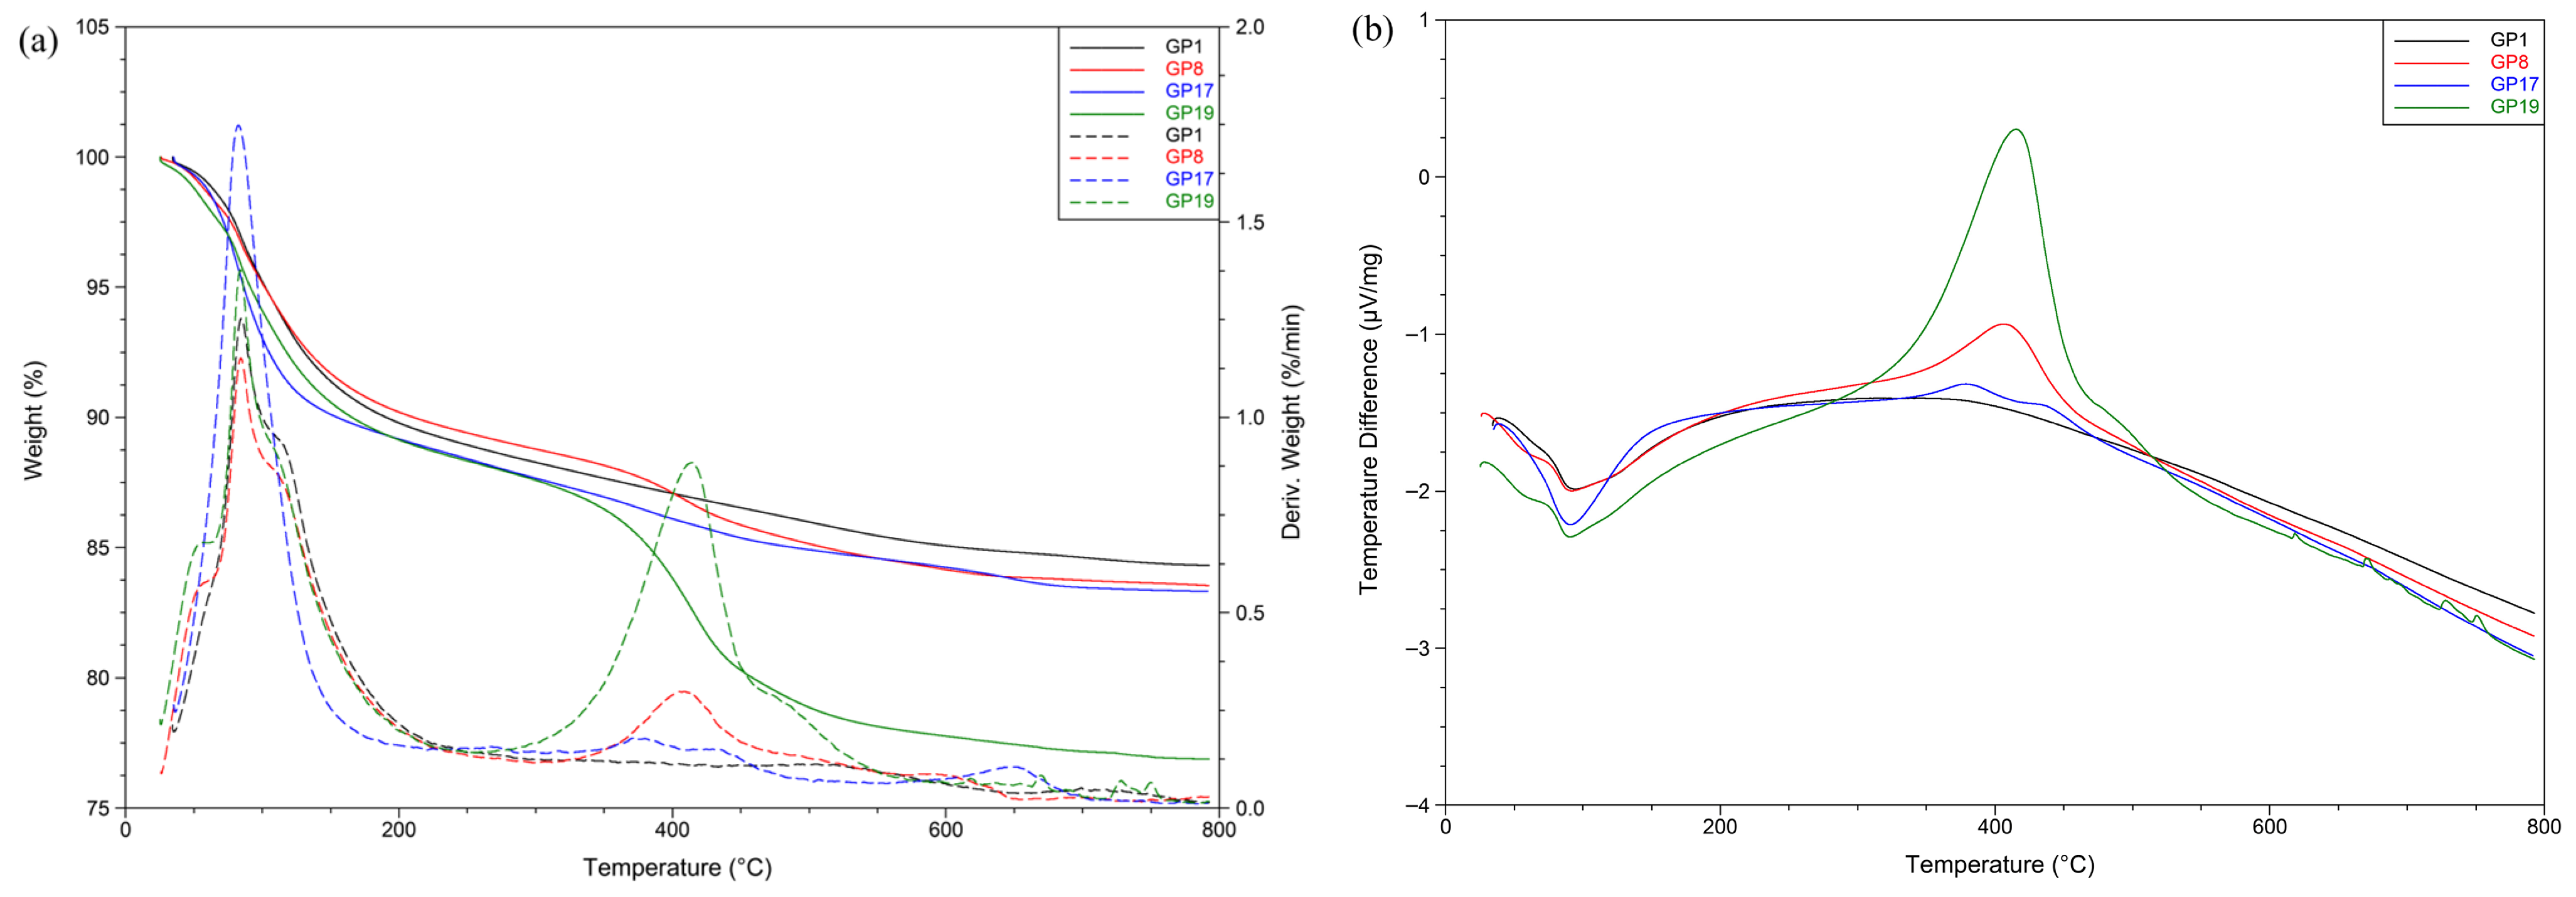
Figure 12 shows the behavior of selected materials (GP1, GP8, GP17, and GP19) during heating. The behavior was monitored by TG, DTG, and DSC methods.
In the TG and DTG diagrams, as well as in the DSC diagram, two major intervals where mass loss occurs are observed. The first temperature interval ranges from 50 °C to 200 °C, with maximum mass loss around 84 °C, and the DSC curve suggests that this is an endothermic change. This mass change suggests a loss of free and chemically bound water [
20]. This change is more striking in the geopolymers that contain the diatomaceous earth, while it is smaller in the others, where the mass losses in this interval range from 9.8% to 10.9%. The next significant mass loss on the TG/DTG curve is recorded in the temperature interval from 350 °C to 500 °C, with a maximum at around 400 °C, while on the DSC curve this change is exothermic and striking in geopolymers made of slag; in fact, the higher the proportion of slag, the more evident this change becomes. Mass loss ranges from 7.5% to 1.7%. This mass loss indicates the crystallization of iron oxide into hematite and the onset of the decarboxylation phase, most likely corresponding to the decomposition of Na
2CO
3, which was either present in the initial raw mixture or formed as a result of the reaction between residual NaOH and atmospheric CO
2 [
20,
56].
Table 2 also shows that the greatest loss of mass in the initial raw materials actually appeared in the case of slag, which may also suggest the presence of certain substances that are prone to decomposition at that temperature. The total mass loss for all materials ranged between 23% and 16%.
3.4. Leaching of Heavy Metals from Geopolymers
In order to test the stability of synthetic geopolymer materials in different environments, and to check their suitability for use as building materials, the materials were immersed in different media that simulate natural conditions. The aim was to examine to what extent the leaching of heavy metals into the environment is substantial under different conditions.
The results of heavy metal leaching are shown in
Figure 13. The contents of Cr, Cu, Mn, Ni, Pb, Zn, and Fe were measured. Elements whose concentration in the solution was below the detection limit appeared to be Ag, Co, and Cd.
The results obtained show that the leaching of iron from geopolymers rises to the highest extent, which can be explained by its high share in the initial raw material mixture. The amounts of leached iron range from 2.2 mg kg
−1 to 43.8 mg kg
−1 in demineralized water, from 1.7 mg kg
−1 to 6.3 mg kg
−1 in acetic acid of a concentration of 1 mol dm
−3, and from 18.8 mg kg
−1 to 139.5 mg kg
−1 in nitric acid of concentration of 0.5 mol dm
−3. Zinc and manganese can also be found to be present to a large extent, while elements such as copper, chromium, nickel, and lead are released from geopolymers in very low concentrations, lower than 1.4 mg kg
−1. The intensity of leaching of elements differs depending on the environment; however, a corresponding trend can be observed, and the largest amounts of elements are discharged in highly acidic conditions, i.e., in nitric acid at a concentration of 0.5 mol dm
−3, while the smallest amounts of elements are discharged in weaker acidic conditions, i.e., in acetic acid at a concentration of 1 mol dm
−3. These deviations are most outstanding when it comes to lead; lead is not released at all in demineralized water and acetic acid, which is not the case for strongly acidic environments. This behavior of the materials is extremely favorable, because such extremely acidic conditions, as simulated here with nitric acid, cannot be found in the environment. Although cadmium leaching did not occur under any conditions, nor was lead leached in extremely acidic conditions, a problem can arise when hazardous elements such as chromium and nickel are released. The concentrations of these elements in demineralized water ranged from 0.15 mg/kg to 0.28 mg/kg for chromium, and from 0.10 mg kg
−1 to 0.19 mg kg
−1 for nickel. Although these values were low, especially considering that they were released not earlier than 28 days of exposure, they have an extremely negative effect on the mechanical characteristics. This conclusion was demonstrated in the work of Boutkhil et al. [
38], where a 2.54 times lower compressive strength was recorded during a two-month exposure to acetic acid.
The obtained leaching test results were compared with the leaching values based on the Regulation on Waste Testing and Classification (Official Gazette of the Republic of Serbia, Nos. 56/2010, 93/2019, 39/2021, and 65/2024) [
57], which is aligned with Directive 2003/33/EC. In most cases, the leachate testing of these materials classified them as inert waste. Exceptions occurred only during leaching in concentrated HNO
3 in the case of geopolymer GP 19 (
c(Cr) = 0.68 mg kg
−1,
c(Pb) = 0.82 mg kg
−1) and in sample GP 4 (
c(Cr) = 4.34 mg kg
−1).
3.5. A Chemometric Approach to the Correlation Between Geopolymer Composition and Mechanical Properties
For the purpose of the analysis of similarity in behavior between the tested geopolymer samples obtained from different raw materials, a cluster analysis was used. This analysis was also used to examine the similarities in the physical–chemical behaviors and mechanical properties of the obtained geopolymers that were composed of the same initial raw material mixture.
The results of this analysis are shown in the dendrogram in
Figure 14.
The primary goal of cluster analysis (CA) is to define the structure of the data by placing the most similar observations in a group. The linkage between objects is based on the idea that similarity is inversely proportional to the distance between samples. CA calculates the distance between objects using standard distance measures [
58]. A hierarchical agglomerative method of grouping was applied, which represents a graphical representation of the grouping of individual observations using a dendrogram. In agglomerative methods, each observation starts as its own cluster. In subsequent steps, the two closest clusters are combined into a new cluster, thus reducing the number of clusters in each subsequent step [
59]. The Ward method of linkage was used. Ward’s method uses the squared Euclidean distance to minimize the increase in total within-cluster variance when merging clusters. Initially, the variables were standardized by applying the z-transformation.
The cluster analysis that examined the relationship between the physical–chemical and mechanical properties of the obtained materials and the composition of the initial raw materials grouped the data into three clusters. The first cluster included density, diatomaceous earth, and the percentage of material shrinkage; the second cluster included the amount of PVA, fly ash, and compressive strength; and the last, third cluster contained the amount of ST, Ch, slag, and water adsorption. The geopolymer samples were grouped into four clusters. The first cluster consisted of samples with a prevailing amount of diatomaceous earth present (GP16 and GP17), while the second cluster consisted of samples containing a prevailing amount of slag (GP18 and GP19) and samples representing a mixture of fly ash and slag with the addition of ST (GP13 and GP14), as well as with the addition of 2.5% PVA (GP10). The third cluster consisted of geopolymer samples based on fly ash (GP1-GP7), as well as of some samples that included 30% fly ash and 70% slag (GP9 and GP12). All the other samples formed the last, fourth cluster: GP15, GP8, and GP11.
Cluster analysis revealed a strong relationship between the starting material composition, quantity and type of additives, and mechanical properties of the synthesized geopolymers, which will be useful when selecting these materials as replacements for cement.
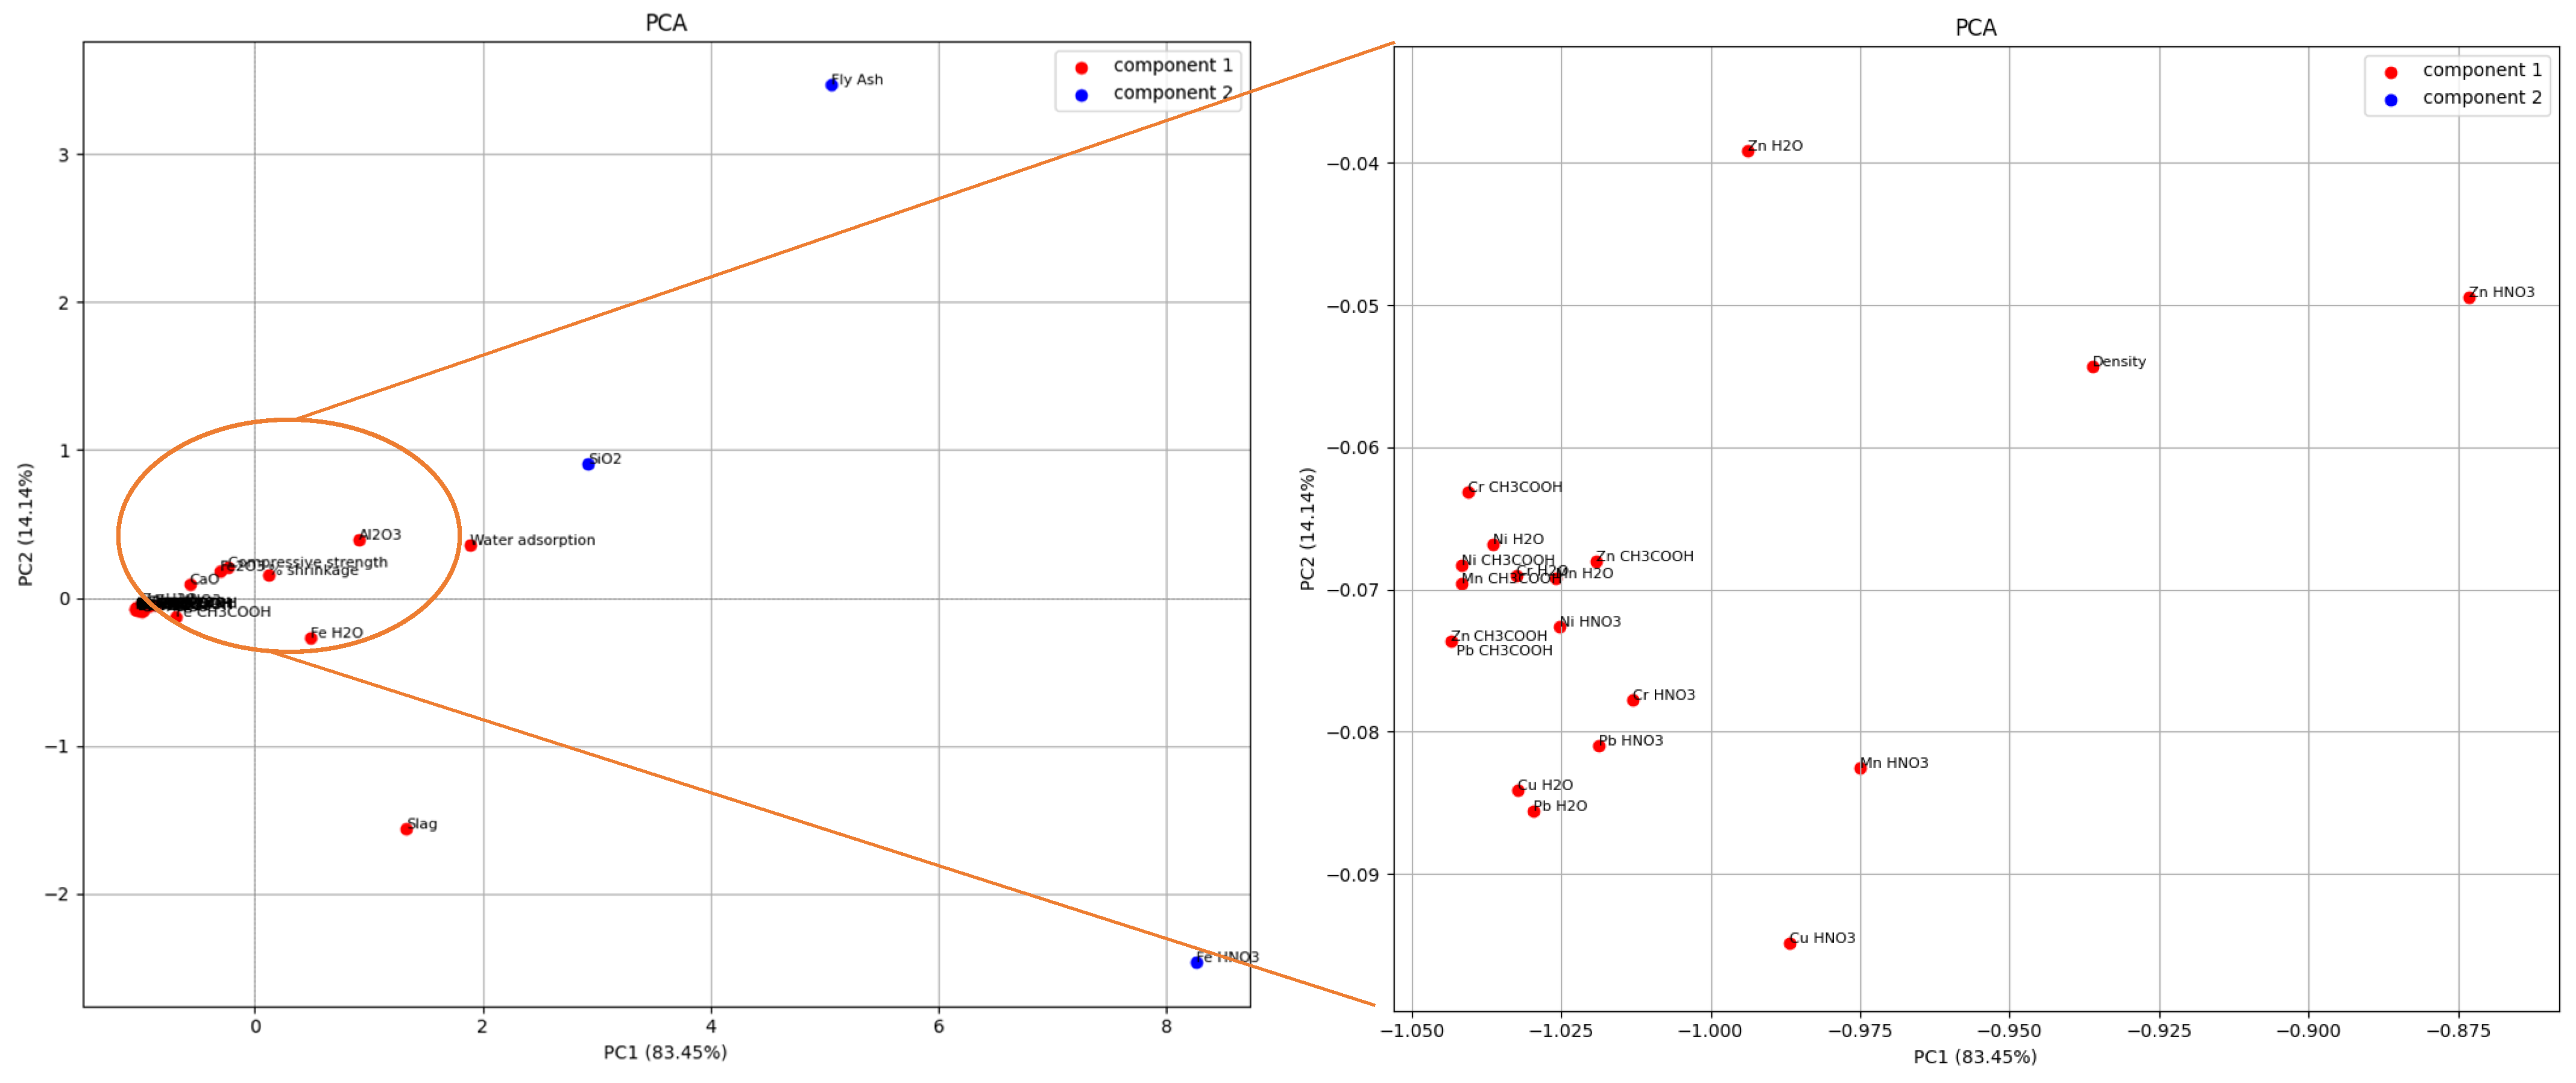
Grouping of physical–chemical and mechanical properties with the amount of leached metals and the composition of the initial raw material mixture based on all correlations between them was performed using principal component analysis. The obtained results are shown in
Figure 15.
The main goal of PCA is to reduce the dimensionality of a data set consisting of a large number of interrelated variables while retaining as much of the variation present in the data set as possible. More precisely, PCA linearly combines two or more correlated variables into a single variable. The essence of the analysis is based on the idea that a large data set is analyzed in terms of the relationships between individual points in that data set. PCA produces a series of new orthogonal variables (principal components, or vectors) that are linear combinations of the original variables. PCA is often the first step in data analysis, with the aim of discovering patterns and relationships between measured parameters for further multivariate analysis. It is the most commonly applied technique for reducing the amount of data, compressing variables, and finding correlations between them [
60,
61,
62].
Two principal components with eigenvalues greater than 1 were extracted. The second principal component consists of the SiO2 present, the amount of fly ash present, and the amount of leached Fe in nitric acid. All other parameters examined represent the first principal component. This result indicates that in subsequent studies the number of materials can be reduced and some mixtures can be excluded, as well as some parameters that describe the properties of the materials. It can be seen that there is a strong correlation between the glassy ash content and leached metals, but also with compressive strength and water adsorption.


