Abstract
Catalytic upgrading of bioethanol via a C–C coupling reaction is a sustainable method of producing 1-butanol, a high-performance biofuel. This reaction was studied using a flow-through microreactor system with Pd/MgO-Al2O3 and bimetallic Pd-Cu/MgO-Al2O3 mixed oxide-based catalysts in a H2 carrier gas at a pressure of 21 bar and temperatures ranging from 200 to 350 °C. The effect of the metal promoter(s) on the hydrogen transfer reaction steps in the overall reaction was investigated. The palladium promoter significantly improved the activity and butanol selectivity across the entire temperature range. However, the yield of liquid products decreased significantly at temperatures higher than 250 °C, primarily because the decarbonylation side reaction of the acetaldehyde intermediate accelerated. The promoting effect of Pd was most beneficial below 250 °C because the decarbonylation reaction was inhibited by the reversible poisoning effect of CO on multiple Pd sites responsible for decarbonylation. Diluting the Pd phase with Cu increased liquid yields due to gradually decreasing decarbonylation activity. However, the dehydrogenation–hydrogenation activity decreased as well, as did the promoting effect on the corresponding reaction steps in the coupling reaction. Additionally, the product distribution changed dramatically, decreasing 1-butanol selectivity, because metallic Cu can catalyze the formation of ethyl acetate and ketone products.
1. Introduction
Biobutanol is considered a potential alternative to bioethanol presently used in large quantities as renewable blending component of gasoline. It has several advantages over bioethanol, including a higher energy density (29.2 MJ/L vs. 24.0 MJ/L), a non-corrosive nature due to its low miscibility with water, a lower vapor pressure, a higher allowable blend ratio, and research octane number close to that of gasoline [1,2,3]. It can be used as a pure fuel or blended with gasoline in high concentration without any modification of the conventional engines [1].
The Guerbet self-coupling reaction of bioethanol [4,5] provides a promising perspective for 1-butanol synthesis from bioethanol. The reaction requires basic catalysts or catalysts with both base and acid sites. The mechanism of the ethanol self-coupling reaction is complex and remains debated due to its sensitivity to catalyst type and reaction conditions. In the most commonly proposed pathway, C–C bond formation occurs through the aldol condensation of two acetaldehyde intermediate molecules via surface enolate species [4,5]. Because the reaction intermediates are a primary enolate and an aldehyde, the self-coupling reaction of ethanol produces 1-butanol. The aldol condensation pathway consists of a series of reaction steps involving four main reaction steps: (i) ethanol is dehydrogenated to produce acetaldehyde, (ii) acetaldehyde undergoes aldol self-condensation to form acetaldol, (iii) acetaldol is dehydrated to form crotonaldehyde, and (iv) crotonaldehyde is hydrogenated (in two steps) to produce 1-butanol. During the final hydrogenation steps, if molecular hydrogen and an active metal component are not present, hydrogen must be transferred from an alcohol molecule to the unsaturated aldol product. This most likely occurs via the Meerwein–Ponndorf–Verley (MPV) reduction mechanism [4,5,6,7]. During the MPV reduction process, the transfer of hydrogen from ethanol results in the formation of acetaldehyde, which can then participate in the chain reaction.
Other proposed mechanisms are the so called direct condensation and semi-direct condensation pathways [4,5,8,9,10,11]. In the direct coupling pathway, the β-hydrogen of the ethanol molecule becomes activated, causing it to participate in condensation reaction with another ethanol molecule. Note that the direct coupling pathway was suggested for strong base catalysts, such as MgO or alkaline metal zeolites, in the absence of a metal promoter at relatively high reaction temperatures (over 350 °C), where unwanted side reactions could have been significantly accelerated [4,9]. The semi-direct pathway begins with the dehydrogenation of an ethanol molecule, giving an acetaldehyde intermediate. This intermediate then reacts with an ethanol molecule to form either butanal or crotyl alcohol. During the final hydrogenation step, hydrogen is transferred from an alcohol molecule to the unsaturated aldol product most likely via the MPV mechanism as suggested for the aldol condensation pathway (vide supra). The contribution or dominance of the direct, semi-direct, or aldol condensation pathways in the ethanol coupling reaction to butanol depend on the catalyst and the reaction conditions, especially on the reaction temperature, and still is a matter of debate [10,11,12].
The catalyst is a key factor in the performance of the ethanol coupling reaction and the distribution of its products. Heterogeneous catalytic systems are preferred over homogeneous catalytic systems for industrial-scale ethanol coupling because there is no catalyst separation problem, and, ideally, the system can operate continuously for long periods without extensive regeneration, improving efficiency, activity, and sustainability. These catalytic systems include basic, alkaline metal form zeolites [8,13], magnesia [9], non-stoichiometric hydroxyapatite [6,7], and the most widely studied magnesia–alumina mixed oxides [14,15,16], which are also the main subject of this work.
The mixed oxide catalysts, formed by incorporating aluminum into the structure of basic magnesia, are among the most often used catalysts, as they have strong and moderately strong base sites and sites of medium and strong acid strength necessary for the aldol condensation and dehydration steps to take place [14,17]. They can be prepared by calcining the corresponding hydrotalcite precursor [14,18]. An advantage of this catalyst is that by varying the Mg/Al ratio in the hydrotalcite precursor and/or the calcination temperature, the strength of the base and acid centers can be varied to shift the selectivity towards the Guerbet alcohol product and minimize the undesired side reactions, e.g., formation of ether and ester and dehydration of alcohols to olefins [4,14,15,16,19]. In a recent work, we demonstrated in a combined experimental and kinetic modeling study that, for ethanol–ethanol coupling to 1-butanol, aldol condensation is the dominant pathway below 335 °C, while semi-direct coupling to crotyl alcohol prevails above 340 °C when using a MgO–Al2O3 mixed oxide (Mg/Al = 2:1) derived from a hydrotalcite precursor [20].
The ethanol self-coupling reaction does not require external H2 source and/or dehydrogenating–hydrogenating metal sites. However, the initial and final hydrogen transfer steps of the aldol condensation and semi-direct condensation pathways can be promoted by introducing active metal catalyst component. Transition metal promoters have been widely used to promote ethanol conversion to butanol by facilitating the dehydrogenation of ethanol and/or the hydrogenation of the unsaturated reaction intermediates. Transition metals such as Pd, Ru, Ni, Co, and Cu were found to improve the activity of mixed oxides in the Guerbet coupling reaction by promoting the hydrogen transfer reaction steps [21,22,23,24]. The promoters can effectively lower the required temperature for the overall coupling reaction; however, a metal of high activity, such as Pd, can facilitate undesired hydrodeoxygenation (HDO) reactions, mainly decarbonylation reactions leading to significant amount of alkane byproducts and CO [23,25,26]. Conversely, a transition metal with low hydrogenation–dehydrogenation activity, such as Cu, is less effective in accelerating the hydrogen transfer steps, but exhibits low HDO and/or decarbonylation activity [25,26]. These results suggest that the hydrogenation–dehydrogenation and acid-base functions of the catalyst must be balanced to achieve a high reaction rate and selectivity toward the desired coupling product, butanol, although the effects of these functions on the reaction are still far from being fully understood.
The selectivity of noble metal-containing heterogeneous catalysts can be controlled by adding a second metal with lower hydrogenation–dehydrogenation activity. Optimal changes in the surface structure and/or electronic properties can inhibit side reactions and accelerate the desired reaction [27]. In recent years, bimetallic Pd-Cu catalysts have been used in several heterogeneous catalytic reactions such as C-C bond formation, selective hydrogenation of alkynes, and hydrogenation of CO2 [25,26,28,29,30]. For example, Goulas et al. [25] observed increased selectivity of ethanol-acetone-butanol (ABE mixture) and 1-octanol coupling reactions using a Pd-Cu alloy catalyst (with a Pd/Cu atomic ratio of 3) supported on MgO-Al2O3/activated carbon support compared to a supported Pd catalyst. They attributed the significantly improved oxygenate coupling selectivity to the dramatic suppression of the decarbonylation side reaction.
In a previous work, we investigated the promoting effect of Pd, Pt, Ni and Ru metals on a MgO-Al2O3 mixed oxide catalyst in the Guerbet coupling reaction of ethanol [19]. The most favorable effect was obtained with the Pd promoter (1 wt.% Pd on MgO-Al2O3) under reducing atmosphere using H2 carrier gas. However, the beneficial effect of Pd could be observed only within a narrow temperature range (200–250 °C), where the equilibrium allowed significant concentrations of both dehydrogenated and hydrogenated products formed in the initial dehydrogenation and closing hydrogenation steps, respectively. At higher reaction temperatures (≥275 °C) mainly the decarbonylation side reaction on the metallic active sites, producing C1–C3 alkanes and CO, was significantly accelerated.
In the present work, the strategy suggested by Goulas et al. [25,26] was applied to suppress the decarbonylation activity of Pd via modification with Cu. The Pd atoms in a 1 wt.% Pd/MgO-Al2O3 catalyst were partially replaced by Cu atoms to obtain Pd-Cu/MgO-Al2O3 catalysts with increasing molar fraction of Cu (0.25–0.75) to improve the butanol selectivity of the ethanol self-coupling reaction. Our results show that the introduction of Cu can effectively suppress the decarbonylation activity of the catalyst. However, an increasing molar fraction of Cu, greater than 0.25, weakens the promoting effect of Pd in the dehydrogenation–hydrogenation steps of the coupling reaction and reduces the selectivity of butanol due to the acceleration of side reactions that lead to C4 oxygenates, such as ethyl acetate, as well as C4 ketones and aldehydes. The underlying reasons of the changing catalytic behavior are discussed.
2. Materials and Methods
2.1. Catalyst Preparation
Details on the preparation of MgO-Al2O3 mixed-oxide catalysts can be found elsewhere [19]. In brief, the hydrotalcite precursor with a Mg/Al atomic ratio of 2 was prepared using the co-precipitation method. An aqueous solution was prepared using Mg(NO3)2·6H2O and Al(NO3)3·9H2O (Sigma-Aldrich, Merck KGaA, Darmstadt, Germany). The solution containing Mg2+ and Al3+ ions at concentrations of 1 M and 0.5 M, respectively, was slowly added to NaOH buffer solution at a pH of 11.5 with continuous stirring at room temperature. Simultaneously, 2 M NaOH solution was added dropwise to maintain the pH at about 10. Based on our previous study, the hydrotalcite precursor was calcined in air at 550 °C for three hours to produce a MgO-Al2O3 mixed oxide catalyst with favorable acid-base and catalytic properties [19]. This MgO-Al2O3 mixed oxide catalyst was also used as a support material to prepare the Pd and/or Cu containing MgO-Al2O3 mixed oxide catalyst samples. The metal promoters were introduced to the support via wet impregnation method using aqueous solutions containing calculated amount of Pd(NO3)2·4NH3 (5% Pd containing solution, abcr, Karlsruhe, Germany) and/or Cu(NO3)2·3H2O (Sigma-Aldrich, Merck KGaA, Darmstadt, Germany) metal precursor compounds. Monometallic catalysts containing 1 wt.% Pd (93.96 μmol Pd/gcat.) or 0.59 wt.% Cu (93.96 μmol Cu/gcat.) on MgO-Al2O3 and three additional bimetallic catalyst samples were prepared, having 93.96 μmol metal/gcat., wherein the catalyst contained Cu beside Pd atoms in molar fractions of 0.25, 0.50, and 0.75. After drying at 70 °C for 24 h, the samples were heated at 550 °C in air to decompose the precursor compounds. The catalyst samples are designated as Pd1.0/MgO-Al2O3, Pd0.75Cu0.25/MgO-Al2O3, Pd0.5Cu0.5/MgO-Al2O3, Pd0.25Cu0.75/MgO-Al2O3 and Cu1.0/MgO-Al2O3. The catalyst samples were reduced in situ in H2 flow at 500 °C for 2 h before the catalytic runs.
2.2. Catalysts Characterization
2.2.1. X-Ray Powder Diffraction (XRPD)
The XRPD measurements were performed using a Philips PW 1810/3710 (Amsterdam, The Netherlands) diffractometer equipped with a graphite monochromator (CuKα radiation, λ = 1.5418 Å) and an Anton Paar (Graz, Austria) HT1200 high-temperature chamber. The XRPD patterns were recorded in steps of 0.02° 2θ with a scan duration of 5 s per step, while the X-ray tube operated at 40 kV and 35 mA.
2.2.2. Transmission Electron Microscopy (TEM)
TEM investigations were carried out using a JEOL JEM 1011 microscope (Tokyo, Japan) equipped with a side-mounted Morada 11-megapixel camera (Olympus Soft Imaging Solutions, Münster, Germany)., to study the morphology of the samples. The samples were suspended in ethanol and drop-casted onto a 300 mesh copper grid, coated by Formvar and Lacey carbon support film. The TEM images were obtained at an accelerating voltage of 80 kV.
2.2.3. The Specific Surface Area (SSA) of the Catalyst
The SSA of the catalysts was determined based on the N2 adsorption isotherms. The samples were pretreated at 250 °C in vacuum of 10−6 mbar for 4 h, then the adsorption isotherms were measured at the temperature of the liquid nitrogen (−196 °C) using an automatic, volumetric adsorption analyzer (The “Surfer”, Thermo-Fisher Scientific, Waltham, MA, USA). The SSA of the samples were calculated using the Brunauer–Emmett–Teller (BET) method.
2.2.4. Temperature-Programmed H2-Reduction (H2-TPR)
The H2-TPR measurements on the metal-containing catalyst samples were carried out in a home-made apparatus. About 200 mg sample from the 0.5–0.8 mm sieve fraction of the catalyst was calcined in air at 550 °C, placed in a U-shape quartz reactor tube (I.D. = 4 mm) and pretreated in a 30 cm3/min N2-flow at 550 °C for 1 h, then allowed to cool to room temperature in the N2 stream. The gas flow was switched to a 30 cm3/min flow of a 10 vol.% H2/N2 reducing gas mixture. The sample was then heated at a ramping rate of 10 °C/min to 600 °C and held at this temperature for 1 h. The effluent gas was passed through a liquid nitrogen cooled trap to remove the water from the effluent gas before reaching the thermal conductivity detector (TCD) used to monitor the change in the H2 concentration during the reduction process. The hydrogen consumption was determined from the area under the H2-TPR curve using a previously determined calibration value obtained by the reduction of a known amount of CuO under the same conditions.
2.2.5. CO Pulse Chemisorption
The concentration of surface metal sites was determined by CO pulse chemisorption experiments carried out using the same apparatus as for the H2-TPR measurements. Approximately 100 mg of the catalyst sample (sieve fraction of 0.5–0.8 mm) was placed in the quartz reactor tube and reduced in situ in a 50 cm3/min H2 flow at 500 °C for 1 h. The sample was flushed then with a 20 cm3/min He flow and allowed to cool to room temperature in a He flow. At room temperature, pulses of 10 µL CO were injected into the He flow that was passing through the catalyst sample. A thermal conductivity detector (TCD) monitored the CO concentration of the He. The injection of CO pulses was continued until the sample was saturated by CO. The amount of chemisorbed CO was calculated from the TCD peak areas of the CO pulses.
2.2.6. Fourier-Transform Infrared (FT-IR) Spectroscopy
The electronic state of the MgO-Al2O3 supported metal particles was characterized by analyzing the FT-IR spectra of adsorbed CO. The FT-IR spectrum of the surface species from the adsorption of CO were recorded in transmission mode using a Nicolet 6700 FT-IR (Thermo-Fisher Scientific, Waltham, MA, USA) equipped with a home-made in situ IR-cell equipped with CaF2 windows. A self-supported wafer (with a thickness of 5–10 mg/cm2) was prepared from the catalyst sample and placed into the IR-cell. Prior to CO adsorption, the catalyst wafer was reduced in situ in H2 flow at 450 °C for 1 h, then evacuated under high vacuum (10−6 mbar) at this temperature for 30 min and cooled to room temperature under evacuation. The spectrum of the activated catalyst sample was collected at room temperature, then the sample was exposed to 5 mbar CO at room temperature, followed by evacuation to remove the gas phase CO from the cell. The sample spectrum, containing the spectrum of the surface species from the adsorption of CO was collected and then a difference spectrum was generated by subtracting the spectrum of the wafer collected before CO adsorption from the spectrum of the CO-loaded wafer. All spectra were collected by averaging 128 scans with a resolution of 2 cm−1. To enable quantitative comparisons, each spectrum was scaled to 5 mg/cm2 wafer thickness.
It should be noted that the development of the spectra of the adsorbed species was monitored over time in the presence of 5 mbar of CO gas and during evacuation at 10−6 mbar to determine the steady-state CO coverage of the catalyst surface. Since the band intensities stabilized within 15 min in both cases, spectra collected after 20 min equilibration were used for further analysis.
2.2.7. Quasi-Operando Diffuse Reflectance Infrared Fourier-Transform (DRIFT) Spectroscopy
The formation of surface species from ethanol and their transformation on the catalyst surface were studied using a Nicolet iS10 spectrometer (Thermo Scientific) equipped with a DiffuseIR mirror system and a flow-through DRIFT reactor cell (PIKE Technologies, Fitchburg, WI, USA). The cell design allows the flow of a carrier gas or a gas phase reactant mixture to pass through the catalyst bed at a controlled flow rate. The sample holder of the reactor cell was filled with the finely powdered catalyst sample (about 20 mg). The metal-containing catalysts were in situ reduced in a 30 cm3/min H2 flow at 450 °C for 1 h then was cooled to 30 °C in H2 flow. The adsorption and reaction of ethanol (EtOH) was initiated by switching the H2 flow to a saturator unit filled with ethanol. The H2 gas flow, saturated with ethanol vapor at 0 °C (1.58 vol.% EtOH/H2), was passed through the catalyst bed for 30 min at 30 °C. Then the reaction temperature was raised at a rate of 2 °C/min up to 350 °C under continuous flow of the EtOH/H2 reactant mixture. Spectra were taken in every five minutes (10 °C increments) between 30 and 350 °C. The series of the sample spectra were corrected with the spectra of the catalyst in pure H2 flow collected at about the same temperatures. The resulting difference spectra are related to both molecularly adsorbed ethanol and surface species formed in a surface reaction, as well to gas-phase ethanol above the catalyst. However, the contribution of the gas-phase spectrum was proved to be nearly negligible under the applied conditions. Therefore, the absorption bands appearing in the difference spectra can be attributed predominantly to surface species formed (positive bands) or consumed (negative bands) during the adsorption and/or reaction process on the catalyst surface. Note that the catalytic system was in a transient state because the reaction temperature was increased continuously throughout the experiment.
2.3. Catalytic Tests
The ethanol coupling reaction was investigated using a high-pressure, fixed-bed, flow-through catalytic reactor system. The reaction temperatures varied between 200 and 350 °C in a H2 carrier gas, while the total pressure was 21 bar. The weight hourly space velocity (WHSV) of ethanol was 1 , whereas the H2/ethanol molar ratio was set to 5. Two grams of the catalyst sample (sieve fraction of 0.5–0.8 mm) were loaded into a stainless-steel catalytic reactor tube (I.D. = 9 mm) and was in situ reduced in the reactor at 500 °C in a 50 cm3/min H2 flow for two hours prior to the catalytic run. The ethanol feed was provided by a high-precision HPLC pump (Gilson, Madison, WI, USA), while the H2 flow was controlled by a mass flow controller (Brooks, Hatfield, PA, USA). The effluent gas mixture from the reactor was passed through a separator unit to separate the liquid and gas phase products. The pressure in the catalytic system was set by an electronic back pressure regulator (Brooks, Hatfield, PA, USA) placed upstream of the reactor and the separator unit. The liquid product mixture was collected in every hour, when the steady state was reached in the catalytic system (usually after 1–3 h time-on-stream). The liquid products were analyzed by a gas chromatograph (Shimadzu 2010, Shimadzu Corporation, Kyoto, Japan) equipped with a Thermal Conductivity Detector (TCD) and a Flame Ionization Detector (FID) connected in series and a Zebron ZB-WAXplus capillary column (L 30.0 m × ID 0.32 mm × df 0.25 µm; Phenomenex, Torrance, CA, USA). Gaseous products, including CO2, CO, and volatile C1–C4 hydrocarbons, were analyzed by GC-TCD-FID system (HP 5890 Series II online, Hewlett-Packard, Palo Alto, CA, USA) using a Carboxen® 1006 PLOT capillary column (L 30 m × ID 0.32 mm; Supelco, Bellefonte, PA, USA).
The activity of the catalysts was evaluated based on ethanol conversion, yield of liquid products and product selectivity in the organic liquid phase product mixture, calculated by the following equations:
In Equations (1) and (2), , and mean the amount of EtOH in the feed and in the product mixture (g/h), respectively, whereas means the amount of the liquid product mixture (g/h). In Equation (3), and mean the concentration of an organic product (wt.%) and the total concentration of all organic products (wt.%) in the liquid phase.
3. Results and Discussion
3.1. Catalyst Structure
3.1.1. The MgO-Al2O3 Mixed Oxide Used as Support Material
The characteristics of the MgO–Al2O3 mixed oxide catalyst used as a support material in the present study have been discussed in our previous work [19]. Briefly, calcining the hydrotalcite precursor at 550 °C produced a MgO–Al2O3 mixed oxide with a specific surface area of 218 m2/g. This mixed oxide contained slit-like pores of non-uniform size, which is typical of calcined hydrotalcites [31,32]. XRD measurements confirmed that the hydrotalcite precursor transformed into the corresponding mixed oxide during the calcination process, which exhibits only the characteristic reflections of the cubic periclase form of MgO with no evidence of an aluminum oxide phase. The absence of the aluminum oxide phase indicates that the aluminum is finely dispersed in the magnesium oxide (MgO) structure, possibly resulting in the formation of Al–O–Mg linkages. Characterization of the acid-base properties by temperature-programmed desorption of CO2 and NH3 (CO2- and NH3-TPD) revealed that the MgO–Al2O3 mixed oxide catalyst calcined at 550 °C contained medium-strong and strong basic sites at concentrations of 70 and 110 µmol/gcat. It also contained medium-strong and strong Lewis acid sites at a concentration of 160 and 240 µmol/gcat, respectively. These balanced acid-base properties were optimal for achieving the highest butanol selectivity in the ethanol coupling reaction compared to catalyst samples obtained at lower (450–500 °C) or higher (600 °C) calcination temperatures [19]. The literature agrees on the necessity of acid-base pair sites as active sites for the C-C coupling process [14,17]. However, the strength required for these pairs in each reaction step is still a matter of debate. Both the dehydrogenation of ethanol to acetaldehyde and the aldol condensation to n-butanol proceed via the initial formation of surface ethoxide species on a Lewis acid–strong base pair [14]. Acetaldehyde condensation to form 1-butanol is a bimolecular reaction between adjacent acetaldehyde species that requires strong basic centers. These centers are believed to be the most catalytically relevant function in the system because they control the formation of enolates, which leads to the C-C coupling step necessary for 1-butanol formation [17].
Note that neither the number nor the distribution of basic sites was altered in the presence of 1 wt.% Pd metal (see Figure S1 in the Supplementary Materials).
3.1.2. The Metal-Promoted MgO-Al2O3 Mixed Oxide Catalysts
The measured metal content of the catalyst samples, as determined by elemental analysis (see Table 1), is very close to the nominal value of 93.96 µmol (Pd + Cu)/gcat., indicating that the calculated amounts of metal precursor compounds were nearly completely retained by the catalysts during wet impregnation.

Table 1.
Characterization of the catalysts.
The specific surface area of the metal containing catalyst samples ranged from 134 to 176 m2/g, and the pore volumes were similar (0.22–0.24 cm3/g). Note that during the wet impregnation process using the aqueous solution of the metal precursor salt, the MgO-Al2O3 mixed oxide support can partially reconstruct to the original hydrotalcite structure. After calcining the catalyst, containing the metal precursor, the metal oxide species become finely dispersed on the surface, potentially filling some of the mesopores [32]. This results in a lower surface area for the metal-containing samples compared to the MgO-Al2O3 mixed oxide support.
Figure 1 shows the XRPD patterns of the Pd-Cu/MgO-Al2O3 catalysts obtained after calcination and subsequent reduction of the catalyst precursors. The catalysts exhibit the same characteristic reflections of the cubic periclase form of magnesium oxide observed in the MgO-Al2O3 mixed oxide support [19], indicating that introducing the metal promoters did not alter the support’s structure. No characteristic reflections for metal phases were observed, suggesting that the size of the metal particles in the reduced catalysts is below the detection limit of XRPD (approximately 5 nm). These results are supported by the TEM images of the reduced catalyst samples, which show that the size of the metal particles in each sample is well below 5 nm (see Figure S2).

Figure 1.
XRPD patterns of (a) MgO-Al2O3, (b) Pd1.0/MgO-Al2O3, (c) Pd0.75Cu0.25/MgO-Al2O3, (d) Pd0.5Cu0.5/MgO-Al2O3, (e) Pd0.25Cu0.75/MgO-Al2O3, and (f) Cu1.0/MgO-Al2O3.
The XRPD patterns measured on the used catalyst samples (Figure S3) show no noticeable structural changes occurred during the catalytic reaction.
Figure 2 shows the H2-TPR curves measured on the calcined metal containing catalyst precursors. The H2-TPR curve measured on the Pd1.0/MgO-Al2O3 sample presents a derivative-shape feature between about 70 and 150 °C consisting of an overlapping positive and negative peak (Figure 2, a). The positive peak can be assigned to the hydrogen consumption during the reduction of easily reducible Pd species, whereas the overlapping negative band is due to the release of hydrogen from β-PdH (beta palladium hydride) formed on the previously formed Pd0 particles [33,34,35]. The reduction of PdO-like species weakly interacting with the support, if present, would reduce at or below room temperature (this fraction remains undetected under the conditions applied during the H2-TPR measurement). Therefore, the low-temperature reduction peak, starting around 70 °C, is probably due to the reduction of solvated Pd2+ weakly interacting with the mixed oxide support [34,36]. Meanwhile, the reduction peak that appears around 240 °C (Figure 2, a) is related to the relatively strong interaction between PdO and the support, whereas the peak at 370 °C is probably attributed to the combined effects of the strong interaction between PdO and the support, as well as the reduction of the support’s surface hydroxyl groups [35,37]. The H/Pd molar ratio of 0.64 calculated from the hydrogen consumption (Table 1) is about one third of the theoretical value of 2.0, which suggest that about two third of the Pd content was reduced at room temperature in the reducing gas flow before starting the temperature ramp during the H2-TPR measurement.
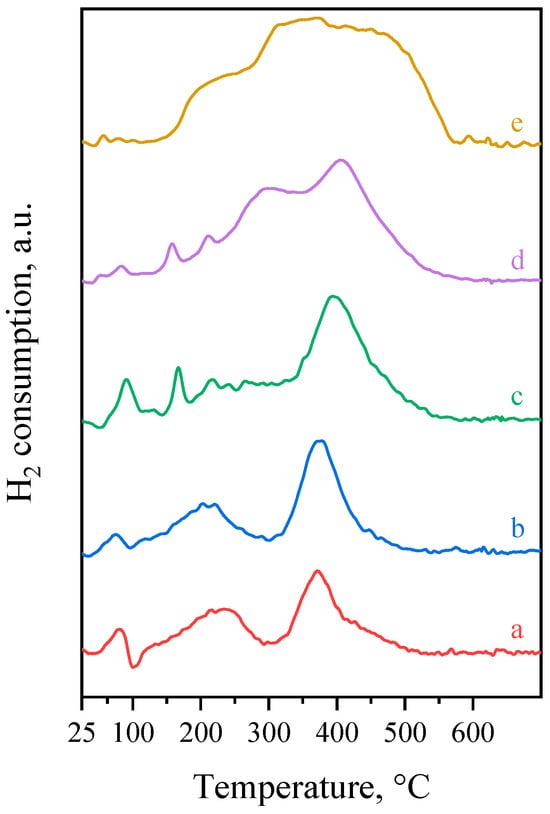
Figure 2.
H2-TPR curves of the (a) Pd1.0/MgO-Al2O3, (b) Pd0.75Cu0.25/MgO-Al2O3, (c) Pd0.5Cu0.5/MgO-Al2O3, (d) Pd0.25Cu0.75/MgO-Al2O3, and (e) Cu1.0/MgO-Al2O3 samples.
The H2-TPR curve obtained on the Cu1.0/MgO-Al2O3 sample exhibits a relatively low intensity shoulder at about 220 °C and a broad reduction peak (probably consisting two overlapping component peaks) in the temperature range of 250–550 °C (Figure 2, e). The low-temperature peak can be assigned to the reduction of small CuO crystallites, whereas the peak(s) appearing over about 250 °C can be attributed to reduction of better stabilized Cu2+/Cu+ species probably forming solid solution within the oxide lattice [21,32]. The H/Cu atomic ratio, calculated from the H2 consumption and the Cu content, was 1.97 for the Cu1.0/MgO-Al2O3 sample (Table 1). This value matches well with the theoretical value of 2.0, suggesting that the reduction of Cu is complete in this sample during the H2-TPR measurement.
The temperature range for the reduction of the bimetallic samples gradually shifted to lower temperatures at increasing Pd content (Figure 2, b–d) as the presence of Pd facilitates the reduction of Cu in the bimetallic particle [37,38,39]. This effect clearly suggests that close proximity between Cu and Pd species was achieved in the bimetallic samples [38]. The hydrogen consumption and the corresponding H/(Pd + Cu) atomic ratio for the bimetallic samples increases proportionally between 0.64 (Pd1.0/MgO-Al2O3) and 1.97 (Cu1.0/MgO-Al2O3) with the Cu content (Table 1). Note that the peak maxima of the reduction peaks, indicating the maximum rate of the reduction process, always appear below 500 °C (Figure 2), suggesting that both Pd and Cu in the catalyst samples are in the reduced state after reduction at 500 °C in H2 flow for 2 h before the catalytic run.
3.1.3. Characteristics of the Metal Components of the Metal-Promoted MgO-Al2O3 Mixed Oxide Catalysts
The amount of chemisorbed CO (μmol CO/gcat.) determined by the CO pulse chemisorption method (Table 1) reflects the concentration of the surface metal atoms available for adsorption in the catalyst samples. The CO/Pd molar ratio calculated from the amount of chemisorbed CO for the Pd1.0/MgO-Al2O3 sample was 0.16 (Table 1). This value suggests that the ratio of the surface Pd atoms to the total number of Pd atoms (the Pd dispersion) is about 16%, assuming an adsorbed CO to surface Pd atom ratio of 1. Note, however, that due to the abundancy of bridge-bonded CO species on Pd (vide infra) a stoichiometry of 1/2 was suggested for Pd [40,41], which gives a Pd dispersion value of 32%. The average Pd metal particle size can be calculated from the metal dispersion (DMe) using the following equation from ref. [41]:
where v is the volume occupied by a single metal atom in the bulk of metal (0.0147 nm3) and is the average surface area occupied by one metal atom (0.0793 nm2). Based on the Pd dispersion value of 32%, the calculated average metal particle size in the Pd1.0/MgO-Al2O3 sample is 3.5 nm, which agrees well with the TEM result (Figure S2).
The amount of chemisorbed CO is an order of magnitude lower for the Cu1.0/MgO-Al2O3 catalyst sample than for the Pd1.00/MgO-Al2O3 sample (Table 1) indicating that the CO chemisorption is nearly negligible on Cu sites relatively to Pd sites in the monometallic samples. Note that the number of surface Pd atoms involved in CO chemisorption is approximately twice as high due to the abundance of bridge-bonded CO (see below). This further confirms that the Pd sites are the primary bonding sites for CO. Assuming that CO chemisorption on Cu metallic sites in the bimetallic samples is also negligible, the CO/Pd molar ratios were calculated from the CO pulse chemisorption experiments (Table 1). Substitution of about 25% of the Pd atoms by Cu significantly increased the CO/Pd ratio (Table 1) due to the dilution of Pd with Cu, which resulted in a higher concentration of surface Pd atoms. At higher Cu contents, when 50 to 75% of the Pd atoms was replaced by Cu, the CO/Pd ratio gradually decreased, possibly due to the copper enrichment on the surface of the bimetallic particles [29,42].
Infrared spectroscopy of adsorbed CO was used to investigate the surface properties of the metallic components of the metal-promoted MgO-Al2O3 mixed oxide catalysts. The spectra of adsorbed species formed from CO adsorption on the monometallic and bimetallic catalyst samples are shown in Figure 3.
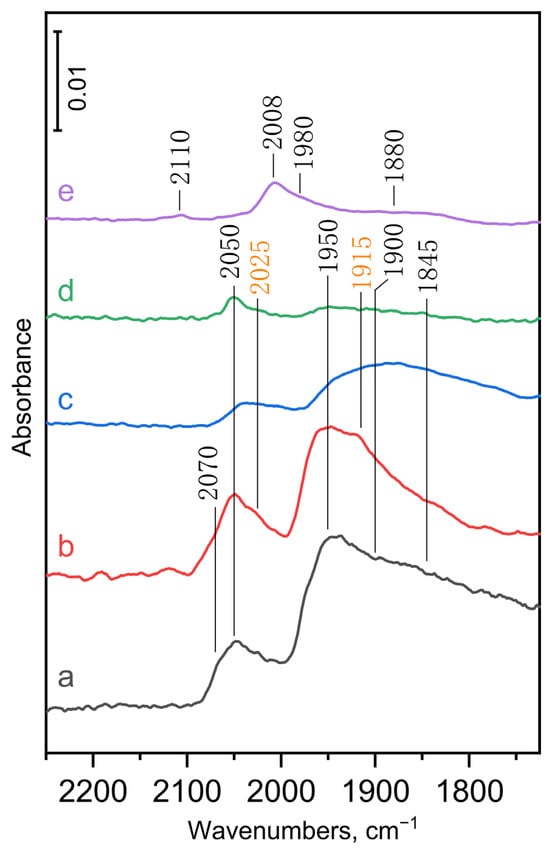
Figure 3.
DRIFT spectra of CO adsorbed on (a) Pd1.0/MgO-Al2O3, (b) Pd0.75Cu0.25/MgO-Al2O3, (c) Pd0.5Cu0.5/MgO-Al2O3, (d) Pd0.25Cu0.75/MgO-Al2O3, and (e) Cu1.0/MgO-Al2O3. The activated sample was contacted with 5 mbar CO at room temperature for 20 min then evacuated in high vacuum (10–6 mbar) for 20 min before measuring the spectrum of adsorbed CO.
The carbonyl bands of CO adsorbed on highly dispersed Pd catalysts are attributed to linearly bound (Pd–CO) and nonlinearly bound carbonyl species at two-fold (Pd2–CO) and three-fold (Pd3–CO) coordination sites, appearing either above or below 2000 cm−1 depending on the type of coordination [38,39,43,44]. The carbonyl bands due to linearly bound CO appear at 2050 and, as a shoulder, at around 2070 cm−1 on the monometallic Pd1.0/MgO-Al2O3 sample (Figure 3, a). In a recent study by De Castro et al. [39], based on combined infrared spectroscopic and density functional theory investigation, these bands were assigned to linear Pd–CO species formed on steps/edges (2050 cm−1) and terraces (2070 cm−1) of the Pd particles, respectively. Note that at high CO coverage, this latter band appeared with a significantly higher intensity and shifted to higher wavenumbers (2085 cm−1) (Figure S4) in line with former studies [39,44]. The carbonyl bands appearing in the nonlinear region below 2000 cm−1 (Figure 3, a) can be assigned to Pd2–CO species at two-fold coordination sites on terraces (1950 cm−1) or steps/edges (1900 cm−1), and Pd3–CO species at three-fold coordination sites on terraces (1845 cm−1) of the Pd particles [38,39].
The characteristic carbonyl bands appear with a significantly lower intensities on the monometallic Cu1.0/MgO-Al2O3 catalyst (Figure 3, e) than on the monometallic Pd catalyst due to the weaker adsorption of CO on the Cu surface than on the Pd surface [29,44], as was also confirmed by the CO pulse chemisorption experiments. The low intensity carbonyl band at 2110 cm−1 and the most intense carbonyl band at 2008 cm−1 (Figure 3, e) can be assigned to linearly bound Cu–CO species formed on the terraces and steps/edges of the Cu particles, respectively [39]. Additionally, the band at about 1980 cm−1 (appearing as a shoulder) and the broad band around 1880 cm−1 can be attributed to bridging Cu2–CO species formed on two-fold coordination sites on terraces and steps/edges, respectively [39]. Note that at high CO coverage, additional pair of bands can be observed at about 2050/2100 cm−1 due to the formation of gem-dicarbonyl species (Figure S4e) [39].
Substituting 25% of the Pd atoms with Cu atoms in the bimetallic samples reduced the intensity of the carbonyl bands assigned to the Pd2–CO species (bands at 1950 and 1900 cm−1) and, in particular, the carbonyl band attributed to the Pd3–CO species (a broad band around 1845 cm−1), while the intensity of the band assigned to linearly adsorbed CO species at 2050 cm−1 increased (see Figure 3, spectra a and b). This results clearly indicate the alloying of the Pd surface with Cu, causing the surface dispersal of Pd ensembles resulting in increasing number of isolated Pd atoms and lowering the ability of the Pd surface to form strong multiple bonds with CO molecules [29,38,44]. It is important to note that new carbonyl bands appearing as a shoulder at 2025 and 1915 cm−1 became visible on the Pd0.75Cu0.25/MgO-Al2O3 sample (Figure 3, b). The formation of similar new component bands have been substantiated on a Pd-Cu bimetallic catalyst at around 2045, 2020, and 1910 cm−1 and assigned to CO adsorbed on isolated Pd on four types of copper surface facets with an embedded and adatom configuration [39]. Following these assignments, the bands appearing at 2025 cm−1 and 1910 cm−1 can be assigned to CO bound to Pd single atoms embedded in a Cu(111) facet and CO forming a bridge between Pd and Cu on a Pd atom embedded in a Cu(211) terrace site, respectively [39].
Substituting 50 to 75% of the Pd atoms with Cu atoms in the bimetallic samples further reduced the intensity of all the carbonyl bands (Figure 3 and Figure S4). The band intensities appear to be nearly proportional to the Pd content at high CO coverage (see Figure S4), but they significantly decrease at lower CO coverage, which is achieved after evacuation in high vacuum. This is especially true for samples containing highly copper-substituted Pd–Cu bimetallic particles (Figure 3). These results suggest that Pd sites are the primary binding sites for CO and that their ability to strongly bind CO decreases with increasing Cu content in the bimetallic particles. The number of available Pd sites for CO adsorption decreases by the dilution with Cu due to the ensemble effect that reduces the ability of Pd in the bimetallic Pd–Cu particles to form bridge-bonded Pd carbonyls, while the latter effect can be attributed to ligand effect of Cu induced by modification of electronic structure of Pd upon alloying with Cu in the bimetallic particles [44].
3.2. Catalytic Properties
The results of the catalytic experiments for the ethanol coupling reaction over the metal-promoted MgO-Al2O3 catalysts are presented in Figure 4. The ethanol conversion (solid lines), the yield of liquid products (dashed lines), and the composition of organic products in the liquid phase, based on Equation (3) (color coded bars), in the function of the reaction temperature are presented. The results of the catalytic measurements were comparable to those reported in the relevant scientific literature (see in Table S1). The carbon balance (moles of carbon in all products divided by moles of carbon in the reacted ethanol) was greater than 95% for each measurement (see in Table S2).
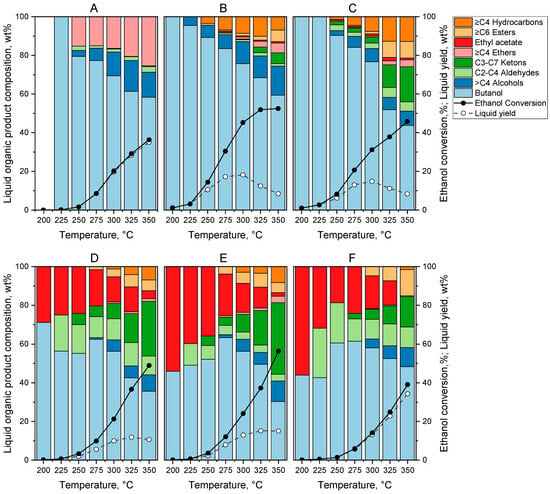
Figure 4.
Ethanol conversion, yield of liquid products and composition of organic products in the liquid phase obtained on (A) MgO-Al2O3, (B) Pd1.0/MgO-Al2O3, (C) Pd0.75Cu0.25/MgO-Al2O3, (D) Pd0.5Cu0.5/MgO-Al2O3, (E) Pd0.25Cu0.75/MgO-Al2O3, and (F) Cu1.0/MgO-Al2O3 catalysts. Catalytic tests were carried out at 21 bar total pressure, at WHSV = 1 and with a H2/ethanol molar ratio of 5.
For the non-promoted MgO-Al2O3 mixed oxide catalyst, shown for comparison in Figure 4A, ethanol conversion primarily produced liquid products, with only a negligible amount of gaseous products formed (Figure S5A) even at the highest reaction temperature (less than 1% at 350 °C). These results indicate that decarbonylation side reactions leading to CO and hydrocarbon moieties (mainly methane) practically do not take place in the absence of active metal sites [19]. The ethanol conversion is below 5% in the low temperature range below about 250 °C, and then continuously increases up to about 35% at higher reaction temperatures (Figure 4A); however, the alcohol selectivity (including butanol and hexanols) drops significantly at elevated temperatures due to the formation of other oxygenates, mostly diethyl ether formed in undesired dehydration reactions. Note that the MgO-Al2O3 catalyst showed stable performance in the function of time-on-stream up to about 30 h after reaching steady state (Figure S6).
Introduction of Pd active metal significantly improved the activity of the MgO-Al2O3 mixed oxide catalyst in the whole temperature range (Figure 4B). The effect of the active metal on ethanol conversion and alcohol selectivity (mainly butanol and some hexanols) was most beneficial between 200 and 250 °C. In line with our former observations [19], the presence of Pd and H2 could significantly improve the catalytic activity and alcohol selectivity in this temperature range without adversely affecting the yield of organic liquid products (Figure 4B). Ethanol conversion was approximately an order of magnitude higher with the Pd1.0/MgO–Al2O3 catalyst than with the non-promoted MgO–Al2O3 catalyst, and alcohol selectivity increased substantially (see Figure 4A,B). For instance, at 250 °C, ethanol conversion increased from 1.6% to 14.4%, and alcohol selectivity increased from 82.5 wt.% to 95.6 wt.%, resulting in butanol yields of 1.3 wt.% and 13.8 wt.%, respectively. The beneficial effect of the Pd promoter can be explained by the promoting effect of the metal in the initial ethanol dehydrogenation step and the hydrogenation of the unsaturated reaction intermediates in the closing reaction step [4,5,6,11]. Note that using H2 in the reaction system has the advantage that, when activated on the metal palladium, H2 can participate in closing H-transfer reactions. In an inert atmosphere, these H-transfer reactions can only proceed with ethanol via the Meerwein-Ponndorf-Verley (MPV) mechanism, and promoting effect of Pd was found to be less effective [19]. As shown in Figure 4B, alcohol selectivity and liquid yield decreased considerably in the high temperature range above 250 °C, while gas phase product yield increased proportionally (Figure S5B). This was mainly due to the acceleration of undesirable decarbonylation side reactions, which led to the formation of ≥C4 alkanes in the liquid products and C1–C3 alkanes in the gas phase product mixture. The dominance of CH4 and CO in the gas phase (Figure S5B) suggests that the accelerated decarbonylation of the acetaldehyde intermediate over metallic sites at high temperatures is primarily responsible for the decrease in liquid yields.
Dilution of Pd with increasing amount of Cu in the bimetallic particles resulted in a gradually decreasing ethanol conversion (see Figure 4B–E); however, the ratio of the liquid- and gas-phase products considerably increased (Table S3). It follows that the decarbonylation activity of the catalyst, responsible for the formation of gas phase products (mainly CO and CH4), was suppressed in a larger extent than the dehydrogenation–hydrogenation activity of the catalyst. These results are in line with former observation for a similar supported bimetallic Pd-Cu catalysts [25,26,45]. It is important to note that at low Cu content the desired main product 1-butanol is formed with a high selectivity (>85%) below about 300 °C (Figure 4C), while extensive substitution of Pd with Cu (>25%) resulted in a radical change in the organic liquid composition (Figure 4D–E). The butanol selectivity significantly decreased mainly due to the formation ethyl acetate, ketones (mainly 2-butanone below 300 °C and increasing amounts of C3-C7 ketones over 300 °C), and aldehydes (mainly acetaldehyde and some butanal). These byproducts form due to the enrichment of the bimetallic particles’ surface with Cu, which catalyzes the aforementioned reaction routes. Similar conversion curves were obtained for the MgO-Al2O3 mixed oxide catalyst and the Cu1.0/MgO-Al2O3 catalyst (see Figure 4A,F), which suggests that the presence of Cu alone does not have a significant promoting effect. However, a similar product distribution can be observed on the monometallic Cu1.0/MgO·Al2O3 catalyst (Figure 4F) as on the bimetallic catalysts with high Cu substitution (Figure 4D–E), indicating that the Cu0 active sites are primarily responsible for the ester-forming reaction route, as shown in previous studies [21,46,47,48]. The formation of esters has been proposed to proceed via the reaction of alkoxide species with an aldehyde (Tishchenko-type reaction) or via a hemiacetal intermediate formed when alcohols react with an aldehyde intermediate [4,21,46,48]. The formation of ketones also became significant in the high temperature range over about 300 °C (Figure 4C–F). Their formation was found to predominantly occur at high conversions at the expense of alcohols via reaction pathways possibly involving intramolecular H-transfer in the 3-hydroxybutanal (enolate) intermediate formed in the aldol condensation step of the coupling reaction [4,48,49,50]. The dehydration-hydrogenation reactions of the resulting keto form (4-hydroxybutan-2-al) can lead to the formation of 2-butanone (methyl ethyl ketone) [4,49,50]. The appearance of 2-butanone as the main ketone product on the copper containing catalysts clearly supports this latter reaction pathway.
3.3. Formation and Transformation of Surface Species
The quasi-operando DRIFT spectroscopic investigations provide information about the formation of surface species from ethanol and their transformation on the catalyst surface under catalytic conditions. The results obtained in transient mode in a continuously flowing ethanol/hydrogen gas mixture at an elevated reaction temperature for each monometallic and bimetallic catalyst sample are presented in detail in Figures S7–S12. The results obtained on metal-free MgO-Al2O3 catalyst are shown in Figure S7 for comparison. The spectra measured at selected reaction temperatures between 100 and 350 °C on the monometallic and bimetallic MgO-Al2O3 catalysts are compared in Figure 5.
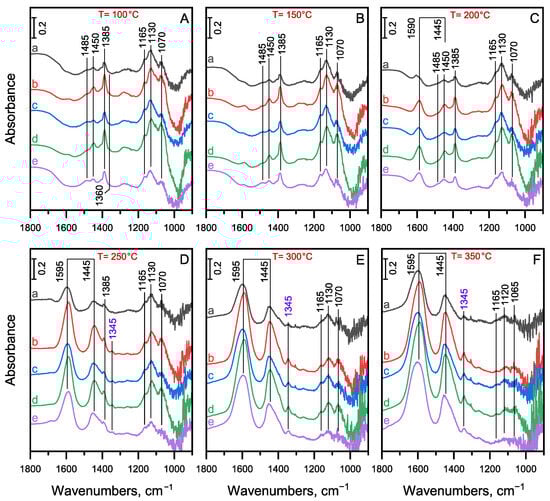
Figure 5.
DRIFT spectra of surface species formed from the adsorption and reaction of ethanol at (A) 100 °C, (B) 150 °C, (C) 200 °C, (D) 250 °C, (E) 300 °C and (F) 350 °C on the (a) Pd1.0/MgO-Al2O3, (b) Pd0.75Cu0.25/MgO-Al2O3, (c) Pd0.5Cu0.5/MgO-Al2O3, (d) Pd0.25Cu0.75/MgO-Al2O3, and (e) Cu1.0/MgO-Al2O3 catalyst in the frequency range of the carbonyl stretching and C-H deformation vibrations. The spectra were measured in a continuous flow of EtOH/H2 gas mixture at atmospheric pressure, while the temperature was increased at a rate of 2 °C/min from room temperature up to 350 °C. The corresponding spectrum of the activated catalyst was subtracted from the spectrum recorded at the indicated temperature.
The assignments of the characteristic bands observed on the MgO-Al2O3 catalyst to surface species formed from the adsorption of ethanol were given in a previous study [19]. Similar bands developed on the metal promoted MgO-Al2O3 catalysts (Figures S7–S12), so these assignments can also be applied to these catalyst samples. The negative band at 3730 cm−1 in the region of the νOH stretching vibrations indicate the involvement of the surface OH groups in the adsorption interaction. The appearance of a broad absorption band around 3200 cm−1 (bottom spectra in Figures S7A–S12A) can be attributed to the characteristic frequency of surface OH groups being red-shifted from its original position (3730 cm−1) due to H-bonding interaction of molecularly adsorbed EtOH with the surface OH groups [51,52,53]. This broad band disappears above about 150 °C as expected due to the decreasing coverage of the catalyst surface with molecularly adsorbed EtOH (Figures S7A–S12A). The absorption bands related to molecularly adsorbed EtOH in the range of C-H deformation vibrations can be identified at 1483 (βs[CH2]), 1460 (δas[CH3]), 1400 (δs[CH3]), 1280 (δOH), and 1105 cm−1 (νC-O) (Figures S7B–S12B) [54,55,56]. These bands also disappear around 150 °C due the shift in the adsorption–desorption equilibrium. However, the negative νOH band at 3730 cm−1 persists at higher temperatures (>150 °C), indicating a surface reaction consuming surface OH groups. The product of the surface reaction can be identified as monodentate ethoxy species giving characteristic bands at 1165, 1130, and 1070 cm−1 (Figure 5) assigned to the νC-O/νC-C vibrations, whereas the corresponding C-H deformation vibrations are discernible at 1485 (βs[CH2]), 1450 (δas[CH3]) and 1385 cm−1 (δs[CH3]) [51,56,57,58,59]. The formation of ethoxy species has been shown to be accompanied by the formation of water [51,52,56,60], which explains the consumption of the surface OH groups during the surface reaction.
The ethoxy species also exhibit characteristic bands in the region of the νCH stretching vibrations at 2965, 2930, and 2870 cm−1 (Figures S7A–S12A), which are attributed to νas[CH3], νas[CH2], and overlapping bands of νs[CH3]/νs[CH2] vibrations, respectively [51,56,61]. As the temperature increases, the relative intensity of the νas[CH2] band increases in comparison to the νas[CH3] band. This suggests that the transformation of the ethoxy species resulted in surface species containing more -CH2- groups, consistent with the formation of coupling products. The additional bands appearing at approximately 2820 cm−1 (a shoulder) and 2725 cm−1 (Figures S7A–S12A) are likely due to the ν[CH] stretching vibrations of aldehyde-like surface species formed in the dehydrogenation reaction, whereas the corresponding C-H deformation band appears at 1360 cm−1 [17,61,62,63].
The absorption bands attributed to the monodentate ethoxy species (1165, 1130, and 1070 cm−1) decrease simultaneously with the formation of coupling products on each catalyst sample at elevated temperatures, indicating that ethoxy species are the key surface intermediates for the coupling reaction. Consumption of the ethoxy species is accompanied by the appearance of a new pair of bands at 1585 and 1442 cm−1 (Figure 5A–F). These bands can be attributed to the νas[O-C-O] and νs[O-C-O] vibrations of carboxyl species [59,61,64,65,66]. The separation of the asymmetric and symmetric components (Δν = 143 cm−1) suggests that chelating bidentate carboxyl species are formed [64,67]. Their formation has been shown to proceed via an aldehyde intermediate from the surface ethoxy species [64,65,66]. As shown in Figures S7B–S12B, the concentration of these carboxyl species continuously increases on the catalyst surface at elevated temperatures, which is typical of thermally stable, low-reactivity species, such as spectator species [61,65].
The characteristic absorption bands and the formation of the corresponding surface species are similar for both the metal-free and the metal-promoted MgO-Al2O3 catalysts (see Figures S7–S12). However, new surface species with a characteristic absorption band at 1345 cm−1 form only for the latter catalysts at temperatures above 200 °C (Figure 5A–F). Furthermore, these surface species form much more prominently on the monometallic Cu1.0/MgO-Al2O3 and Cu-containing bimetallic catalysts than on the monometallic Pd1.0/MgO-Al2O3 catalyst (Figure 5D–F). The intensity of the band at 1345 cm−1 gradually increases up to the highest reaction temperature, which suggests the formation of thermally stable, low-reactivity species. A similar thermally stable absorption band is typically observed for the dissociative adsorption of acetic acid. This band is assigned to the δs[CH3] vibration of the acetate group [68,69]. The formation of surface acetate is likely indirectly related to a reaction product formed in the surface reactions mainly catalyzed by metallic Cu sites, such as ethyl acetate. In a secondary reaction, this ester can hydrolyze to give acetic acid, which can form strongly adsorbed acetate species on the catalyst surface and/or can condensate to ketons with the liberation of CO2 [4,24]. The appearance of some CO2 among the gas phase products (Figure S5) suggests that this minor reaction route probably also contributed to the formation of ketons at higher reaction temperatures.
The catalytic results indicated that the formation of methane and CO becomes significant in the high-temperature range (>250 °C) on the Pd-containing catalysts due to accelerated decarbonylation of the acetaldehyde intermediate, which leads to decreased liquid yields and increased gas yields (see Figure 4 and Figure S5). The DRIFT spectroscopic results support this notion. Both methane (see Figures S8A–S11A) and CO (Figure 6) in the gas phase can be detected at temperatures above 250 °C in the spectra obtained on metal-promoted catalysts within the C-H and C-O stretching vibration ranges, respectively. It is important to note that the carbonyl bands assigned to nonlinearly bound CO at two-fold (Pd2–CO) and three-fold (Pd3–CO) coordination sites (see Figure 3) appear at significantly lower temperatures than gas-phase CO. Meanwhile, the carbonyl band attributed to linearly bound CO (Pd–CO) appears at the same time as gas-phase CO (see Figure 6A–D). These observations suggest that the decarbonylation reaction of the acetaldehyde intermediate is facile at relatively low temperatures. However, the reaction product, CO, strongly binds to the Pd sites at temperatures below about 250 °C, which is consistent with previous studies [25,45]. Therefore, the strongly bound CO can hinder the decarbonylation reaction effectively. These observations also substantiate that the decarbonylation reaction primarily occurs on multiple Pd sites (represented by two- and three-fold coordination sites for CO adsorption). The decarbonylation reaction speeds up at around 250 °C. At this temperature, the adsorption–desorption equilibrium allows CO to be released from the active Pd sites. CO chemisorption experiments proved that diluting Pd with Cu in the bimetallic particle decreased the concentration of multiple Pd sites (see Figure 3). Consistent with the catalytic results, this leads to a lower decarbonylation rate, as evidenced by the lower gas-phase CO concentration observed at the same reaction temperatures (see Figure 6A,D). The decarbonylation reaction, and thus the CO formation, barely occurs on the monometallic Cu1.0/MgO-Al2O3 catalyst (Figure 6E) due to the significantly lower decarbonylation activity of Cu compared to Pd.
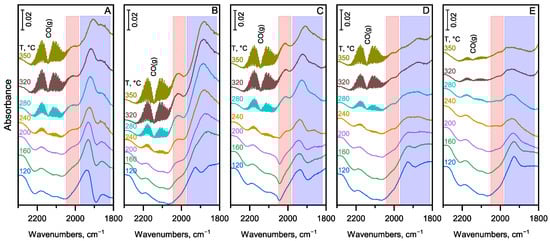
Figure 6.
DRIFT spectra of adsorbed CO and gas phase CO formed from the decarbonylation side reaction during the ethanol coupling reaction at temperatures between 120 and 350 °C on the (A) Pd1.0/MgO-Al2O3, (B) Pd0.75Cu0.25/MgO-Al2O3, (C) Pd0.5Cu0.5/MgO-Al2O3, (D) Pd0.25Cu0.75/MgO-Al2O3, and (E) Cu1.0/MgO-Al2O3 catalyst. The spectra were measured in a continuous flow of an EtOH/H2 gas mixture at atmospheric pressure, while increasing the temperature at a rate of 2 °C/min from room temperature up to 350 °C. The frequency range for linearly and bridge-bonded CO is marked in red and blue, respectively.
4. Conclusions
The self-coupling reaction of ethanol for producing a high-performance biofuel component 1-butanol was studied over Pd/MgO-Al2O3 and bimetallic Pd-Cu/MgO-Al2O3 mixed oxide-based catalysts. The promoting effect of the active metal(s) on the hydrogen transfer reaction steps in the overall reaction was investigated. The catalytic properties were investigated by means of a flow-through microreactor system in the temperature range between 200 and 350 °C at 21 bar total pressure, a WHSV of 1 , and at a H2/ethanol molar ratio of 5. The formation and transformation of surface species under catalytic conditions were studied using quasi-operando DRIFT spectroscopy to establish structure-activity relationships.
Results show that both metals are in the reduced state and the metal particles are highly dispersed (average particle size well below 5 nm) on the MgO-Al2O3 support both in the monometallic and bimetallic catalyst samples. Substitution of about 25% of Pd atoms with Cu significantly increased the concentration of surface Pd atoms in the bimetallic particles (detected by CO chemisorption), while higher Cu contents (50 to 75% substitution) gradually decreased their concentration, possibly due to surface enrichment of the particles with copper. The FTIR spectroscopic investigation of adsorbed CO revealed that low substitution (25%) of the Pd with Cu caused the surface dispersal of Pd ensembles and resulted in increasing number of isolated Pd atoms and decreasing number of Pd ensembles that able to form strong multiple bonds with CO molecules. Beside this ensemble effect, further dilution of Pd with Cu decreases the ability of Pd in the bimetallic particles to strongly bind CO due to ligand effects.
The catalytic results show that the presence of Pd promoter significantly improved the activity and butanol selectivity across the entire temperature range compared to the metal-free MgO-Al2O3 catalyst. However, the yield of liquid products decreased significantly at temperatures higher than 250 °C mainly due to the acceleration of the undesired decarbonylation side reaction of the acetaldehyde intermediate.
The results of the quasi-operando DRIFT spectroscopic investigations revealed that the facile decarbonylation side reaction of the acetaldehyde intermediate primarily occurs on multiple Pd sites (represented by two- and three-fold coordination sites for CO adsorption). However the reaction product, CO, can strongly bind to these Pd sites and cannot desorb at temperatures below about 250 °C. Thus, the promoting effect of Pd was beneficial only in the lower temperature range up to about 250 °C, where the decarbonylation reaction was inhibited due to the reversible poisoning effect of CO.
Diluting the Pd phase with an increasing amount of Cu resulted in higher liquid yields due to the gradually decreasing decarbonylation activity. However, a molar fraction of Cu, greater than 0.25, significantly weakens the promoting effect of Pd on the dehydrogenation–hydrogenation steps of the coupling reaction. Additionally, the distribution of products changed dramatically at the expense of 1-butanol selectivity because metallic Cu can catalyze side reactions that lead to C4 oxygenates, such as ethyl acetate, as well as ketone products.
Supplementary Materials
The following supporting information can be downloaded at https://www.mdpi.com/article/10.3390/suschem6040044/s1, Figure S1: CO2-TPD curves measured the MgO-Al2O3 and Pd1.0/MgO-Al2O3 catalysts; Figure S2: TEM images of the catalysts; Figure S3: XRPD patterns of the used catalyst samples; Figure S4: DRIFT spectra of CO adsorbed on the catalysts samples; Figure S5: Composition and yield of gas products produced from ethanol conversion on the catalyst samples; Figure S6: Catalytic activity of MgO-Al2O3 and Pd1.0/MgO-Al2O3 catalysts in the function of time-on-stream; Figures S7–S12: DRIFT spectra of surface species formed from the adsorption and reaction of ethanol on the catalysts; Table S1: Comparison of catalytic data reported in the relevant literature; Table S2: Calculated carbon balances for the catalytic activity tests; Table S3: Mass ratio of liquid and gaseous products formed in ethanol conversion on the catalyst samples. References [70,71,72,73,74,75] are cited in the Supplementary Materials.
Author Contributions
Conceptualization, F.L., A.V., C.C.; methodology, A.V., F.L., J.V., T.N., G.B.; formal analysis, A.V., H.E.S., G.N.; investigation, A.M., H.E.S., G.N., R.B., A.V.; data curation, A.M., H.E.S., R.B., T.N.; writing—original draft preparation, F.L., A.V.; writing—review and editing, F.L., C.C., G.B., J.V., T.N.; visualization, A.M., G.N., A.V.; supervision, F.L., A.V., T.N.; project administration, F.L., G.B., T.N.; funding acquisition, F.L., T.N. All authors have read and agreed to the published version of the manuscript.
Funding
This research was co-financed by the Ministry of Innovation and Technology of Hungary from the National Research, Development and Innovation Fund under the 2019-2.1.13-TÉT_IN funding scheme (Project No. 2019-2.1.13-TÉT_IN-2020-00043), and the National Research, Development and Innovation Office, grant number FK20 134332. One of the authors (G.N.) thanks for the support provided by the EKÖP-25 University Excellence Scholarship Program of the Ministry for Culture and Innovation from the source of the National Research, Development and Innovation Fund (ELTE Eötvös Loránd University, Budapest, Hungary).
Institutional Review Board Statement
Not applicable.
Informed Consent Statement
Not applicable.
Data Availability Statement
The original contributions presented in this study are included in the article/Supplementary Materials. Further inquiries can be directed to the corresponding authors.
Conflicts of Interest
The authors declare no conflicts of interest. The funders had no role in the design of the study; in the collection, analyses, or interpretation of data; in the writing of the manuscript; or in the decision to publish the results.
Abbreviations
The following abbreviations are used in this manuscript:
| BET method | Brunauer-Emmet-Teller method |
| DRIFT spectroscopy | Diffuse Reflectance Infrared Fourier-Transform spectroscopy |
| FT-IR | Fourier-Transform Infrared Spectroscopy |
| HDO | Hydrodeoxygenation |
| H2-TPR | Temperature-Programmed H2-Reduction |
| MPV mechanism | Meerwein-Ponndorf-Verley mechanism |
| SSA | Specific surface area |
| TEM | Transmission Electron Microscopy |
| TPD | Temperature-Programmed Desorption |
| WHSV | Weight Hourly Space Velocity |
| XRPD | X-ray Powder Diffraction |
References
- Dürre, P. Biobutanol: An Attractive Biofuel. Biotechnol. J. 2007, 2, 1525–1534. [Google Scholar] [CrossRef] [PubMed]
- Trindade, W.R.d.S.; Santos, R.G. dos Review on the Characteristics of Butanol, Its Production and Use as Fuel in Internal Combustion Engines. Renew. Sustain. Energy Rev. 2017, 69, 642–651. [Google Scholar] [CrossRef]
- Nair, P.; Meenakshi, H.N. Review on the Synthesis, Performance and Trends of Butanol: A Cleaner Fuel Additive for Gasoline. Int. J. Ambient Energy 2022, 43, 4207–4223. [Google Scholar] [CrossRef]
- Gabriëls, D.; Hernández, W.Y.; Sels, B.; Van Der Voort, P.; Verberckmoes, A. Review of Catalytic Systems and Thermodynamics for the Guerbet Condensation Reaction and Challenges for Biomass Valorization. Catal. Sci. Technol. 2015, 5, 3876–3902. [Google Scholar] [CrossRef]
- Wu, X.; Fang, G.; Tong, Y.; Jiang, D.; Liang, Z.; Leng, W.; Liu, L.; Tu, P.; Wang, H.; Ni, J.; et al. Catalytic Upgrading of Ethanol to n-Butanol: Progress in Catalyst Development. ChemSusChem 2018, 11, 71–85. [Google Scholar] [CrossRef] [PubMed]
- Moteki, T.; Flaherty, D.W. Mechanistic Insight to C–C Bond Formation and Predictive Models for Cascade Reactions among Alcohols on Ca- and Sr-Hydroxyapatites. ACS Catal. 2016, 6, 4170–4183. [Google Scholar] [CrossRef]
- Ho, C.R.; Shylesh, S.; Bell, A.T. Mechanism and Kinetics of Ethanol Coupling to Butanol over Hydroxyapatite. ACS Catal. 2016, 6, 939–948. [Google Scholar] [CrossRef]
- Yang, C.; Meng, Z.Y. Bimolecular Condensation of Ethanol to 1-Butanol Catalyzed by Alkali Cation Zeolites. J. Catal. 1993, 142, 37–44. [Google Scholar] [CrossRef]
- Ndou, A. Dimerisation of Ethanol to Butanol over Solid-Base Catalysts. Appl. Catal. A Gen. 2003, 251, 337–345. [Google Scholar] [CrossRef]
- Scalbert, J.; Thibault-Starzyk, F.; Jacquot, R.; Morvan, D.; Meunier, F. Ethanol Condensation to Butanol at High Temperatures over a Basic Heterogeneous Catalyst: How Relevant Is Acetaldehyde Self-Aldolization? J. Catal. 2014, 311, 28–32. [Google Scholar] [CrossRef]
- Meunier, F.C.; Scalbert, J.; Thibault-Starzyk, F. Unraveling the Mechanism of Chemical Reactions through Thermodynamic Analyses: A Short Review. Appl. Catal. A Gen. 2015, 504, 220–227. [Google Scholar] [CrossRef]
- de Souza, E.F.; Pacheco, H.P.; Miyake, N.; Davis, R.J.; Toniolo, F.S. Computational and Experimental Mechanistic Insights into the Ethanol-to-Butanol Upgrading Reaction over MgO. ACS Catal. 2020, 10, 15162–15177. [Google Scholar] [CrossRef]
- Galadima, A.; Muraza, O. Zeolite Catalysts in Upgrading of Bioethanol to Fuels Range Hydrocarbons: A Review. J. Ind. Eng. Chem. 2015, 31, 1–14. [Google Scholar] [CrossRef]
- Di Cosimo, J.I.; Díez, V.K.; Xu, M.; Iglesia, E.; Apesteguía, C.R. Structure and Surface and Catalytic Properties of Mg-Al Basic Oxides. J. Catal. 1998, 178, 499–510. [Google Scholar] [CrossRef]
- Di Cosimo, J.I.; Apesteguía, C.R.; Ginés, M.J.L.; Iglesia, E. Structural Requirements and Reaction Pathways in Condensation Reactions of Alcohols on MgyAlOx Catalysts. J. Catal. 2000, 190, 261–275. [Google Scholar] [CrossRef]
- Ramasamy, K.K.; Gray, M.; Job, H.; Santosa, D.; Li, X.S.; Devaraj, A.; Karkamkar, A.; Wang, Y. Role of Calcination Temperature on the Hydrotalcite Derived MgO–Al2O3 in Converting Ethanol to Butanol. Top. Catal. 2016, 59, 46–54. [Google Scholar] [CrossRef]
- Tian, W.; Herrera, J.E. Catalytic Relevance of Mg-Al-O Basic Centers in the Upgrade of Ethanol to n-Butanol. ChemCatChem 2024, 16, e202400225. [Google Scholar] [CrossRef]
- Debecker, D.P.; Gaigneaux, E.M.; Busca, G. Exploring, Tuning, and Exploiting the Basicity of Hydrotalcites for Applications in Heterogeneous Catalysis. Chem.-A Eur. J. 2009, 15, 3920–3935. [Google Scholar] [CrossRef]
- Vikár, A.; Lónyi, F.; Makoye, A.; Nagy, T.; Novodárszki, G.; Barthos, R.; Szabó, B.; Valyon, J.; Mihályi, M.R.; Deka, D.; et al. Ethanol Coupling Reactions over MgO–Al2O3 Mixed Oxide-Based Catalysts for Producing Biofuel Additives. Molecules 2023, 28, 3788. [Google Scholar] [CrossRef]
- Makoye, A.; Vikár, A.; Nacsa, A.B.; Barthos, R.; Valyon, J.; Lónyi, F.; Nagy, T. Experimental and Kinetic Modelling Study of the Heterogeneous Catalytic Conversion of Bioethanol into N-Butanol Using MgO–Al2O3 Mixed Oxide Catalyst. Catalysts 2025, 15, 709. [Google Scholar] [CrossRef]
- Benito, P.; Vaccari, A.; Antonetti, C.; Licursi, D.; Schiarioli, N.; Rodriguez-Castellón, E.; Raspolli Galletti, A.M. Tunable Copper-Hydrotalcite Derived Mixed Oxides for Sustainable Ethanol Condensation to n-Butanol in Liquid Phase. J. Clean. Prod. 2019, 209, 1614–1623. [Google Scholar] [CrossRef]
- Quesada, J.; Faba, L.; Díaz, E.; Ordóñez, S. Tuning the Selectivities of Mg-Al Mixed Oxides for Ethanol Upgrading Reactions through the Presence of Transition Metals. Appl. Catal. A Gen. 2018, 559, 167–174. [Google Scholar] [CrossRef]
- Quesada, J.; Faba, L.; Díaz, E.; Ordóñez, S. Enhancement of the 1-Butanol Productivity in the Ethanol Condensation Catalyzed by Noble Metal Nanoparticles Supported on Mg-Al Mixed Oxide. Appl. Catal. A Gen. 2018, 563, 64–72. [Google Scholar] [CrossRef]
- Mück, J.; Kocík, J.; Hájek, M.; Tišler, Z.; Frolich, K.; Kašpárek, A. Transition Metals Promoting Mg-Al Mixed Oxides for Conversion of Ethanol to Butanol and Other Valuable Products: Reaction Pathways. Appl. Catal. A Gen. 2021, 626, 118380. [Google Scholar] [CrossRef]
- Goulas, K.A.; Sreekumar, S.; Song, Y.; Kharidehal, P.; Gunbas, G.; Dietrich, P.J.; Johnson, G.R.; Wang, Y.C.; Grippo, A.M.; Grabow, L.C.; et al. Synergistic Effects in Bimetallic Palladium-Copper Catalysts Improve Selectivity in Oxygenate Coupling Reactions. J. Am. Chem. Soc. 2016, 138, 6805–6812. [Google Scholar] [CrossRef]
- Bathena, T.; Phung, T.; Svadlenak, S.R.; Liu, Y.; Grabow, L.C.; Goulas, K.A. Oxygenate Reactions over PdCu and PdAg Catalysts: Distinguishing Electronic and Geometric Effects on Reactivity and Selectivity. ACS Catal. 2022, 12, 5766–5775. [Google Scholar] [CrossRef]
- Liu, L.; Corma, A. Bimetallic Sites for Catalysis: From Binuclear Metal Sites to Bimetallic Nanoclusters and Nanoparticles. Chem. Rev. 2023, 123, 4855–4933. [Google Scholar] [CrossRef]
- Jiang, X.; Koizumi, N.; Guo, X.; Song, C. Bimetallic Pd–Cu Catalysts for Selective CO2 Hydrogenation to Methanol. Appl. Catal. B Environ. 2015, 170–171, 173–185. [Google Scholar] [CrossRef]
- Xue, F.; Li, Q.; Lv, M.; Weng, S.; Li, T.; Ren, Y.; Liu, Y.; Li, D.; He, Y.; Li, Q.; et al. Decoding Active Sites for Highly Efficient Semihydrogenation of Acetylene in Palladium-Copper Nanoalloys. Nano Lett. 2024, 24, 6269–6277. [Google Scholar] [CrossRef] [PubMed]
- Da Silva, F.P.; Fiorio, J.L.; Gonçalves, R.V.; Teixeira-Neto, E.; Rossi, L.M. Synergic Effect of Copper and Palladium for Selective Hydrogenation of Alkynes. Ind. Eng. Chem. Res. 2018, 57, 16209–16216. [Google Scholar] [CrossRef]
- Parida, K.; Mohapatra, L.; Baliarsingh, N. Effect of Co2+ Substitution in the Framework of Carbonate Intercalated Cu/Cr LDH on Structural, Electronic, Optical, and Photocatalytic Properties. J. Phys. Chem. C 2012, 116, 22417–22424. [Google Scholar] [CrossRef]
- Han, J.; Zeng, H.-Y.; Xu, S.; Chen, C.-R.; Liu, X.-J. Catalytic Properties of CuMgAlO Catalyst and Degradation Mechanism in CWPO of Methyl Orange. Appl. Catal. A Gen. 2016, 527, 72–80. [Google Scholar] [CrossRef]
- Batista, J.; Pintar, A.; Mandrino, D.; Jenko, M.; Martin, V. XPS and TPR Examinations of γ-Alumina-Supported Pd-Cu Catalysts. Appl. Catal. A Gen. 2001, 206, 113–124. [Google Scholar] [CrossRef]
- Ota, A.; Kunkes, E.L.; Kasatkin, I.; Groppo, E.; Ferri, D.; Poceiro, B.; Navarro Yerga, R.M.; Behrens, M. Comparative Study of Hydrotalcite-Derived Supported Pd2Ga and PdZn Intermetallic Nanoparticles as Methanol Synthesis and Methanol Steam Reforming Catalysts. J. Catal. 2012, 293, 27–38. [Google Scholar] [CrossRef]
- Bhogeswararao, S.; Srinivas, D. Catalytic Conversion of Furfural to Industrial Chemicals over Supported Pt and Pd Catalysts. J. Catal. 2015, 327, 65–77. [Google Scholar] [CrossRef]
- Corma, A.; García, H.; Primo, A. Palladium and Copper Supported on Mixed Oxides Derived from Hydrotalcite as Reusable Solid Catalysts for the Sonogashira Coupling. J. Catal. 2006, 241, 123–131. [Google Scholar] [CrossRef]
- Hurst, N.W.; Gentry, S.J.; Jones, A.; McNicol, B.D. Temperature Programmed Reduction. Catal. Rev. 1982, 24, 233–309. [Google Scholar] [CrossRef]
- Meshesha, B.T.; Barrabés, N.; Llorca, J.; Dafinov, A.; Medina, F.; Föttinger, K. PdCu Alloy Nanoparticles on Alumina as Selective Catalysts for Trichloroethylene Hydrodechlorination to Ethylene. Appl. Catal. A Gen. 2013, 453, 130–141. [Google Scholar] [CrossRef]
- De Castro, L.; Sahsah, D.; Heyden, A.; Regalbuto, J.; Williams, C. Dilute Limit Alloy Pd–Cu Bimetallic Catalysts Prepared by Simultaneous Strong Electrostatic Adsorption: A Combined Infrared Spectroscopic and Density Functional Theory Investigation. J. Phys. Chem. C 2022, 126, 11111–11128. [Google Scholar] [CrossRef]
- Foger, K. Dispersed Metal Catalysts. In Catalysis: Science and Technology; Springer: Berlin/Heidelberg, Germany, 1984; Volume 6, pp. 227–305. [Google Scholar]
- Bergeret, G.; Gallezot, P. Particle Size and Dispersion Measurements. In Handbook of Heterogeneous Catalysis; Ertl, G., Knözinger, H., Schüth, F., Weitkamp, J., Eds.; Wiley: Weinheim, Germany, 2008; pp. 738–765. [Google Scholar]
- Gholinejad, M.; Khosravi, F.; Afrasi, M.; Sansano, J.M.; Nájera, C. Applications of Bimetallic PdCu Catalysts. Catal. Sci. Technol. 2021, 11, 2652–2702. [Google Scholar] [CrossRef]
- Sheppard, N.; Nguyen, T.T. The Vibrational Spectra of Carbon Monoxide Chemisorbed on the Surfaces of Metal Catalysts—A Suggested Scheme of Interpretation. In Advances in Infrared and Raman Spectroscopy; Clark, R.J.H., Hester, R.E., Eds.; Heyden: London, UK, 1978; Volume 5, p. 95. [Google Scholar]
- Nikolaev, S.A.; Tsodikov, M.V.; Chistyakov, A.V.; Chistyakova, P.A.; Ezzhelenko, D.I.; Shilina, M.I. PdCu Nanoalloy Supported on Alumina: A Stable and Selective Catalyst for the Conversion of Bioethanol to Linear α-Alcohols. Catal. Today 2021, 379, 50–61. [Google Scholar] [CrossRef]
- Goulas, K.A.; Song, Y.; Johnson, G.R.; Chen, J.P.; Gokhale, A.A.; Grabow, L.C.; Toste, F.D. Selectivity Tuning over Monometallic and Bimetallic Dehydrogenation Catalysts: Effects of Support and Particle Size. Catal. Sci. Technol. 2018, 8, 314–327. [Google Scholar] [CrossRef]
- Bravo-Suárez, J.J.; Subramaniam, B.; Chaudhari, R.V. Vapor-Phase Methanol and Ethanol Coupling Reactions on CuMgAl Mixed Metal Oxides. Appl. Catal. A Gen. 2013, 455, 234–246. [Google Scholar] [CrossRef]
- Sun, Z.; Couto Vasconcelos, A.; Bottari, G.; Stuart, M.C.A.; Bonura, G.; Cannilla, C.; Frusteri, F.; Barta, K. Efficient Catalytic Conversion of Ethanol to 1-Butanol via the Guerbet Reaction over Copper- and Nickel-Doped Porous. ACS Sustain. Chem. Eng. 2017, 5, 1738–1746. [Google Scholar] [CrossRef]
- Cuello-Penaloza, P.A.; Chavarrio-Cañas, J.; Du, Y.; Lanci, M.P.; Maedke, D.A.; Dumesic, J.A.; Huber, G.W. Reaction Chemistry of Ethanol Oligomerization to Distillate-Range Molecules Using Low Loading Cu/MgxAlOy Catalysts. Appl. Catal. B Environ. 2022, 318, 121821. [Google Scholar] [CrossRef]
- Gines, M.J.L.; Iglesia, E. Bifunctional Condensation Reactions of Alcohols on Basic Oxides Modified by Copper and Potassium. J. Catal. 1998, 176, 155–172. [Google Scholar] [CrossRef]
- Ordomsky, V.V.; Sushkevich, V.L.; Ivanova, I.I. Study of Acetaldehyde Condensation Chemistry over Magnesia and Zirconia Supported on Silica. J. Mol. Catal. A Chem. 2010, 333, 85–93. [Google Scholar] [CrossRef]
- Hussein, G.A.M.; Sheppard, N.; Zaki, M.I.; Fahim, R.B. Infrared Spectroscopic Studies of the Reactions of Alcohols over Group IVB Metal Oxide Catalysts. Part 2.—Methanol over TiO2, ZrO2 and HfO2. J. Chem. Soc. Faraday Trans. 1991, 87, 2655–2659. [Google Scholar] [CrossRef]
- Chieregato, A.; Velasquez Ochoa, J.; Bandinelli, C.; Fornasari, G.; Cavani, F.; Mella, M. On the Chemistry of Ethanol on Basic Oxides: Revising Mechanisms and Intermediates in the Lebedev and Guerbet Reactions. ChemSusChem 2015, 8, 377–388. [Google Scholar] [CrossRef]
- Yan, T.; Dai, W.; Wu, G.; Lang, S.; Hunger, M.; Guan, N.; Li, L. Mechanistic Insights into One-Step Catalytic Conversion of Ethanol to Butadiene over Bifunctional Zn–Y/Beta Zeolite. ACS Catal. 2018, 8, 2760–2773. [Google Scholar] [CrossRef]
- Wu, W.-C.; Chuang, C.-C.; Lin, J.-L. Bonding Geometry and Reactivity of Methoxy and Ethoxy Groups Adsorbed on Powdered TiO2. J. Phys. Chem. B 2000, 104, 8719–8724. [Google Scholar] [CrossRef]
- Liao, L.-F.; Wu, W.-C.; Chen, C.-Y.; Lin, J.-L. Photooxidation of Formic Acid vs Formate and Ethanol vs Ethoxy on TiO2 and Effect of Adsorbed Water on the Rates of Formate and Formic Acid Photooxidation. J. Phys. Chem. B 2001, 105, 7678–7685. [Google Scholar] [CrossRef]
- Coronado, J.M.; Kataoka, S.; Tejedor-Tejedor, I.; Anderson, M.A. Dynamic Phenomena during the Photocatalytic Oxidation of Ethanol and Acetone over Nanocrystalline TiO2: Simultaneous FTIR Analysis of Gas and Surface Species. J. Catal. 2003, 219, 219–230. [Google Scholar] [CrossRef]
- Bensitel, M.; Moraver, V.; Lamotte, J.; Saur, O.; Lavalley, J.C. Infrared Study of Alcohols Adsorption on Zirconium Oxide: Reactivity of Alkoxy Species towards CO2. Spectrochim. Acta-Part A Mol. Spectrosc. 1987, 43, 1487–1491. [Google Scholar] [CrossRef]
- Kaichev, V.V.; Chesalov, Y.A.; Saraev, A.A.; Klyushin, A.Y.; Knop-Gericke, A.; Andrushkevich, T.V.; Bukhtiyarov, V.I. Redox Mechanism for Selective Oxidation of Ethanol over Monolayer V2O5/TiO2 Catalysts. J. Catal. 2016, 338, 82–93. [Google Scholar] [CrossRef]
- Yuan, B.; Zhang, J.; An, Z.; Zhu, Y.; Shu, X.; Song, H.; Xiang, X.; Wang, W.; Jing, Y.; Zheng, L.; et al. Atomic Ru Catalysis for Ethanol Coupling to C4+ Alcohols. Appl. Catal. B Environ. 2022, 309, 121271. [Google Scholar] [CrossRef]
- Podobiński, J.; Śliwa, M.; Datka, J. Ethoxy Groups on ZrO2, CuO, and CuO/ZrO2 Studied by IR Spectroscopy. Molecules 2022, 27, 4790. [Google Scholar] [CrossRef]
- Molina-Ramírez, S.; Cortés-Reyes, M.; Herrera, C.; Larrubia, M.A.; Alemany, L.J. Catalytic Upgrading of Ethanol to N-Butanol over a Novel Ca-Fe Modified Mixed Oxide Mg-Al Catalyst from Hydrotalcite-Base Precursor. Catal. Today 2022, 394–396, 365–375. [Google Scholar] [CrossRef]
- Müller, P.; Burt, S.P.; Love, A.M.; McDermott, W.P.; Wolf, P.; Hermans, I. Mechanistic Study on the Lewis Acid Catalyzed Synthesis of 1,3-Butadiene over Ta-BEA Using Modulated Operando DRIFTS-MS. ACS Catal. 2016, 6, 6823–6832. [Google Scholar] [CrossRef]
- Wang, S.; Cendejas, M.C.; Hermans, I. Insights into Ethanol Coupling over Hydroxyapatite Using Modulation Excitation Operando Infrared Spectroscopy. ChemCatChem 2020, 12, 4167–4175. [Google Scholar] [CrossRef]
- Yee, A.; Morrison, S.J.; Idriss, H. A Study of the Reactions of Ethanol on CeO2 and Pd/CeO2 by Steady State Reactions, Temperature Programmed Desorption, and In Situ FT-IR. J. Catal. 1999, 186, 279–295. [Google Scholar] [CrossRef]
- Carvalho, D.L.; Borges, L.E.P.; Appel, L.G.; Ramírez de la Piscina, P.; Homs, N. In Situ Infrared Spectroscopic Study of the Reaction Pathway of the Direct Synthesis of N-Butanol from Ethanol over MgAl Mixed-Oxide Catalysts. Catal. Today 2013, 213, 115–121. [Google Scholar] [CrossRef]
- Zhang, J.; Shi, K.; An, Z.; Zhu, Y.; Shu, X.; Song, H.; Xiang, X.; He, J. Acid–Base Promoted Dehydrogenation Coupling of Ethanol on Supported Ag Particles. Ind. Eng. Chem. Res. 2020, 59, 3342–3350. [Google Scholar] [CrossRef]
- van den Brand, J.; Blajiev, O.; Beentjes, P.C.J.; Terryn, H.; de Wit, J.H.W. Interaction of Anhydride and Carboxylic Acid Compounds with Aluminum Oxide Surfaces Studied Using Infrared Reflection Absorption Spectroscopy. Langmuir 2004, 20, 6308–6317. [Google Scholar] [CrossRef]
- Busca, G. Infrared Studies of the Reactive Adsorption of Organic Molecules over Metal Oxides and of the Mechanisms of Their Heterogeneously-Catalyzed Oxidation. Catal. Today 1996, 27, 457–496. [Google Scholar] [CrossRef]
- Young, Z.D.; Hanspal, S.; Davis, R.J. Aldol Condensation of Acetaldehyde over Titania, Hydroxyapatite, and Magnesia. ACS Catal. 2016, 6, 3193–3202. [Google Scholar] [CrossRef]
- Ramasamy, K.K.; Gray, M.; Job, H.; Smith, C.; Wang, Y. Tunable Catalytic Properties of Bi-Functional Mixed Oxides in Ethanol Conversion to High Value Compounds. Catal. Today 2016, 269, 82–87. [Google Scholar] [CrossRef]
- Quesada, J.; Faba, L.; Díaz, E.; Ordóñez, S. Role of the Surface Intermediates in the Stability of Basic Mixed Oxides as Catalyst for Ethanol Condensation. Appl. Catal. A Gen. 2017, 542, 271–281. [Google Scholar] [CrossRef]
- Hucal, A.M.; Tian, W.; Ascherl, P.C.; Herrera, J.E. Tuning of Acid/Base Functionalities in the MgAlO System for Ethanol Upgrade to n-Butanol. Catalysts 2024, 14, 868. [Google Scholar] [CrossRef]
- Portillo Crespo, M.A.; Vidal-Barrero, F.; Azancot, L.; Reina, T.R.; Campoy, M. Insights on Guerbet Reaction: Production of Biobutanol From Bioethanol Over a Mg–Al Spinel Catalyst. Front. Chem. 2022, 10, 945596. [Google Scholar] [CrossRef]
- Guo, M.F.; Gray, M.J.; Job, H.; Alvarez-Vasco, C.; Subramaniam, S.; Zhang, X.; Kovarik, L.; Murugesan, V.; Phillips, S.; Ramasamy, K.K. Uncovering the Active Sites and Demonstrating Stable Catalyst for the Cost-Effective Conversion of Ethanol to 1-Butanol. Green Chem. 2021, 23, 8030–8039. [Google Scholar] [CrossRef]
- Marcu, I.C.; Tanchoux, N.; Fajula, F.; Tichit, D. Catalytic Conversion of Ethanol into Butanol over M-Mg-Al Mixed Oxide Catalysts (M = Pd, Ag, Mn, Fe, Cu, Sm, Yb) Obtained from LDH Precursors. Catal. Letters 2013, 143, 23–30. [Google Scholar] [CrossRef]
Disclaimer/Publisher’s Note: The statements, opinions and data contained in all publications are solely those of the individual author(s) and contributor(s) and not of MDPI and/or the editor(s). MDPI and/or the editor(s) disclaim responsibility for any injury to people or property resulting from any ideas, methods, instructions or products referred to in the content. |
© 2025 by the authors. Licensee MDPI, Basel, Switzerland. This article is an open access article distributed under the terms and conditions of the Creative Commons Attribution (CC BY) license (https://creativecommons.org/licenses/by/4.0/).