Article

Reduction in Chemical Oxygen Demand of Effluents from the Confectionery Sector of Agroindustry Using the Fenton Process

by
Maiara A. P. Frigulio
,
Angélica G. Morales
,
Felipe A. Santos
and
Juliane C. Forti
*
School of Sciences and Engineering, São Paulo State University (UNESP), Tupã 17602-496, SP, Brazil
*
Author to whom correspondence should be addressed.
Sustain. Chem. 2025, 6(4), 32; https://doi.org/10.3390/suschem6040032
Submission received: 30 June 2025 / Revised: 2 September 2025 / Accepted: 22 September 2025 / Published: 25 September 2025

Abstract

The confectionery industry produces effluents with diverse and complex compositions and high organic loads, which are typically not treated by conventional treatment plants. In this context, the Fenton process presents itself as an advanced chemical treatment alternative due to its ease of application, cost-effectiveness, and ability to improve the degradability of challenging effluents. This study addressed the question: How can Fenton’s reagent be applied as a pretreatment to reduce the organic load in real effluents from the food industry? The research evaluated this chemical pretreatment for effluents from a starch-based gummy candy production process, aiming to reduce the organic load and aid subsequent conventional treatments. Parameters such as COD, total dissolved solids (TDS), temperature, pH, electrical conductivity, dissolved oxygen, and degrees Brix (°Bx) were monitored before and after 2 and 4 h of pretreatment. The results showed that Fenton pretreatment reduced COD by more than 31%, with efficiency influenced by effluent composition and concentration. This removal can reduce discharge rates and operating costs, providing an economic advantage. The process proved to be a promising pretreatment option, contributing to the initial removal of pollutants and improving the performance of wastewater treatment systems, thus supporting sustainable industrial practices.

1. Introduction

In the business sector, many companies strive to strengthen their brand regarding social and environmental sustainability. Consequently, investment and research into innovative technologies and alternatives for effluent treatment and waste recovery are ongoing [1,2,3]. Industries continuously improve processes, reduce costs, enhance quality and increase customer satisfaction, crucial factors for growth as consumer market demands escalate daily. Environmental concern is also a priority, reflecting a widely discussed topic over recent decades. It remains on the agenda of governmental bodies, the scientific community, and the public. Industries face the challenge of producing sustainably without environmental degradation, using limited natural resources, including water, responsibly.
It is understood that the environment, within the business context, is seen as a possible source of raw materials, energy, and land use, among others. The business production process, after the use of these resources, results in the desired goods and services, as well as unwanted waste and pollution from its processes [4]. Identifying potential environmental damage and unsustainable use of available resources has become a challenge for environmental management [5], and authors Bánkuti and Bánkuti [6] emphasize the need to discuss not only the competitiveness of the economic sector but also sustainable practices and environmental competitiveness.
Considering the challenges faced by agro-industries, particularly in the food sector, which generates industrial effluents rich in organic matter, further research and development of modern technologies are essential to enhance the treatment of real effluents. These advancements should aim to make treatments more accessible, cost-effective, and competitive while preserving the environment.
The various components present in wastewater that alter its degree of purity are defined and quantified through parameters that assess its quality. These are understood as physical characteristics, chemical characteristics, and biological characteristics [6].
Organic matter is the main cause of water pollution and is responsible for the consumption of dissolved oxygen by decomposing microorganisms. The main organic components are fats, proteins, carbohydrates, surfactants, phenols, pesticides, and other compounds in smaller quantities. They are classified as carbonaceous matter, divided into non-biodegradable and biodegradable compounds, and can be suspended or dissolved. Two indirect analyses are carried out to quantify organic matter: Biochemical oxygen demand (BOD) and chemical oxygen demand (COD), which measure the consumption of oxygen needed to oxidize organic matter by biochemical or chemical means [6].
Specifically, the organic matter in agro-industrial effluents comes from the manufacture of gummy candies, which contain the following raw materials: genetically modified corn starch, sugar, glucose, and may or may not contain flavorings and artificial colorings such as tartrazine and brilliant blue.
The removal of the constituents present in the effluents is carried out by unitary processes. In general, the primary process is carried out using physical processes, the secondary process using biological and chemical processes, and the tertiary process is a combination of all of them [7]. In terms of industrial effluent treatment, various methods and processes can be employed to ensure proper treatment and disposal of waste.
The Fenton process, a chemical treatment method and one of the advanced oxidative processes, produces hydroxyl radicals (OH), which are highly oxidizing and non-selective. These radicals aid in the reduction and mineralization of recalcitrant and toxic organic compounds [8,9,10]. This process involves reacting iron with hydrogen peroxide, which is highly effective in degrading a wide range of pollutants, including recalcitrant and toxic compounds, achieving high COD and toxicity removal rates. The reaction occurs under mild environmental conditions (low temperature and atmospheric pressure), requires no complex equipment, and can be implemented as a pretreatment step, promoting effluent biodegradability and increasing the efficiency of subsequent biological processes. Furthermore, hydrogen peroxide decomposes into water and oxygen, leaving no persistent residue, and the iron used is abundant, inexpensive, and non-toxic [3,9,11].
Numerous studies have investigated the Fenton process for treating various types of effluents, including those from tanneries [12], olive mills [1,13], cellulose and paper industries [14,15], the yeast industry [16], slaughterhouses [2], humic substances [17], coke treatment plants [18], Common Effluent Treatment Plants [19], landfill leachates [20], and pesticides [21,22,23]. These studies demonstrated a reduction in phytotoxicity and up to 90% removal of COD. Improvements were also noted in other parameters, such as color and BOD, across all studies.
Kalyanaraman et al. [12] evaluated the Fenton process in combination with other treatments. In this research, the Fenton reagent was applied as a pretreatment to tannery effluents before biological processing, yielding satisfactory results with this method combination. The pretreatment enhanced the biodegradability of the tannery effluent, leading to the formation of short-chain hydrocarbons and reductions in both COD and BOD. Likewise, Kallel et al. [1] applied Fenton oxidation to reduce phenolic compounds and noted that although these compounds are not highly toxic, high concentrations can inhibit or decrease the efficiency of anaerobic or aerobic biological processes. Therefore, combining this method with biological systems requires meticulous planning and precision. If the oxidation reaction is not appropriately managed, the radicals produced during the Fenton reaction will indiscriminately oxidize all organic matter present.
Almeida et al. [2] highlight the critical role of residual hydrogen peroxide, noting that its excess can interfere with COD analysis by reacting with potassium dichromate. These researchers also explored the optimal coagulation pH following the Fenton reaction to facilitate the removal of precipitated iron using synthetic microfilters, ensuring the sludge generated meets legislative disposal standards.
Therefore, this study aimed to apply the Fenton process as a pretreatment for effluents from the food industry to reduce their initial organic load before proceeding with conventional treatments to meet disposal standards. This research contributes to environmental sustainability, aligning closely with SDG 6 (Clean Water and Sanitation) targets, particularly indicators 6.3 and 6.6 (a), which focus on reducing the discharge of untreated wastewater and enhancing effluent treatment capacity. Additionally, it supports SDG 9 (Industry, Innovation, and Infrastructure) targets, specifically indicator 9.5, which aims to bolster scientific research and technological capabilities [24].

2. Materials and Methods

This study employs a quantitative methodological framework, involving experimental research conducted in a laboratory. It includes the analysis of raw and treated effluent samples, characterized before and after each treatment (2 h and 4 h) in the food industry’s laboratory that generated the effluent. Scheme 1 shows the steps taken.
To capture variability in organic load, samples of raw effluent were collected on different days, identified as DAY 1, DAY 2, and DAY 3 (a 30-day difference between them).
For the experiments involving the Fenton reaction, different effluent concentrations were tested: 25%, 50%, and 100% designated as F1, F2, and F3, respectively.
The concentration of the Fenton reagent used for all experiments was standardized at 12.5 mg L−1 of iron(II) sulfate (FeSO4·7H2O, Synth, analytical standard; 99% pure) and 125.0 mg L−1 of hydrogen peroxide (H2O2, Synth, analytical standard, 29% (v/v)), maintaining a 1:10 ratio in the final solution. This ratio was chosen since it has shown optimal performance in degrading and reducing chemical oxygen demand in waters containing pesticides [21,22].
Before introducing the Fenton reagent into the experiment, the pH of the sample was adjusted to 3 using a 0.1 mol L−1 sulfuric acid solution to prevent the precipitation of ferrous sulfate [3]. Table 1 shows the concentrations used in the experiments.
Dilutions were performed as an alternative and precaution in case the results and analyses were compromised due to high effluent concentration. The final volume of the samples was 80 mL. The experiments were conducted at room temperature, without agitation, and in triplicate. The experimental protocol encompasses the following steps: collecting the effluent, sampling, conducting initial characterization analyses, preparing solutions and adjusting pH, and performing experiments labeled F1, F2, and F3. Additional samples were collected 2 and 4 h after initiating the reactions in these experiments.
To characterize the initial raw effluent and post-experiment samples, chemical analyses included Chemical Oxygen Demand (COD; mg L−1), Total Dissolved Solids (TDS; mg L−1), Temperature (T; °C), Electrical Conductivity (EC; μs cm−1), pH, Dissolved Oxygen (DO; mg L−1), and Soluble Solids Content in a Sucrose Solution (°Bx).
The following equipment was used for the analyses: (1) an AK50 multiparameter device (Akso, São Leopoldo, Brazil) equipped with specific electrodes for TDS, pH, temperature, and EC analyses; (2) an AK87 device (Akso, São Leopoldo, Brazil) for DO levels; (3) an Abbe refractometer (Quimis, São Paulo, Brazil) for °Bx measurements; (4) the colorimetric method outlined in ASTM [25] for COD determination. To do so, the sample was mixed with a digestion solution containing potassium dichromate, sulfuric acid, and mercury sulfate (K2Cr2O7, H2SO4, and HgSO4) and incubated in a digestion block at 150 °C for 2 h. After cooling and settling, the sample’s absorbance was measured at 600 nm using a UV-Vis spectrophotometer (Quimis). The COD analysis bottles were provided by Hanna Instruments and complied with the Standard Methods 5220D [26], ISO 15705:2022 [27], and EPA 410.4 [28] methods.

3. Results and Discussion

The organic matter in the effluent analyzed originates from the industrial production of starch-based gummy candies. On days 1 and 3, the production line was dedicated solely to the core of a product known as “Jellybeans.” On day 2, the production involved mint-flavored gummy candies, which could alter the characteristics of the effluent due to the distinct formulation of this product. Typically, the base ingredients of these candies include genetically modified cornstarch, sugar, and glucose. The mint-flavored candies additionally contain artificial flavorings and colorants, such as tartrazine yellow and brilliant blue.
Table 2 presents the results of the laboratory analyses of the effluents, represented by the arithmetic mean and standard deviation of the measurements taken in triplicate.
The results from the raw effluent were assessed for each parameter individually, as all parameters must comply with the specified regulatory ranges before final discharge. The pH values from DAYS 1, 2, and 3 were within the discharge limits set by Federal Resolution CONAMA No. 430/2011, which updates and amends Federal Resolution CONAMA No. 357/2005 in part [29,30]. However, this resolution also states that these parameters must be adhered to when specific norms and directives from the competent authority and the operator of the sewage collection and treatment systems are confirmed.
In São Paulo State (Brazil), following the directives of the state environmental agency CETESB, the facility must adhere to Article 19-A of Decree No. 8468 from 1976, which mandates discharging effluents into the public sewage system equipped for treatment. Under these guidelines, the pH range for discharge becomes more restrictive; consequently, the pH values from DAYS 1 and 3, which fall outside the permissible range of 6 to 9, do not comply. This pH range is crucial for protecting aquatic life, as deviations can impact the physiology of various species [31].
The COD of the effluent analyzed is significantly higher compared to other industrial effluents. This variation in organic load across the sampled days can be attributed to differences in product composition and the variability of washing residues, which depend on the preliminary cleaning of the tanks before washing with running water. Inadequate removal of product residues from equipment before washing can lead to increased organic loads in the effluent. For instance, Davies and Stulp [32] reported an average COD of 10,700 mg L−1 in the effluent from Docile Alimentos Ltda, which was then the second-largest producer of gummy candies in Brazil. In contrast, other industries report lower COD values: tanneries at 1300 mg L−1 [12], olive mill wastewater at 1990 mg L−1 [13], cellulose at 400 mg L−1 [14], landfill leachate at 2428 mg L−1 [20], and sewage ranging from 427 to 678 mg L−1 [33]. Optimizing the cleaning process to remove residue more effectively before the sanitation phase could significantly reduce the COD of the final effluent, thus enhancing its quality.
Regarding the discharge parameter for COD set by the São Paulo Basic Sanitation Company (SABESP) [34], the operator responsible for treating and properly disposing of the industry’s effluent, Communication 03/19 mandates a limit of 450 mg L−1 for industries in the food manufacturing sector. This standard comes with a minimum K1 factor of 1.55. If COD values exceed this limit, the K1 factor will be recalculated to reflect the effluent’s increased toxicity. This recalculated K1 factor also influences the calculation of fees charged to the effluent-generating industry, with higher factors leading to higher fees. The COD levels measured in the raw effluent on DAYS 1, 2, and 3 were 49, 100, and 3 times higher than the established limit, respectively, for those days.
Regarding temperature, the results from the three samples comply with Decree 8468/76, which sets the discharge limit up to 40 °C [35]. Temperature is a critical parameter in aquatic environments, as industrial discharges typically raise water temperatures. Generally, as temperature increases from 0 to 30 °C, properties such as specific heat, ionization constant, surface tension, compressibility, viscosity, and latent heat of vaporization decrease, while thermal conductivity and vapor pressure increase. Since aquatic organisms have thermal tolerance limits, monitoring and controlling water temperature is essential [31].
For the DO parameter, results from DAYS 2 and 3 were similar, around 4.5 mg L−1. Fish cannot survive in water with DO concentrations below 4.0 mg L−1. On DAY 1, the concentration was lower, at 2.6 mg L−1, but still above the critical threshold of 2.0 mg L−1. Below this level, aerobic microorganisms struggle to survive [31]. Monitoring DO is crucial because pollution increases lead to a decrease in DO due to its consumption during the decomposition of organic compounds [36]. According to CETESB’s Decree 8468/76, which classifies water bodies, the DO in treated effluent can range from 0.5 to 5.0 mg L−1 [31]; however, the effluent from the agro-industry in this study is discharged not directly into water bodies but into the sewage collection and treatment systems, which do not specify a minimum DO value.
Regarding TDS, Federal Resolution CONAMA No. 357/2005 stipulates a maximum limit of 500 mg L−1 for effluents [29]. Only the results from DAY 2 failed to comply, showing a TDS of 1393.0 mg L−1. Excessive solids are problematic as they can settle in riverbeds, trapping bacteria and organic residues, promoting anaerobic decomposition, and thus harming aquatic life [31]. The TDS analysis measures all organic matter in the solution that remains as residue after evaporation at certain temperatures.
The EC measured over the three days exceeded 350 μs cm−1, with a peak of 2086 μs cm−1 on DAY 2. CETESB [31] notes that values above 100 μs cm−1 suggest impacted environments; as more TDS are introduced, EC increases. Electrical conductivity is a physicochemical parameter that quantitatively indicates the water’s ability to conduct electricity, which depends on the concentration of cations and anions [37]. This parameter is associated with the concentrations of total dissolved solids and salinity.
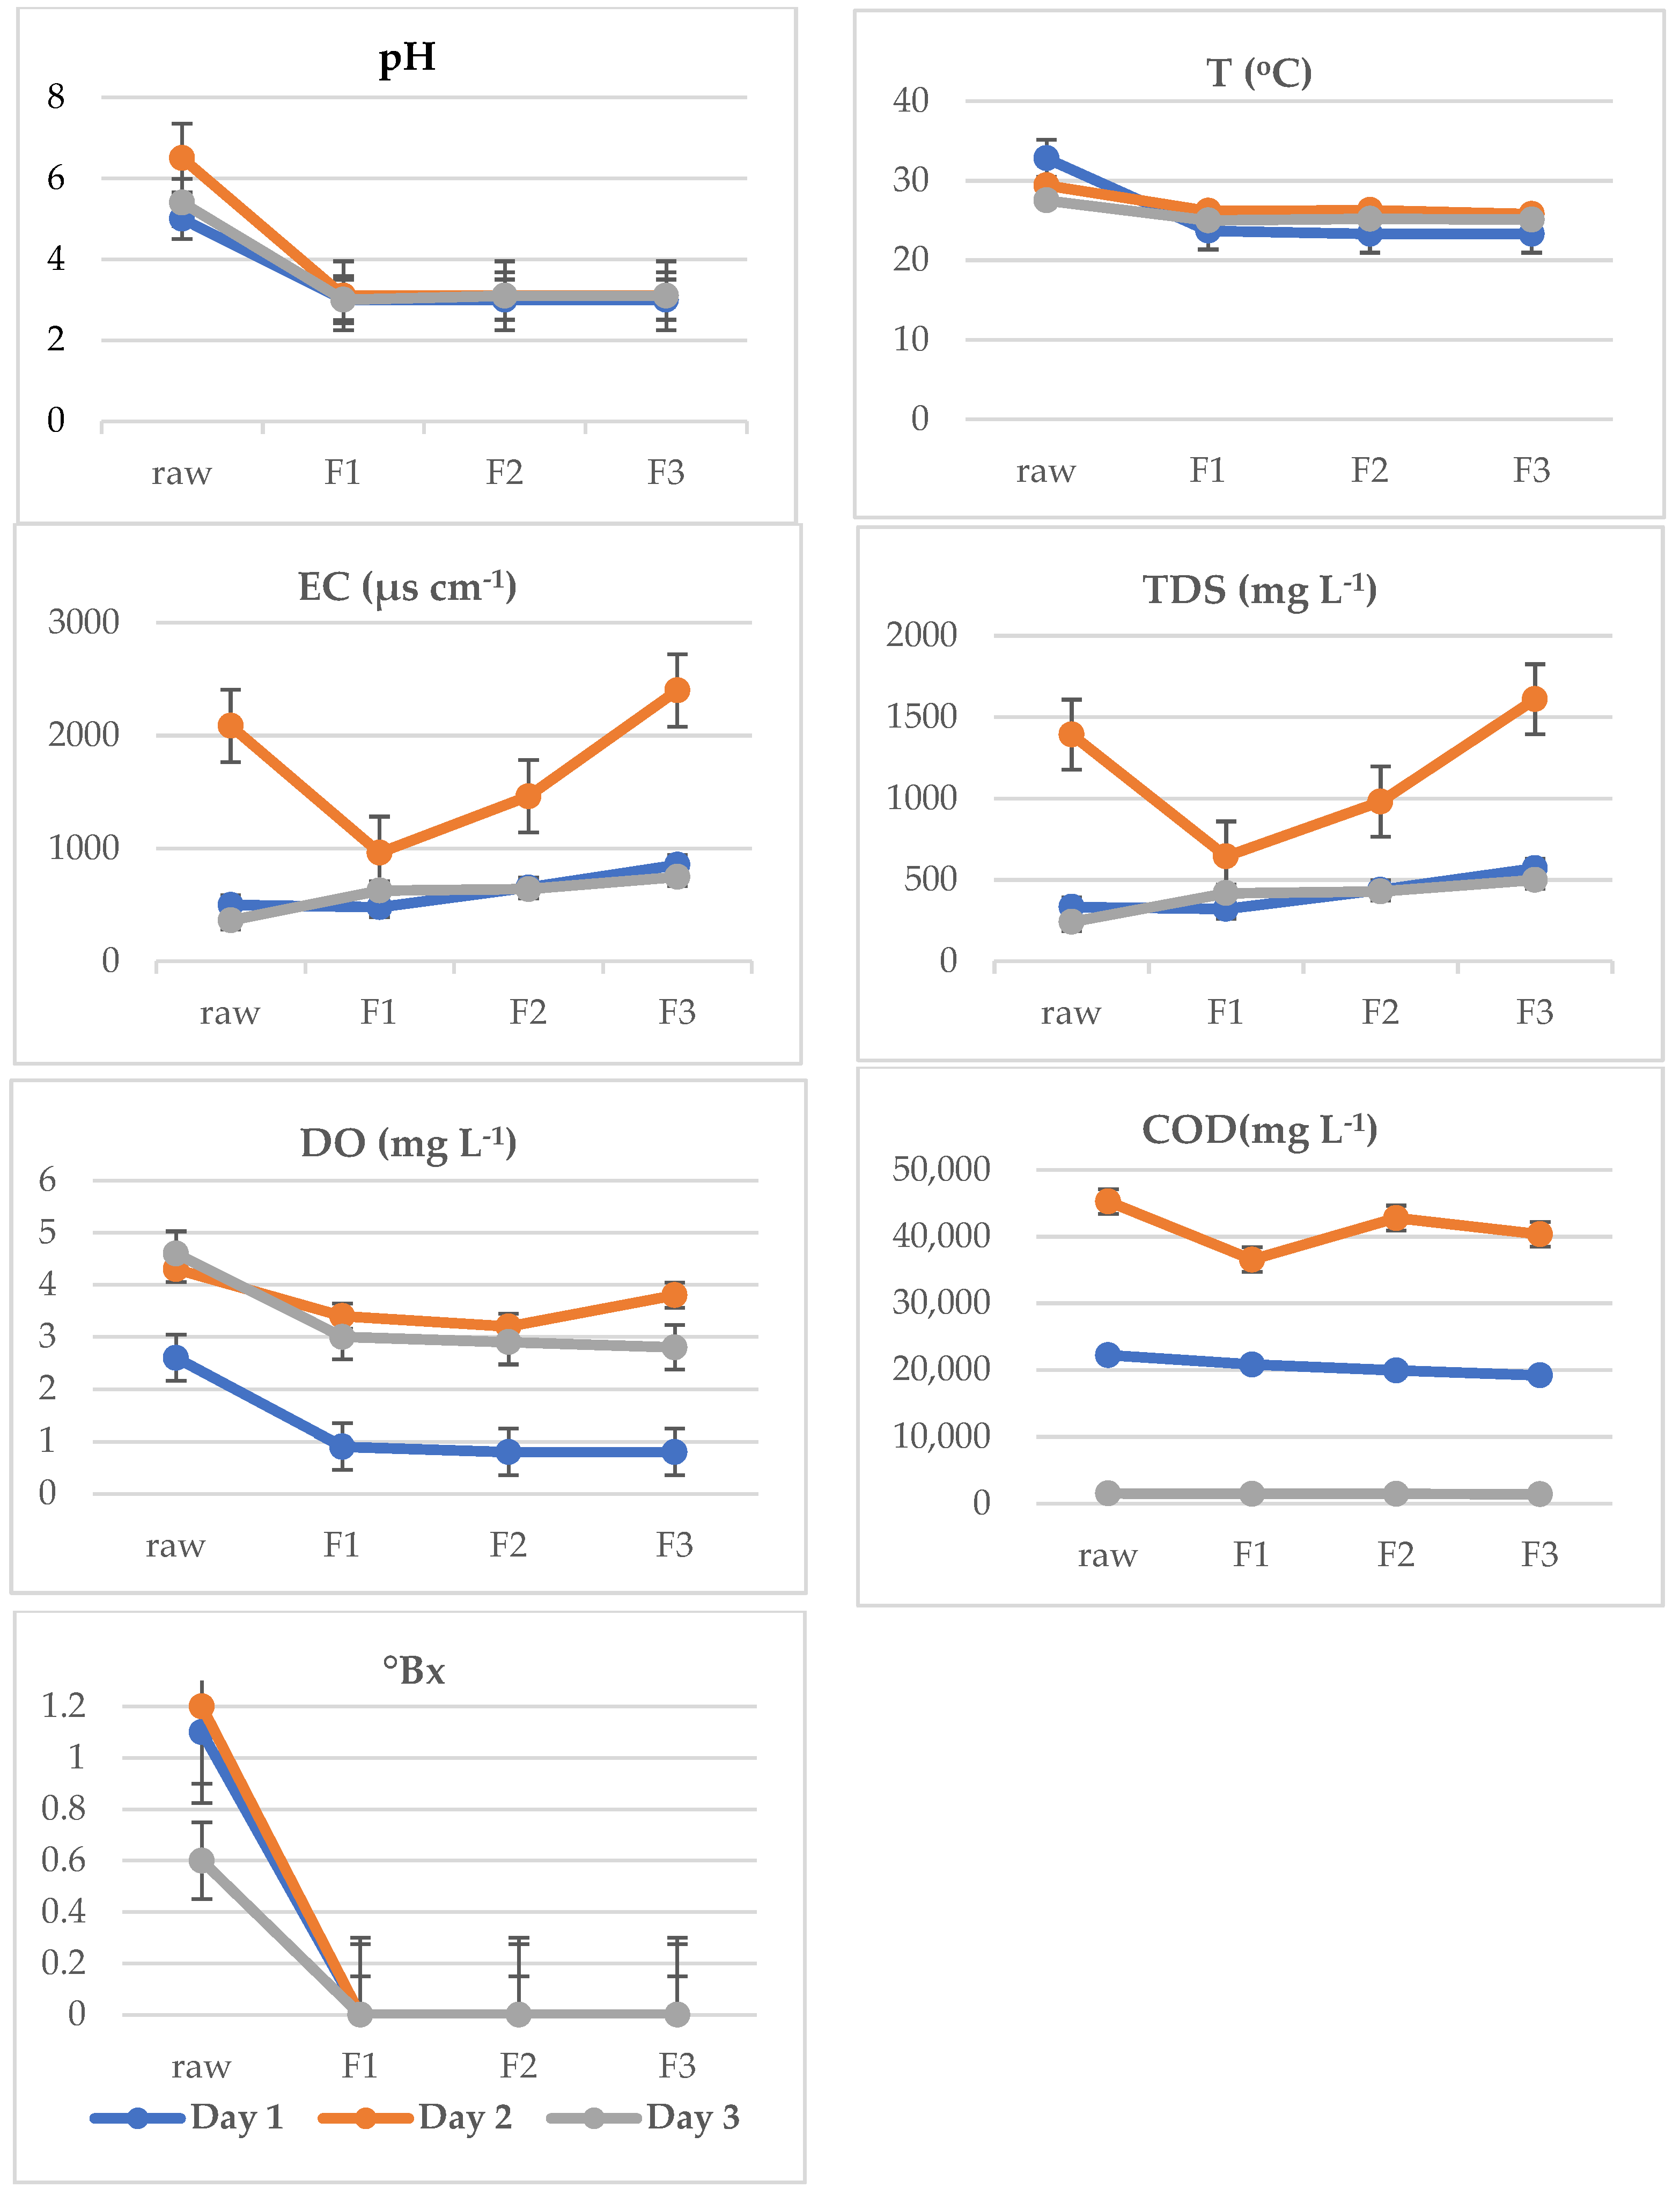
The °Bx analysis measures the content of soluble solids, primarily sucrose, in a solution. Given the high sucrose content in the product formulation, this analysis was essential for its characterization. Following these characterization analyses, experiments using the Fenton reagent as a pre-treatment were conducted. Figure 1 shows the analysis after 2 h of Fenton reagent application.
A slight reduction in COD was observed after the first 2 h of reaction, as detailed in Figure 1 in all the experiments, taking into account the data in Table 2.
On average, the reductions in COD across the concentrations applied (F1, F2, F3) were 5.2% for DAY 3, 10.1% for DAY 1, and 11.8% for DAY 2.
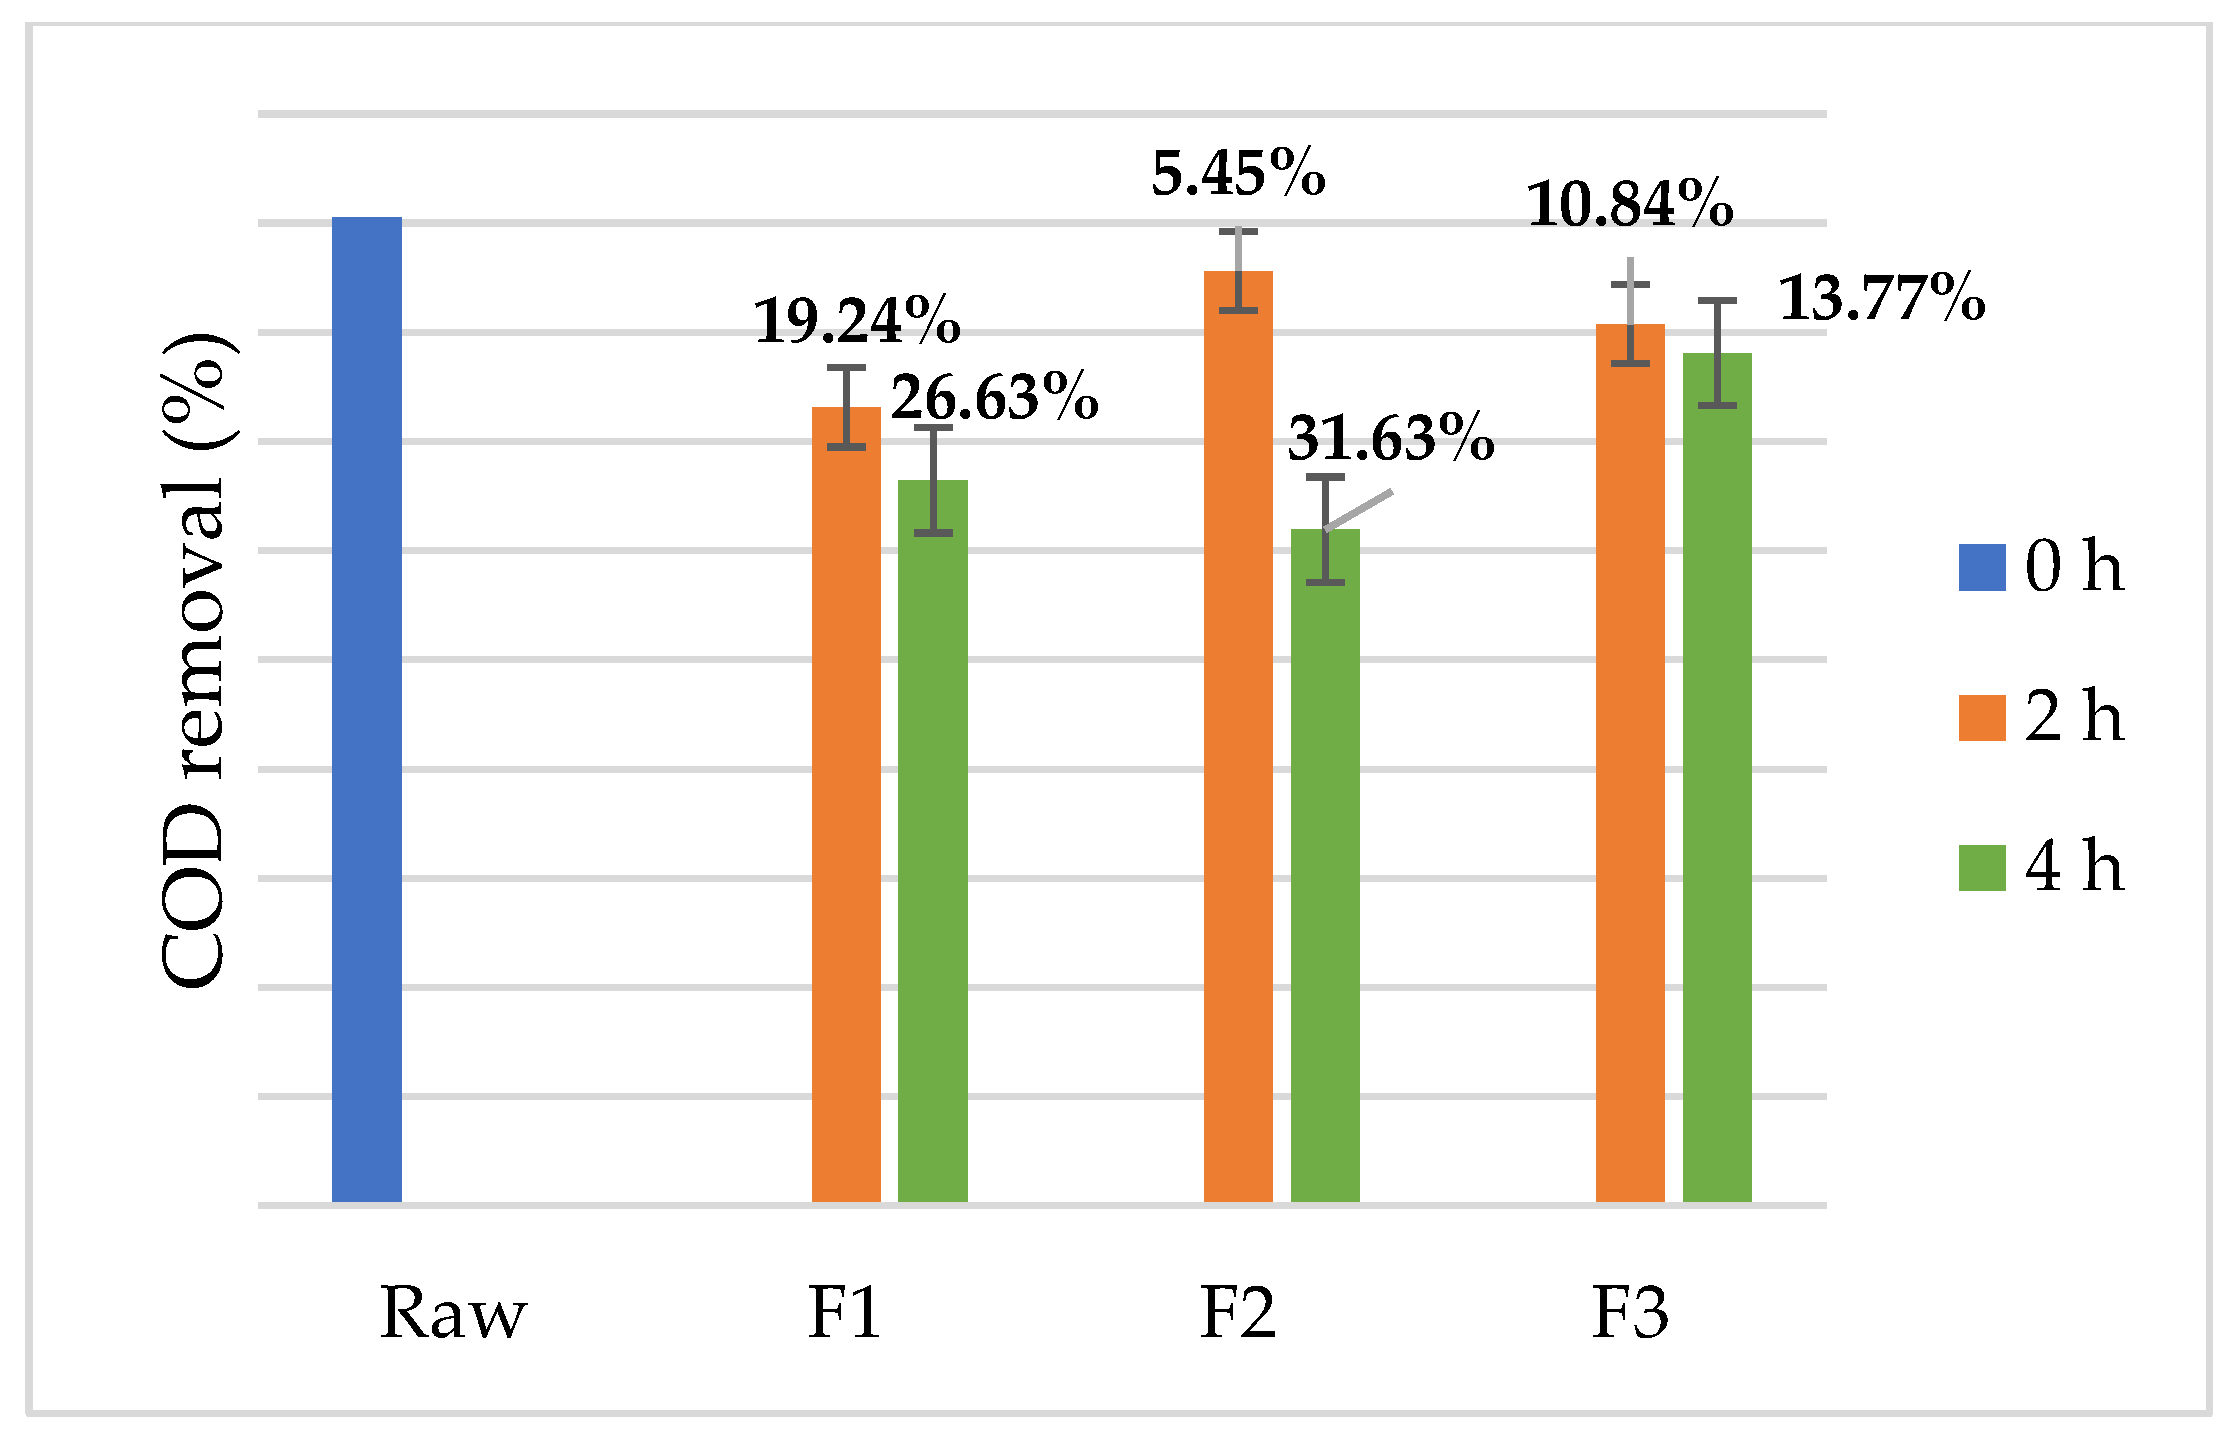
Experiment F1 on DAY 2 resulted in better COD removal than the other experiments, achieving a reduction of 19.2% in the first two hours. Concerning the other parameters on this DAY, there was a total reduction in °Bx, as in all the experiments on the days evaluated; however, there was an increase in STD and EC due to the addition of ferrous sulfate as a source of Fe2+, to improve reaction performance [38]. On DAY 2, the raw effluent collected had the highest organic load among the days evaluated.
Conversely, the lowest COD reduction was observed in the F1 concentration on DAY 3, with only a 3.7% decrease, and a significant increase in TDS and EC by 148% and 191%, respectively. This sample had the lowest organic load among the days tested.
Regarding temperature, all samples achieved equilibrium with the ambient temperature of the respective day, despite the exothermic nature of the Fenton process [39]. The experiment on DAY 1 experienced the highest average temperature adjustment, from 32.8 °C to an average of 23.4 °C. Ziembowicz and Kida [40] note that while Fenton reactions typically occur at 20–30 °C, higher temperatures can sometimes enhance efficiency by increasing oxidation rates.
Concerning DO, DAY 1 showed the highest consumption, which may be related to the mineralization of organic matter into CO2.
In cases involving “real” effluent, numerous organic compounds are oxidized by the Fenton process but also form reaction intermediates that contribute to residual COD values. In these cases, time is a critical factor. The required reaction time varies significantly based on the substrate and process parameters, ranging from minutes to several hours for optimal efficiency [40].
After 4 h of reaction at room temperature, new samples were collected, and the results are detailed in Figure 2.
According to Moravia et al. [20], the typical reaction time for the Fenton process ranges between 30 and 60 min. However, for effluents with more concentrated pollutants, the process may extend for several hours to achieve significant reductions. This was observed in this study, where, after 4 h of reaction, a more substantial reduction in COD was noted.
The oxidation mechanism of the Fenton process is complex, involving over twenty chemical reactions as outlined by Duesterberg et al. [41] and Pliego et al. [42]. Essentially, Fenton’s catalytic reactions involve the oxidation of iron and the reduction of hydrogen peroxide, producing hydroxyl radicals [43]. Additionally, the reduction of Fe3+ back to Fe2+ also occurs, albeit at a rate 6000 times slower than the first reaction [3]. As previously described, this reaction produces highly reactive hydroxyl radicals (E° 2.8 V) and can also generate other radicals with lower oxidative power, leading to potential undesired consumption of hydrogen peroxide [44].
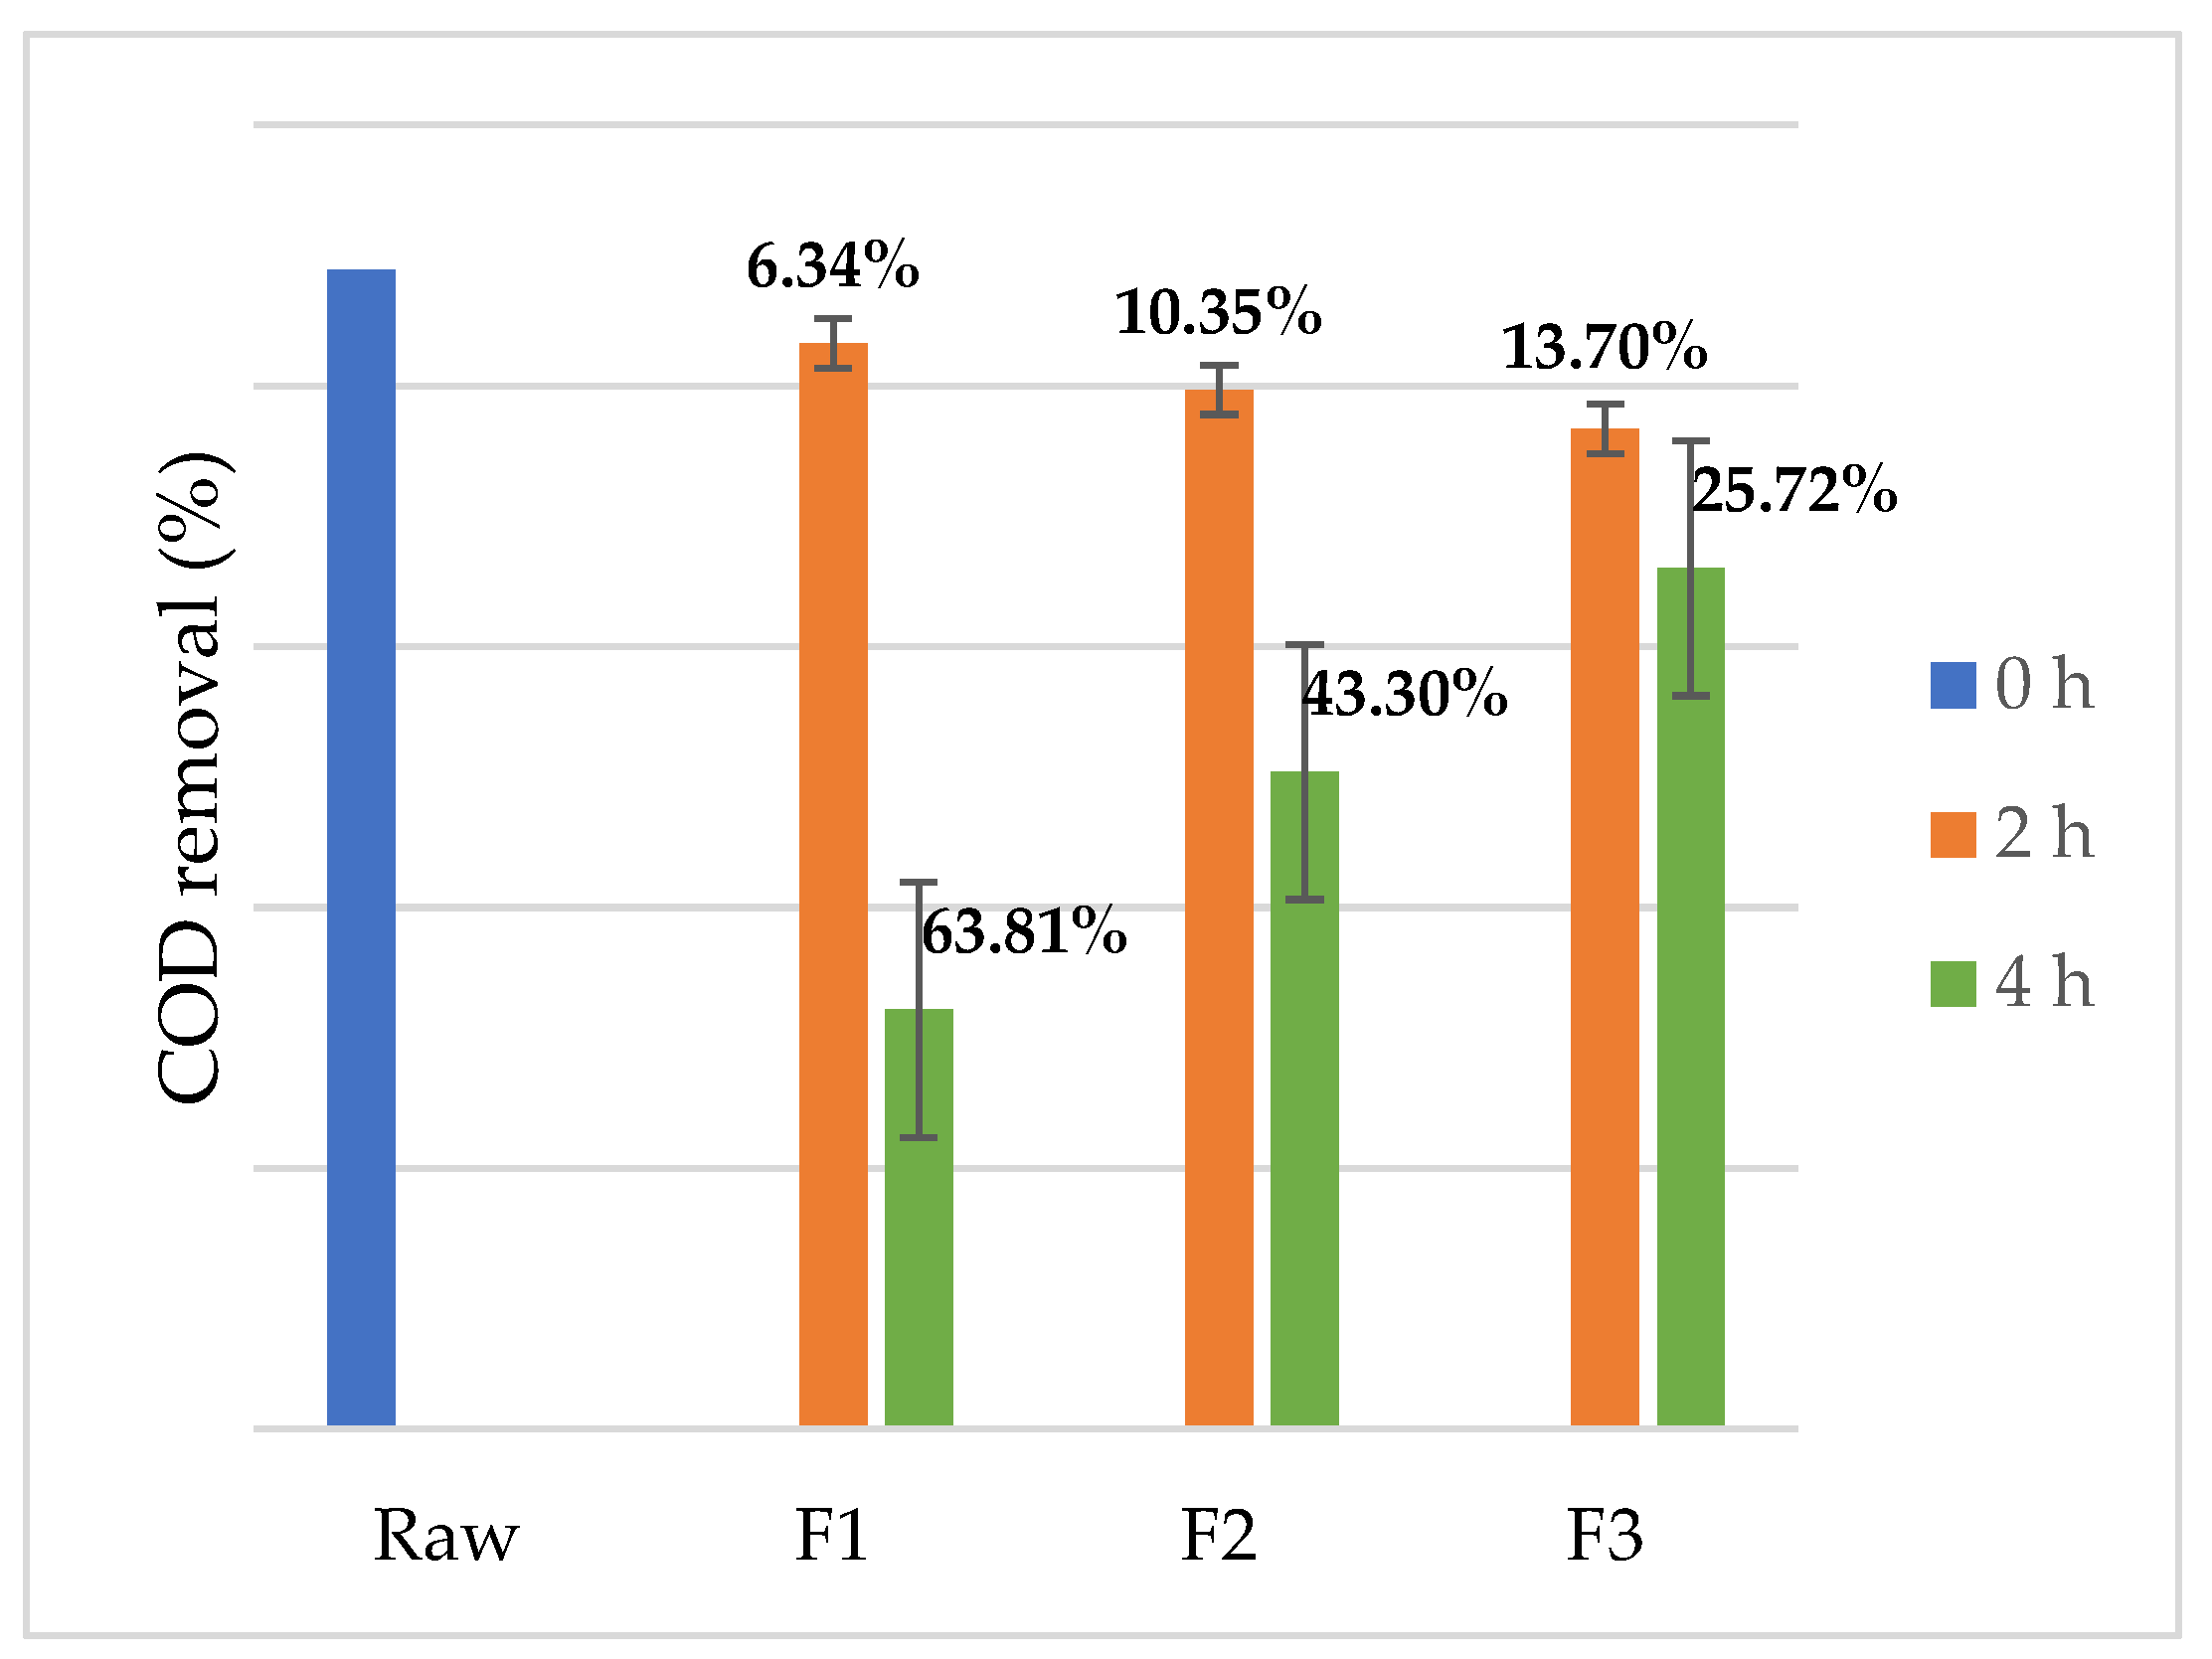
The removal efficiency of each experiment, among other factors, heavily depends on the Fe2+/H2O2 ratio, influenced by the initial COD concentration and the composition of the analyzed effluent. Lucena and Rocha [45] note that this ratio and the dosage of H2O2 should be tailored to the initial COD, as higher concentrations necessitate larger amounts of H2O2. In this study, the 1:10 Fe2+/H2O2 dosage demonstrated optimal removal efficiency on DAY 1 for F1 (25% effluent concentration), achieving a 63.8% reduction in COD after 4 h of treatment. In contrast, the F2 and F3 concentrations showed reductions of 43.3% and 25.7%, respectively, with an average reduction of 44.3% across the experiments. For DAYS 2 and 3, the reductions were more modest, averaging 24.0% and 8.3%, respectively. This 1:10 ratio was also highlighted by Moravia et al. [20] and Forti et al. [21] as effective in various contexts, including landfill leachate and the degradation of 2,4-D (2,4-dichlorophenoxyacetic acid) with the Fenton reagent.
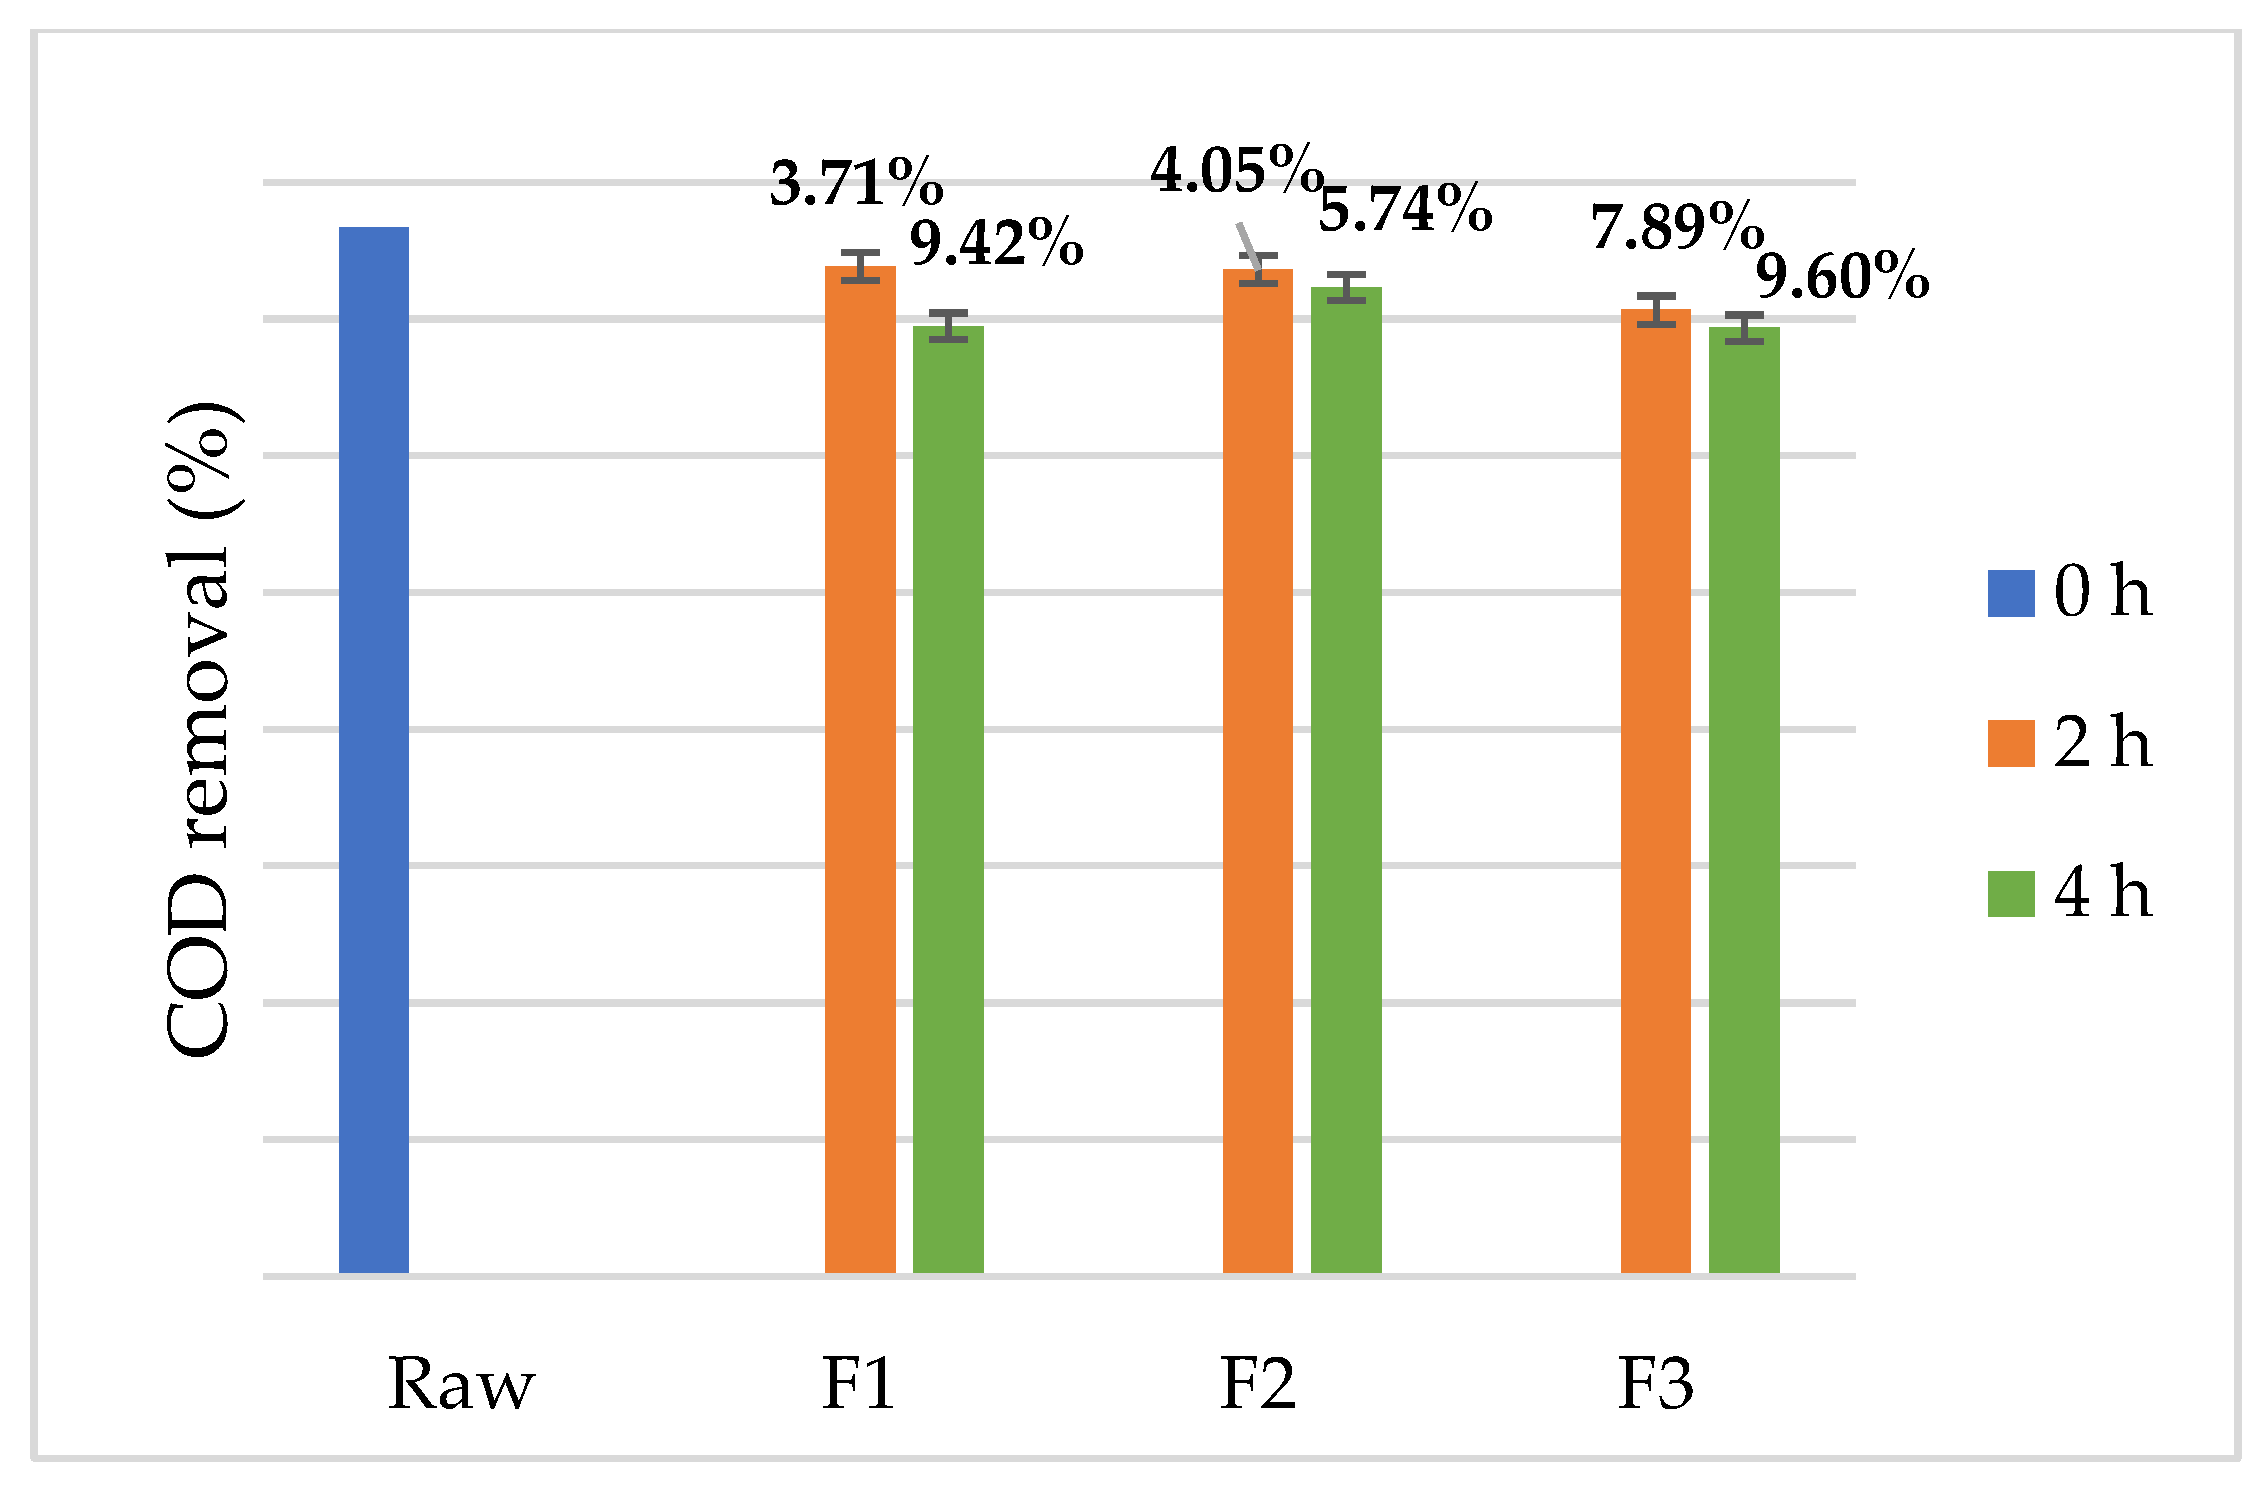
Figure 3, Figure 4 and Figure 5 illustrate the COD removal outcomes following the application of the Fenton process as a pre-treatment, corresponding to the different effluent concentrations and collection days.
Figure 3 illustrates a notable removal of COD following 4 h of Fenton process application, with the reduction inversely correlated to the effluent concentration. Additionally, an increase in DO concentration is also observed (Figure 2) compared to Figure 1 in experiments F1, F2, and F3, as the organic load decreases.
For Experiment F1 on DAY 2 (Figure 4), there was a reduction of 26.6% in COD and a slight increase in DO (Figure 2) when compared to Figure 1. The TDS and EC rates for F1 also decreased by 7.3% and 7.1% in the final 4 h of reaction (Figure 2), while results from DAY 1 (F2) showed an increase in TDS and EC by 6.6% and 6.9%. This variation may be attributed to differences in effluent composition due to the production of various products during sampling, which can influence the efficiency of the Fenton process, as noted by Zhang et al. [3].
Conversely, Figure 5 (DAY 3) shows that F1, F2, and F3 resulted in modest COD removal: 9.4%, 5.7%, and 9.6%, respectively, after 4 h of reaction. Concerning the TDS and EC parameters for (DAY 3), there was an increase (Figure 2) compared to (Figure 1) of 3.2% and 2.9%-(F1); 1.0% and 1.1%-(F2); 1.8% and 1.8%-(F3), respectively. The increase in DO concentrations was 0.47, 0.14, and 0.57 mg L−1 for the experiments.
After carrying out the experiments as a pre-treatment alternative, there was an improvement in the initial results. Initially, the raw effluent had COD values up to 49,100, and 3 times higher than the stipulated discharge limit for DAYS 1, 2, and 3. After 4 h of reaction, the F1 pre-treatment for DAY 1 achieved a 63.8% reduction in COD, while remaining 18 times above the discharge limit. For DAY 2, experiment F2, there was a 31.6% reduction, which was still 69 times higher than the discharge limit. For DAY 3, experiment F3, there was a total reduction of 9.6%, still 3 times higher than the discharge limit.
The Fenton process’s main environmental and operational disadvantages include strict pH control, which requires acidification and subsequent neutralization of the effluent, generating salts that can increase its salinity. Depending on the experimental conditions, it also potentially forms ferric sludge, which requires appropriate treatment and disposal. However, its high efficiency in degrading recalcitrant and toxic organic compounds, its operation under mild conditions, its potential for pretreatment to increase effluent biodegradability, the absence of persistent byproducts, and the use of abundant and low-cost catalysts justify its adoption as a technically and environmentally viable alternative for effluents with complex compositions.

4. Conclusions

The evaluated pretreatment method proved satisfactory, but its effectiveness depends on the composition and concentration of the effluent. For F1 (DAY 1) and F2 (DAY 2), reductions in organic load exceeding 31% were observed, translating to a reduction of up to 31 times. Consequently, the same reduction would apply to the calculation of charges for disposal fees, bringing an economic benefit to the enterprise.
Among the concentrations and experiment times tested with the Fenton process reagent, F1 (DAY 1), using a lower effluent concentration (25%), exhibited the most substantial reduction, with a 63.8% decrease in organic load after 4 h. However, from a business and sustainability standpoint, this approach might not be advantageous since it would require diluting the effluent to achieve the obtained result, thereby increasing industrial water consumption. Conversely, the undiluted experiment with 100% effluent (F3) showed a lower removal (25.7%), yet it remains significant on an industrial pretreatment scale.
Applying the Fenton reagent in effluents from the starch-based gummy candy production process effectively reduces its initial organic load, provided that the appropriate Fe2+/H2O2 proportion is determined based on the industrial effluent’s composition. Therefore, it can be concluded that the general objective of this study has been accomplished.
Plans include the implementation of pre-treatment on an industrial scale and verification of quality assurance and quality control (QA/QC).

Author Contributions

Conceptualization, J.C.F.; methodology, M.A.P.F. and J.C.F.; validation, M.A.P.F., J.C.F., A.G.M. and F.A.S.; formal analysis, M.A.P.F., J.C.F., A.G.M. and F.A.S.; investigation, M.A.P.F. and J.C.F.; resources, J.C.F.; data curation, M.A.P.F. and J.C.F.; writing—original draft preparation, M.A.P.F., J.C.F., A.G.M. and F.A.S.; writing—review and editing, M.A.P.F., J.C.F., A.G.M. and F.A.S.; visualization, M.A.P.F., J.C.F., A.G.M. and F.A.S.; supervision, J.C.F.; project administration, J.C.F.; funding acquisition, J.C.F. All authors have read and agreed to the published version of the manuscript.

Funding

This work was supported by the São Paulo Research Foundation-FAPESP [grant numbers: 2016/22115-2; 2022/10999-4] and Brazilian National Council for Scientific and Technological Development-CNPq [grant number: 402757/2016-5].

Data Availability Statement

The data present in this study are available on request from the corresponding author.

Acknowledgments

Graduate Program in Agribusiness and Development of the School of Sciences and Engineering at UNESP (PGAD/UNESP), CAPES-AUXPE n. 88881.640579/2021-01.

Conflicts of Interest

The authors declare no conflicts of interest.

Abbreviations

The following abbreviations are used in this manuscript:
OHhydroxyl radicals
CODchemical oxygen demand
TDStotal dissolved solids
DOdissolved oxygen
ECelectrical conductivity

References

  1. Kallel, M.; Belaid, C.; Mechichi, T.; Ksibi, M.; Elleuch, B. Removal of organic load and phenolic compounds from olive mill wastewater by Fenton oxidation with zero-valent iron. Chem. Eng. J. 2009, 150, 391–395. [Google Scholar] [CrossRef]
  2. de Almeida, F.S.C.; Cavalli, A.; Lenhard, D.C.; Genena, A.K. Determination of operational conditions for tertiary treatment of slaughterhouse wastewater by the integrated Fenton-Coagulation process. Ambiente E Agua-Interdiscip. J. Appl. Sci. 2015, 10, 565–573. [Google Scholar]
  3. Zhang, M.H.; Dong, H.; Zhao, L.; Wang, D.X.; Meng, D. A review on Fenton process for organic wastewater treatment based on optimization perspective. Sci. Total Environ. 2019, 670, 110–121. [Google Scholar] [CrossRef]
  4. Bánkuti, S.M.; Bánkuti, F.I. Environmental management and business strategy: A study in a cosmetics company in Brazil. Manag. Prod. 2014, 21, 171–184. [Google Scholar] [CrossRef]
  5. Costa Filho, B.A.; Rosa, F. Maturity in environmental management: Revisiting best practices. Electron. J. Adm. 2017, 23, 110–134. [Google Scholar] [CrossRef]
  6. Sperling, M.V. Introduction to Water Quality and Sewage Treatment, 3rd ed.; Department of Sanitary and Environmental Engineering, Federal University of Minas Gerais: Belo Horizonte, Brazil, 2005; Available online: https://www.google.com.br/books/edition/Introdu%C3%A7%C3%A3o_%C3%A0_qualidade_das_%C3%A1guas_e_a/1pxhLVxVFHoC?hl=pt-BR&gbpv=1 (accessed on 9 June 2025).
  7. Júnior, Ê.V. Sistema Integrado de Gestão Ambiental: Como Implementar um Sistema de Gestão que Atenda à Norma ISO 14001, a Partir de um Sistema Baseada na Norma ISO 9000; Editora Aquariana: São Paulo, Brazil, 1998; Available online: https://books.google.com.br/books?hl=pt-BR&lr=&id=8nDS2Tcgn_4C&oi=fnd&pg=PA9&dq=viterbo+junior&ots=b7zFfxy0l8&sig=BkvMhxV7lgZGVDWNJOcaBsdObLQ&redir_esc=y#v=onepage&q=viterbo%20junior&f=false (accessed on 11 May 2025).
  8. Brillas, E. Recent development of electrochemical advanced oxidation of herbicides. A review on its application to wastewater treatment and soil remediation. J. Clean. Prod. 2021, 290, 125841. [Google Scholar] [CrossRef]
  9. Ribeiro, J.P.; Nunes, M.I. Recent trends and developments in Fenton processes for industrial wastewater treatment–A critical review. Environ. Res. 2021, 197, 110957. [Google Scholar] [CrossRef]
  10. Wang, J.; Zhuan, R. Degradation of antibiotics by advanced oxidation processes: An overview. Sci. Total Environ. 2020, 701, 135023. [Google Scholar] [CrossRef]
  11. Tekin, H.; Bilkay, O.; Ataberk, S.S.; Balta, T.H.; Ceribasi, I.H.; Sanin, F.D.; Dilek, F.B.; Yetis, U. Use of Fenton oxidation to improve the biodegradability of a pharmaceutical wastewater. J. Hazard. Mater. 2006, 136, 258–265. [Google Scholar] [CrossRef]
  12. Kalyanaraman, C.; Kanchinadham, S.B.K.; Vidya Devi, L.; Porselvam, S.; Rao, J.R. Combined advanced oxidation processes and aerobic biological treatment for synthetic fatliquor used in tanneries. Ind. Eng. Chem. Res. 2012, 51, 16171–16181. [Google Scholar] [CrossRef]
  13. Lucas, M.S.; Peres, J.A. Removal of COD from olive mill wastewater by Fenton’s reagent: Kinetic study. J. Hazard. Mater. 2009, 168, 1253–1259. [Google Scholar] [CrossRef] [PubMed]
  14. Catalkaya, E.C.; Kargi, F. Color, TOC and AOX removals from pulp mill effluent by advanced oxidation processes: A comparative study. J. Hazard. Mater. 2007, 139, 244–253. [Google Scholar] [CrossRef] [PubMed]
  15. Jamil, T.S.; Ghaly, M.Y.; El-Seesy, I.E.; Souaya, E.R.; Nasr, R.A. A comparative study among different photochemical oxidation processes to enhance the biodegradability of paper mill wastewater. J. Hazard. Mater. 2011, 185, 353–358. [Google Scholar] [CrossRef]
  16. Pala, A.; Erden, G. Decolorization of a baker’s yeast industry effluent by Fenton oxidation. J. Hazard. Mater. 2005, 127, 141–148. [Google Scholar] [CrossRef]
  17. De Julio, M.; Neves, E.F.A.; Trofino, J.C.; Di Bernardo, L. Fenton’s reagent as coagulant agent on removing humic substances from water through dissolved air flotation and filtration. Eng. Sanit. Ambient. 2006, 11, 260–268. [Google Scholar] [CrossRef]
  18. Jiang, W.X.; Zhang, W.; Li, B.J.; Duan, J.; Lv, Y.; Liu, W.D.; Ying, W.C. Combined fenton oxidation and biological activated carbon process for recycling of coking plant effluent. J. Hazard. Mater. 2011, 189, 308–314. [Google Scholar] [CrossRef]
  19. Ghumra, D.P.; Agarkoti, C.; Gogate, P.R. Improvements in effluent treatment technologies in Common Effluent Treatment Plants (CETPs): Review and recent advances. Process Saf. Environ. Prot. 2021, 147, 1018–1051. [Google Scholar] [CrossRef]
  20. Moravia, W.G.; Lange, L.C.; Amaral, M.C.S. Evaluate of advanced oxidative process by Fenton reagent under optimized conditions for landfill leachate treatment of with emphasis on collective parameters and characterization of sludge generated. Química Nova 2011, 34, 1370–1377. [Google Scholar] [CrossRef]
  21. Forti, J.C.; Loretti, G.H.; Tadayozzi, Y.S.; de Andrade, A.R. A phytotoxicity assessment of the efficiency 2,4-D degradation by different oxidative processes. J. Environ. Manag. 2020, 266, 110588. [Google Scholar] [CrossRef]
  22. Tadayozzi, Y.S.; Santos, F.A.D.; Vicente, E.F.; Forti, J.C. Application of oxidative process to degrade paraquat present in the commercial herbicide. J. Environ. Sci. Health Part B 2021, 56, 670–674. [Google Scholar] [CrossRef]
  23. Silva, V.E.; Tadayozzi, Y.S.; Putti, F.F.; Santos, F.A.; Forti, J.C. Degradation of commercial glyphosate-based herbicide via advanced oxidative processes in aqueous media and phytotoxicity evaluation using maize seeds. Sci. Total Environ. 2022, 840, 156656. [Google Scholar] [CrossRef]
  24. United Nations Brazil. UN The Sustainable Development Goals in Brazil. 2024. Available online: https://brasil.un.org/pt-br/sdgs (accessed on 2 February 2025).
  25. D1252-06R20; Standard Test Methods for Chemical Oxygen Demand (Dichromate Oxygen Demand) of Water. American Society for Testing and Materials (ASTM): Philadelphia, PA, USA, 1995. Available online: https://www.astm.org/Standards/D1252.htm (accessed on 11 May 2025).
  26. Lipps, W.C.; Baxter, T.E.; Braun-Howland, E. (Eds.) Standard Methods For the Examination of Water and Wastewater; APHA Press: Washington, DC, USA, 1995. [Google Scholar]
  27. ISO 15705:2002; Water Quality—Determination of the Chemical Oxygen Demand Index (ST-COD)—Small-Scale Sealed-Tube Method. International Organization for Standardization: Geneva, Switzerland, 2002.
  28. O’Dell, J.W. (Ed.) Method 410.4: The Determination of Chemical Oxygen Demand by Semi-Automated Colorimetry; Revision 2.0; Environmental Monitoring Systems Laboratory, Office of Research and Development, US Environmental Protection Agency: Cincinnati, OH, USA, 1993. [Google Scholar]
  29. CONAMA, Resolution 357. Council National Environment Agency. Brazil 2005. Available online: https://conama.mma.gov.br/?option=com_sisconama&task=arquivo.download&id=450 (accessed on 23 May 2025).
  30. CONAMA, Resolution 430. Council National Environment Agency. Brazil 2011. Available online: https://www.saude.mg.gov.br/index.php?option=com_gmg&controller=document&id=13281-resolucao-no-430-de-13-de-maio-de-2011?layout=print#:~:text=Disp%C3%B5e%20sobre%20as%20condi%C3%A7%C3%B5es%20e,Nacional%20do%20Meio%20Ambiente%2DCONAMA (accessed on 11 May 2025).
  31. Environmental Company of the State of São Paulo (CETESB). Appendix D—Environmental and Sanitary Significance of Quality Variables; CETESB: São Paulo, Brazil, 2014. Available online: https://cetesb.sp.gov.br/aguas-interiores/publicacoes-e-relatorios/ (accessed on 12 May 2025).
  32. Davies, F.D.; Stulp, S. Determination of methane gas (CH4) generated in effluent treatment plant, with evaluation of calorific power for boiler burning. Rev. Destaques Acadêmicos 2016, 8, 4. [Google Scholar] [CrossRef]
  33. Ruiz, G.S.; Tannuri, S.T.; Mauad, C.R.; Vendramel, M.R.; Veneu, D.M. Evaluation of COD, nitrogen and phosphorus removal efficiency in the co-treatment of sewage with leachate in an activated sludge system. Holos Environ. 2022, 22, 1–17. [Google Scholar] [CrossRef]
  34. Companhia de Saneamento Básico do Estado de São Paulo (SABESP). Non-Domestic Sewers Reported 03/19; Government of the State of São Paulo: São Paulo, Brazil, 2019. Available online: https://www.sabesp.com.br/site/interna/Default.aspx?secaoId=586 (accessed on 12 May 2025).
  35. São Paulo (State), Decree no. 8468/76. It Approves the Regulation of Law No. 997 of May 31, 1976, Which Provides for the Prevention and Control of Environmental Pollution. Government of the State of São Paulo: São Paulo, Brazil, 1976. Available online: https://www.cetesb.sp.gov.br/Institucional/documentos/Dec8468.pdf (accessed on 12 May 2025).
  36. Derisio, J.C. Introdução ao Controle de Poluição Ambiental, 5th ed.; Oficina de Textos: São Paulo, Brazil, 2017; Available online: https://books.google.com.br/books?hl=pt-BR&lr=&id=dw-PDAAAQBAJ&oi=fnd&pg=PP9&dq=Introdu%C3%A7%C3%A3o+ao+controle+de+polui%C3%A7%C3%A3o+ambiental.+&ots=sm65TkC2po&sig=4r4bNF-Os6l9d3VsPFX_nHYIZ3c&redir_esc=y#v=onepage&q&f=false (accessed on 5 June 2025).
  37. PROSAB Basic Sanitation Research Program. Reuse of Sewage, Including the Development of Treatment Technologies for this Purpose; Brazilian Association of Sanitary and Environmental Engineering: Rio de Janeiro, Brazil, 2006; p. 427. Available online: http://www.finep.gov.br/images/apoio-e-financiamento/historico-de-programas/prosab/Esgoto-Prosab_-_final.pdf (accessed on 5 June 2025).
  38. Moreira, F.C.; Boaventura, R.A.R.; Brillas, E.; Villar, V.J.P. Degradation of trimethoprim antibiotic by UVA photoelectro-Fenton process mediated by Fe(III)–carboxylate complexes. Appl. Catal. B Environ. 2015, 162, 34–44. [Google Scholar] [CrossRef]
  39. Lee, Y.; Lee, C.; Yoon, J. High temperature dependence of 2,4-dichlorophenoxyacetic acid degradation by Fe3+/H2O2 system. Chemosphere 2003, 51, 963–971. [Google Scholar] [CrossRef] [PubMed]
  40. Ziembowicz, S.; Kida, M. Limitations and future directions of application of the Fenton-like process in micropollutants degradation in water and wastewater treatment: A critical review. Chemosphere 2022, 296, 134041. [Google Scholar] [CrossRef]
  41. Duesterberg, C.K.; Mylon, S.E.; Waite, T.D. pH Effects on Iron-Catalyzed Oxidation using Fenton’s reagent. Environ. Sci. Technol. 2008, 42, 8522–8527. [Google Scholar] [CrossRef]
  42. Pliego, G.; Zazo, J.A.; Garcia-Muñoz, P.; Munoz, M.; Casas, J.A.; Rodriguez, J.J. Trends in the Intensification of the Fenton Process for Wastewater Treatment: An Overview. Crit. Rev. Environ. Sci. Technol. 2015, 45, 2611–2692. [Google Scholar] [CrossRef]
  43. Gama, M.R. Processos fenton como alternativa na remoção de interferentes endócrinos e outros micropoluentes ambientais. Rev. Virtual Química 2012, 4, 777–787. [Google Scholar] [CrossRef]
  44. Santos, M.S.F.; Alves, A.; Madeira, L.M. Paraquat removal from water by oxidation with Fenton’s reagent. Chem. Eng. J. 2011, 175, 279–290. [Google Scholar] [CrossRef]
  45. Lucena, L.G.; Rocha, E.M. Solar photo-Fenton process for the treatment of landfill leachate. Rev. DAE 2015, 49–63. Available online: https://www.revistadae.com.br/artigos/artigo_edicao_200_n_1614.pdf (accessed on 12 June 2025). [CrossRef]
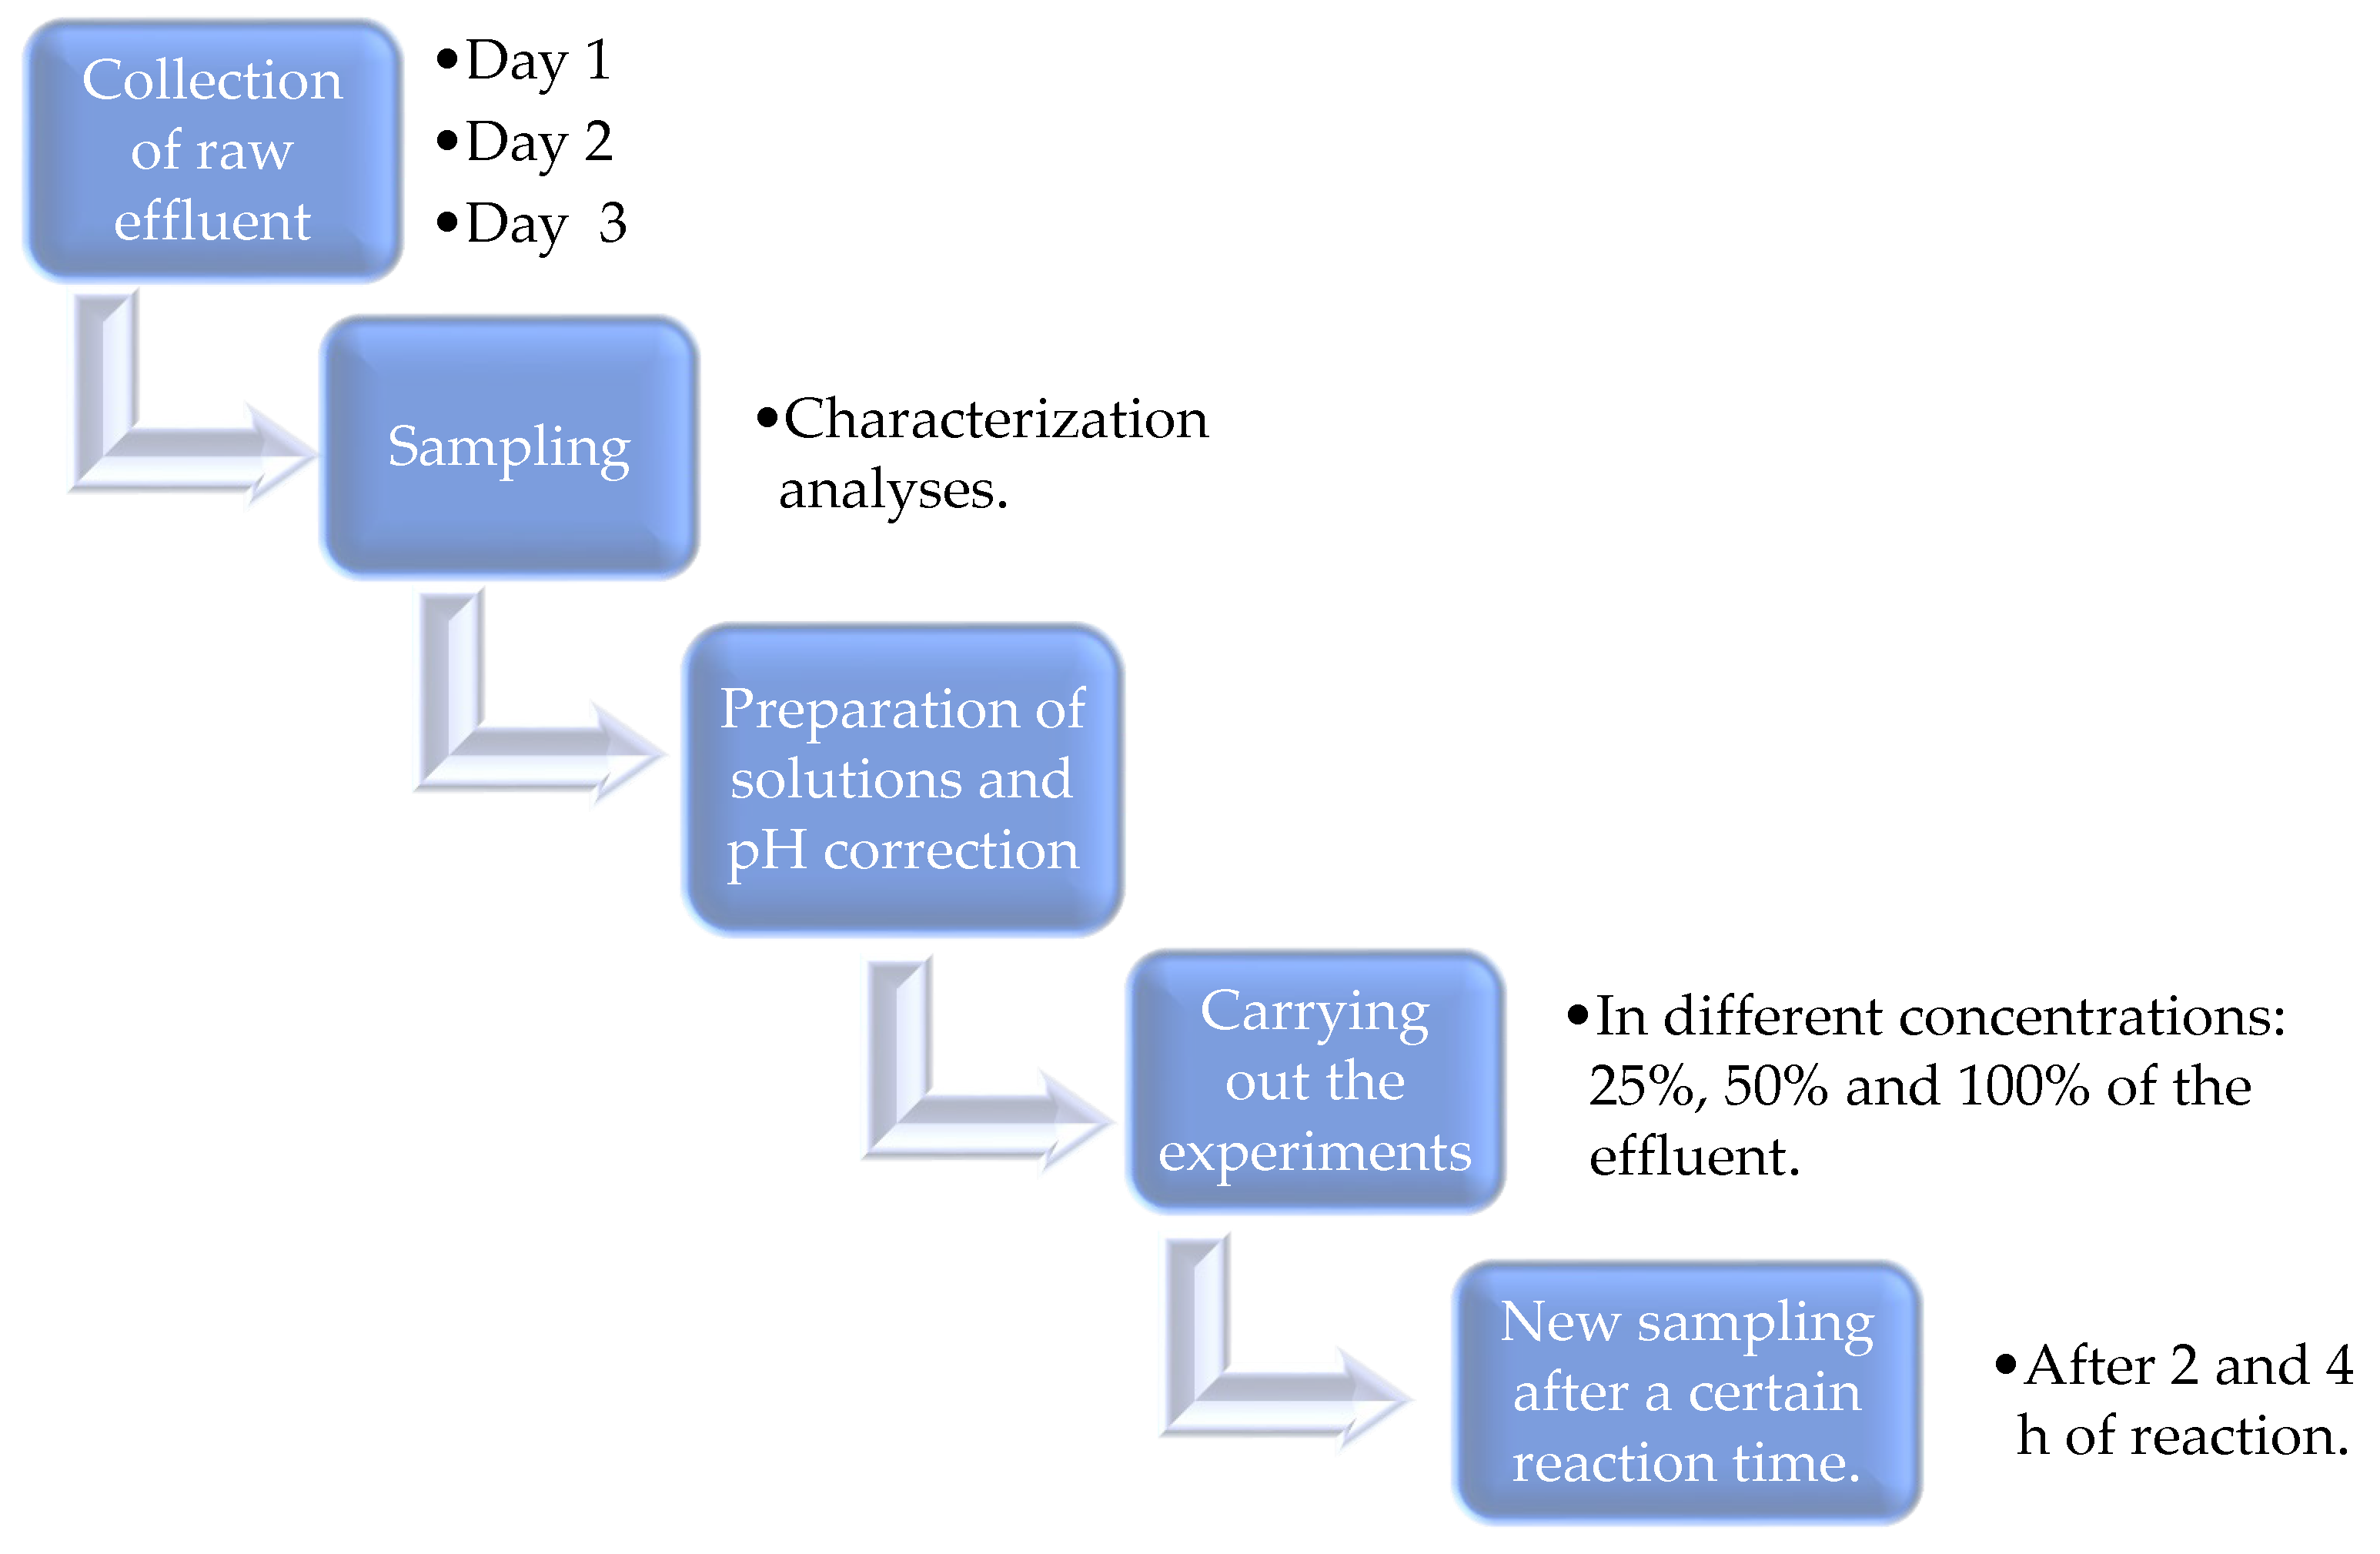
Scheme 1. Flowchart of Steps taken.
Suschem 06 00032 sch001
Figure 1. Physicochemical analysis after 2 h of Fenton reagent application.
Suschem 06 00032 g001
Figure 2. Physicochemical analysis after 4 h of Fenton reagent application.
Suschem 06 00032 g002
Figure 3. COD removal vs. Fenton Time (Day 1 Effluent).
Suschem 06 00032 g003
Figure 4. COD removal vs. Fenton Time (Day 2 Effluent).
Suschem 06 00032 g004
Figure 5. COD removal vs. Fenton Time (Day 3 Effluent).
Suschem 06 00032 g005
Table 1. Concentrations of raw effluent and Fenton reagents analyzed.
IdentificationDescriptionConcentration of Raw Effluent
F160 mL of distilled water25%
20 mL of raw effluent
600 µL of iron sulfate solution at 8.3 g L−1
31 µL of 29% hydrogen peroxide
F240 mL distilled water50%
40 mL of raw effluent
600 µL of iron sulfate solution at 8.3 g L−1
31 µL of 29% hydrogen peroxide
F380 mL of raw effluent100%
600 µL of iron sulfate solution at 8.3 g L−1
31 µL of 29% hydrogen peroxide
Table 2. Physicochemical analysis of the raw effluent collected on different days.
ParameterDAY 1DAY 2DAY 3
pH50 ± 0.06.5 ± 0.05.4 ± 0.0
COD (mg L−1)22,223.3 ± 1377.445,280.0 ± 2343.31534.0± 17.7
T (°C)32.8 ± 0.029.4 ± 0.027.5 ± 0.0
DO (mg L−1)2.6 ± 0.04.3 ± 0.04.6 ± 0.0
TDS (mg L−1)333.3 ± 1.51393.0 ± 5.7241.6 ± 0.5
EC (µs cm−1)499.3 ± 3.52086.6 ± 11.5362.3 ± 0.5
°Bx1.1 ± 0.01.2 ± 0.00.0 ± 0.0
Disclaimer/Publisher’s Note: The statements, opinions and data contained in all publications are solely those of the individual author(s) and contributor(s) and not of MDPI and/or the editor(s). MDPI and/or the editor(s) disclaim responsibility for any injury to people or property resulting from any ideas, methods, instructions or products referred to in the content.