Article

Novel, Simple, and Environmentally Friendly Methodology for the Determination of Urinary Iodide by Colorimetry Based on Silver Nanoplates

by
Irina Tamara Ortiz
1,2,†,
Maia Balod
2,†,
Pablo Edmundo Antezana
3,
Gisel Nadin Ortiz
2,
Martin Federico Desimone
3,
Carlos Gamarra-Luques
1,2,4,
Jorgelina Cecilia Altamirano
2,5 and
María Belén Hapon
1,2,*
1
Instituto de Medicina y Biología Experimental de Cuyo (IMBECU), Universidad Nacional de Cuyo, CCT Mendoza CONICET, Ruiz Leal s/n, Mendoza 5500, Argentina
2
Facultad de Ciencias Exactas y Naturales, Universidad Nacional de Cuyo (UNCuyo), Mendoza 5500, Argentina
3
Consejo Nacional de Investigaciones Científicas y Técnicas (CONICET), Instituto de la Química y Metabolismo del Fármaco (IQUIMEFA), Facultad de Farmacia y Bioquímica, Universidad de Buenos Aires, Buenos Aires 1113, Argentina
4
Facultad de Ciencias Médicas, Universidad Nacional de Cuyo (UNCuyo), Mendoza 5500, Argentina
5
Instituto Argentino de Nivología, Glaciología y Ciencias Ambientales (IANIGLA), (CONICET, UNCuyo and Mendoza’s Government), P.O. Box 331, Mendoza 5500, Argentina
*
Author to whom correspondence should be addressed.
These authors contributed equally to this work.
Sustain. Chem. 2025, 6(3), 29; https://doi.org/10.3390/suschem6030029
Submission received: 7 July 2025 / Revised: 9 September 2025 / Accepted: 10 September 2025 / Published: 18 September 2025

Abstract

Iodine is an essential element for the synthesis of thyroid hormones. Iodine deficiency leads to a range of health consequences known as iodine deficiency disorders. To assess the iodine nutritional status of a population, urinary iodine (UI) is typically measured. This work introduces a novel and simple analytical method for determining UI using silver triangular nanoplates (AgTNPs) after interfering substances are removed via solid-phase extraction (SPE). The AgTNPs were synthesized and characterized using Transmission Electron Microscopy, UV–vis spectroscopy, and zeta potential measurements. The limit of detection of iodide of the AgTNPs assessed spectrophotometrically was 35.78 µg I/L. However, urine samples interfered with the colorimetric reaction. Thus, an SPE methodology was developed and optimized to eliminate urine interferents that hinder AgTNP performance. A logistic regression analysis was conducted to validate the combined application of SPE and AgTNPs for the qualitative determination of UI. This work demonstrated that the developed SPE methodology eliminates these interferents and extracts iodide from the sample, allowing the accurate determination of UI using AgTNPs. This reliable sample preparation method was then used on actual human urine samples to accurately identify UI deficiency levels. The proposed methodology offers an effective and environmentally friendly approach for monitoring iodine status, without requiring highly complex equipment.

1. Introduction

Iodine is an essential microelement for the synthesis of thyroid hormones. Thus, decreased levels of iodine intake lead to a deficiency of thyroid hormones in the blood, with the deleterious effects collectively known as “iodine deficiency disorders” (IDDs) [1]. Iodine is one of the constituent elements of thyroxine or T4 and, therefore, is essential to prevent goiter. It is not produced in the human body, and its intake from the diet is required. The recommended daily iodine intake is 90 µg for infants ≤ 5 years old, 120 µg for children 6–12 years old, and 150 µg for adolescents and adults [2]. For pregnant and lactating women, a 250 μg daily iodine intake is suggested. Requirements increase in pregnancy due to a 50% rise in the synthesis of thyroid hormones, the transfer of iodine to the fetus, and increased renal clearance [2]. Iodine requirements also increase during lactation due to the secretion of iodine into breast milk, which is crucial for the infant’s nutrition [3]. Iodine deficiency leads to adverse health effects at all stages of life due to inadequate thyroid hormone synthesis. IDDs encompass a wide spectrum of diseases, including goiter, hypothyroidism, cretinism, and adverse obstetric outcomes [1]. Fetal brain damage and impaired cognitive development caused by IDDs during pregnancy have led to the global loss of millions of intelligence quotient (IQ) points every year [4].
Approximately 90% of ingested iodine is excreted in the urine. Therefore, the iodine consumption of a population is measured through the level of urinary iodine excretion (UI). UI is an indirect index of the level of thyroid hormones in humans since their synthesis depends on iodine reserves. A healthy level of UI is considered to be 100 µg/L for the general population and 150 µg/L for pregnant and lactating women. Iodine-deficient populations are those with UI values less than 100 µg/L [5].
The analytical methodology recommended by the World Health Organization for determining UI is based on the Sandell–Kolthoff colorimetric reaction [4]. Other instrumental methodologies, such as inductively coupled plasma mass spectrometry (ICP-MS), were also reported. ICP-MS is considered the most sensitive and selective instrumental methodology for determining UI [6,7,8,9]. Although the determination is fast, it requires an exhaustive digestion of the sample, which may lead to the loss of the iodine species. Additionally, it is costly to implement and operate. For this reason, the most used analytical methodology for determining UI concentration is based on the Sandell–Kolthoff reaction [10]. The Sandell–Kolthoff reaction is based on the catalytic ability of iodide (I) to accelerate the reduction of the yellow cerium (IV) ion to the colorless cerium (III) ion by arsenite (As3+) in an acidic medium. The rate of decolorization of the solution is directly proportional to the iodide concentration in the sample. Urine contains organic compounds that can interfere with the iodide catalytic reaction; therefore, a digestion step is required to remove these interferences and convert all forms of iodine present in urine to iodide before the analysis [11]. Digestion with HClO4 was traditionally considered the “gold standard” for its effectiveness in eliminating interferences. However, it requires safety precautions due to the oxidizing and potentially explosive nature of concentrated perchloric acid at high temperatures [12]. Ammonium persulfate digestion is considered safer and easier to perform than perchloric acid digestion, and studies have shown a good correlation between the two methods [11]. Therefore, the digestion methodology based on ammonium persulfate became the method of choice in many laboratories. The disadvantages of the Sandell–Kolthoff reaction include the use of environmentally harmful reagents, the risk to the analyst, and the time-consuming methodological processing of each sample. Thus, there is a need for a more environmentally friendly, cost-effective, and easy-to-implement analytical methodology. Furthermore, iodine detection for the purpose of establishing control and prevention programs is not used continuously, due to the complexity and cost of using it for field population monitoring in developing countries [13]. On the other hand, the population is becoming more aware of their health, which is why new diagnostic tools that are simple, effective, and allow for rapid testing have gained relevance. In this regard, the World Health Organization first described the acronym ASSURED to promote new tools that must be low-cost, sensitive, specific, easy to use, rapid, and robust, without the need for additional equipment, and potentially useful for the public [14]. In this scenario, new diagnostic methods could be effective, as they can be applied by non-specialized personnel without the need for equipment requiring an external power source and with the use of low amounts of reagents and samples, unlike traditional methods.
Simple and convenient technologies for determining chemical and biological species are of great significance in environmental monitoring, public health, and disease diagnosis [15,16]. Recently, colorimetric sensors have attracted more attention for reducing experimental costs, simplifying the detection process, and allowing monitoring with the naked eye without sophisticated instrumentation [17,18]. Metal nanomaterials such as silver nanoparticles (AgNPs) have wide application in analytical purposes due to their unique optical and electrical properties [19]. The collective oscillations of conducting electrons under the excitation of a light beam, known as surface plasmon resonance (SPR), depend on the size, shape, and dielectric environment of the nanoparticles. AgNPs have bright colors in the visible spectral range due to their SPR absorption and light scattering; thus, the applications of AgNPs in the SPR spectroscopy field, colorimetric detection, and scattering detection have been stimulated in recent years [19]. Silver triangular nanoplates (AgTNPs) have attracted considerable interest in recent years since the wavelength of the in-plane dipole SPR band can be easily shifted from the visible to near-infrared spectrum by adjusting the aspect ratios and two-dimensional geometries. Furthermore, AgTNPs have a large potential for many applications because they can easily be synthesized by many routes, including photochemical and thermal synthesis, with a high yield and great throughput [20]. Metallic nanoparticles, typically (like gold or silver), exhibit localized surface plasmon resonance (LSPR) and are designed for sensing, imaging, or other probing applications. Thus, due to the specific shape (sharp “tips”) of AgTNPs, they are considered fine plasmonic probes, a nanoscale device that enhances optical signals based on plasmonic principles with specific optical and chemical properties, which can be etched by other molecules, metals, and ions, making them useful for stable and sensitive colorimetric methods [21].
There are reports that evidence the interaction of inorganic anions, such as I, Br, Cl, H2PO4, and SCN with AgTNPs. This interaction can shift the SPR band, thereby changing the color of the sample [22]. The interaction between AgTNPs and iodide has been studied in aqueous solutions and seaweeds [22]. This interaction provokes changes on the surface of AgTNPs, resulting in a color change in the aqueous samples from violet to yellow. Additional studies are relying on the same basis, such as the use of chitosan oligosaccharide lactate-capped silver nanoparticles (COL-AgNPs) to determine iodide in water, urine, serum, and algae samples, and the use of AgNPs synthesized from green tea (tea-capped AgNPs) to determine iodide in water and urine samples [23,24]. However, these studies did not report these methodologies for the detection of real human urine samples, but rather for the detection of urine samples spiked with iodide.
Considering the evidence developed to date on the use on silver nanoparticles and the limitations of detection using real urine samples, this work is of interest due to its biochemical application, focusing on a determination method of iodide in real urine samples for monitoring iodine sufficiency which is easy to use, does not require sophisticated laboratory instruments, stays within a limited budget, and is environmentally friendly. Due to the complexity of the biological samples and the non-specificity of the AgTNPs and various ion interactions, there is an evident need to include a sample preparation methodology for eliminating interferences and enhancing the specificity and sensitivity of the whole analytical methodology. In this sense, a solid-phase extraction (SPE) methodology, based on the absorption of iodide on activated charcoal, should be optimized and implemented prior to the AgTNP reaction and further determination [25]. Analytical figures of merit for the resulting methodology should be estimated, and the results obtained should be compared with those of the reference methodology based on the Sandell–Kolthoff reaction for its further application to UI determination in real samples.
In relation to the mentioned precedents, this work aims to develop a simple, economical, and eco-friendly diagnostic technique to monitor UI sufficiency using AgTNPs after solid phase extraction.

2. Materials and Methods

2.1. Instruments

The spectra of the AgTNPs, with or without the addition of iodide, were obtained using a Shimadzu UV-1800 spectrophotometer (Kioto, Japan) with a quartz cuvette of 1500 µL, from 300 nm to 900 nm. The vis spectrophotometry of the AgTNPs and Sandell–Kolthoff reactions were conducted using a MultiskanEX microplate reader from Thermofisher Scientific, Waltham, MA, USA, with a polypropylene 96-well plate with 350 µL wells. A Zeiss EM109T transmission electron microscope, Carl Zeiss GA, Oberkochen, Germany, equipped with an ES1000W Gatan digital camera, Gatan, Inc., Pleasanton, CA, USA, was used to evaluate the features of the AgTNPs. Their zeta potential (ζ) was determined through Dynamic Light Scattering in a DLS Litesizer 500, Anton Paar GmbH, Graz, Austria.

2.2. Reagents and Solutions

Silver nitrate (AgNO3, 0.1 N), sodium borohydride (NaBH4 > 98%), and sodium phosphate monobasic anhydrous (NaH2PO4, 99%) from Biopack (Buenos Aires, Argentina). Hydrogen peroxide (H2O2 30 wt.%) and potassium iodate (KIO3, 99%) from Cicarelli (Santa Fe, Argentina). Sodium citrate dihydrate (C6H5Na3O7, 99%), sodium hydroxide (NaOH, 99%), potassium iodide (KI, 99%), activated carbon (99%), dextran (99%), glucose (99%), ascorbic acid (99%), potassium bromide (KBr, 99%), uric acid (C5H4N4O3, 99%), oxalic acid (HO2CCO2H, 98%), and sodium fluoride (NaF, 99%) from Sigma-Aldrich (St. Louis, MO, USA). Ammonium persulfate [(NH4)2S2O8, 99%], arsenic trioxide (As2O3, 99%), ceric ammonium sulfate [Ce(NH4)4 (SO4)4∙2H2O, 99%], and sodium chloride (NaCl, 99%) from Anedra (Buenos Aires, Argentina). Creatinine (99%) from Fluka (Buchs, Switzerland). Urea (CH4N2O, 99%) from MERCK (Darmstadt, Germany). Albumin standard from Thermo Fisher (Rockford, IL, USA). Ultrapure water (18.25 MƱ) was used throughout the experiments.
For detailed information about the solutions used throughout this work, see the Supplementary Information SS1.

2.3. Sandell–Kolthoff Determination

Iodide from aqueous solutions and urine samples was determined using the Sandell–Kolthoff reaction [26]. Briefly, 200 µL of ammonium persulfate (APS) 1 M and 50 µL of iodide standard or urine sample were added to a 0.5 mL Eppendorf tube. After mixing, it was digested at 94 °C for 1 h on a heating block. After that, the digested sample was allowed to cool down to room temperature. Then, on a 96-well microplate, 100 µL of a 3.3 mM arsenious solution was added to each well, along with 50 µL of the digested sample, and the plate was shaken vigorously by hand. Finally, 50 µL ammonium cerium sulfate 0.0019 M was added and agitated on a rocking shaker for 30 min in the dark. The reaction was read in a microplate reader at 405 nm.

2.4. Standards and Sample Preparation

Iodide working standard preparation: The working standard was obtained by diluting an IK solution (1000 µg I/L) with ultrapure water. The standard calibrator range was from 0 to 1000 µg I/L.
Charcoal-stripped urine: A urine pool from human volunteers was processed to remove small ions and molecules such as iodide, to create a standard curve of iodide in a urine matrix, by the addition of known concentrations of iodide. First, activated carbon was prepared, dissolving 0.25 g of carbon and 0.025 g of dextran in ultrapure water to a final volume of 50 mL and stirring for 30 min in an ice bath. After that, the solution was centrifuged for 30 min at 3000 rpm, and the supernatant was discarded. Then, 50 mL of urine was added to the charcoal and left under agitation overnight at 4 °C. Finally, the solution was centrifuged for 30 min at 3000 rpm, and the urine was separated into a clean sterile tube. The concentration of iodide after charcoal treatment was measured using the Sandell–Kolthoff method and resulted in undetectable measurements.
Urine working standard: The working iodide standard in urine was obtained by diluting an IK solution (1 g/L) with charcoal-stripped urine. The standard calibrator range was from 0 to 1000 µg I/L.
Urine quality control (urine QC): Urine samples from 200 patients were collected randomly and separated into three different pools of low (40–70 µg I/L), medium (90–110 µg I/L), and high (>130 µg I/L) concentration.
Human urine samples: The collection of urine samples from female volunteers received approval from the Health Investigation Ethics Committee FCM-UNCuyo EXP_E-CUY:0000981/2022, and informed consent was obtained from all participants.

2.5. Synthesis and Characterization of AgTNPs

The synthesis of AgTNPs was based on the method described by Yang and Ling [22] with some modifications. Briefly, in a 25 mL volumetric flask, 5 mL AgNO3 0.1 mM, 300 μL C6H5Na3O7 30 mM, and 40 µL H2O2 wt.30% were added and further vigorously shaken by hand. Then, 25 µL of 100 mM NaBH4 was added and vigorously shaken until the color changed from yellow to blue–violet, indicating nanoparticle formation.
All glassware equipment was washed previously using HNO3 (10%), followed by six rinsing steps with ultrapure water. The synthesized AgTNPs were characterized using UV–vis spectrophotometry (300–900 nm), ζ potential measurements, and TEM. For these characterizations, 150 µL of AgTNPs was diluted with 900 µL of ultrapure water. The morphology and size of the synthesized AgTNPs were analyzed using Transmission Electron Microscopy (TEM) using a Zeiss EM109T electron microscope. Samples were prepared by placing a small droplet onto carbon-coated copper grids, then left to air-dry for a few minutes. The ζ potential measurements were collected using a Litesizer 500.

2.6. Characterization of AgTNP Behavior with Iodide Standards

A 50 µL aliquot of synthesized AgTNPs was added to 300 µL KI standards with concentrations ranging from 0 to 1000 µg I/L. The procedure was carried out in triplicate on a microplate, and the critical point of color change and quantification limit was colorimetrically determined with a microplate reader. To complete the characterization of the AgTNPs, 900 µL of water or a KI aqueous solution was added to 150 µL of the synthesized AgNTPs of 200 µg I/L and 75 µg I/L, respectively, and they were left to stand for 60 min. The resulting solution was analyzed using a UV–vis spectrometer to verify the wavelength shift due to the transformation of the nanoparticles. For such a purpose, the spectra achieved for the AgTNPs in Section 2.5 were compared against those achieved by the addition of iodide. TEM analysis was carried out to estimate the size and morphology of the AgTNPs. An aliquot of 14 µL AgTNPs was added to 86 µL KI of 0.75 and 200 µg I/L, respectively. After 60 min, these samples were observed using the TEM. The diameter of the AgTNPs was determined using ImageJ tools 2.9.0 [27], and the size distribution for each sample was calculated. The samples for DLS were prepared using the same procedure, and 100 measurements were averaged for the ζ potential.

2.7. Urine Interferent Assays

The assay was carried out on a 96-well plate, where 50 µL aliquots of the synthesized AgTNPs were loaded into each well and 300 µL of charcoal-stripped urine spiked with 300, 200, 150, 100, 75, 37.5, and 25 µg I/L or 300 µL of an aqueous solution of interferences at the maximum concentration that could be found in urine. The interferents tested were urea (42 g/L), creatinine (1176 mg/L), uric acid (872 mg/L), chloride (6 g/L), phosphate (2.08 g/L), ammonium sulfate (470 mg/L), albumin (70 mg/L), ascorbic acid, (84 mg/L), glucose (400 mg/L), oxalates (40 mg/L), citrate (1.92 mg/L), bromide (7 mg/L), and fluoride (2.13 mg/L) [28,29,30,31,32,33].

2.8. SPE Sample Preparation Optimization

An SPE sample preparation methodology was implemented with some modifications [25]. The objective was to eliminate urine interferences before the reaction of iodide with AgTNPs, using a practical and functional setup using a pipette tip with a filter as a column and activated carbon as the solid phase. The general experimental procedure is described as follows: A 900 µL aliquot of iodide aqueous solution or urine sample was loaded onto an activated charcoal column without drainage and allowed to equilibrate. After the equilibration period, the sample was drained, and the charcoal column was rinsed with 900 µL of ultrapure water at atmospheric pressure. This eluate was discharged, and the column was allowed to drain until it was empty and dry. Then, the column was loaded with 900 µL of NaOH solution without drainage and allowed to equilibrate. After the equilibration period, iodide was eluted and determined in duplicate by the Sandell–Kolthoff reaction.
The optimization of the experimental parameters was performed by a full factorial design of experiment (DoE) method, followed by a surface response analysis (RSM) using Design Expert Software version 12.0.12.0. The factorial design was carried out based on four variables at 5 levels. The four variables included (A) activated charcoal solution volume, (B) time of absorption after the column was loaded, (C) eluent’s pH, (D) equilibration time. The levels of the variables were low (−1), medium (0), high (+1), and minimum and maximum as axial points ± α (α = 1.41) (Supplementary Materials SS2). The design resulted in 28 different experiments of SPE with 4 center points and 2 axial points each. The experiments were run in a randomized order to reduce bias due to uncontrolled factors. The recovered iodide was chosen as the analytical response. The effect of each variable on recovery and modeling was determined using a response surface methodology. The validation of the SPE protocol obtained by the model was performed four times using aqueous solutions of 200 µg I/L to confirm the recovery. The optimized SPE procedure was used to be further evaluated using different patient urine samples. The charcoal-stripped urine samples were spiked with different concentration levels of iodide before SPE clean-up. The recovered iodide was determined using the Sandell–Kolthoff reaction (Supplementary Materials SS3).

2.9. Statistics

Design Expert Software v 12.0.12.0 Stat-Ease, Inc., Minneapolis, MN, USA was used for the experimental design. Prism 7 GraphPad software, Inc., La Jolla, CA, USA and Microsoft Excel were used for the statistical calculation. In the experimental design, the statistical significance of the variables was analyzed using Fisher’s statistical test for ANOVA in the predicted model, and only variables that resulted in a significant difference in the analytical response were included in the model. The model significance was evaluated using the lack-of-fit test. The model was considered acceptable when a non-significant difference in the variance was observed compared with pure error variance. To analyze the AgTNPs limit of detection (LOD) for iodide, a method was developed using Microsoft Excel. To determine Pearson’s correlation between iodide concentration and AgTNPs SPR response, ANOVA and Dunnett’s post hoc comparison test of the effect of interference on AgTNPs SPR response, a linear regression analysis of the iodide standard and urine spikes with iodide, regression comparison, and a bias plot of Sandell–Kolthoff and AgTNP response to iodide were calculated using Graph Pad Prism.
An R script Shiny package web-based application called LogRegLOD (https://garridobrunoc.shinyapps.io/LogRegLOD/), accessed on 22 April 2025, was used for the logistic regression of the qualitative analysis of UI from patient samples [34].

3. Results and Discussion

3.1. Characterization of AgTNPs After Their Modification by Iodide

UV–visible spectroscopy is a selective and efficient technique that can be used to reveal the formation of AgTNPs and their modification when they are in contact with iodide. The spectroscopic absorption at a specific wavelength allows the identification of each compound. As can be observed in Figure 1, the AgTNPs show maximum absorption at a wavelength of 707 nm. When iodide was added to the AgTNP solution, the absorption wavelength maximum shifted to a band centered at 630 nm and at 486 nm when 75 µg I/L or 200 µg I/L was added, respectively (Figure 1A).
The AgTNPs’ SPR decreases when increasing concentrations of iodide are added to the AgTNP solution. At the same time, the color of the AgTNP solution changed from blue–violet to pink and finally to yellow. Thus, it can be inferred that the absorption spectral shift is a manifestation of the transformation of AgTNPs when iodide is added. High-resolution TEM images show that AgTNPs reshape, from triangles (54.49 ± 7.95 nm) to spherical (30.06 ± 6.95 nm) and finally fused nanoparticles (17.90 ± 4.20 nm), when increasing concentrations of iodide were added. The change in AgTNP morphology matches the color variations: blue–violet (0 µg I/L), pink (75 µg I/L), and yellow (200 µg I/L) (Figure 1B). Additionally, a decrease in the magnitude of the ζ potential (media ± SD) matches with different concentrations of iodide: 0 µg I/L, 75 µg I/L, and 200 µg I/L that led to ζ potentials of −0.446 ± 0.3, −2.748 ± 0.4, and 0.003 ± 0.003 mV, respectively. These results indicate that, when iodide concentration is at the maximum, nanoparticle aggregation is allowed. This agrees with the results of other authors using comparable AgTNPs, who demonstrated that this change in shape and SPR is due to the adsorption of iodide to their surface [22]. Although the ζ potential is close to 0, the stability of the SPR band is stable for at least 1 month from synthesis, and when the AgTNPs are exposed to iodide, the reaction is stable for 48 h (Supplementary Materials SS4). This interaction causes morphological transformations of the AgTNPs due to the selective adsorption of certain anions, such as iodide, on the most energetic faces of the prism, which induces changes in surface tension and favors the transition to spherical shapes. Nanoprisms feature sharp corners and have a high density of silver atoms on the surface, which makes them energetically unstable. When anions such as halides make contact with the surface of these nanoparticles, they tend to be absorbed into higher-energy faces, such as corners and edges, where the density of the atoms is higher. The adsorption of anions alters the surface tension of the AgTNPs, decreasing the energy in specific areas, allowing the structure to reorganize and favor a more stable shape, such as a disk. This process involves the movement of silver atoms from the high-energy areas to the low-energy areas, resulting in the flattening of the prism. This change in the surface energy of the nanoparticles, combined with the formation of complexes with anions, can cause the nanoparticles to eventually fuse at high concentrations, generating large clusters of nanoparticles [35].
With respect to the AgTNP stability, it is known that the ζ potential is lower in those particles that are more unstable due to their energetic characteristics. In the case of nanoparticles, when they are in their triangular form, as mentioned above, they have a high density of silver atoms on the surface, which makes them energetically unstable, which favors the transition to spherical shapes by decreasing the energy in specific areas and making these nanoparticles more stable, which is evidenced by an increase in the ζ potential. Finally, when there is an excess of iodide, complexes begin to form with silver, which again causes instability in the nanoparticles, causing their aggregation and consequently a decrease in the ζ potential [35].

3.2. Limit of Detection of the Colorimetric Methodology

To evaluate the possible use of AgTNPs for iodide monitoring at the population level, and considering that the adequate level of UI in adults according to the WHO is equal to or greater than 100 µg I/L, the color change in the nanoparticles was determined using different standard solutions of iodide at concentrations within the range expected in urine [4]. When the curve is analyzed spectrophotometrically at 620 nm, it exhibits a negative slope, whereas at 405 nm, the slope is positive (Supplementary Materials SS5). When the 620 nm/405 nm ratio is analyzed, it represents the modification process of AgTNPs as they interact with increasing concentrations of iodide (Figure 2). This result can be confirmed by the UV–vis spectra, which show that the SPR of AgTNPs decreases as the iodide concentration increases in the AgTNP solution (Supplementary Materials SS5).
From 100 µg I/L, the AgTNPs are fused, and the absorbance ratio at 620 nm/405 nm remains constant. This indicates that 100 µg I/L is the precise concentration at which AgTNPs are completely transformed. The results show that there is a notable change in the color of the AgTNPs at 100 µg I/L, showing a yellow color from this concentration. In addition, the limit of detection (LOD) was calculated from triplicates of 620 nm/405 nm ratio values using a standard range of 0, 6.25, 9.37, 12.5, 18.75, 25, 37.5, 50, 75, 100, and 125 μg I/L. The LOD was estimated according to the formula proposed by Olivieri et al. which determined that the lowest concentration of iodide that can be detected spectrophotometrically by AgTNPs at a 95% level of confidence (α = β = 0.05) is 35.78 µg I/L (Supplementary Materials SS6) [36]. Nevertheless, the lowest concentration of iodide that can be differentiated with the naked eye is 50 µg I/L. Altogether, the proposed methodology would allow for the determination of population iodine sufficiency (≥100 µg I/L) or the discrimination between mild (50–99 µg/L) versus moderate and severe (<50 µg/L) deficiency in adults (Figure 2) [4].

3.3. Effect of Charcoal-Stripped Urine Spikes with Iodide on AgTNPs

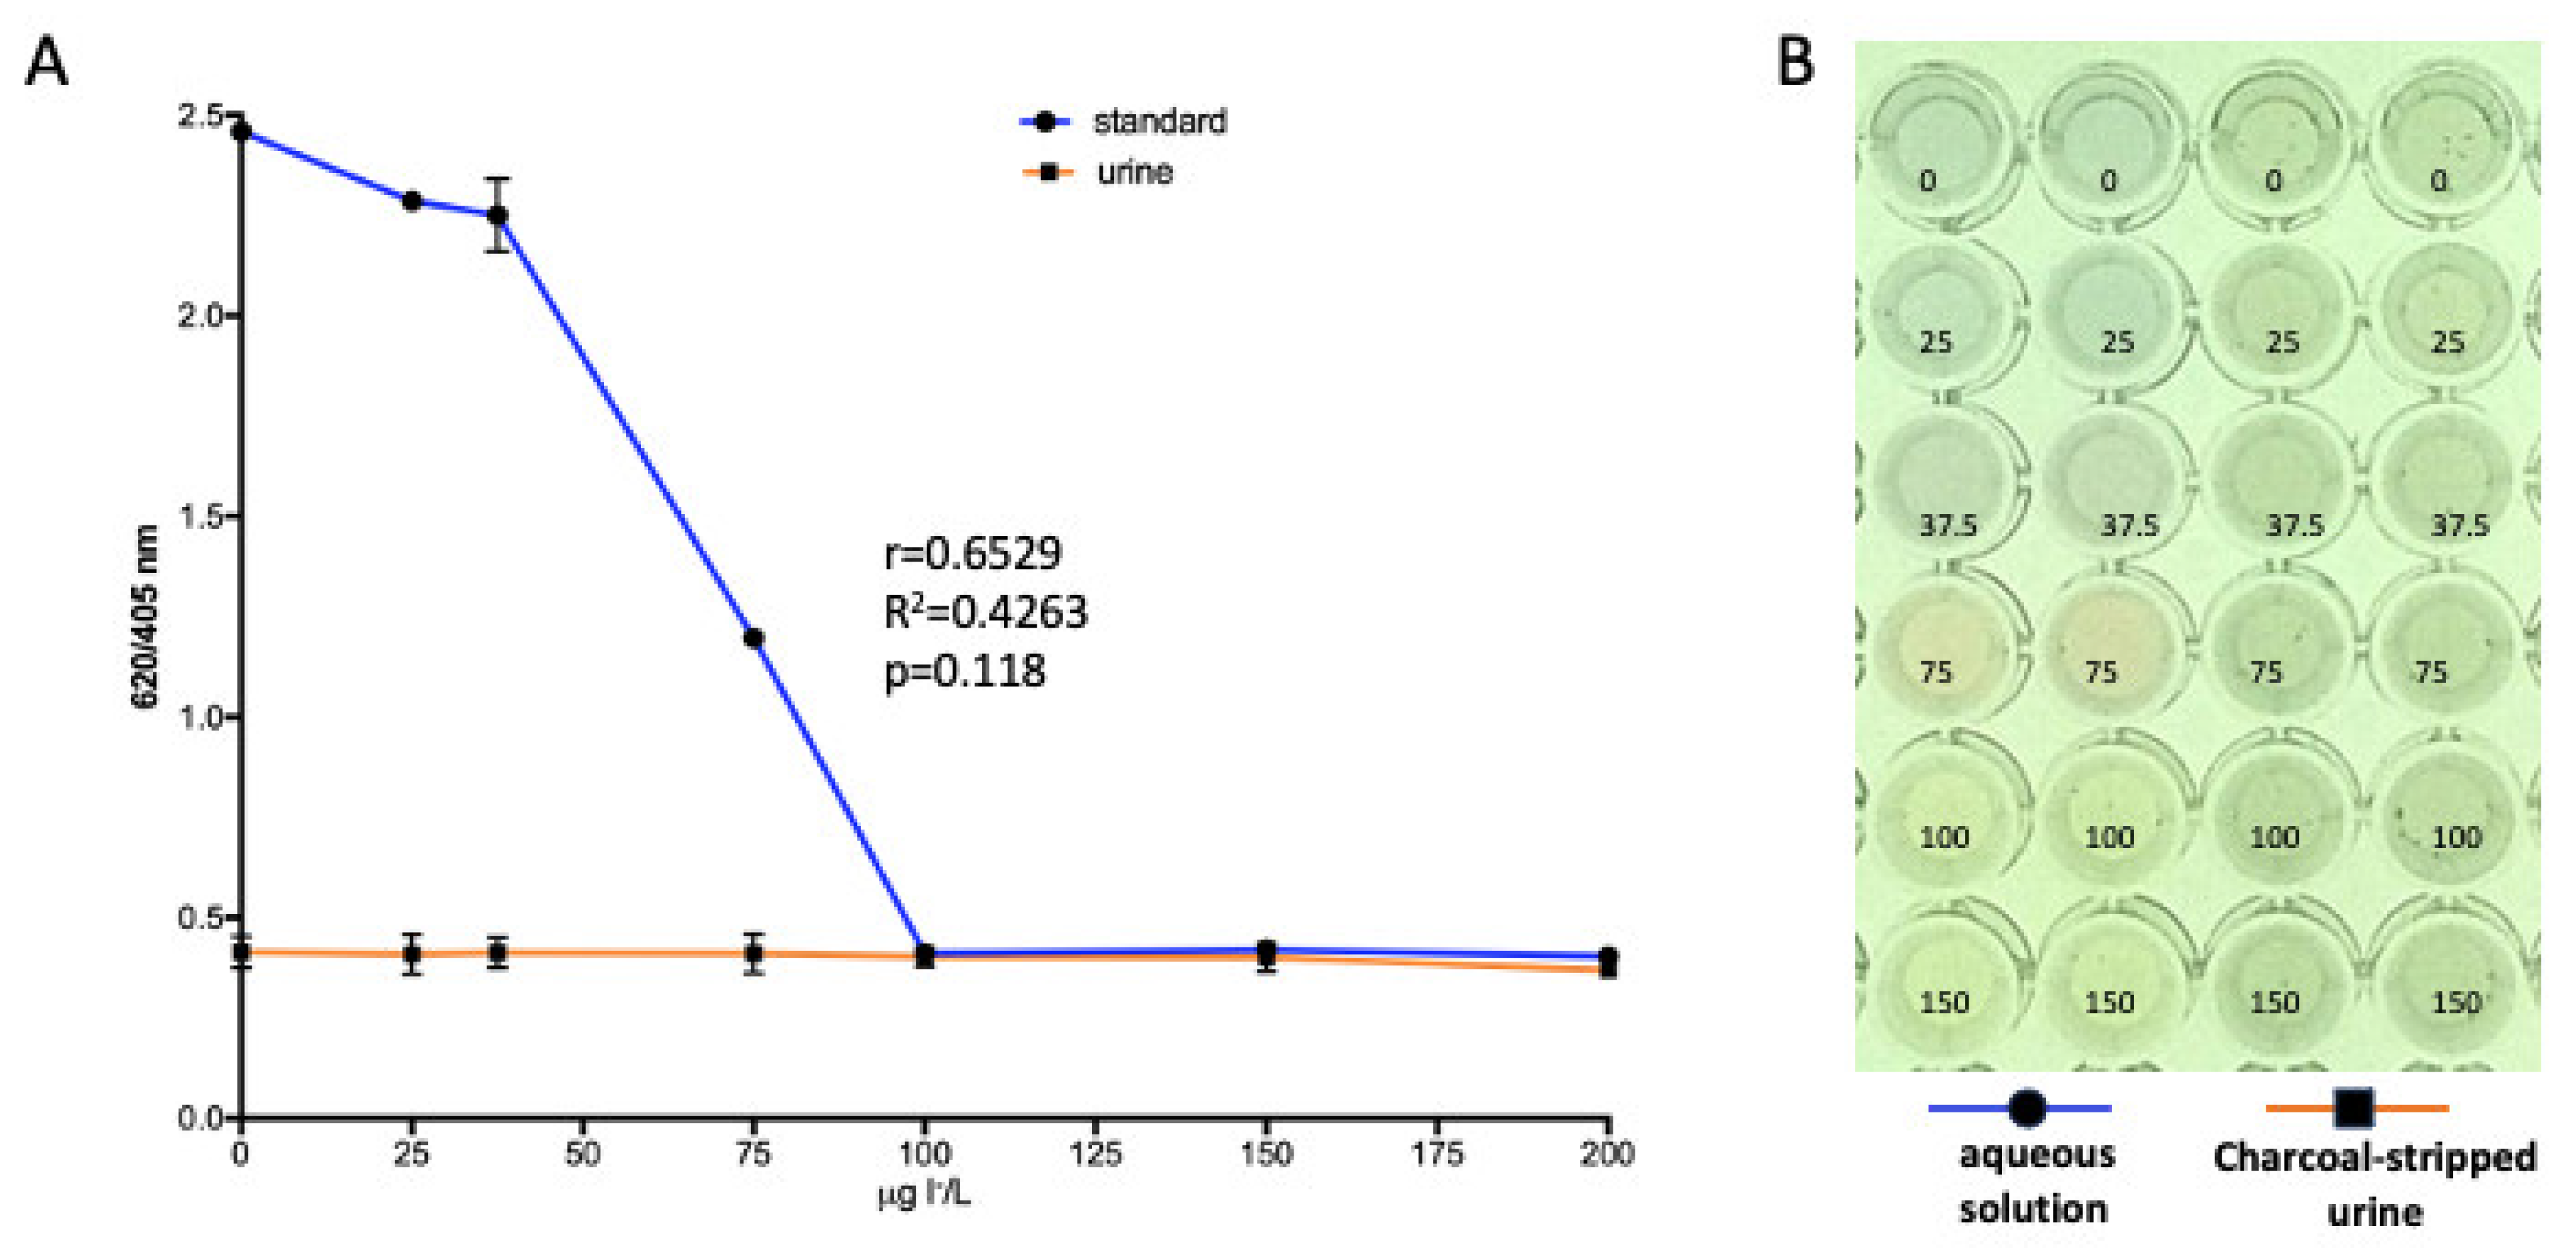
The evaluation of the performance of AgTNPs to determine iodide in urine was performed by comparing the behavior of the nanoparticles with aqueous solutions or charcoal-stripped urine spiked with different concentrations of iodide. The results show that an aqueous solution modifies the SPR band, reaching a yellow color at 100 µg I/L. Charcoal-stripped urine interferes with the colorimetric reaction in the whole range of iodide concentrations studied. The correlation analysis between the behavior of AgTNPs with different concentrations of iodide vs. charcoal-stripped urine indicates that there is no correlation between the response of AgTNPs when the matrix is urine, r = 0.6529, R2 = 0.4263, p = 0.1118. This could be mainly due to the proper color of urine or the presence of interference molecules and ions (Figure 3).

3.4. Effect of Common Urine Interferent Molecules and Ions on AgTNP SPR Band

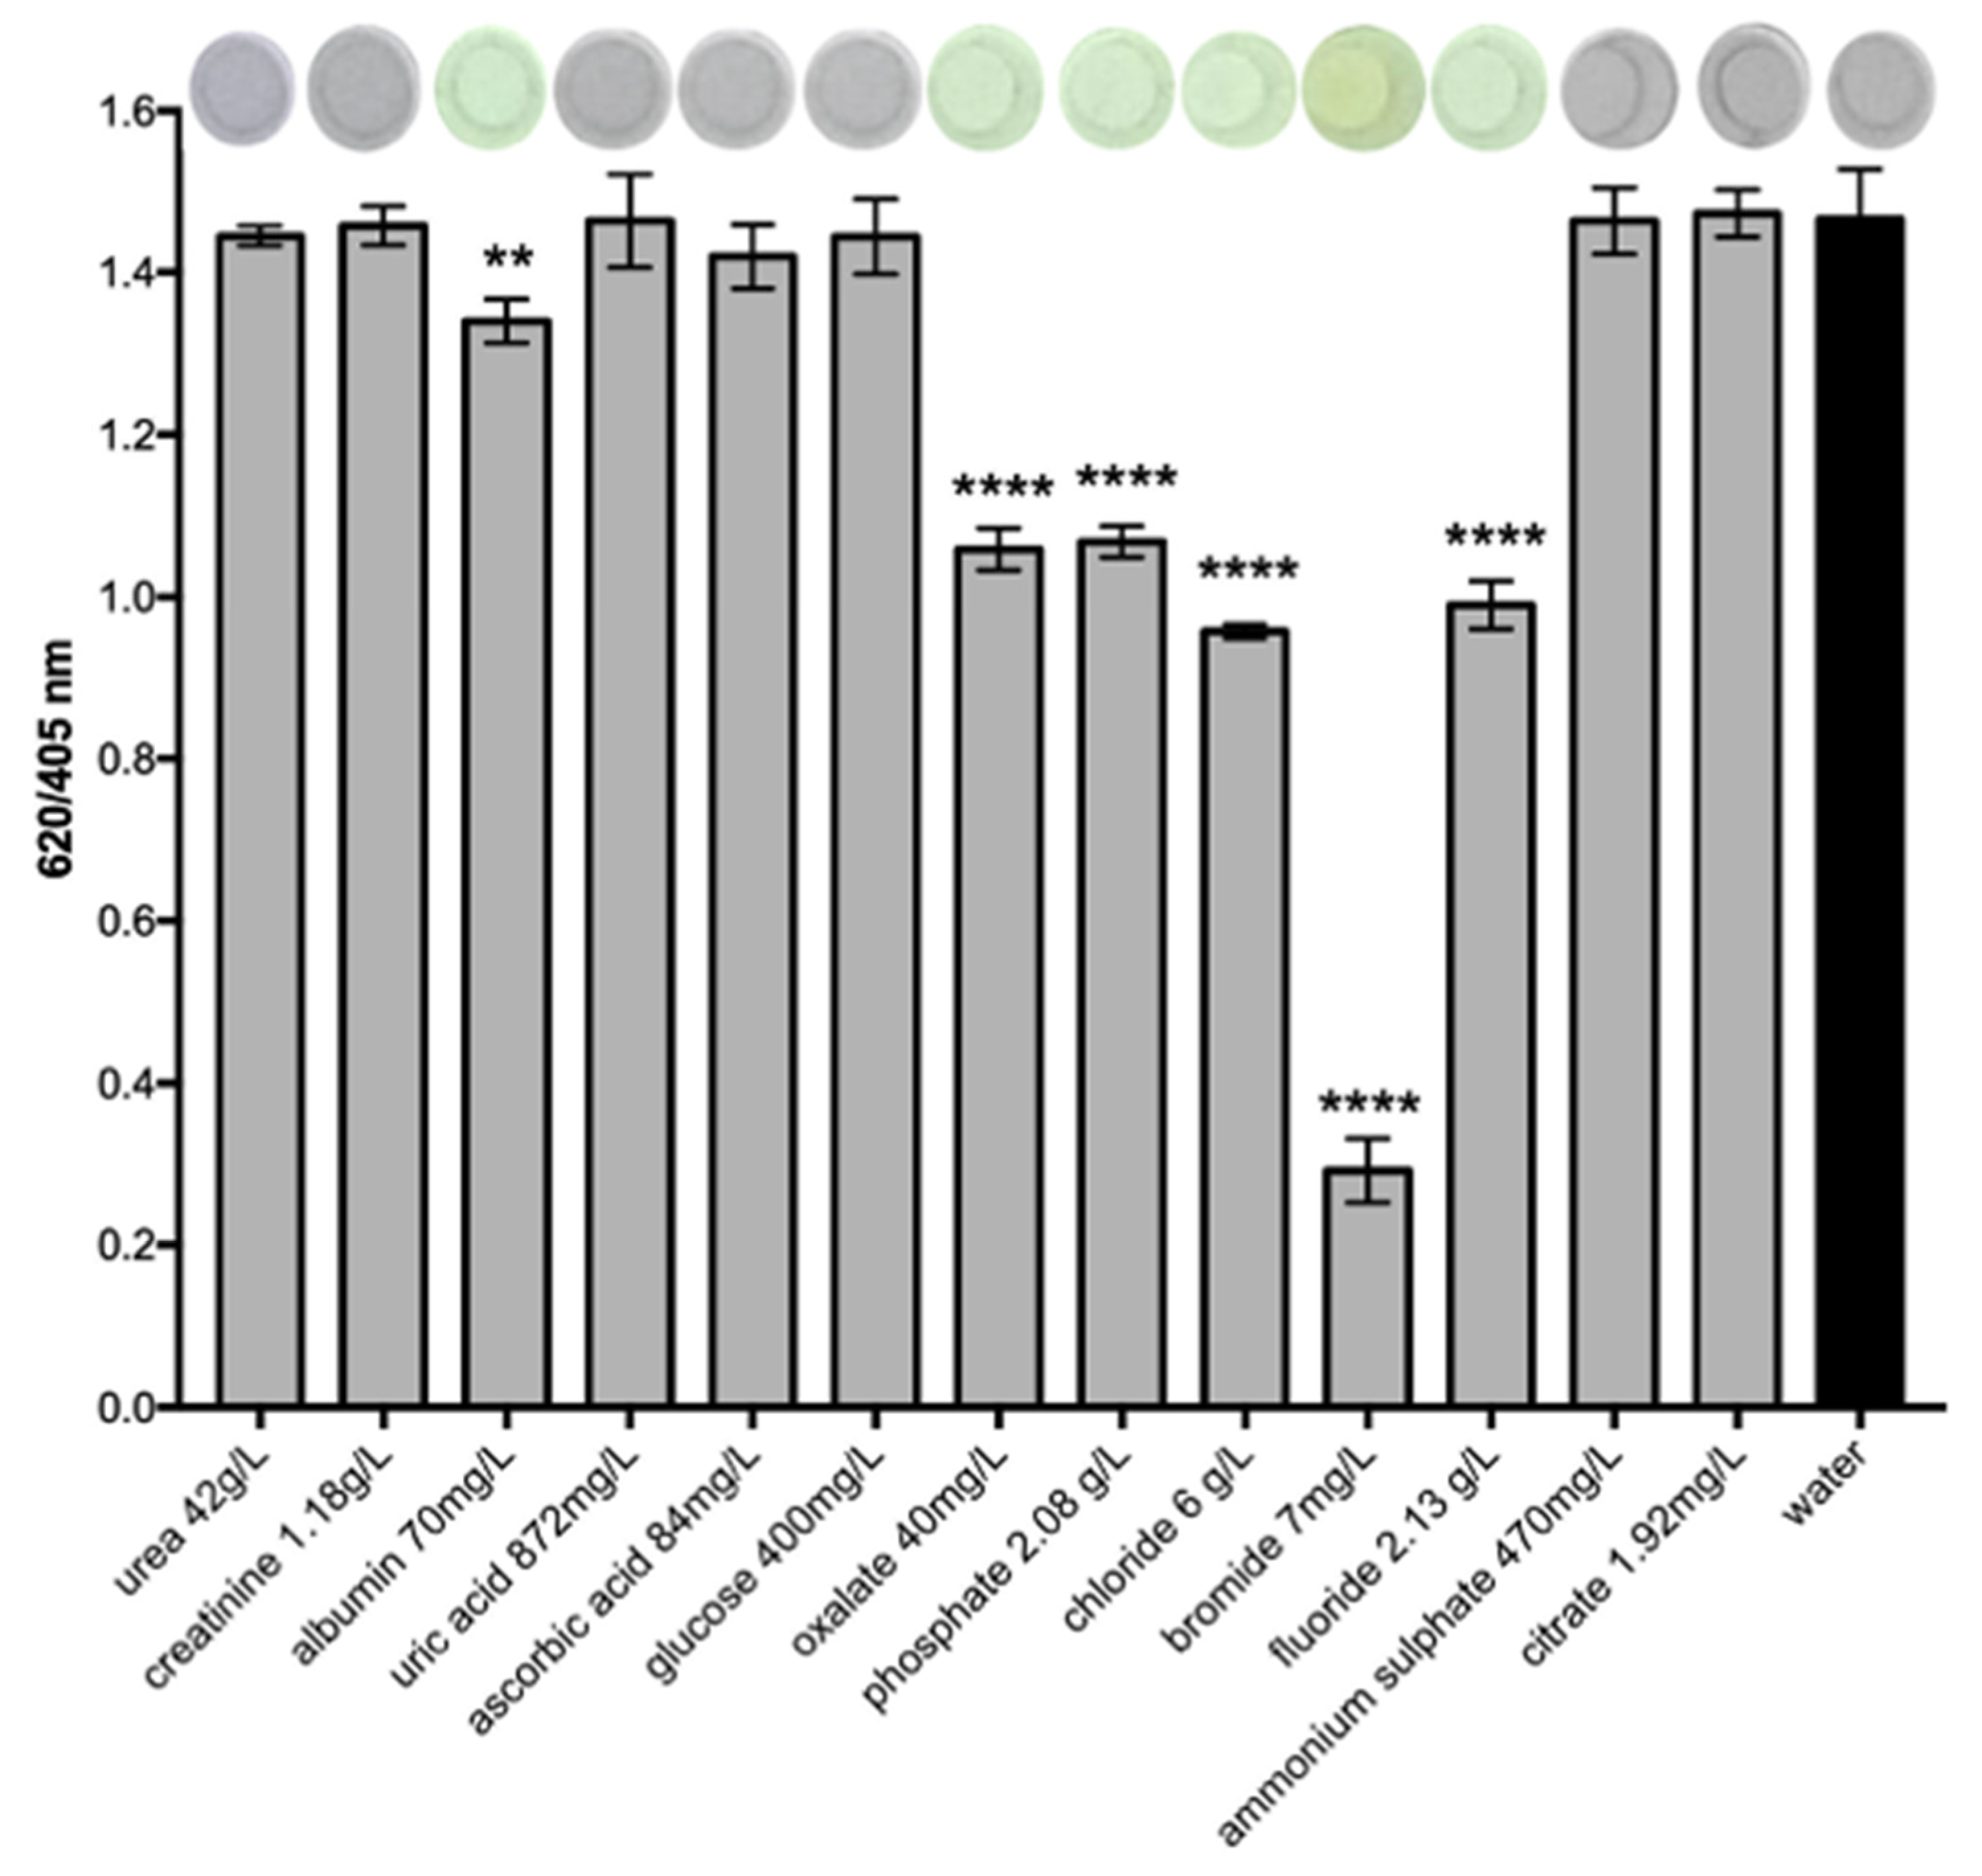
Human urine is a complex matrix mainly composed of water (95%). The predominant compounds and ions found in urine are urea (2%), creatinine (0.1%), uric acid (0.03%), chloride, sodium, potassium, sulfate, ammonium, phosphate, and a minor quantity of further molecules and ions [29]. To evaluate the effect of the main molecules and ions found in urine on AgTNPs, the nanoparticles were incubated with the maximal concentrations reported in urine for urea, creatinine, uric acid, chloride, phosphate, and sulfate. Other molecules of interest found in urine were also assayed, such as albumin, ascorbic acid, glucose, oxalates, citrate, as well as other halogens like bromide and fluoride. When the absorbance ratio of AgTNPs is analyzed, it shows that albumin, oxalates, phosphate, chloride, bromide, and fluoride significantly interfere with the AgTNP SPR band absorption ratio compared with water [28,29,30,31,32,33] (Figure 4). These results agree with previous reports using different Ag nanoparticles that indicate that the compounds and ions commonly found in urine (Cl, Br, F, H2P04, SO42−, CH3COO, SCN, NO3, ClO4, albumin, and oxalates) interact with silver atoms, inducing a shift on the SPR band spectra, which corresponds with the shape transformation in a time- and concentration-dependent manner [37,38,39]. Altogether, with the view to using AgTNPs on urine samples, it is necessary to eliminate the interference to detect iodide sensitively.

3.5. Optimization of SPE Protocol for the Recovery of Iodide from Urine

Activated charcoal is widely recognized for its ability to extract iodide from aqueous solutions [25]. Based on the property of charcoal to retain small ions, such as iodide, an SPE protocol for urine iodide was developed. Table 1 describes the preliminary experiment conducted to select the optimal SPE protocol for iodide extraction, based on iodide recovery as the response variable. For further details on iodide recovery, see Supplementary Materials SS3.
Since the quadratic model is the best at describing the optimal interaction between variables for the recovery of iodide, this model was chosen (Supplementary Materials SS3). The following equation represents the quadratic model for the optimization of the SPE protocol:
% I r e c o v e r y = 372.893 0.071 A + 81.590 C + 0.570 D + 0.010 A C 4.846 C 2 0.002 D 2
The optimal design procedure of SPE is as follows: A 2667 μL aliquot of activated charcoal solution was added to the column, which was then centrifuged at 3000 rpm for 5 min. Next, 900 μL of iodide standard was added to the column, and it was allowed to equilibrate for 15 min. The column was centrifuged as previously described. After that, the column was rinsed with 900 μL of ultrapure water and centrifuged as previously described. For the desorption of iodide, 900 μL NaOH, pH 10.7 was added to the column and left to equilibrate for 3 h. Finally, the column was centrifuged as previously described. Following that, the concentration of iodide recovered was determined using the Sandell–Kolthoff method. The validation was performed over four independent runs, and the results of iodide recovery were 97.51% ± 0.46 (mean ± SD) (Supplementary Materials SS3).

3.6. Efficiency of the SPE Protocol for the Elimination of Common Urine Interferences

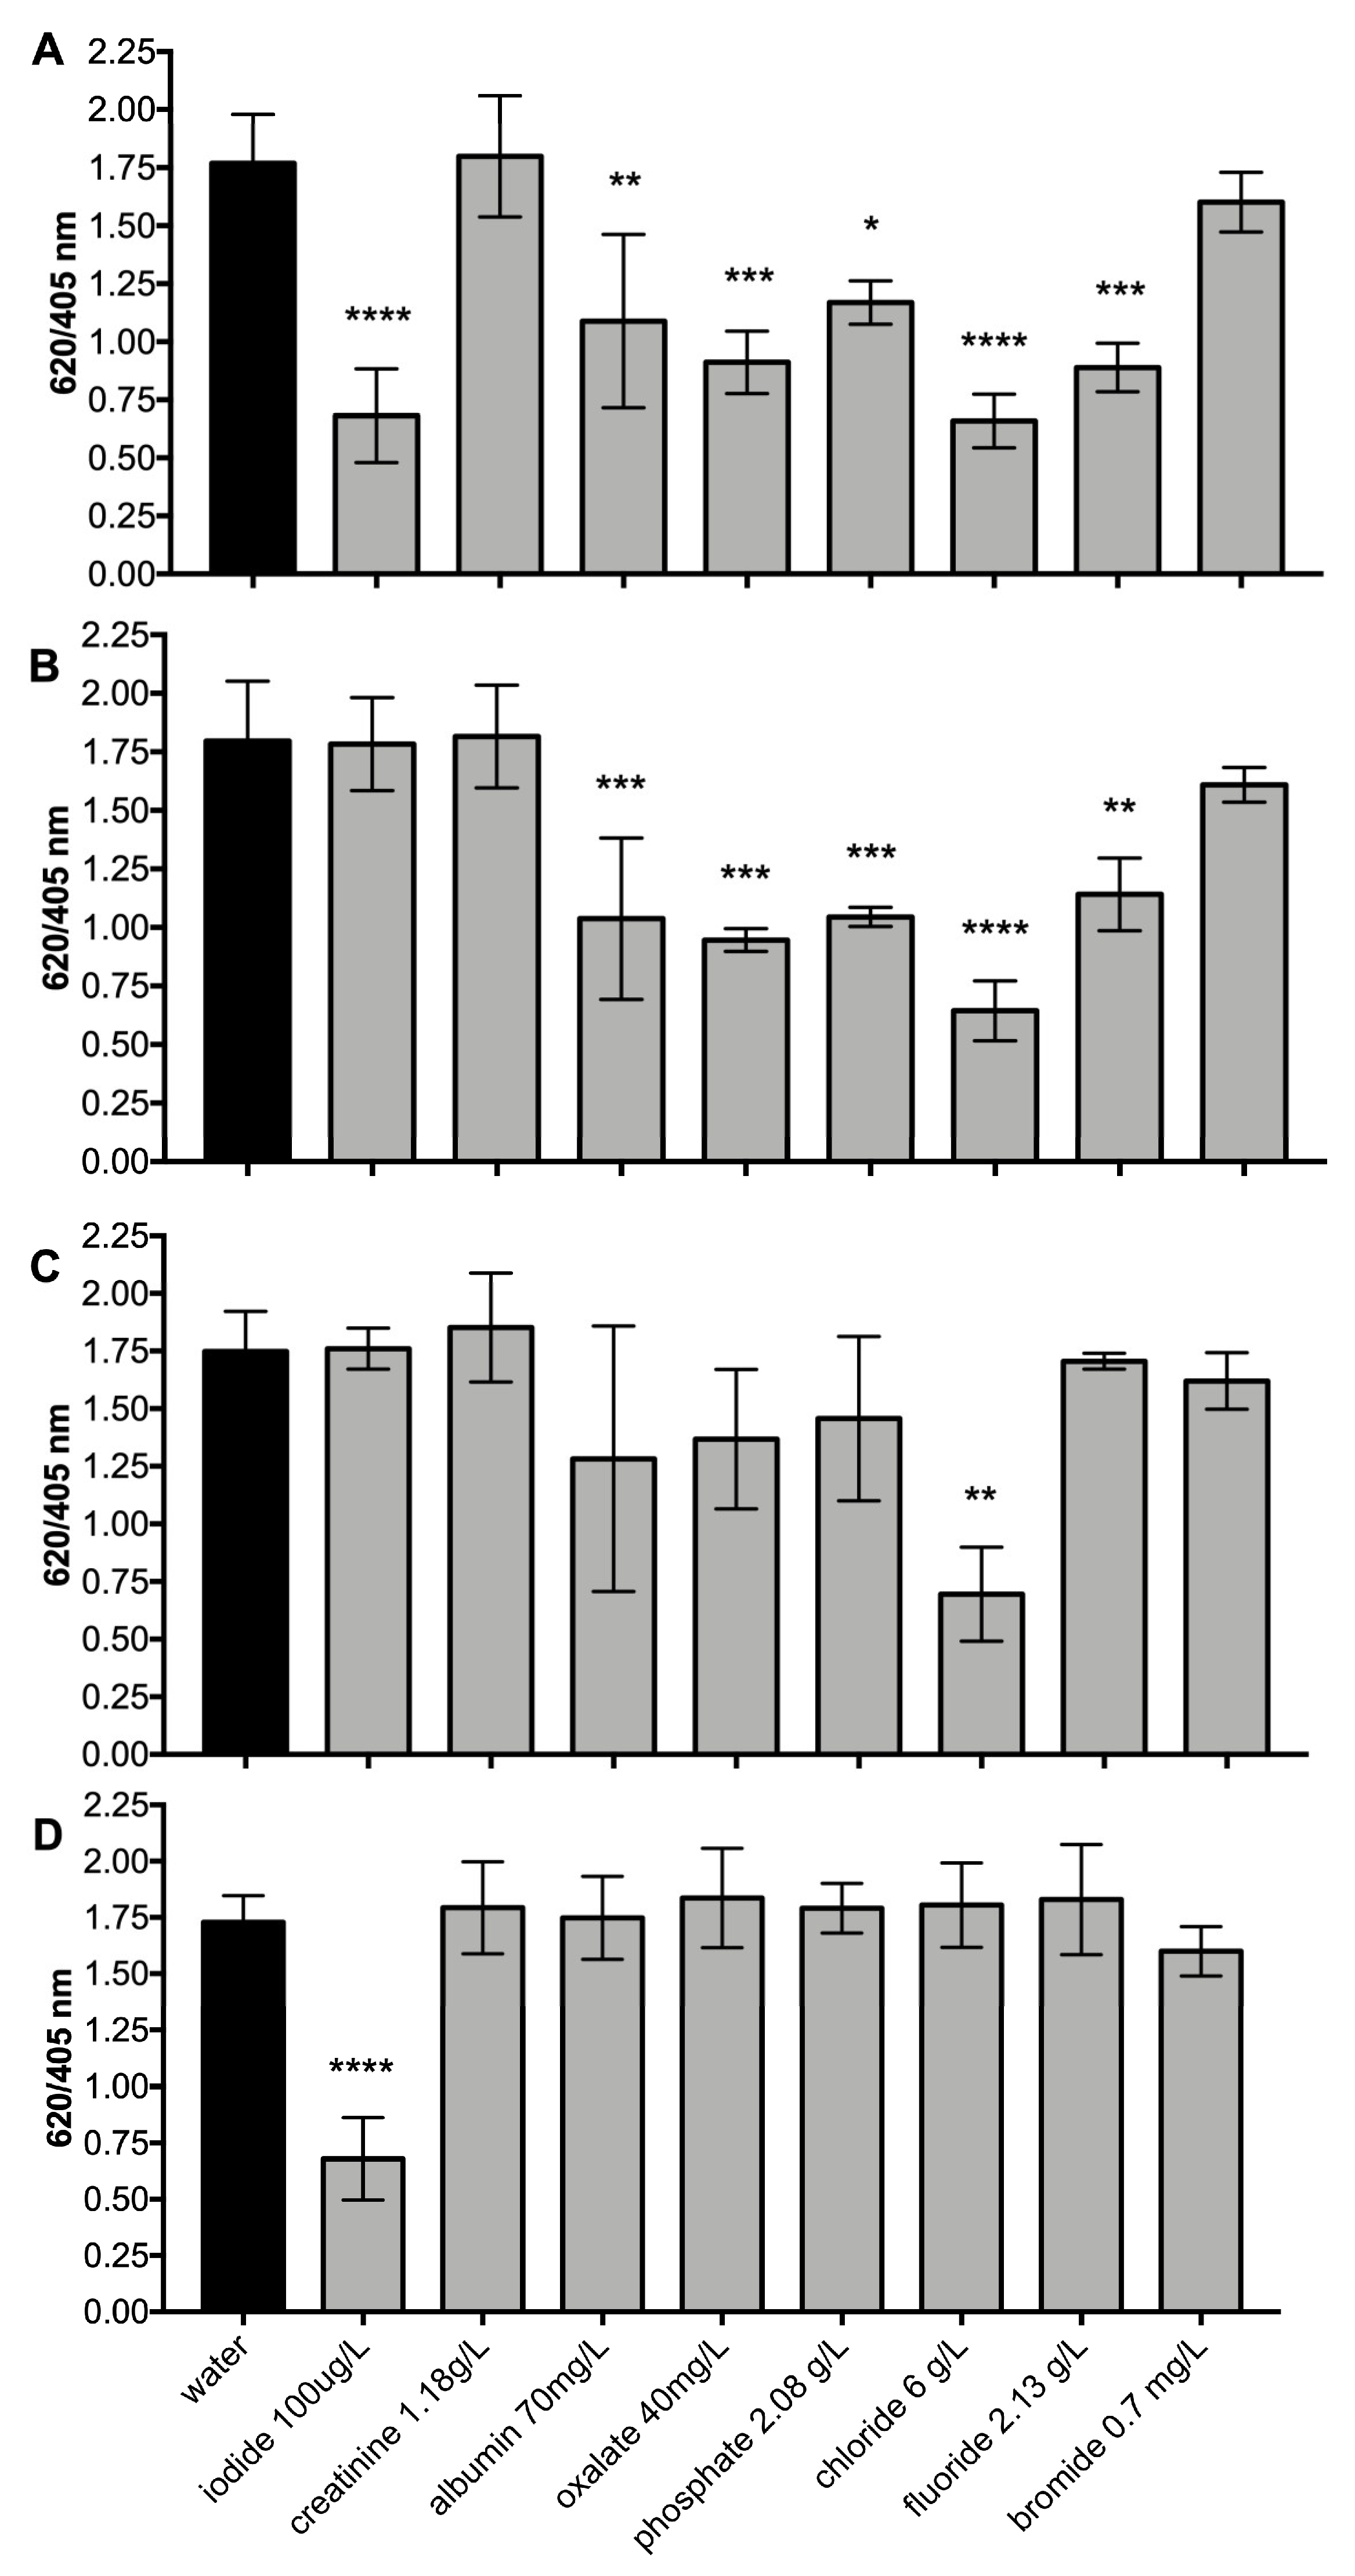
The optimized SPE protocol was used later for the compounds and ions that modify the AgTNP SPR band and consequently may interfere with iodide measurement. The concentrations assayed for creatinine, albumin, oxalate, phosphate, chloride, fluoride, and bromide were the maximal concentrations reported in urine (Figure 5). To estimate the presence of interferences along the SPE process, the starting solution and the eluent after each step were assayed against AgTNPs. This experiment allows us to evaluate the modification of the SPR band individually by each interferent.
As previously determined, iodide, albumin, oxalates, phosphates, chloride, and fluoride independent solutions interfere with the AgTNP SPR band in each starting solution. After charcoal absorption, albumin, oxalates, phosphates, chloride, and fluoride were present in the eluent. On the contrary, the eluent corresponding to the column that contains iodide showed that this element remains in the charcoal. After rinsing with water, the eluent of the column for chloride significantly modifies the SPR band, confirming its presence in the eluent. At the end, after the desorption of the column with NaOH, the only eluent that modifies the AgTNP band was the one obtained from the iodide column (Figure 5). These results confirm that the interferences, such as albumin, oxalate, phosphate, chloride, and fluoride, are eliminated from the urine samples using the SPE protocol. In the case of bromide, we observe that this element has a similar behavior to iodide. Nevertheless, bromide is rarely found in urine, and the interaction of bromide with the AgTNP SPR band occurs at a high concentration, thus it is not expected to affect this methodology (Supplementary Materials SS7).

3.7. Comparison of Urine Iodide Determination Using Sandell–Kolthoff and AgTNPs After the SPE Protocol for the Elimination of Urine Interferences

Finally, the optimized SPE protocol was applied to charcoal-treated urine spiked with iodide, with urine quality controls with a low, medium, and high concentration of iodide, and random samples of urine from patients.
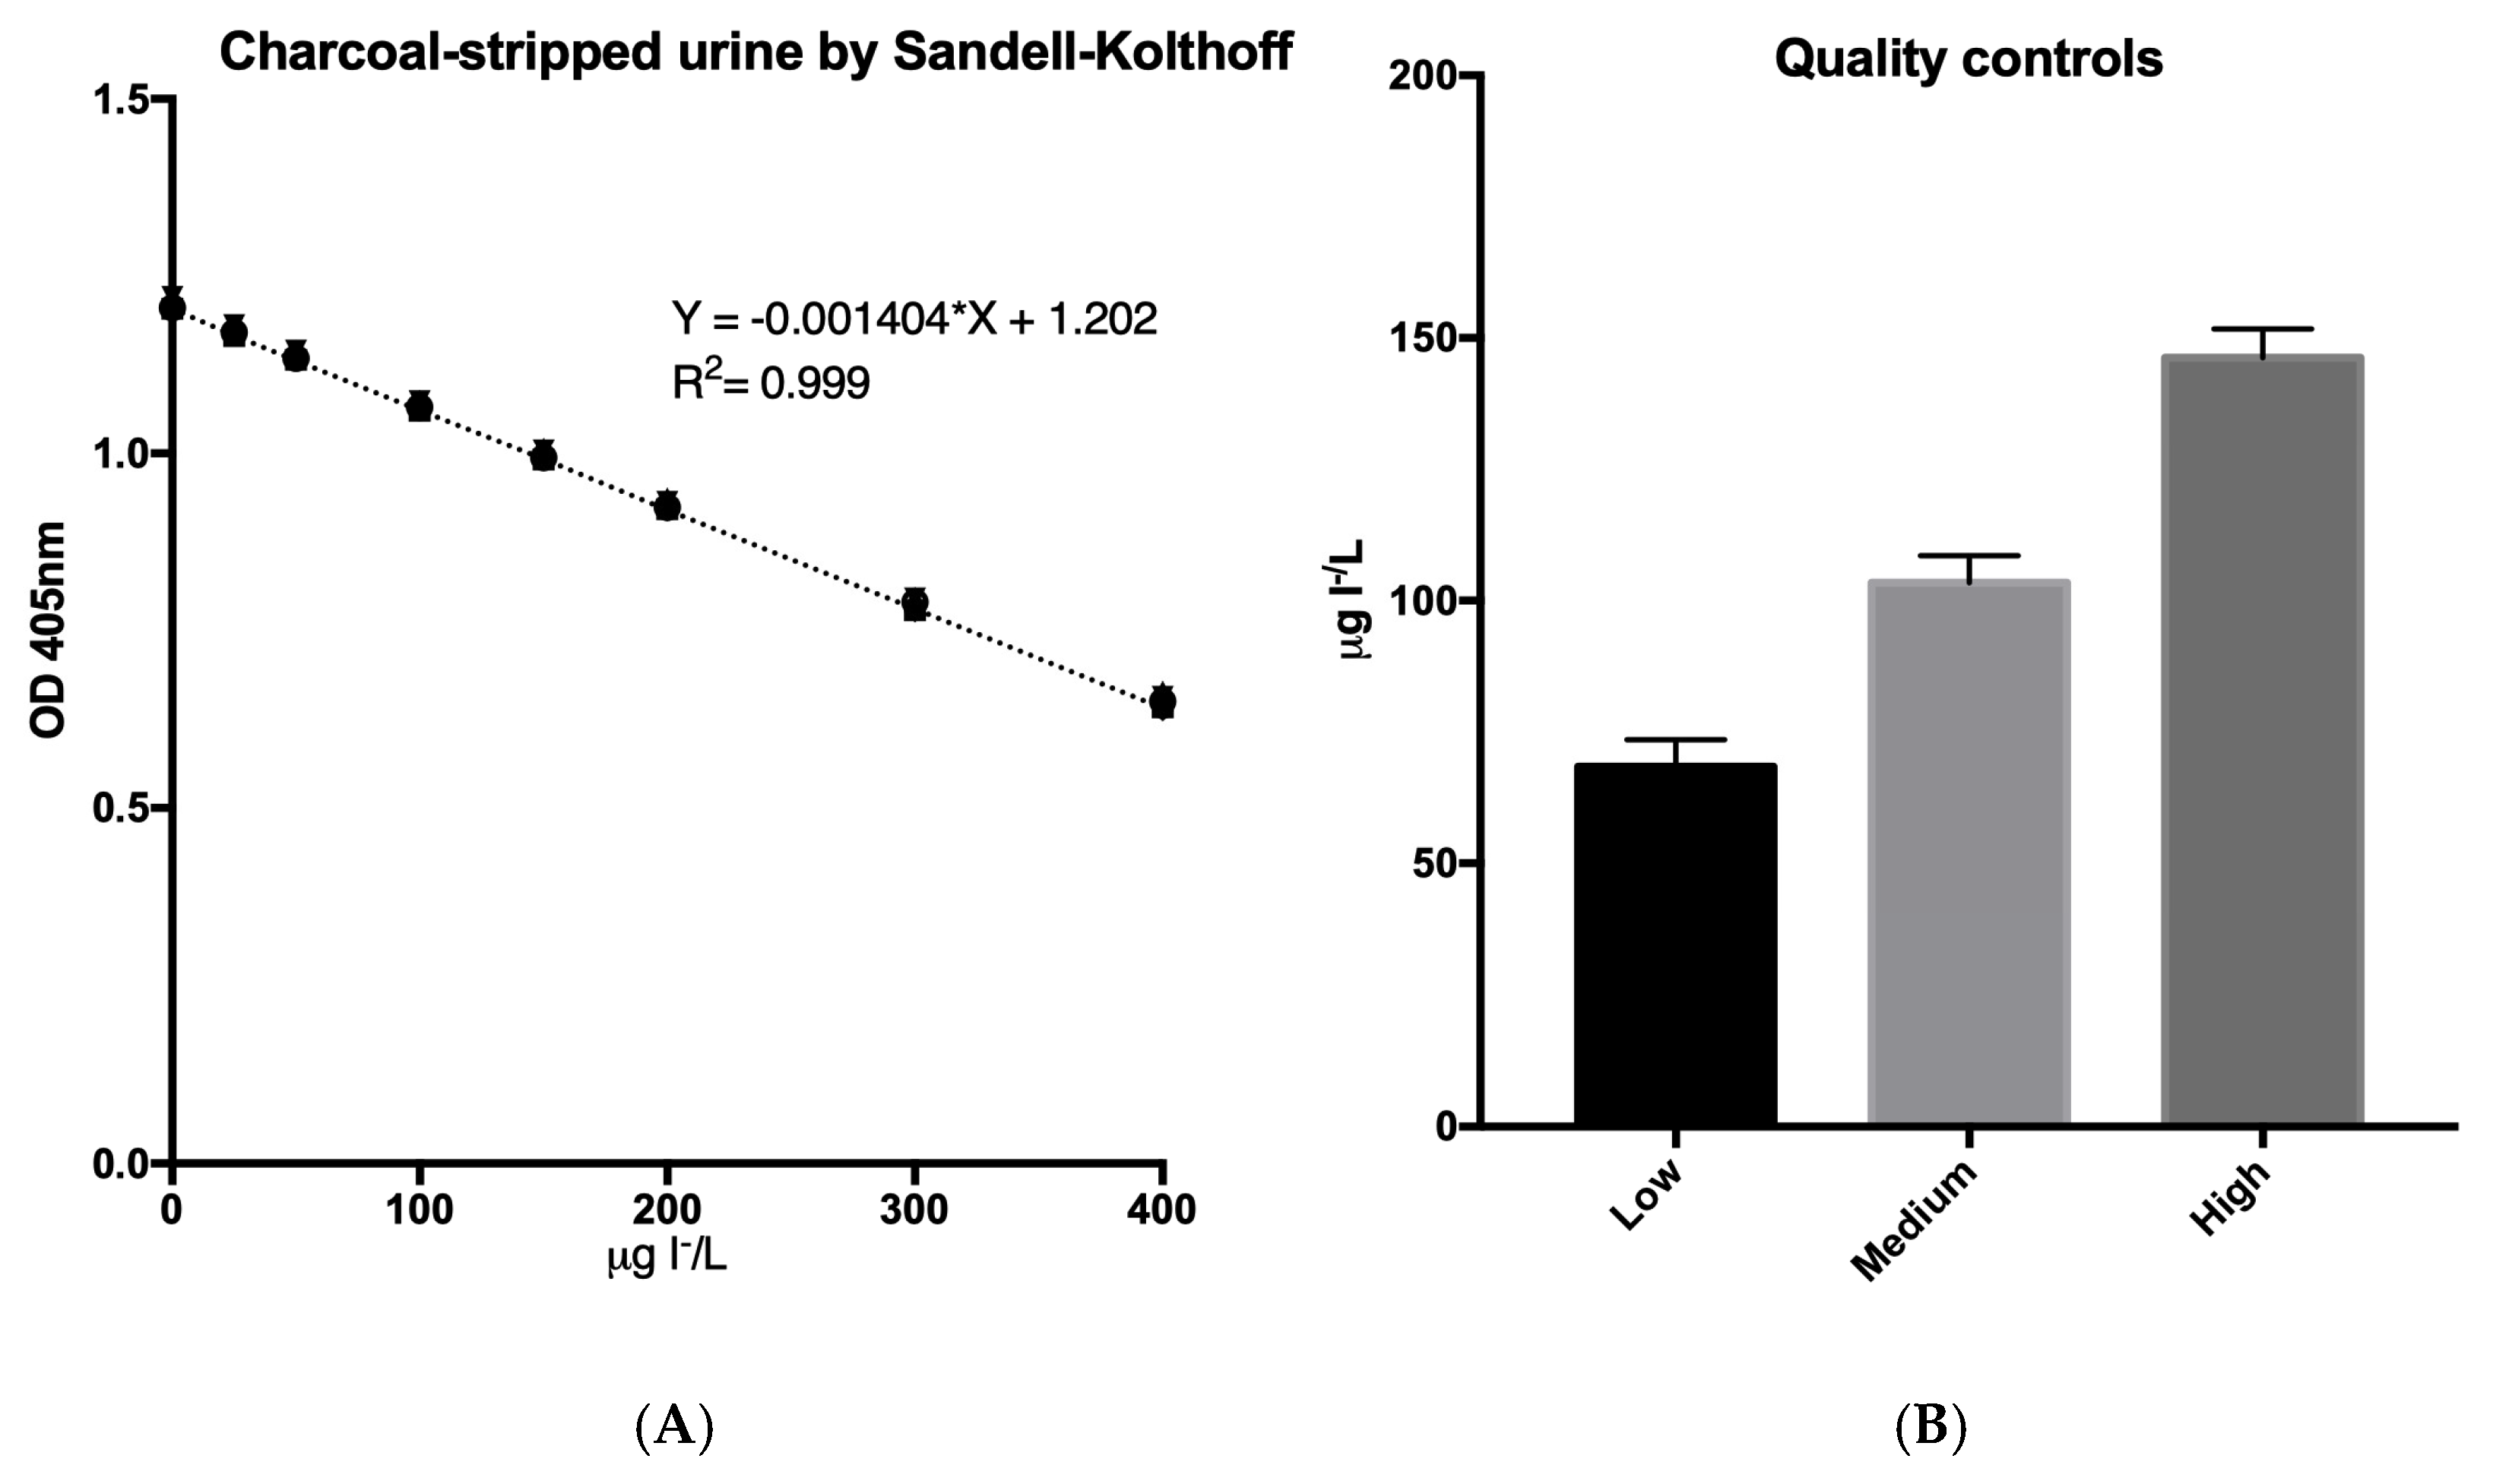
To compare the efficacy of the SPE protocol on urine, a calibration curve of charcoal-treated urine spiked with iodide and quality control samples was assessed using the Sandell–Kolthoff reaction. The calibration curve showed linearity in the concentration range from 25 to 400 µg I/L, with an R2 coefficient of 0.999 (Figure 6).
The limit of detection was 3.36 µg I/L, and the limit of quantitation was 10.17 µg I/L (Supplementary Materials SS8). The intra-assay coefficient of variation in the urine quality controls ranges between 3.2% and 4.5%, whereas the inter-assay coefficient of variation in the same samples ranges between 0.6 and 1.6% (Table 2).
Once the SPE protocol was optimized, the behavior of AgTNPs against iodide was estimated using a calibration curve of iodide in water, a calibration curve of iodide spiked on charcoal-stripped urine, and urine QC samples after each solution underwent SPE. The application of SPE on urine was effective in eliminating the main interferences in urine demonstrated by the changes in the AgTNP SPR band. The calibration curve of urine spiked with iodide after SPE was perfectly correlated with the aqueous calibration curve of iodide after SPE, with a Pearson’s coefficient r = 0.9999, R2 = 0.9998, and p < 0.0001 (Figure 7). The interpolated values of urine quality controls to the standard curve resulted in low 60.30 ± 0.61 µg/L, medium 107.16 ± 4.76 µg/L, and high 155.05 ± 2.99 µg/L concentrations.
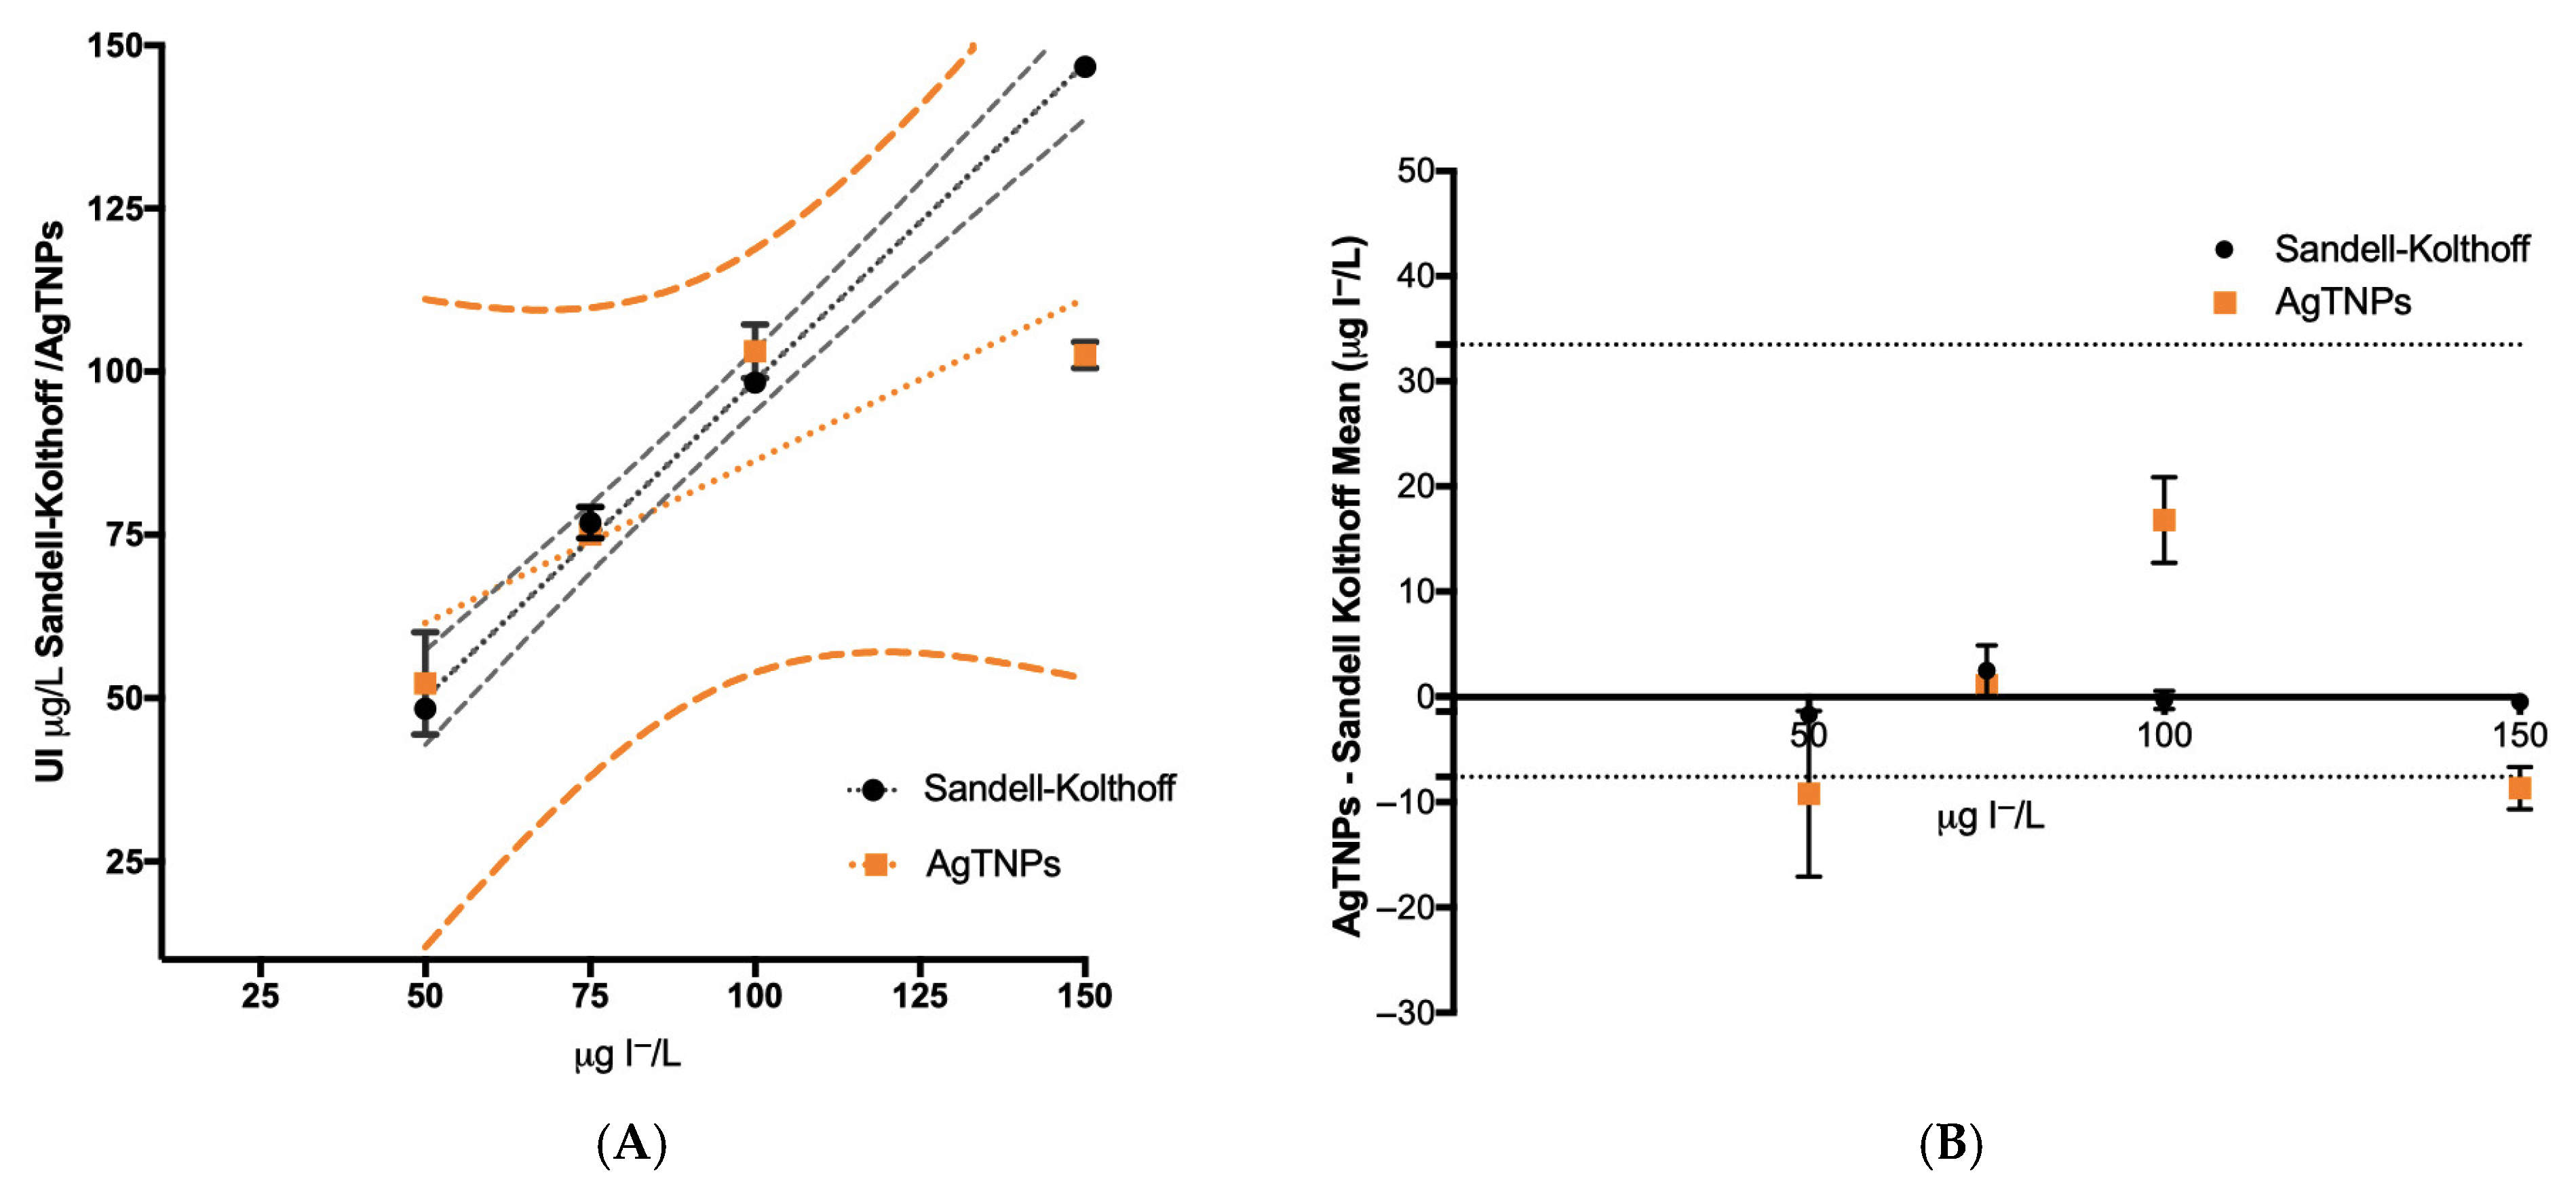
To compare the performance of the AgTNPs vs. the Sandell–Kolthoff reaction for estimating urine iodide, a regression analysis of both were carried out and compared. The regression analysis of the Sandell–Kolthoff method using charcoal-stripped urine spiked with iodide (range from 50 to 150 µg I/L) yielded a linear regression equation of the following form: y =   0.9708 x   1.543 , with a correlation coefficient R2 = 0.9982. The analyses, as expected, confirm that this methodology is suitable for iodide quantitative determination within the range studied. Whereas the regression analysis using AgTNPs for the determination of iodide using the same calibration curve yielded a linear regression of the following form: y   =   0.4974 x   + 36.62   , with a correlation coefficient R2 = 0.7535. This result indicates that the determination of iodide using AgTNPs is not as suitable as the Sandell–Kolthoff method for the quantitative determination of iodide (Figure 8). The bias plot indicates that the AgTNP method has a lower limit = −36.56 and an upper limit = 55.18 with 95% confidence. The plots indicate that the individual points do not have regular behavior, and only 50% of them fall within the range of confidence (Figure 8). This data allows us to confirm that the AgTNP method is not superior to the Sandell–Kolthoff method as a precise quantitative method. Nevertheless, the Bland–Altman analysis indicates that this methodology does not differ from Sandell–Kolthoff within the range between 50 and 100 μg I/L, showing a difference of −7.75% for 50 μg I/L, 2.40% for 75 μg I/L, −4.78% for 100 μg I/L, and 35.41% for 150 μg I/L.

3.8. Qualitative Urine Iodide Determination Using AgTNPs After SPE Protocol

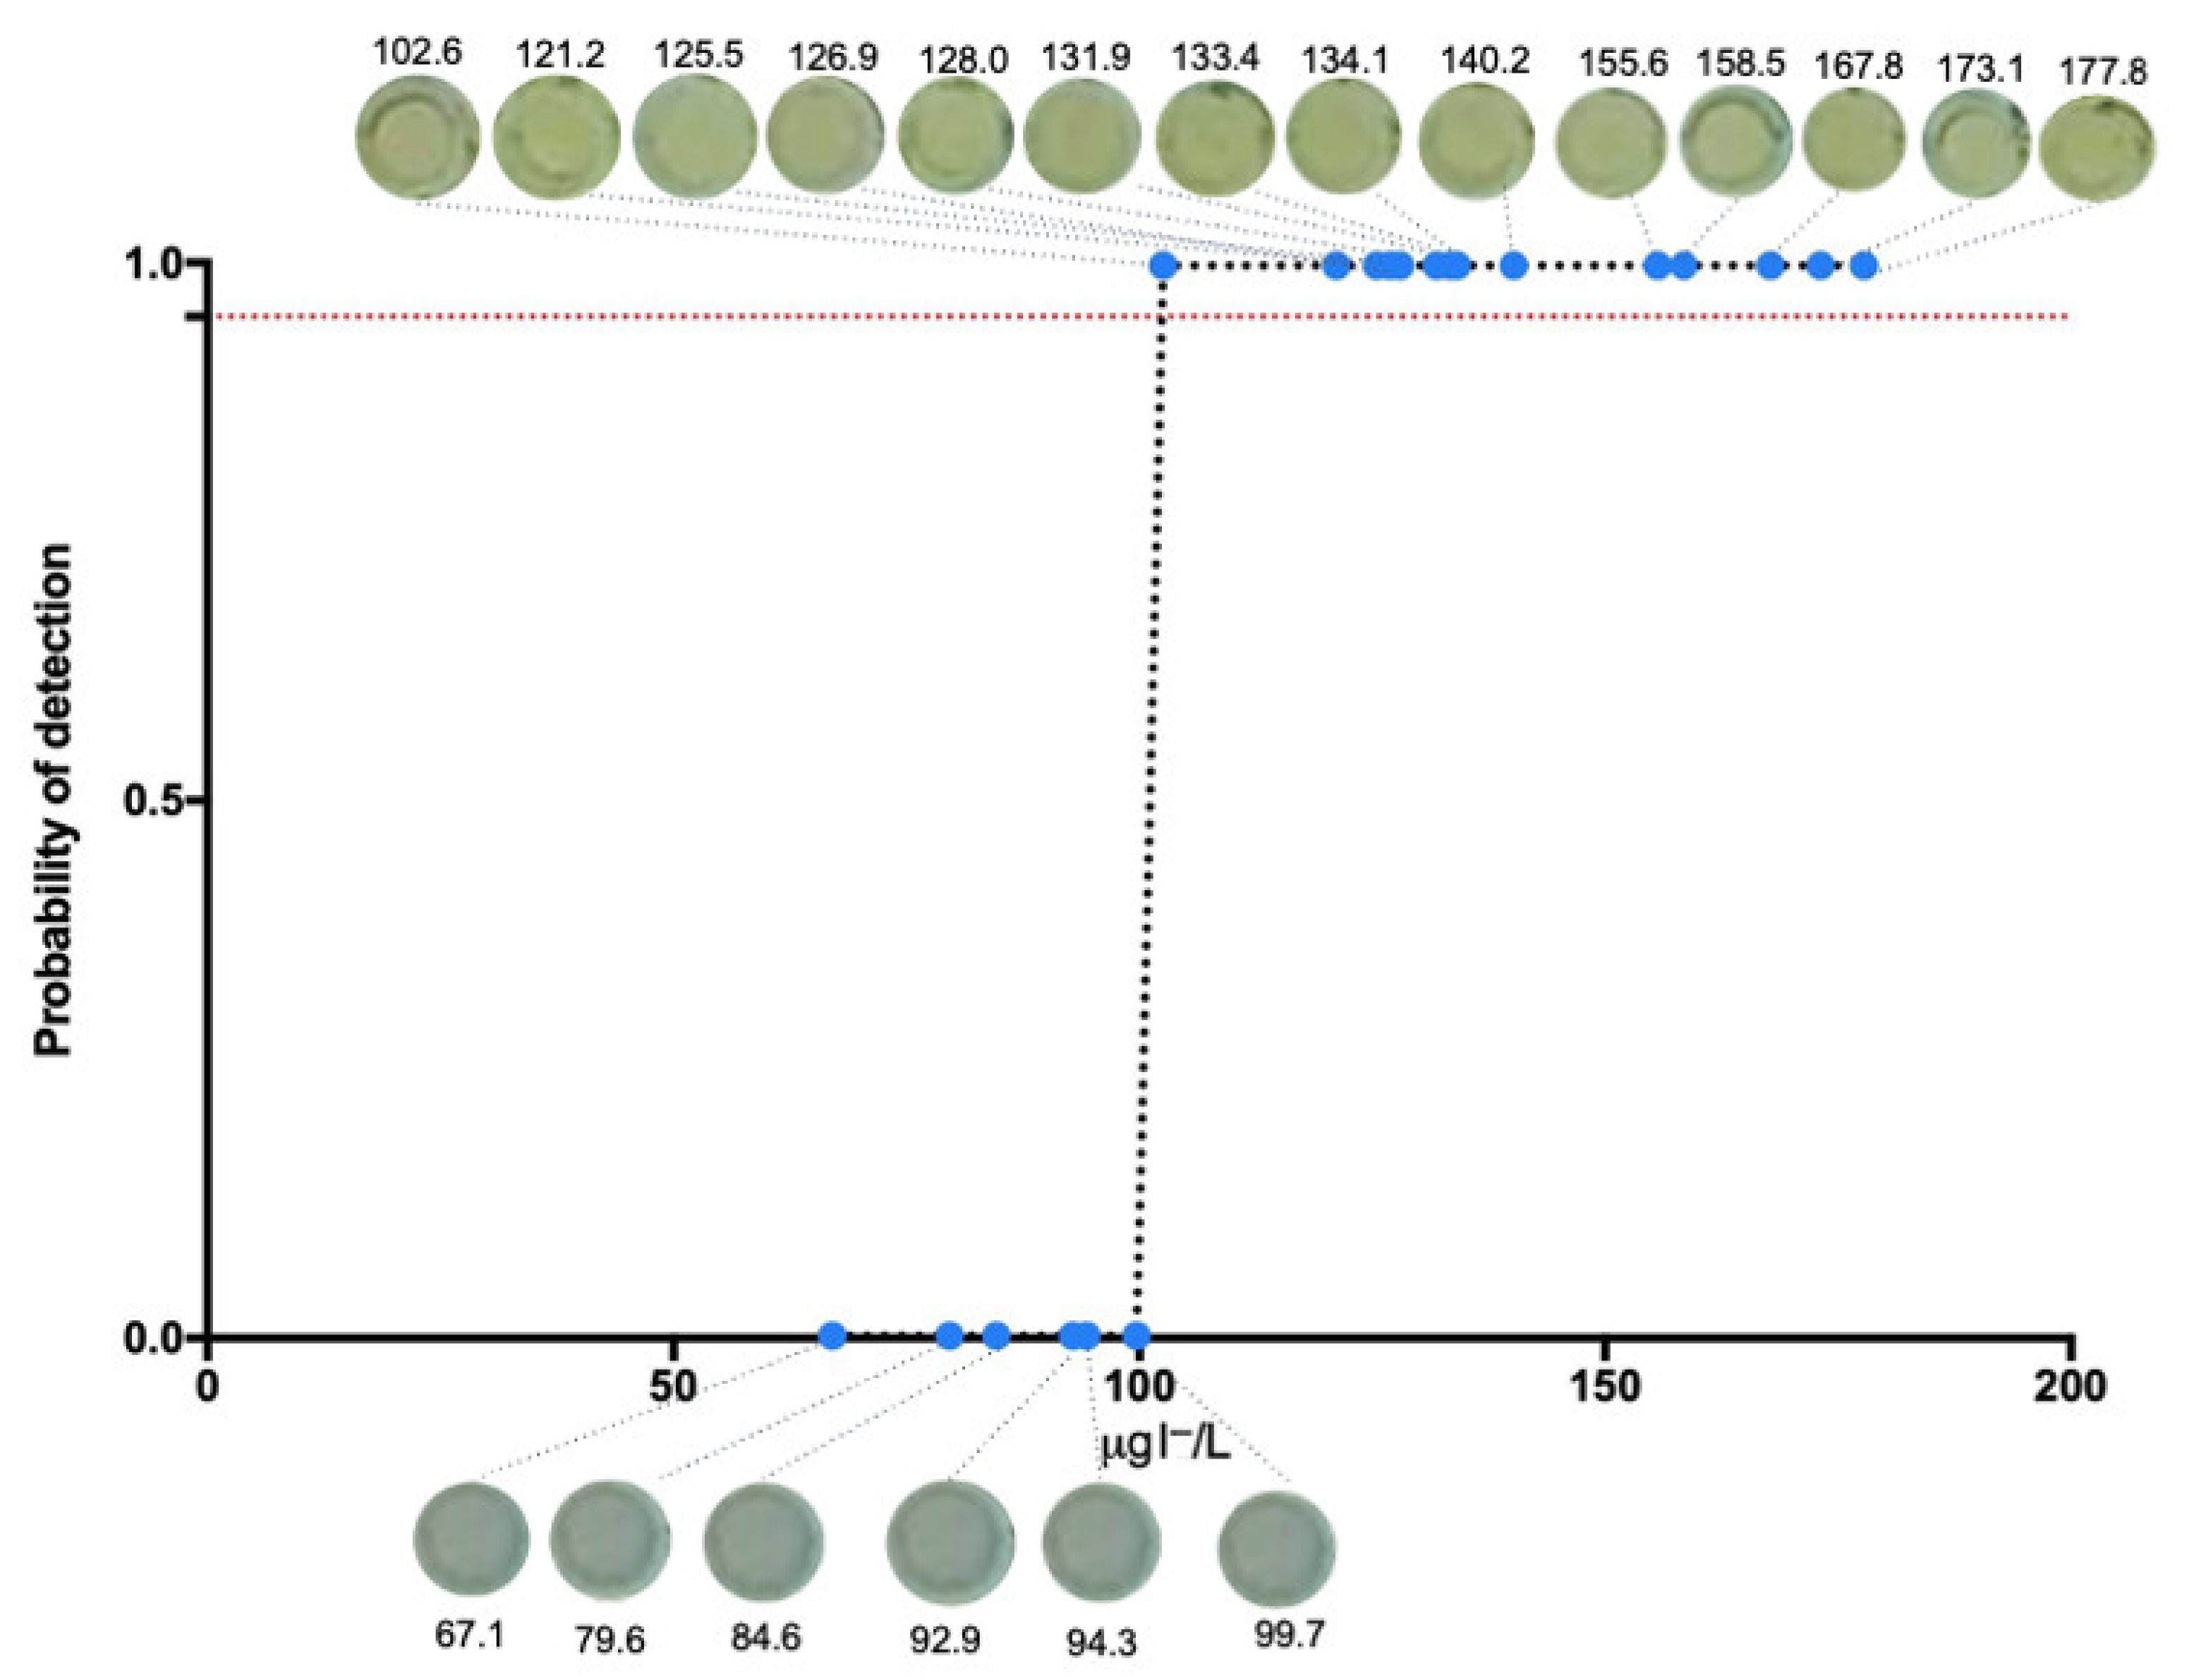
The possible use of AgTNPs as a qualitative method to determine iodine insufficiency (IU < 100 µg I/L) was based on the colorimetric response of AgTNPs turning yellow when the iodide concentration is above 100 µg I/L. The binary response of AgTNPs with iodide (not yellow/yellow) was estimated using a logistic model of a free online application based on the R environment, known as LogRegLOD v1.0 (https://garridobrunoc.shinyapps.io/LogRegLOD/) accessed on 22 April 2025 [34]. This free tool allows one to determine the LOD in qualitative analysis as well as its probability of detection. The estimation of the LOD was performed by analyzing the behavior of AgTNPs in six urine samples of patients after SPE at different concentration levels over six replicates. The concentration of the samples was previously estimated using the Sandell–Kolthoff reaction. The logistic regression indicates that the LOD using AgTNPs after SPE is 101.32 µg I/L with a detection probability of 95% (Supplementary Materials SS9). To validate this approach, urine samples from twenty different patients were evaluated to confirm their iodide sufficiency status. As shown in Figure 9, the urine samples from patients that have concentrations above 100 µg I/L (determined previously by Sandell-Kolthoff) turn AgTNPs from blue to yellow, whereas the urine from patients below 100 µg I/L did not modify the AgTNPs’ blue color.

4. Conclusions

Iodine is an essential element for human health since it is the main element of thyroid hormones, which regulate growth, neuronal development, and metabolic activity, among other physiological events. The deficiency of this element has become a public health concern since it can cause pathologies such as hypothyroidism, goiter, and cretinism, among others. That is why it is crucial to continuously monitor iodine consumption in the population. Despite the implementation of salt iodization, thirty percent of the world’s population is still at risk of iodine deficiency due to changes in diet and the decrease in salt consumption. Iodine is measured through urinary excretion (UI), but the methodologies currently applied, such as ICP-MS and the Sandell–Kolthoff colorimetric reaction, have significant disadvantages, including the need for complex and expensive equipment or reactions that present substances that are harmful to the environment.
Considering this information, an SPE technique was developed to adequately use AgTNPs for the qualitative and naked eye detection of UI. This methodology allows iodide to be separated from the matrix’s interferents that cause an undesirable change in color of the AgTNPs. The limitations of this methodology include the time required to process the samples and to precisely determine iodide concentrations below 100 μg I/L and above with respect to the Sandell–Kolthoff reaction. Nevertheless, it has several advantages. It is a simple technique, has a low cost, allows multiple samples to be assayed simultaneously, does not require complex equipment, and is environmentally friendly compared with the Sandell–Kolthoff reaction, which uses ammonium persulfate and arsenic. In addition, it permits discrimination between iodine sufficiency and deficiency with the naked eye; thus, it does not require a spectrophotometer, in comparison with the traditional colorimetric method. This would allow iodide determination to be made in populations with low-complexity laboratories and without the need for specialized personnel, which would acknowledge the more continuous control of iodine consumption in areas where these determinations are not accessible.

Supplementary Materials

The following supporting information can be downloaded at: https://www.mdpi.com/article/10.3390/suschem6030029/s1, SS1: Solutions, SS2: DoE of SPE protocol, SS3: DoE of iodine recovery, SS4: AgTNP stability, SS5: UV–vis absorbance of AgTNP reaction with iodide, SS6: AgTNP LOD, SS7: Bromide interference, SS8: Spiked urine and QC using Sandell–Kolthoff method after SPE protocol, SS9: Reported LOD UI samples by AgTNPs after SPE protocol.

Author Contributions

Conceptualization, M.B.H. and I.T.O.; methodology, I.T.O., M.B., M.B.H., J.C.A., P.E.A. and G.N.O.; validation, I.T.O., M.B.H. and M.B.; formal analysis, I.T.O., M.B. and M.B.H.; investigation, I.T.O., M.B., P.E.A. and M.B.H.; resources, M.B.H., C.G.-L. and M.F.D.; data curation, I.T.O., M.B. and M.B.H.; writing—original draft preparation, M.B.H. and I.T.O.; writing—review and editing, J.C.A., M.F.D., P.E.A., C.G.-L., M.B.H. and I.T.O.; visualization, M.B.H. and I.T.O.; supervision, M.B.H.; project administration, M.B.H. and C.G.-L.; funding acquisition, M.B.H., C.G.-L. and M.F.D. All authors have read and agreed to the published version of the manuscript.

Funding

This research was funded by the Agencia Nacional de Promoción de la Investigación, el Desarrollo Tecnológico y la Innovación, Argentina, grant number PICT 2019_03421, Universidad Nacional de Cuyo, grants number SIIP-UNCuyo 06/M023-T1, 06/80020240400090UN, 06/80020240100849UN and the APC was funded by Universidad Nacional de Cuyo, Argentina. P.E.A., J.C.A., M.F.D., C.G.-L., and M.B.H. are career scientists at CONICET, and I.T.O. has fellowships from CONICET.

Institutional Review Board Statement

Thia study was conducted in accordance with the Declaration of Helsinki and approved by the Health Investigation Ethics Committee of Facultad de Ciencias Médicas-Universidad Nacional de Cuyo EXP_E-CUY:0000981/2022, date of approval 15 March 2022, for studies involving humans.

Informed Consent Statement

Informed consent was obtained from all subjects involved in the study.

Data Availability Statement

The original contributions presented in this study are included in the article/Supplementary Material. Further inquiries can be directed to the corresponding author.

Acknowledgments

The authors are indebted to María José Pérez and María Belén Pérez for their excellent administrative and technical support. The authors have reviewed and edited the output and take full responsibility for the content of this publication.

Conflicts of Interest

The authors declare no conflicts of interest.

Abbreviations

IDIodine Deficiency
IDDsIodine Deficiency Disorders
UIUrinary Iodine
AgTNPsSilver Triangular Nanoplates
SPESolid-Phase Extraction
TEMTransmission Electron Microscopy
UV–visUV–vis spectroscopy
ζ potentialZeta Potential
ICP-MSInductively Coupled Plasma Mass Spectrometry
AgNPsSilver Nanoparticles
SPRSurface Plasmon Resonance
LSPRLocalized Surface Plasmon Resonance
DoEDesign of Experiment
Urine QCUrine Quality Control
LODLimit of detection

References

  1. Hetzel, B. Iodine Deficiency Disorders (IDD) and Their Eradication. Lancet 1983, 322, 1126–1129. [Google Scholar] [CrossRef]
  2. Bertinato, J.; Qiao, C.; L’Abbé, M.R. Iodine Status of Canadian Children, Adolescents, and Women of Childbearing Age. J. Nutr. 2021, 151, 3710–3717. [Google Scholar] [CrossRef]
  3. Pretell, E.A.; Pearce, E.N.; Moreno, S.A.; Dary, O.; Kupka, R.; Gizak, M.; Gorstein, J.; Grajeda, R.; Zimmermann, M.B. Elimination of Iodine Deficiency Disorders from the Americas: A Public Health Triumph. Lancet Diabetes Endocrinol. 2017, 5, 412–414. [Google Scholar] [CrossRef]
  4. International Council for Control Of Iodine Deficiency Disorders; UNICEF; World Health Organization. Assessment of Iodine Deficiency Disorders and Monitoring Their Elimination: A Guide for Programme Managers, 3rd ed.; World Health Organization: Geneva, Switzerland, 2007. [Google Scholar]
  5. Delange, F. Optimal Iodine Nutrition During pregnancy, lactation and the neonatal period. Int. J. Endocrinol. Metab. 2004, 2, 1–12. [Google Scholar]
  6. Jooste, P.L.; Strydom, E. Methods for Determination of Iodine in Urine and Salt. Best Pract. Res. Clin. Endocrinol. Metab. 2010, 24, 77–88. [Google Scholar] [CrossRef]
  7. Allain, P.; Mauras, Y.; Dougé, C.; Jaunault, L.; Delaporte, T.; Beaugrand, C. Determination of Iodine and Bromine in Plasma and Urine by Inductively Coupled Plasma Mass Spectrometry. Analyst 1990, 115, 813–815. [Google Scholar] [CrossRef]
  8. Haldimann, M.; Zimmerli, B.; Als, C.; Gerber, H. Direct Determination of Urinary Iodine by Inductively Coupled Plasma Mass Spectrometry Using Isotope Dilution with Iodine-129. Clin. Chem. 1998, 44, 817–824. [Google Scholar] [CrossRef] [PubMed]
  9. Macours, P.; Aubry, J.C.; Hauquier, B.; Boeynaems, J.M.; Goldman, S.; Moreno-Reyes, R. Determination of Urinary Iodine by Inductively Coupled Plasma Mass Spectrometry. J. Trace Elem. Med. Biol. 2008, 22, 162–165. [Google Scholar] [CrossRef]
  10. Sandell, E.B.; Kolthoff, I.M. Micro Determination of Iodine by a Catalytic Method. Mikrochim. Acta 1937, 1, 9–25. [Google Scholar] [CrossRef]
  11. Pino, S.; Fang, S.L.; Braverman, L.E. Ammonium Persulfate: A New and Safe Method for Measuring Urinary Iodine by Ammonium Persulfate Oxidation. Exp. Clin. Endocrinol. Diabetes 2009, 106, S22–S27. [Google Scholar] [CrossRef] [PubMed]
  12. Dunn, J.T.; Crutchfield, H.E.; Gutekunst, R.; Dunn, A.D. Two Simple Methods for Measuring Iodine in Urine. Thyroid. Off. J. Am. Thyroid. Assoc. 1993, 3, 119–123. [Google Scholar] [CrossRef]
  13. Lin, J.; Tan, H.-L.; Ge, H. Global, Regional, and National Burden of Iodine Deficiency in Reproductive Women from 1990 to 2019, and Projections to 2035: A Systematic Analysis for the Global Burden of Disease Study in 2019. Int. J. Womens Health 2025, 17, 1863–1875. [Google Scholar] [CrossRef]
  14. Peeling, R.W.; Holmes, K.K.; Mabey, D.; Ronald, A. Rapid Tests for Sexually Transmitted Infections (STIs): The Way Forward. Sex. Transm. Infect. 2006, 82 (Suppl. S5), v1–v6. [Google Scholar] [CrossRef]
  15. Rick, J.; Tsai, M.C.; Hwang, B. Biosensors Incorporating Bimetallic Nanoparticles. Nanomaterials 2015, 6, 5. [Google Scholar] [CrossRef]
  16. Jayanthi, V.S.P.K.S.; Das, A.B.; Saxena, U. Recent Advances in Biosensor Development for the Detection of Cancer Biomarkers. Biosens. Bioelectron. 2017, 91, 15–23. [Google Scholar] [CrossRef]
  17. Shen, L.; Hagen, J.A.; Papautsky, I. Point-of-Care Colorimetric Detection with a Smartphone. Lab A Chip 2012, 12, 4240. [Google Scholar] [CrossRef]
  18. Li, B.; Du, Y.; Dong, S. DNA Based Gold Nanoparticles Colorimetric Sensors for Sensitive and Selective Detection of Ag(I) Ions. Anal. Chim. Acta 2009, 644, 78–82. [Google Scholar] [CrossRef] [PubMed]
  19. Ling, J.; Sang, Y.; Huang, C.Z. Visual Colorimetric Detection of Berberine Hydrochloride with Silver Nanoparticles. J. Pharm. Biomed. Anal. 2008, 47, 860–864. [Google Scholar] [CrossRef] [PubMed]
  20. Hsu, M.; Cao, Y.; Wang, H.; Pan, Y.; Lee, B.; Huang, C. Time-Dependent Surface Plasmon Resonance Spectroscopy of Silver Nanoprisms in the Presence of Halide Ions. ChemPhysChem A Eur. J. Chem. Phys. Phys. Chem. 2010, 11, 1742–1748. [Google Scholar] [CrossRef] [PubMed]
  21. Gao , C.; Lu , Z.; Liu , Y.; Zhang, Q.; Chi, M.; Cheng, Q.; Yin, Y. Highly Stable Silver Nanoplates for Surface Plasmon Resonance Biosensing. Angew. Chem. Int. Ed. Engl. 2012, 51, 5629–5633. [Google Scholar] [CrossRef]
  22. Yang, X.H.; Ling, J.; Peng, J.; Cao, Q.E.; Ding, Z.T.; Bian, L.C. A Colorimetric Method for Highly Sensitive and Accurate Detection of Iodide by Finding the Critical Color in a Color Change Process Using Silver Triangular Nanoplates. Anal. Chim. Acta 2013, 798, 74–81. [Google Scholar] [CrossRef] [PubMed]
  23. Maruthupandi, M.; Chandhru, M.; Rani, S.K.; Vasimalai, N. Highly Selective Detection of Iodide in Biological, Food, and Environmental Samples Using Polymer-Capped Silver Nanoparticles: Preparation of a Paper-Based Testing Kit for On-Site Monitoring. ACS Omega 2019, 4, 11372–11379. [Google Scholar] [CrossRef]
  24. Niaz, A.; Bibi, A.; Huma, N.; Zaman, M.I.; Khan, M.; Rahim, A. Highly Selective and Ecofriendly Colorimetric Method for the Detection of Iodide Using Green Tea Synthesized Silver Nanoparticles. J. Mol. Liq. 2017, 249, 1047–1051. [Google Scholar] [CrossRef]
  25. Kaghazchi, T.; Kolur, N.A.; Sabet, R.H. Recovery of Iodine with Activated Carbon from Dilute Aqueous Solutions. Afinidad 2009, 66, 338–343. [Google Scholar]
  26. Ohashi, T.; Yamaki, M.; Pandav, C.S.; Karmarkar, M.G.; Irie, M. Simple Microplate Method for Determination of Urinary Iodine. Clin. Chem. 2000, 46, 529–536. [Google Scholar] [CrossRef]
  27. Schneider, C.A.; Rasband, W.S.; Eliceiri, K.W. NIH Image to ImageJ: 25 Years of Image Analysis. Nat. Methods 2012, 9, 671–675. [Google Scholar] [CrossRef]
  28. Sarigul, N.; Korkmaz, F.; Kurultak, İ. A New Artificial Urine Protocol to Better Imitate Human Urine. Sci. Rep. 2019, 9, 20159. [Google Scholar] [CrossRef]
  29. Taylor, E.N.; Curhan, G.C. Body Size and 24-Hour Urine Composition. Am. J. Kidney Dis. 2006, 48, 905–915. [Google Scholar] [CrossRef]
  30. Bouatra, S.; Aziat, F.; Mandal, R.; Guo, A.C.; Wilson, M.R.; Knox, C.; Bjorndahl, T.C.; Krishnamurthy, R.; Saleem, F.; Liu, P.; et al. The Human Urine Metabolome. PLoS ONE 2013, 8, e73076. [Google Scholar] [CrossRef]
  31. Cuenca, R.E.; Pories, W.J.; Bray, J. Bromine Levels in Human Serum, Urine, Hair. Biol. Trace Elem. Res. 1988, 16, 151–154. [Google Scholar] [CrossRef] [PubMed]
  32. Wang, J.; Zhang, Y.-Y.; Liu, D.; Zhong, C.-C.; Hu, Y.-H.; Zhao, F.; Guo, H.-L.; Chen, F. Rapid Determination of Urinary Oxalic Acid Concentration Aids in the Screening and Monitoring of Kidney Diseases: An LC-ESI-MS/MS Method That Does Not Require Complex Derivatization, Acidification Treatment, or Large-Volume Sample Consumption. Microchem. J. 2025, 210, 112909. [Google Scholar] [CrossRef]
  33. Torra, M.; Rodamilans, M.; Corbella, J. Serum and Urine Fluoride Concentration: Relationships to Age, Sex and Renal Function in a Non-Fluoridated Population. Sci. Total Environ. 1998, 220, 81–85. [Google Scholar] [CrossRef]
  34. Garrido, B.C.; Gustavo; Gomes, S.; Barrabin, J.S.; Padilha, M.C.; Gualberto, M. Assessing Limits of Detection in Qualitative Methods: A Simple Implementation of Logistic Regression in a Web-Based R Shiny Application Environment and Its Potential in Toxicology and Doping Control. Drug Test. Anal. 2022, 15, 66–74. [Google Scholar] [CrossRef] [PubMed]
  35. López, I.A.; Gómez, I. Halide Ion Effect in Shape Transformation from Silver Triangular Nanoprisms to Silver Nanodisks. Mater. Res. Soc. Symp. Proc. 2012, 1371, imrc11-1371. [Google Scholar] [CrossRef]
  36. Olivieri, A.C. Practical Guidelines for Reporting Results in Single- and Multi-Component Analytical Calibration: A Tutorial. Anal. Chim. Acta 2015, 868, 10–22. [Google Scholar] [CrossRef] [PubMed]
  37. Jiang, X.C.; Yu, A.B. Silver Nanoplates:  A Highly Sensitive Material toward Inorganic Anions. Langmuir 2008, 24, 4300–4309. [Google Scholar] [CrossRef]
  38. Basharzad, P.F.; Farhadi, K.; Forough, M.; Molaei, R. Silver Nanoparticles as a New Colorimetric Probe for Determination of Oxalic Acid in Urine. Sens. Lett. 2016, 14, 906–912. [Google Scholar] [CrossRef]
  39. Ravindran, A.; Singh, A.; Raichur, A.M.; Chandrasekaran, N.; Mukherjee, A. Studies on Interaction of Colloidal Ag Nanoparticles with Bovine Serum Albumin (BSA). Colloids Surf. B Biointerfaces 2010, 76, 32–37. [Google Scholar] [CrossRef]
Figure 1. Characterization of AgTNPs in combination with varying iodide concentrations: UV–visible absorption spectra and TEM images. (A) UV–vis spectra of AgTNPs with iodide 0, 75, and 200 μg I/L, using a UV–vis spectrophotometer with a quartz cuvette of 1500 µL, from 300 nm to 900 nm. (B) TEM images of AgTNPs with iodide 0 μg I/L with a triangular shape (top), 75 μg I/L with spherical shape (middle), and 200 μg I/L with fused shape (bottom). (C) AgNTP color change images after reacting with iodide 0 μg I/L blue–violet (top), 75 μg I/L pink (middle), and 200 μg I/L yellow (bottom).
Suschem 06 00029 g001
Figure 2. Effect of iodide on the crucial color conversion of AgTNPs. (A) Absorbance ratio 620/405 nm of AgNTPs vs. iodide concentration μg I/L. The experiment was performed in triplicate. The vis spectrophotometry was obtained using a microplate reader with a polypropylene 96-well plate with 350 µL in each well. The values are shown as mean ± SEM. (B) Photography of 96-well plates with AgTNPs exposed to 0, 6.25, 9.37, 12.5, 18.75, 25, 37.5, 50, 75, 100, 125, 150, 200, 300, 500, 1000 μg I/L.
Suschem 06 00029 g002
Figure 3. Effect of charcoal-stripped urine spikes with iodide on AgTNPs. (A) Comparison of absorbance ratio 620/405 nm when different iodide concentrations µg I/L in aqueous solution and in charcoal-stripped urine are added to AgTNPs solution. The experiment was performed in triplicate. The vis spectrophotometry was obtained using a microplate reader with a polypropylene 96-well plate with 350 µL in each well. The values are shown as mean ± SD. The curves were analyzed using Pearson’s correlation. (B) Photography of microplate wells with AgTNPs exposed during 1 h to 0, 25, 37.5, 75, 100, 150 μg I/L.
Suschem 06 00029 g003
Figure 4. Effect of common urine interferents on AgTNP behavior. The 620/405 nm ratio of AgTNPs when interacting with urine interferents compared to water. A 300 µL aliquot of each interferent (at maximal concentration achieved in urine) was assayed in duplicate with 50 μL of AgTNPs on a 96-well plate. The vis spectrophotometry was obtained using a microplate reader with a polypropylene 96-well plate with 350 µL in each well. Results are represented as mean ± SD ** (p = 0.0024) and **** (p > 0.0001), indicating that they differ significantly from water using ANOVA and Dunnett’s post hoc comparison test.
Suschem 06 00029 g004
Figure 5. Elimination of urine interferences using the SPE protocol. The 620/405 nm ratio of AgTNPs against urine interferents compared to water using the SPE process. (A) starting solution, (B) after activated charcoal absorption, (C) after rinsing with water, (D) after desorption. An aliquot of 300 µL of each solution was assayed with 50 μL of AgTNPs in a 96-well plate in three independent replicates. The vis spectrophotometry was obtained using a microplate reader with a polypropylene 96-well plate with 350 µL in each well. Results are represented as mean ± SD. * (p < 0.05), ** (p < 0.005), *** (p < 0.0005), and **** (p = 0.0001) indicate that they differ significantly from water using ANOVA and Dunnett’s post hoc comparison tests.
Suschem 06 00029 g005
Figure 6. Charcoal-stripped spiked urine Sandell-Kolthoff calibration curve and urine quality controls after SPE protocol. (A) Calibration curve of charcoal-stripped urine spike with different concentrations of iodide determined by Sandell-Kolthoff reaction. The vis spectrophotometry was obtained using a microplate reader with a polypropylene 96-well plate with 350 µL in each well. (B) Concentration of urine quality controls of low (68.39 µg I/L ± 5.17), medium (103.5 µg I/L ± 5.13), and high (146.2 µg I/L ± 5.5) concentration of UI measured by Sandell-Kolthoff. The values are shown as mean ± SD. The calibration curve was performed in triplicate on six different days.
Suschem 06 00029 g006
Figure 7. Efficacy of the SPE protocol combined with the use of AgTNPs to determine urine iodide. (A) Comparison of the absorbance ratio 620/405 nm of AgTNPs vs. iodide concentration µg I/L in aqueous solution and in charcoal-stripped urine. The experiment was performed in triplicate. The vis spectrophotometry was obtained using a microplate reader with a polypropylene 96-well plate with 350 µL in each well. The values are shown as mean ± SD. The curves were analyzed using Pearson’s correlation. The concentrations of the QC low, medium, and high were interpolated from the standard curve based on charcoal-stripped urine. (B) Photography of microplate wells with AgTNPs exposed during 1 h to 0, 25, 50,100, 150, 200, and 300 µg I/L, and QC low (L), medium (M), and high (H).
Suschem 06 00029 g007
Figure 8. Comparison of Sandell-Kolthoff reaction vs. AgTNPs after SPE. (A) Regression comparison of Sandell-Kolthoff reaction vs. AgTNPs after SPE using charcoal-stripped urine spiked with 50, 75, 100, and 150 μg I/L. The experiment was performed in triplicate. The values are shown as mean ± SD. (B) Bias plot of the difference between AgTNPs and Sandell-Kolthoff reaction after SPE in charcoal-stripped urine spiked with 50, 75, 100, and 150 μg I/L. The experiment was performed in triplicate. The values are shown as mean ± SD.
Suschem 06 00029 g008
Figure 9. Qualitative detection of iodide sufficiency in urine samples. Probability of detection of iodide > 100 μg I/L in human urine samples after SPE using AgTNPs and colorimetry, with 95% confidence. The UI quantitative concentration was estimated using the Sandell–Kolthoff reaction. Each sample was assayed six times (n = 20).
Suschem 06 00029 g009
Table 1. Full factorial design for SPE protocol optimization. The design was carried out based on four variables at 5 levels. Variables included A: activated charcoal solution volume, B: time of absorption, C: pH of the eluent solution, D: eluent’s equilibration time. Response: % of iodide recovery.
Variable 1Variable 2Variable 3Variable 4Response
RunA: Charcoal Solution Volume (μL)B: Absorption Time (min)C: Eluent pHD: Eluent’s Equilibration Time (min)Iodide Recovery (%)
12750369.518089.41
225001211.530074.39
330006011.56093.51
43000607.56013.43
5275029.518090.98
625001211.56072.23
730001211.56095.31
830006011.530096.39
92750369.518093.21
102500127.530013.79
1125006011.530072.59
123000127.530016.32
132750709.518088.46
142500127.56012.35
152750369.535059.24
1630001211.530097.11
173104369.518092.82
182500607.530011.99
192750366.671801.17
202396369.518074.75
2125006011.56070.78
222750369.518092.79
232500607.56010.55
242750369.51027.50
2527503612.3318095.31
263000607.530014.87
272750369.518092.80
283000127.56015.23
Table 2. Intra-assay and inter-assay precision of urine quality control samples after SPE. Reproducibility was evaluated by analyzing replicates of urine quality control samples after SPE containing low, medium, and high concentrations of iodide on the same day (three replicates: intraday reproducibility) and on six consecutive days (interday reproducibility).
Quality Controls After SPE Concentration (µg I/L)Intraday (n = 3)Interday (n = 6)
Mean ± SD (µg I/L)CV (%)Mean ± SD (µg I/L)CV (%)
Low68.40 ± 3.104.568.39 ± 1.091.6
Medium102.59 ± 3.103.0103.45 ± 0.650.6
High146.03 ± 4.673.2146.25 ± 0.880.6
Disclaimer/Publisher’s Note: The statements, opinions and data contained in all publications are solely those of the individual author(s) and contributor(s) and not of MDPI and/or the editor(s). MDPI and/or the editor(s) disclaim responsibility for any injury to people or property resulting from any ideas, methods, instructions or products referred to in the content.