
Food Waste Digestate-Based Biorefinery Approach for Rhamnolipids Production: A Techno-Economic Analysis

 ,
,  ,
, 
Abstract
1. Introduction
2. Materials and Methods
2.1. Simulation Description
2.2. Process Description
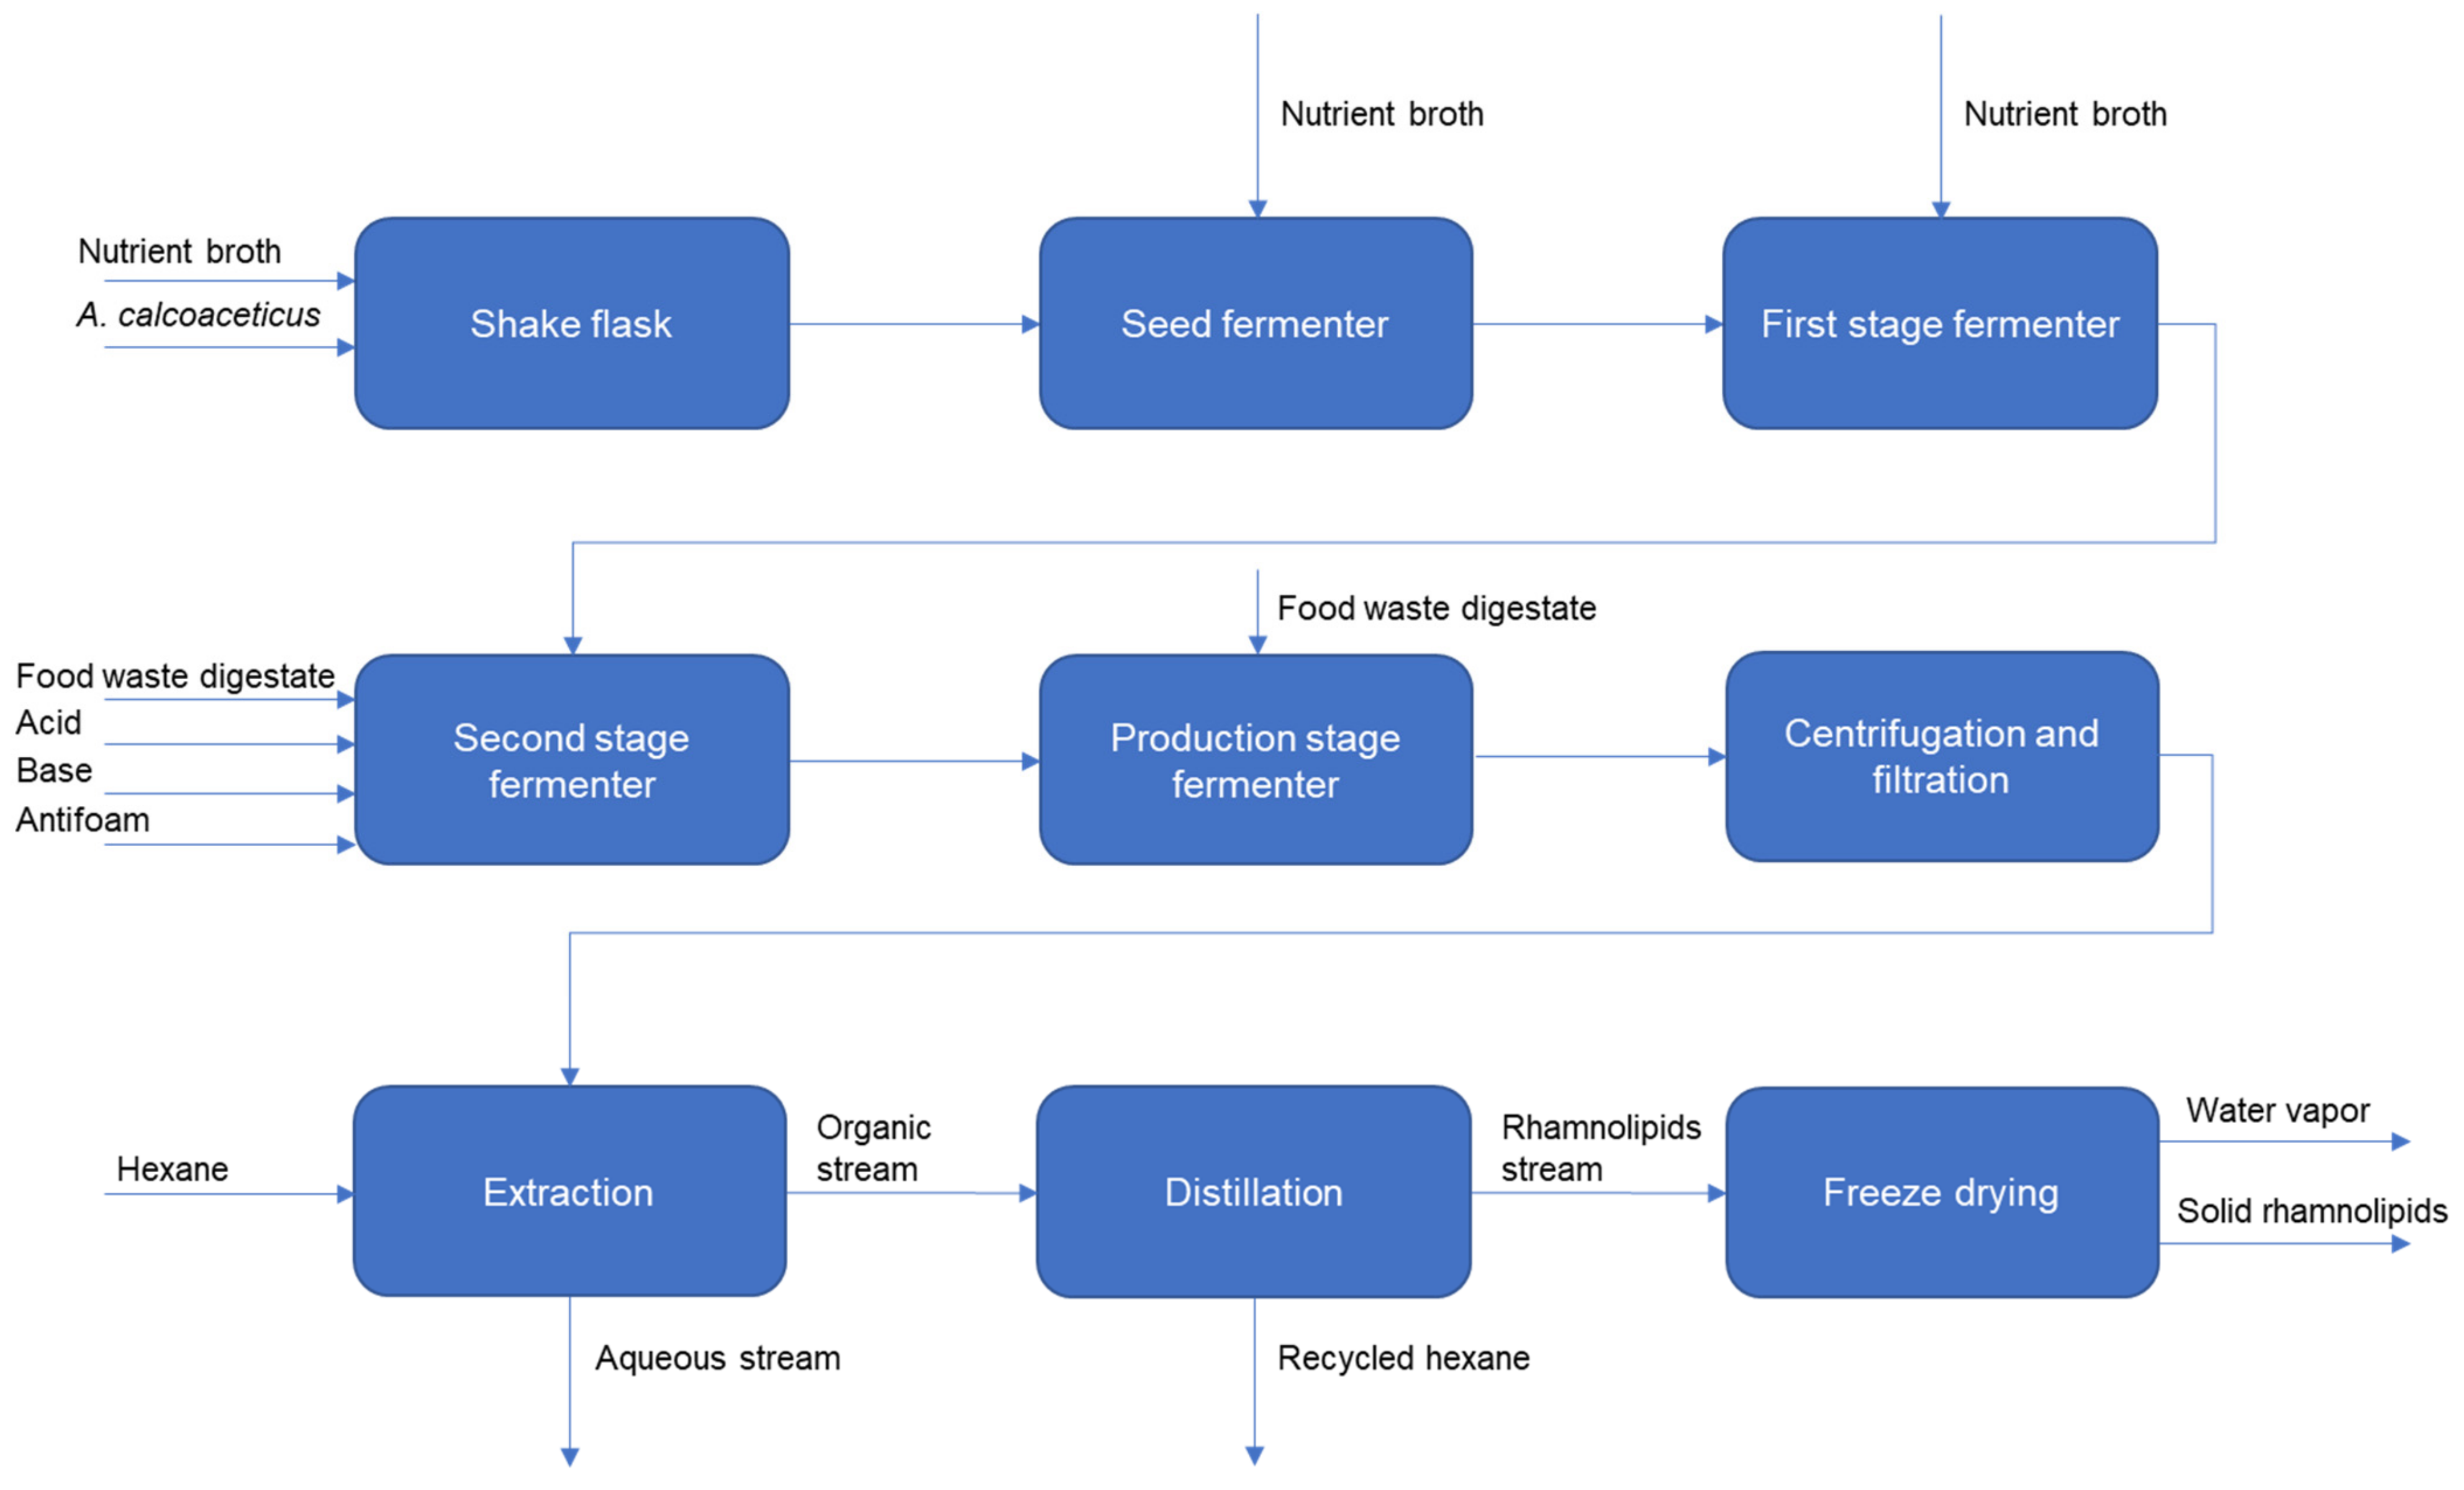
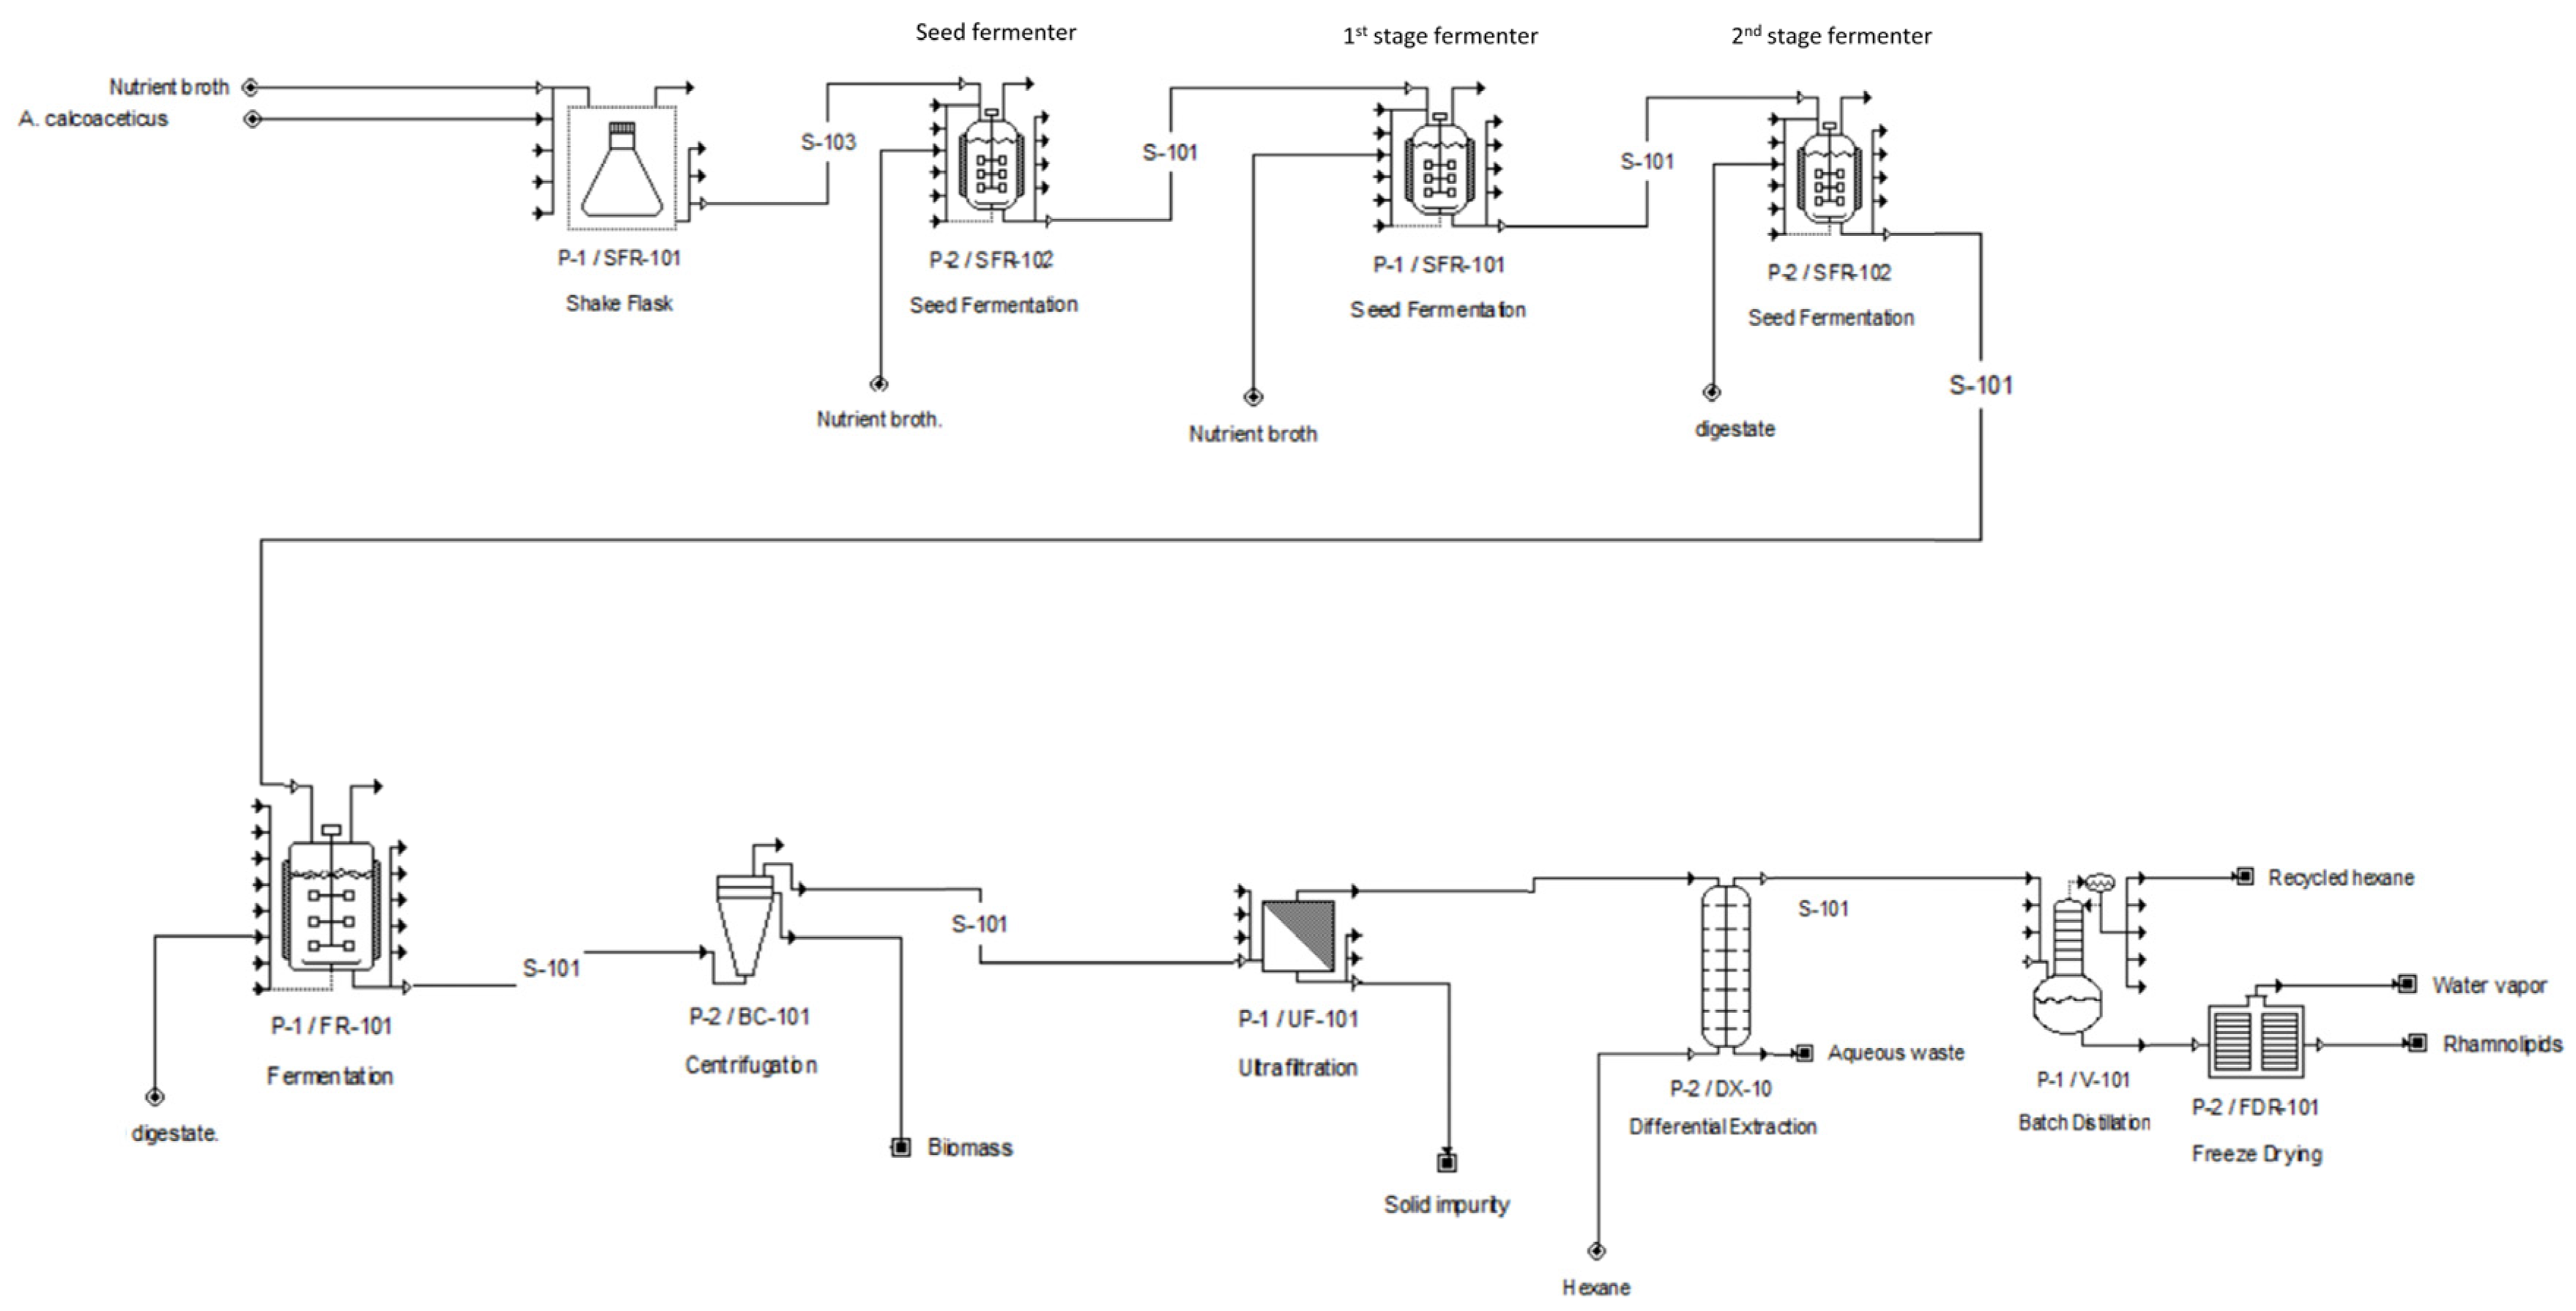
2.2.1. Rhamnolipids Production Process

| Items | Estimation Assumption |
|---|---|
| Plant location | Hong Kong or other GBA core city |
| Plant capacity | Depends on processing time per batch of each scenario |
| Annual production time | 7884 operating hours per year |
| Feedstock | Food waste digestate from EPD, Hong Kong (without any pretreatment) |
| Main products | Rhamnolipids (50% purity) |
| Mass balance | |
| Fermentation yield | 10 g rhamnolipids L−1 food waste digestate |
| Rhamnolipids recovery | 100% by weight |
| Rhamnolipids purity | Rhamnolipids product is sold at 50% purity by weight |
| Processing time per batch * | |
| Scenario I | 52.8 h |
| Scenario II | 60.4 h # |
| Scenario III | 50.0 h # |
| Total capital investment (TCI) | |
| Direct costs (DC) | |
| Total equipment cost (TEC) | 1.00 TEC |
| Installation | 0.74 TEC |
| Instrumentation and control | 0.43 TEC |
| Piping and insulation | 0.40 TEC |
| Electrical system | 0.13 TEC |
| Buildings | 0.47 TEC |
| Service facilities | 0.85 TEC |
| Land acquisition | 0.06 TEC |
| Yard improvement | 0.15 TEC |
| Indirect costs (IC) | |
| Engineering and supervision | 0.34 TEC |
| Construction and legal expenses | 0.42 TEC |
| Total direct and indirect costs (TDIC) | DC + IC = 4.99 TEC |
| Contractor’s fee | 0.05 TDIC = 0.18 TEC |
| Contingency | 0.10 TDIC = 0.36 TEC |
| Fixed capital investment (FCI) | DC + IC = 5.53 TEC |
| Working capital (WC) | 15% TCI = 0.98 TEC |
| Total capital investment (TCI) | FCI + WC = 6.51 TEC |
| Rhamnolipids production cost (RLPC) | |
| Raw material cost | USD 7.64 kg−1 rhamnolipids (from mass balance and known unit price) |
| Utility | Electricity (USD 0.122 kW−1 h−1), steam (USD 12.00 MT−1), and cooling water (USD 0.03 m−3) |
| Operating labor | According to Peters and Timmerhaus (2003) [19], Ulrich (1984) [20] |
| Direct supervisory and clerical labor | 15% of operating labor |
| Maintenance and repairs | 4% of fixed capital investment (FCI) |
| Operating supplies | 15% of maintenance and repairs |
| Laboratory charges | 15% of operating labor |
| Patent and royalties | 3% of total product cost |
| Depreciation | Straight-line depreciation over 15-year lifetime |
| Local taxes and insurance | 2% of fixed capital investment (FCI) |
| Plant overhead costs | 60% of labor, supervision, and maintenance |
| Administrative costs | 15% of labor, supervision, and maintenance |
| Research and Development Costs (R&D) | 3% of revenue |
| Distribution and marketing costs | 14% of total product cost |
| Contingency | 3% of total product cost |
| Logistic cost | Approved by Government |
| Revenue | |
| Rhamnolipids (50% purity) | USD 225 kg−1 |
2.2.2. Scenarios Assessed in This Study
- One each for the three seed fermenters with half size as in Scenario I i.e., 0.175, 1.75, and 17.5 m3)
- Two small-scale fermenters for production stage with half size as in Scenario I i.e., 175 m3 each.
- Two each for the three seed fermenters with half size as in Scenario I i.e., 0.175, 1.75, and 17.5 m3.
- Two small-scale fermenters for production stage with half size as in Scenario I i.e., 175 m3 each.
2.2.3. Estimation of Processing Time per Batch in Each Scenario
2.3. Economic Evaluation
2.3.1. Total Capital Investment Estimation
2.3.2. Rhamnolipids Production Cost Estimation
2.3.3. Revenue
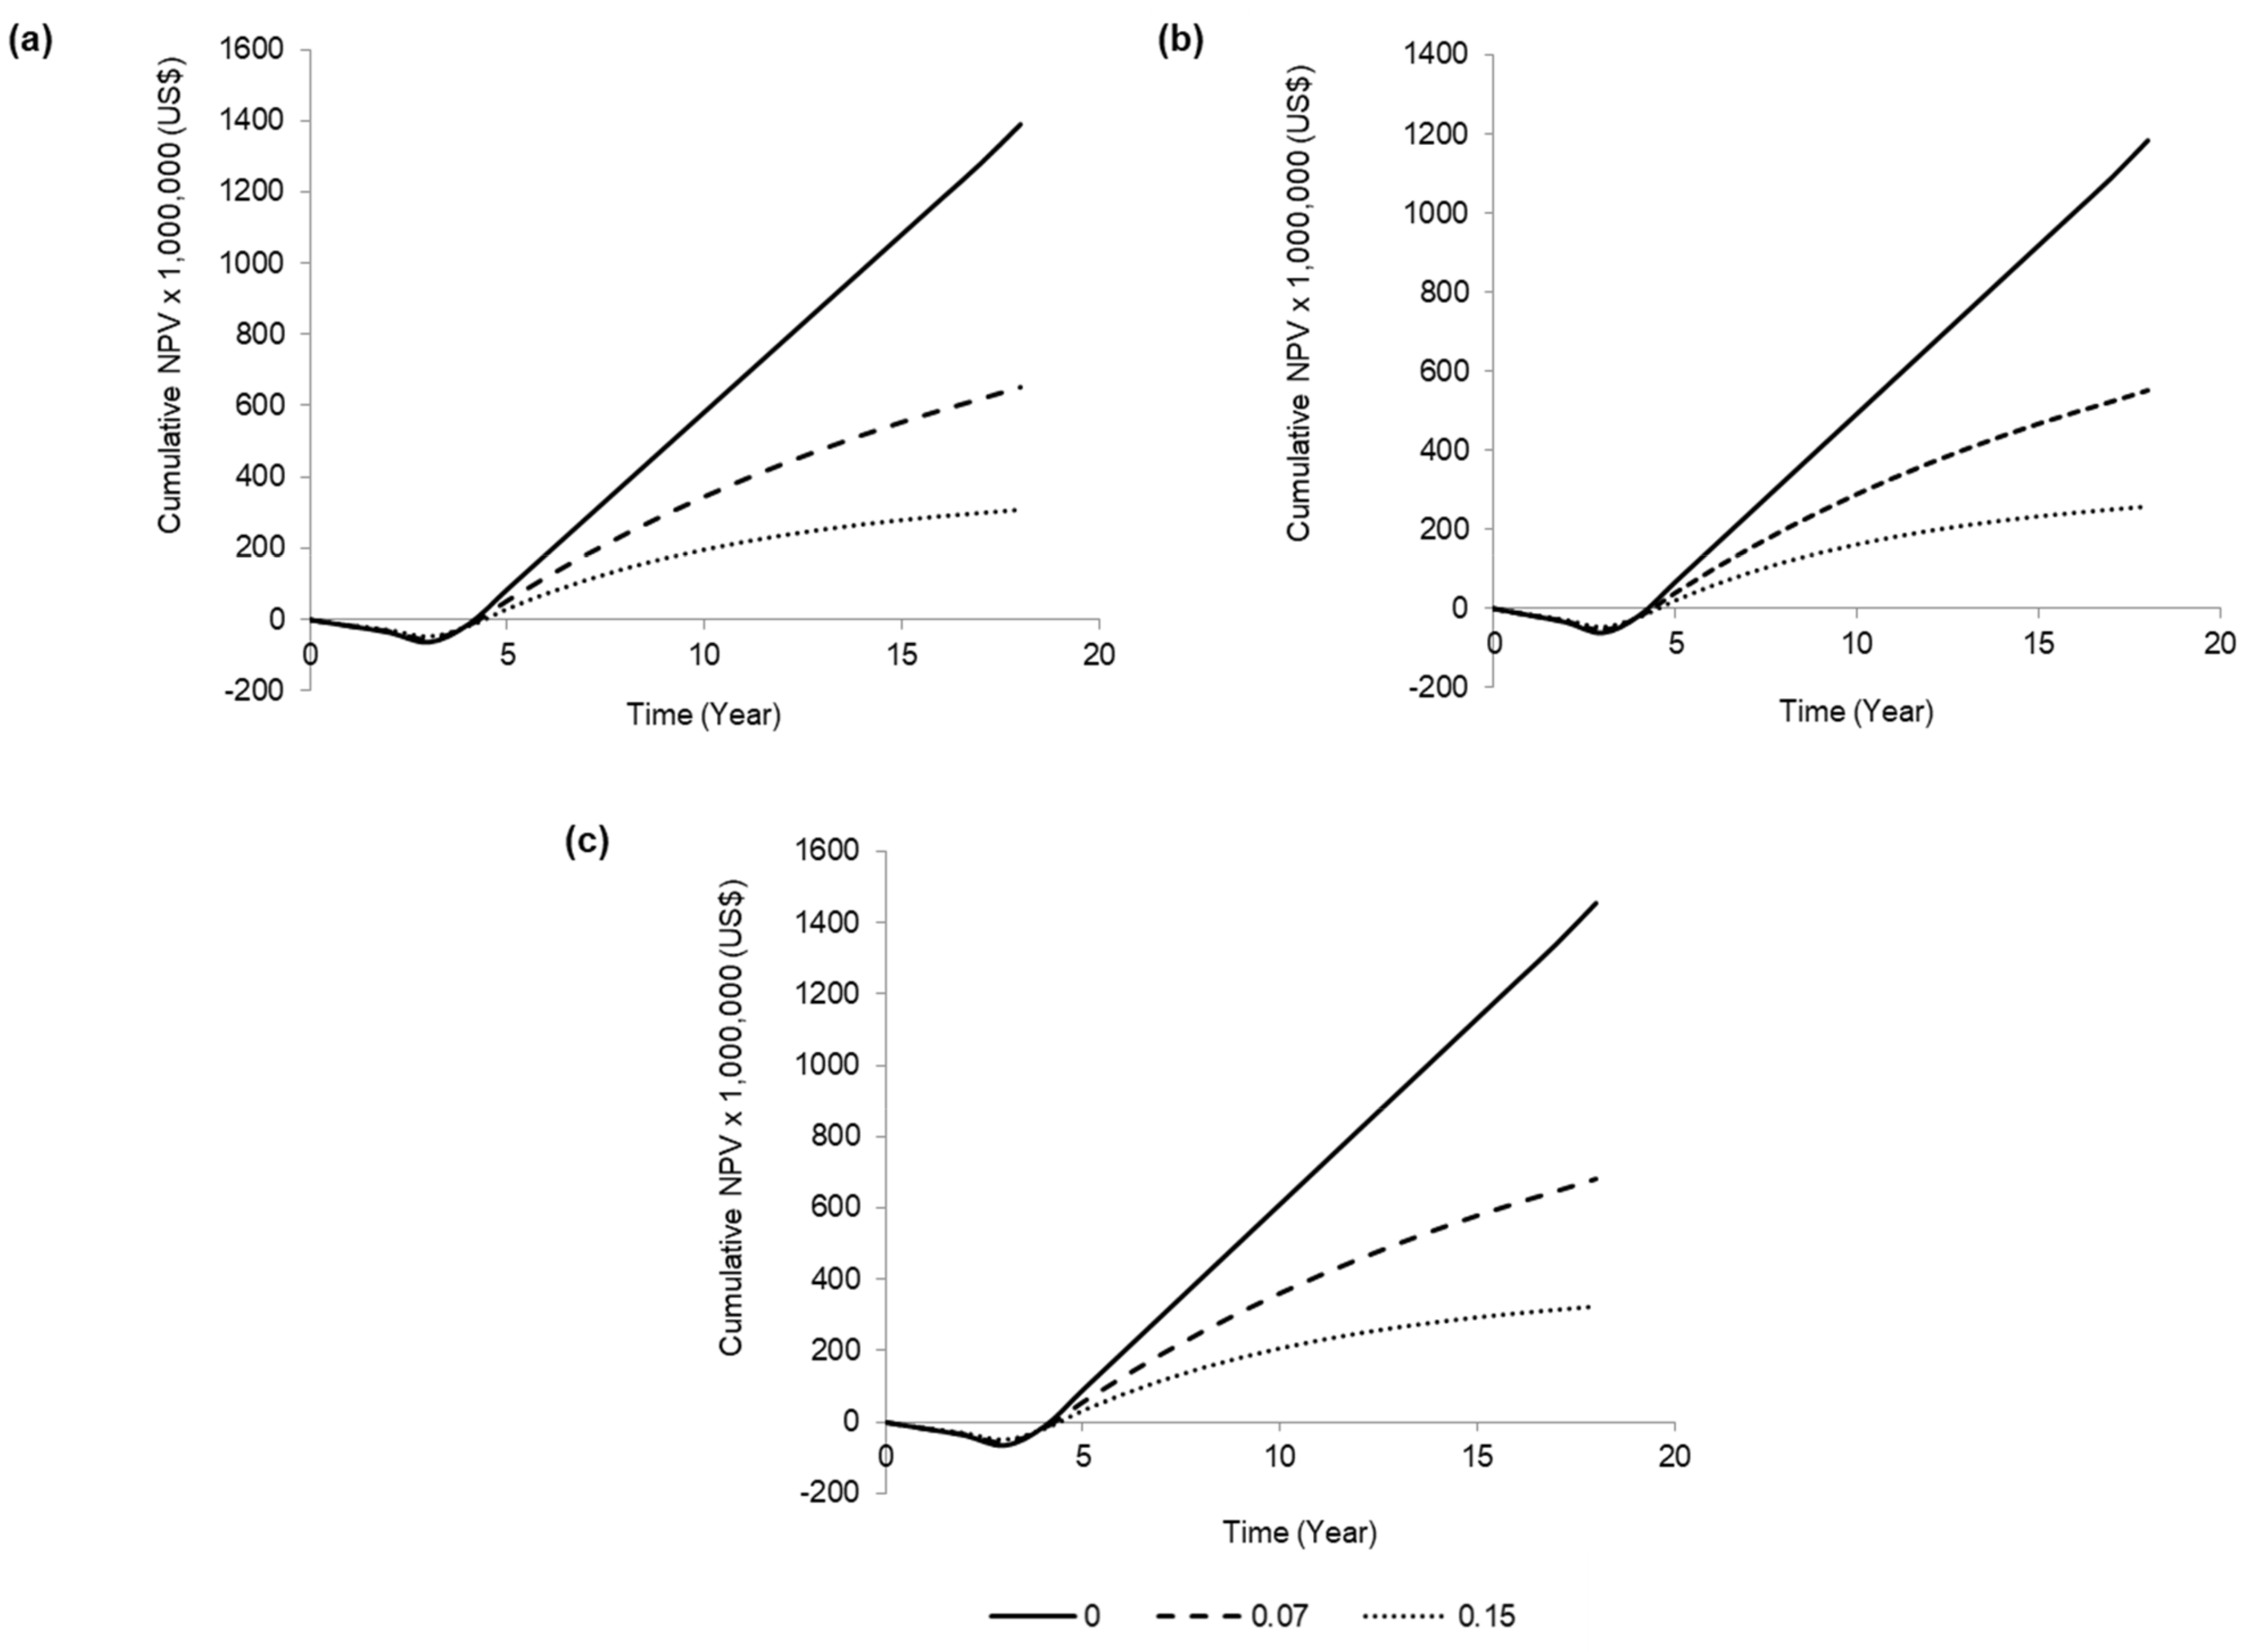
2.3.4. Profitability Analysis
2.3.5. Sensitivity Analysis
3. Results and Discussion
3.1. Mass Balance
3.2. Total Capital Investment
3.3. Rhamnolipids Production Cost, Revenue, and Profitability Analysis
3.4. Sensitivity Analysis
3.5. Comparison with Previous Work in Literature
4. Conclusions
Supplementary Materials
Author Contributions
Funding
Institutional Review Board Statement
Informed Consent Statement
Data Availability Statement
Conflicts of Interest
References
- Maddaloni, M.; Vassalini, I.; Alessandri, I. Green Routes for the Development of Chitin/Chitosan Sustainable Hydrogels. Sustain. Chem. 2020, 1, 325–344. [Google Scholar] [CrossRef]
- Gustavsson, J.; Cederberg, C.; Sonesson, U.; van Otterdijk, R.; Meybeck, A. Global Food Losses and Food Waste—Extent, Causes and Prevention; Food and Agriculture Organization of the United Nations: Rome, Italy, 2011. [Google Scholar]
- Wong, J.W.C.; Kaur, G.; Mehariya, S.; Karthikeyan, O.P.; Chen, G. Food waste treatment by anaerobic co-digestion with saline sludge and its implications for energy recovery in Hong Kong. Bioresour. Technol. 2018, 268, 824–828. [Google Scholar] [CrossRef] [PubMed]
- Waste & Resources Action Programme. Anaerobic Digestate—Financial Impact Assessment. Available online: http://www.organics-recycling.org.uk/uploads/category1060/Financial_impact_assessment_for_anaerobic_digestate.pdf (accessed on 3 February 2020).
- Kaur, G.; Wong, J.W.C.; Kumar, R.; Patria, R.D.; Bhardwaj, A.; Uisan, K.; Johnravindar, D. Value Addition of Anaerobic Digestate from Biowaste: Thinking Beyond Agriculture. Curr. Sustain. Renew. Energy Rep. 2020, 7, 48–55. [Google Scholar] [CrossRef]
- Cerda, A.; Mejias, L.; Rodríguez, P.; Rodríguez, A.; Artola, A.; Font, X.; Gea, T.; Sánchez, A. Valorisation of digestate from biowaste through solid-state fermentation to obtain value added bioproducts: A first approach. Bioresour. Technol. 2019, 271, 409–416. [Google Scholar] [CrossRef] [PubMed]
- Cesaro, A. The valorization of the anaerobic digestate from the organic fractions of municipal solid waste: Challenges and perspectives. J. Environ. Manag. 2021, 280, 111742. [Google Scholar] [CrossRef] [PubMed]
- Kaur, G.; Wong, J.W.C. Method for production of rhamnolipids. 16/843,976 (2020).
- Abdel-Mawgoud, A.M.; Lépine, F.; Déziel, E. Rhamnolipids: Diversity of structures, microbial origins and roles. Appl. Microbiol. Biotechnol. 2010, 86, 1323–1336. [Google Scholar] [CrossRef] [PubMed]
- Sekhon Randhawa, K.K.; Rahman, P.K.S.M. Rhamnolipid biosurfactants-past, present, and future scenario of global market. Front. Microbiol. 2014, 5, 454. [Google Scholar] [CrossRef] [PubMed]
- Kwan, T.H.; Hu, Y.; Lin, C.S.K. Techno-economic analysis of a food waste valorisation process for lactic acid, lactide and poly(lactic acid) production. J. Clean. Prod. 2018, 181, 72–87. [Google Scholar] [CrossRef]
- Wang, H.; Tsang, C.W.; To, M.H.; Kaur, G.; Roelants, S.; Stevens, C.V.; Soetaert, W.; Lin, C.S.K. Techno-economic evaluation of a biorefinery applying food waste for sophorolipid production—A case study for Hong Kong. Bioresour. Technol. 2020, 303, 122852. [Google Scholar] [CrossRef] [PubMed]
- Hong Kong Environment Bureau. A Food Waste & Yard Waste Plan for Hong Kong 2014–2022; Hong Kong Environment Bureau: Hong Kong, China, 2014.
- Wong, J.; Zhao, Z.; Zheng, G. Biosurfactants from Acinetobacter calcoaceticus BU03 Enhance the Bioavailability and Biodegradation of Polycyclic Aromatic Hydrocarbons. In Proceedings of the Annual International Conference on Soils, Sediments, Water and Energy, Amherst, MA, USA, 18–21 October 2010; Volume 15. [Google Scholar]
- Zhao, Z.; Wong, J. Biosurfactants from Acinetobacter calcoaceticus BU03 enhance the solubility and biodegradation of phenanthrene. Environ. Technol. 2009, 30, 291–299. [Google Scholar] [CrossRef] [PubMed]
- El-Housseiny, G.S.; Aboulwafa, M.M.; Aboshanab, K.A.; Hassouna, N.A.H. Optimization of Rhamnolipid Production by P. aeruginosa Isolate P6. J. Surfactants Deterg. 2016, 19, 943–955. [Google Scholar] [CrossRef]
- Müller, M.; Hörmann, B.; Syldatk, C.; Hausmann, R. Pseudomonas aeruginosa PAO1 as a model for rhamnolipid production in bioreactor systems. Appl. Microbiol. Biotechnol. 2010, 87, 167–174. [Google Scholar] [CrossRef] [PubMed]
- Zhou, C.; Sha, R.; Long, X.; Meng, Q. Extraction Separation of Rhamnolipids by n-Hexane via Forming Reverse Micelles. J. Surfactants Deterg. 2020, 23, 883–889. [Google Scholar] [CrossRef]
- Peters, M.S.; Timmerhaus, K.D. Cost estimation. In Plant Design and Economics for Chemical Engineers, 5th ed.; Hill, M., Ed.; McGraw Hill: New York, NY, USA, 2003. [Google Scholar]
- Ulrich, G.D. Chemical Engineering Process Design and Economics: A Practical Guide; Process Publishing: New Hampshire, NH, USA, 2004. [Google Scholar]
- Humbird, D.; Davis, R.; Tao, L.; Kinchin, C.; Hsu, D.; Aden, A.; Schoen, P.; Lukas, J.; Olthof, B.; Worley, M.; et al. Process Design and Economics for Biochemical Conversion of Lignocellulosic Biomass to Ethanol; NREL/TP-5100-47764; National Renewable Energy Laboratory: Colorado, CO, USA, 2011.
- Daqing E-Shine Chemical Co. N-hexane Price. Available online: http://product.lookchem.com/item/899/N-hexane-price.html (accessed on 25 April 2020).
- Fukushima, Y. Caustic Soda Prices on Upward Trend in Asian Markets; Nikkei: Tokyo, Japan, 2016. [Google Scholar]
- Kemcore. Hydrochloric Acid 35%. Available online: https://www.kemcore.com/hydrochloric-acid-35.html (accessed on 25 April 2020).
- Omtex Chem. Silicone Antifoams. Available online: https://www.omtexchem.com/silicone-antifoams.html (accessed on 25 April 2020).
- Research Products International. Nutrient Broth—5 Kilograms. Available online: https://www.rpicorp.com/ (accessed on 25 April 2020).
- Liu, Y.; Zhou, G.; Li, X. Research on energy consumption in actual production of vacuum freeze-dried garlic slice. Trans. Chin. Soc. Agric. Eng. 2014, 30, 242–247. [Google Scholar] [CrossRef]
- Payscale. Average Chemical Engineer Salary in Hong Kong. Available online: https://www.payscale.com/research/HK/Job=Chemical_Engineer/Salary (accessed on 25 April 2020).
- Natsurfact. Making Surfactants Cleaner and Greener. Available online: https://natsurfact.com/ (accessed on 14 March 2020).
- Chong, H.; Li, Q. Microbial production of rhamnolipids: Opportunities, challenges and strategies. Microb. Cell Factories 2017, 16, 137. [Google Scholar] [CrossRef] [PubMed]
- Lotfabad, T.B.; Ebadipour, N.; RoostaAzad, R. Evaluation of a recycling bioreactor for biosurfactant production byPseudomonas aeruginosaMR01 using soybean oil waste. J. Chem. Technol. Biotechnol. 2016, 91, 1368–1377. [Google Scholar] [CrossRef]
- Czinkóczky, R.; Németh, Á. Techno-economic assessment of Bacillus fermentation to produce surfactin and lichenysin. Biochem. Eng. J. 2020, 163, 107719. [Google Scholar] [CrossRef]


| Category | Cost (USD) for Each Scenario | ||
|---|---|---|---|
| I | II | III | |
| Raw material cost | $2,394,826.55 | $2,095,076.89 | $ 2,530,852.69 |
| Utility | $1,644,548.23 | $1,464,007.31 | $1,725,799.68 |
| Operating labor | $508,989.02 | $743,096.77 | $897,660.89 |
| Direct supervisory and clerical labor | $76,348.35 | $111,464.51 | $134,649.13 |
| Maintenance and repairs | $2,137,872.40 | $2,138,482.44 | $2,302,209.21 |
| Operating supplies | $320,680.86 | $320,772.37 | $345,331.38 |
| Laboratory charges | $76,348.35 | $111,464.51 | $134,649.13 |
| Patent and royalties | $677,401.49 | $656,644.41 | $745,229.64 |
| Depreciation | $3,563,120.67 | $3,511,603.04 | $3,679,416.21 |
| Local taxes and insurance | $1,068,936.20 | $1,069,241.22 | $1,151,104.60 |
| Plant overhead costs | $1,633,925.87 | $1,795,826.23 | $ 2,000,711.54 |
| Administrative costs | $408,481.47 | $448,956.56 | $500,177.88 |
| Research and Development Costs | $4,229,961.75 | $3,700,525.77 | $4,470,227.99 |
| Distribution and marketing costs | $3,161,206.95 | $3,064,340.58 | $3,477,738.31 |
| Contingency | $677,401.49 | $656,644.41 | $745,229.64 |
| Annual rhamnolipid production cost (RLPC) | $22,580,049.65 | $21,888,147.01 | $24,840,987.94 |
| Annual production capacity of 50% purity rhamnolipids (kg/year) | 626,661.00 | 548,226.04 | 662,256.00 |
| Selling price of 50% purity rhamnolipids syrup (per kg) | $225.00 | $225.00 | $225.00 |
| Annual revenue | $140,998,725.00 | $123,350,858.90 | $149,007,599.70 |
| Gross profit | $118,418,675.35 | $101,462,711.89 | $124,166,611.72 |
| Net profit | $99,467,508.83 | $84,721,364.43 | $104,286,224.46 |
| Minimum selling price of 50% purity rhamnolipids (per kg) | $36.03 | $39.93 | $37.51 |
| Cumulative net present value (NPV) | $650,138,355.00 | $550,959,551.42 | $682,447,441.37 |
| Internal rate of return (%) | 60.1 | 54.7 | 60.8 |
| (a) Effect of cost of digestate and rhamnolipids selling price. | ||
| Cost of Digestate (USD/L) * | Cumulative NPV | IRR |
| −0.012 | $652,906,409.43 | 60.30% |
| −0.006 | $651,522,382.22 | 60.20% |
| 0 | $650,138,355.00 | 60.10% |
| 0.006 | $648,754,327.79 | 60.10% |
| 0.012 | $647,370,300.58 | 60.00% |
| Selling price of 50% rhamnolipids (USD/kg) | Cumulative NPV | IRR |
| 70 | $78,074,340.60 | 7.10% |
| 120 | $262,611,119.44 | 32.00% |
| 175 | $472,521,705.37 | 49.00% |
| 200 | $561,330,030.19 | 54.80% |
| 225 | $650,138,355.00 | 60.10% |
| 250 | $738,946,679.82 | 65.10% |
| 275 | $827,755,004.64 | 69.70% |
| (b) Impact of different annual production capacity. | ||
| Annual Production Capacity (%) | Cumulative NPV | IRR |
| 80 | $505,914,883.23 | 54.40% |
| 90 | $577,934,305.30 | 57.50% |
| 100 | $650,138,355.00 | 60.10% |
| 110 | $722,502,713.66 | 62.60% |
| 120 | $795,008,175.09 | 64.80% |
| (c) Influence of percentage of hexane recyclability and land rent cost. | ||
| Hexane recyclability | Cumulative NPV | IRR |
| 99% hexane recycled | $650,138,355.00 | 60.10% |
| 75% hexane recycled | $595,281,052.49 | 56.90% |
| 56% hexane recycled | $551,852,354.66 | 54.20% |
| 50% hexane recycled | $538,138,029.03 | 53.30% |
| 25% hexane recycled | $480,995,005.57 | 49.50% |
| No hexane recycled | $448,227,494.97 | 54.20% |
| Land rent cost | Cumulative NPV | IRR |
| Paid rent for land | $650,138,355.00 | 60.10% |
| Rent-free land | $651,717,090.95 | 60.80% |
Publisher’s Note: MDPI stays neutral with regard to jurisdictional claims in published maps and institutional affiliations. |
© 2021 by the authors. Licensee MDPI, Basel, Switzerland. This article is an open access article distributed under the terms and conditions of the Creative Commons Attribution (CC BY) license (https://creativecommons.org/licenses/by/4.0/).
Share and Cite
Patria, R.D.; Wong, J.W.C.; Johnravindar, D.; Uisan, K.; Kumar, R.; Kaur, G. Food Waste Digestate-Based Biorefinery Approach for Rhamnolipids Production: A Techno-Economic Analysis. Sustain. Chem. 2021, 2, 237-253. https://doi.org/10.3390/suschem2020014
Patria RD, Wong JWC, Johnravindar D, Uisan K, Kumar R, Kaur G. Food Waste Digestate-Based Biorefinery Approach for Rhamnolipids Production: A Techno-Economic Analysis. Sustainable Chemistry. 2021; 2(2):237-253. https://doi.org/10.3390/suschem2020014
Chicago/Turabian StylePatria, Raffel Dharma, Jonathan W. C. Wong, Davidraj Johnravindar, Kristiadi Uisan, Rajat Kumar, and Guneet Kaur. 2021. "Food Waste Digestate-Based Biorefinery Approach for Rhamnolipids Production: A Techno-Economic Analysis" Sustainable Chemistry 2, no. 2: 237-253. https://doi.org/10.3390/suschem2020014
APA StylePatria, R. D., Wong, J. W. C., Johnravindar, D., Uisan, K., Kumar, R., & Kaur, G. (2021). Food Waste Digestate-Based Biorefinery Approach for Rhamnolipids Production: A Techno-Economic Analysis. Sustainable Chemistry, 2(2), 237-253. https://doi.org/10.3390/suschem2020014