Technical Note

Three-Dimensional Imaging of Plant Cell Wall Deconstruction Using Fluorescence Confocal Microscopy

1
INRAE, FARE, UMR A 614, Université de Reims Champagne Ardenne, 51097 Reims, France
2
Platform of Cellular and Tissular Imaging (PICT), Université de Reims Champagne Ardenne, 51097 Reims, France
*
Author to whom correspondence should be addressed.
Sustain. Chem. 2020, 1(2), 75-85; https://doi.org/10.3390/suschem1020007
Submission received: 19 May 2020 / Revised: 27 July 2020 / Accepted: 30 July 2020 / Published: 30 July 2020

Abstract

:
Lignocellulosic biomass (LB) is recalcitrant to enzymatic hydrolysis due to its compact and complex cell wall structure. To identify the parameters behind LB recalcitrance, experimental data over hydrolysis time must be collected. Here, we describe a novel method to collect time-lapse images during cell wall deconstruction by enzymatic hydrolysis. The protocol includes instructions for sample preparation, layout of a custom designed incubation chamber and instructions for confocal time lapse acquisition. The protocol sets out a detailed plan where cross-sections of untreated and pretreated poplar samples are mounted in a sealed frame containing a buffer and an enzymatic cocktail. The sealed frame is then placed into an incubator to maintain the sample at a constant temperature of 50 °C, which is optimal for enzymatic reaction while avoiding enzymatic cocktail evaporation. Using lignin natural autofluorescence, confocal z-stacks of untreated and pretreated samples were acquired at regular time intervals during enzymatic hydrolysis for 24 h. Acquisition parameters were optimized to compromise between image resolution and reduced photo-bleaching. The acquired image might then be processed by further development of algorithms to extract precise quantitative information on cell wall deconstruction. This protocol is an important first step towards elucidating the underlying parameters of LB recalcitrance by allowing the acquisition of high-quality images of LB hydrolysis for extracting quantitative data on LB deconstruction.

1. Introduction

Climate change and fast depletion of fossil sources, due to increasing demand for energy and overexploitation of ecosystems [1,2], have motivated our modern society to develop processes using renewable biomass as a feedstock to produce bio-based chemicals, energy and materials. Lignocellulosic biomass (LB) is the most abundant renewable carbon resource on Earth [3], a major component of agricultural wastes (cereal straws), forest residues (wood) and dedicated crops (grasses) which does not compete with soil usage for food and feed crops. LB is mainly composed of carbohydrate polymers—cellulose and hemicelluloses—and of a highly branched phenylpropanoid polymer—lignin. However, the valorization of LB remains a challenge because of its complex structure and chemical composition, which makes it naturally recalcitrant to enzymatic degradation [4]. Despite extensive research on identifying the chemical and structural parameters underlying LB recalcitrance, such as lignin content [5], cellulose crystallinity [6], degree of polymerization [7] and porosity [8], the identified parameters are not universal, but rather, specific to the biomass species and pretreatment type. Moreover, structural parameters at cellular and tissular scale have not been investigated. This is mainly due to technical challenges in acquiring three-dimensional (3D) images over a conversion time suitable for extracting quantitative data on LB deconstruction. In this paper, we set up an imaging protocol to acquire a 3D confocal time series of poplar samples during enzymatic deconstruction appropriate for conducting a quantitative analysis of LB deconstruction. To demonstrate the benefits of the protocol for conducting a quantitative study of LB deconstruction, we show how a quantitative method using image segmentation and tracking can extract information at the tissular scale. Similar approaches have previously allowed the establishment of computational frameworks, leading to significant advances in multicellular plant and animal organisms [9,10]. Therefore, our imaging protocol can be a foundation to understanding hydrolysis at the yet little-explored tissular scale with unprecedented detail.

2. Experimental Design

2.1. Materials

  • Acetic acid (Carlo Ebra, Barcelona, Spain, 401422)
  • Citric acid (Merck, Darmstadt, Germany, 60910)
  • Sodium citrate (Fluka, 71183)
  • Monobasic sodium phosphate (Sigma, St. Louis, MO, USA, 71500)
  • Dibasic sodium phosphate (Sigma Aldrich, St. Louis, MO, USA, S2002)
  • Ethanol (VWR Prolabo, 2082132)
  • Sulphuric acid (Carlo Erba, SDS, 410301)
  • Glycerol (sigma ALDRICH, 9012)
  • Sodium acetate (Sigma, W302406)
  • Cellic® CTec2 (Novozymes A/S Bagsværd, Denmark)
  • Azide sodium (Sigma Aldrich, 769320)

2.2. Equipment

  • Confocal laser scanning microscope (Leica TCS SP8 inverted, Wetzlar, Germany) equipped with a laser diode at 405 nm
  • Oil immersion objective 63× with a N.A. = 1.4 (Leica, Germany)
  • Sliding microtome (Stemi 1000, Zeiss, Oberkochen, Germany)
  • Lauda heater (oil bath) (Lauda-Königshofen, Germany)
  • Petri dish 35 mm × 10 mm (Greiner Bio-one, Frickenhausen, Germany)
  • Spectrophotometer (Shimadzu UV 2401PC, Kyoto, Japan)
  • Microscope adapted incubator chamber (H301-Mini-OKOLab, Pozzuoli, Italy)
  • Weight balance (Mettler Teledo PE 2000, Columbus, OH, USA)
  • Vacuum pump (Vacuubrand 1C, Wertheim, Germany)
  • Poplar blocks (Poplus nigra x deltoides, INRA Estrées-Mons, France)
  • Filter paper Whatman (1001090)
  • Razor blade (Agar Scientific, Stansted, UK)
  • Teflon cups and covers (Parr, Moline, IL, USA)
  • Mineralization bombs (Parr, USA)
  • Microtome blade (Agar Scientific, UK)
  • Gene frame® 65 µL (Thermo Scientific, Waltham, MA, USA)
  • Microscopy cover glass (MARIENFELD®, Lauda-Königshofen, Germany, NO. 1.5H)
  • Microscopy slide (Starfrost®, Braunschweig, Germany)
  • Lens cleaning tissue (Fisher Scientific)
  • Vacuum dessicator (Fisher Scientific)
  • Brush

2.3. Software

Software tool to compute the signal loss due to photobleaching (Scripts are available at the FARE Laboratory Gitlab Repository https://gitlab.com/farelab/teamyr/publications/zoghlami_et_al_sus_chem_2020).

3. Procedure

Below, “PAUSE STEP” indicates some critical technical details used to apply the procedure correctly.

3.1. Reagent Setup

  • Buffer: sodium citrate buffer (0.05 M, pH 5). Weigh 21.01 g of citric acid and dissolve in 1000 mL. Weigh 29.41 g of sodium citrate and dissolve in 1000 mL of ultrapure water. Mix 205 mL of 0.1 M solution of citric acid and 295 mL of 0.1 M solution of sodium citrate. Adjust the final volume with ultrapure water volume to 1000 mL.
  • Buffer: sodium acetate buffer (0.05 M, pH 5). Weight 5.77 g of acetic acid and dissolve in 1000 mL. Weigh 8.2 g of sodium citrate and dissolve in 1000 mL of ultrapure water. Mix 148 mL of the 0.1 M solution of acetic acid and 352 mL of 0.1 M solution of sodium citrate. Adjust the final volume with ultrapure water to 1000 mL.
  • Buffer: sodium phosphate buffer (0.05 M, pH 5). Weigh 13.9 g of monobasic sodium phosphate and dissolve in 1000 mL of ultrapure water. Weigh 26.82 g of dibasic sodium phosphate and dissolve in 1000 mL of ultrapure water. Mix 93.5 mL of the 0.1 M solution of monobasic sodium phosphate and 6.5 mL of 0.1 M solution of dibasic sodium phosphate. Adjust the final volume with ultrapure water to 1000 mL.
  • Using a sensitive pH-meter, check that the pH is close to 5.0, and then store the buffers at 4 °C.
  • Sulfuric acid (2%) (v/v), add 24 mL of sulfuric acid (96%) to 977.91 mL of ultrapure water.
  • Sodium azide (0.02%), add 40 µL to 199.96 mL of distilled water.
  • Ethanol (50%) (v/v), add 500 mL of ethanol absolute to 500 mL of distilled water.

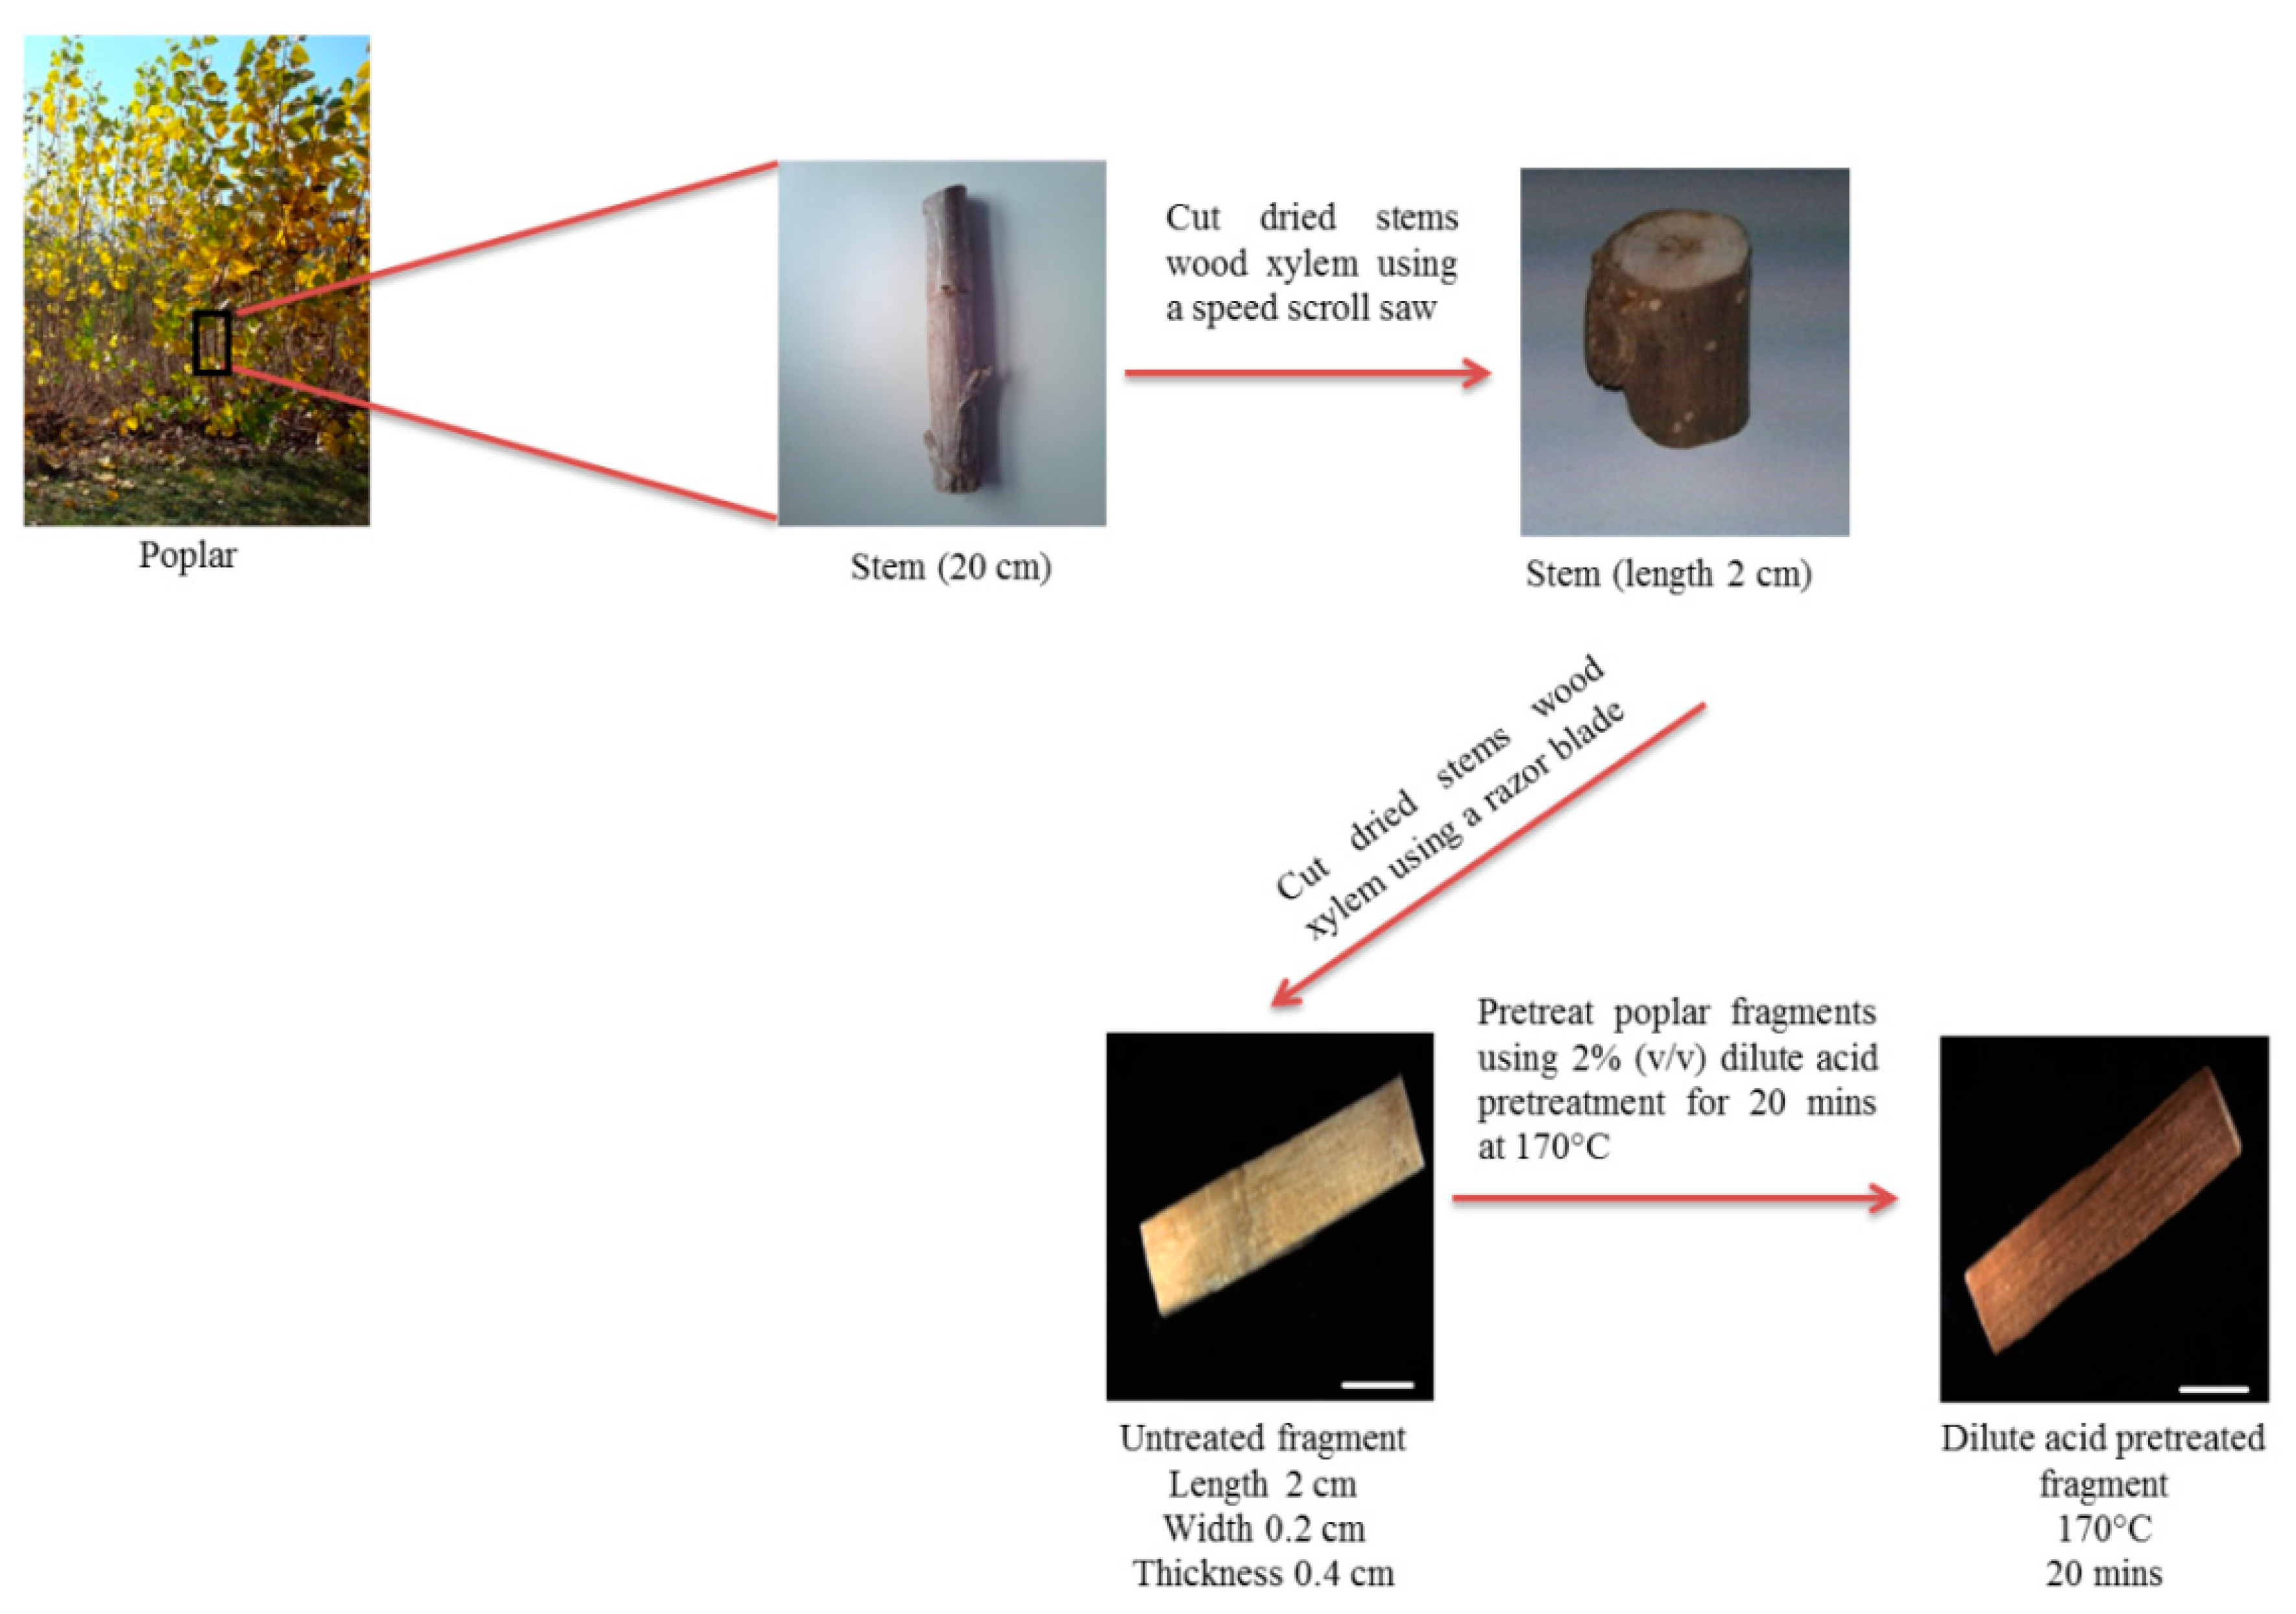
3.2. Sample Preparation

i.
Cut dried stems wood xylem of poplar into segments of 2 cm long using a speed scroll saw.
ii.
Cut dried stems into fragments of 0.2 cm wide and 0.4 cm thickness using a razor blade.
iii.
Place poplar fragments (500 mg) in glass vials containing ultrapure water and put them in a vacuum desiccator and vacuum infiltrate for 3 × 15 min and then incubate them overnight at 4 °C in order to ensure a better diffusion of the reagents during the pretreatment.
iv.
Remove the fragments from the vials and wipe them with a paper towel.
v.
Place poplar fragments in 2% (v/v) sulfuric acid into mineralization bombs (500 mg per bomb) equipped with Teflon cups and cover them for pretreatment.
vi.
Incubate mineralization bombs at 170 °C for 20 min in an oil bath.
PAUSE STEP. Three temperatures (160, 170 and 180 °C) and three incubation times (10, 15 and 20 min) were tested. Incubation time and temperature were selected in order to improve the enzymatic hydrolysis while conserving plant cell structure.
vii.
Cool down the mineralization bombs in ice for 5 min to stop the acid hydrolysis.
viii.
Wash the pretreated fragments three times with a 50% (v/v) ethanol solution and three times with deionized water until the pH of the wash reached 7.0.
ix.
Dry the fragments for 48 h at room temperature and store at room temperature until needed.
x.
Cut the dried fragments in the transverse plane from the xylem using a sliding microtome 40 µm thickness for microscopy images acquisition (Figure 1).
PAUSE STEP. Sections of 20–100 µm thickness were imaged and their axial resolution was measured. A thickness of 40 µm was selected because it represents a compromise between good image resolution and convenience of sample preparation.

3.3. Design of the Customized Incubation Chamber

i.
Incubate untreated or pretreated poplar sections in acetate buffer (0.05 M, pH 5) for 30 min in a Petri dish.
PAUSE STEP. The sections must be completely immersed in the reagent.
ii.
Clean the microscope slide and the cover slide with 70% (v/v) ethanol using a lens cleaning tissue and let it dry.
iii.
Heat the microscope slide, cover slide and the buffer at 50 °C using a hotplate.
iv.
Carefully remove the section from the Petri dish using a brush.
v.
Wipe the section with a cotton swab.
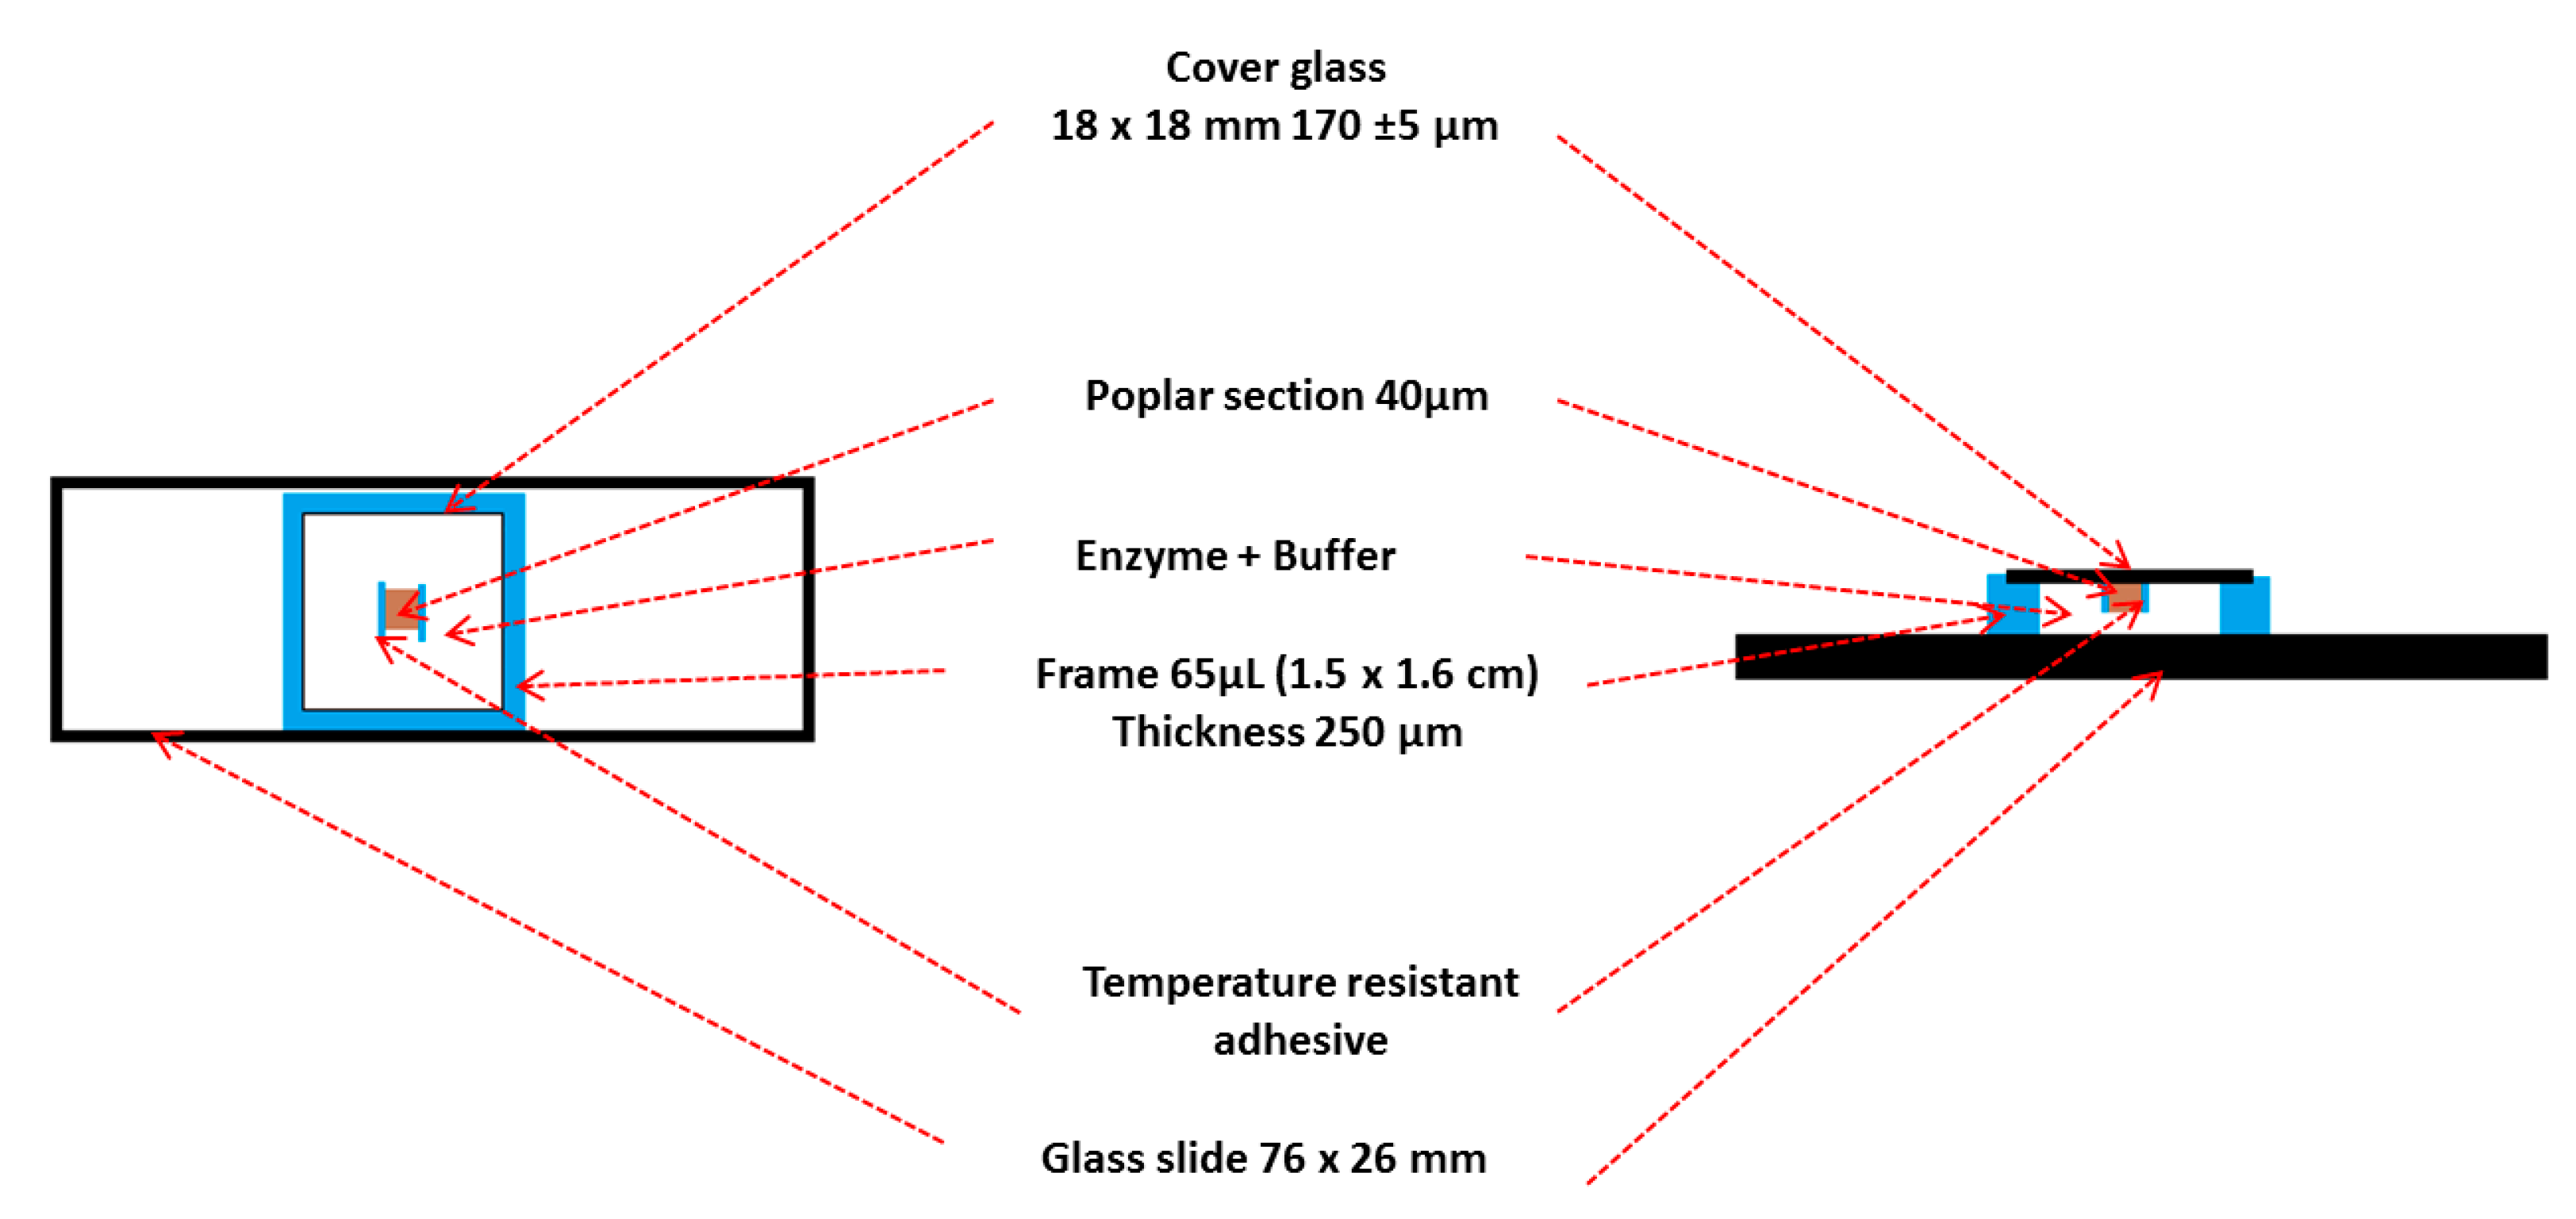
vi.
Fix the section onto a cover slide with a temperature resistant adhesive (Gene frame® was cut into 0.5 cm long strips) to avoid the movement of the samples in the reaction mixtures during image acquisition.
vii.
Remove the thick polyester sheet from the frame and apply it to a microscope slide and press the frame to improve the adhesion.
PAUSE STEP. Each frame is sandwiched between a thin polyester sheet and a thick polyester sheet.
PAUSE STEP. Ensure that the surface of the microscope slide to be in contact with the gene frame is both dry and clean.
PAUSE STEP. Application of the frame to the microscope slide 24 h in advance improves the adhesion.
viii.
Remove the thin polyester backing sheet from the Gene frame®.
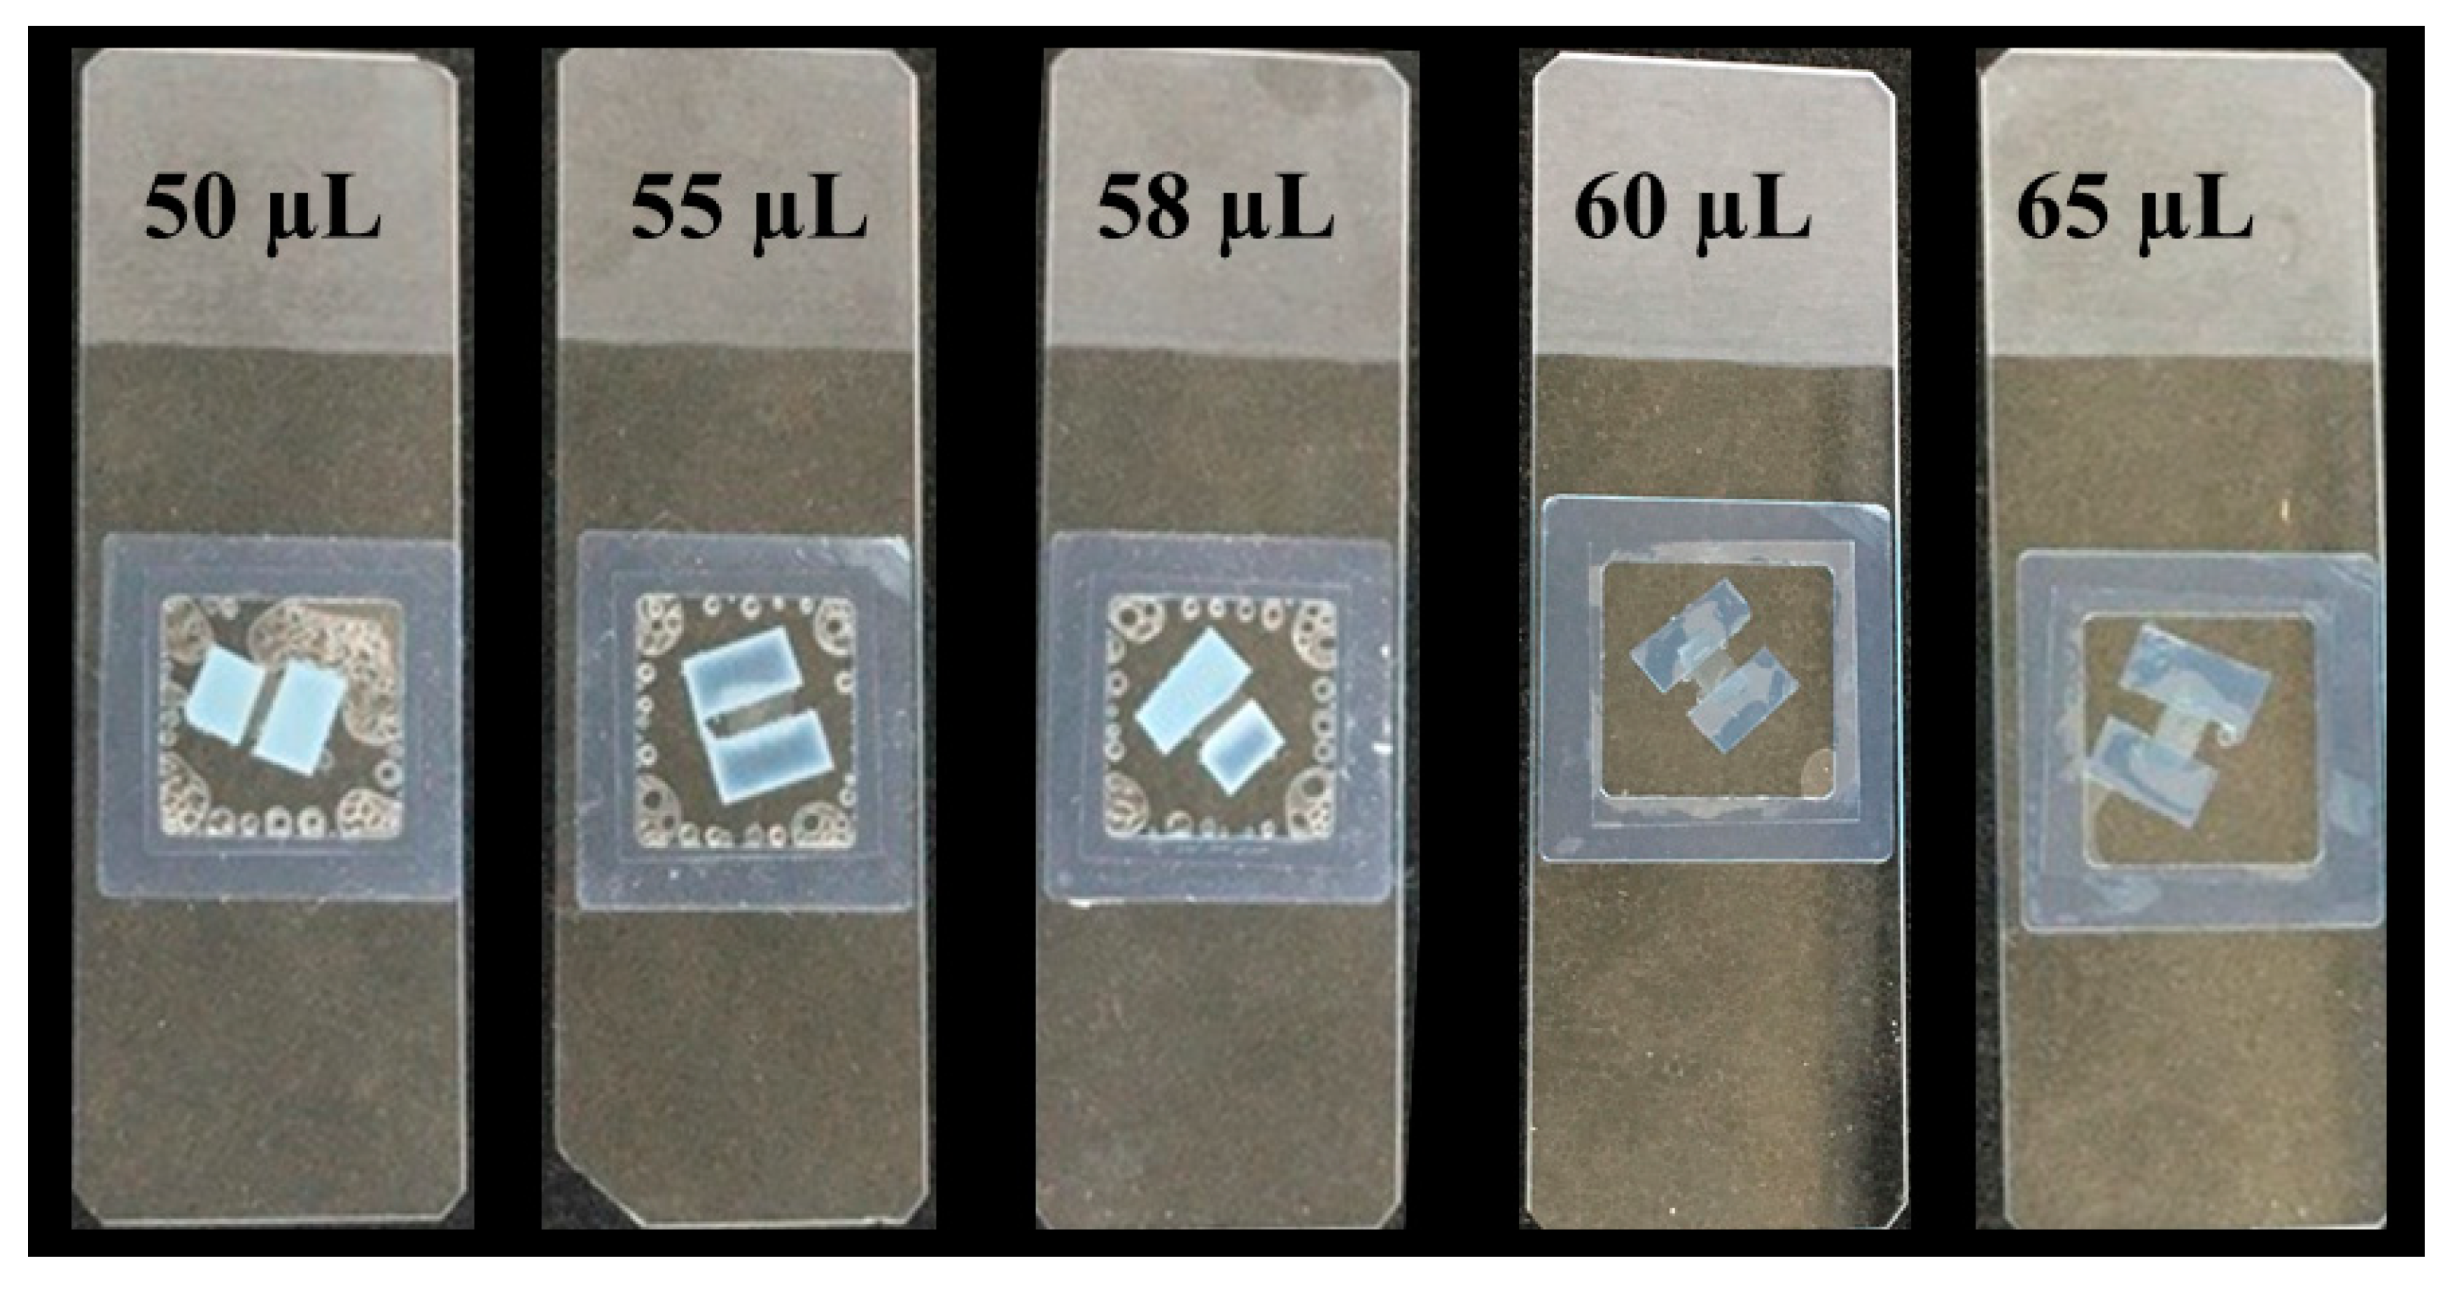
ix.
Add 60 µL of the reaction mixture (buffer, sodium azide and enzymes) at the end of the frame (Figure 2).
PAUSE STEP. Different volumes of the reaction mixture (50, 55, 58, 60 and 65 µL) were tested: 60 µL was chosen to minimize the air bubbles while heating and avoiding the loss of the reaction mixture.
PAUSE STEP. Sodium azide inhibits the microbial infection in the reaction mixture.
PAUSE STEP. Pipetting the reaction mixture at the end of the frame helps to avoid air bubbles during the assembly of the microscope slide, the frame and the coverslip.
PAUSE STEP. The enzymatic hydrolysis assays were performed using Cellic CTec2®, selected for its hydrolysis efficiency, with a cellulase activity of 195 FPU/mL measured by the filter paper method (NREL protocol).
x.
Carefully place the coverslip over the frame at the end where the reaction mixture has been pipetted.
xi.
Slowly press the coverslip over the frame for 10 s to spread the reaction mixture homogeneously within the frame and be sure that the adhesion is optimal to avoid evaporation during the enzymatic hydrolysis (preventing the sample from drying out). The customized incubation chamber is now ready to use (Figure 3).
xii.
Place the customized incubation chamber on a hotplate at 50 °C for 2 min to avoid cooling the chamber.
xiii.
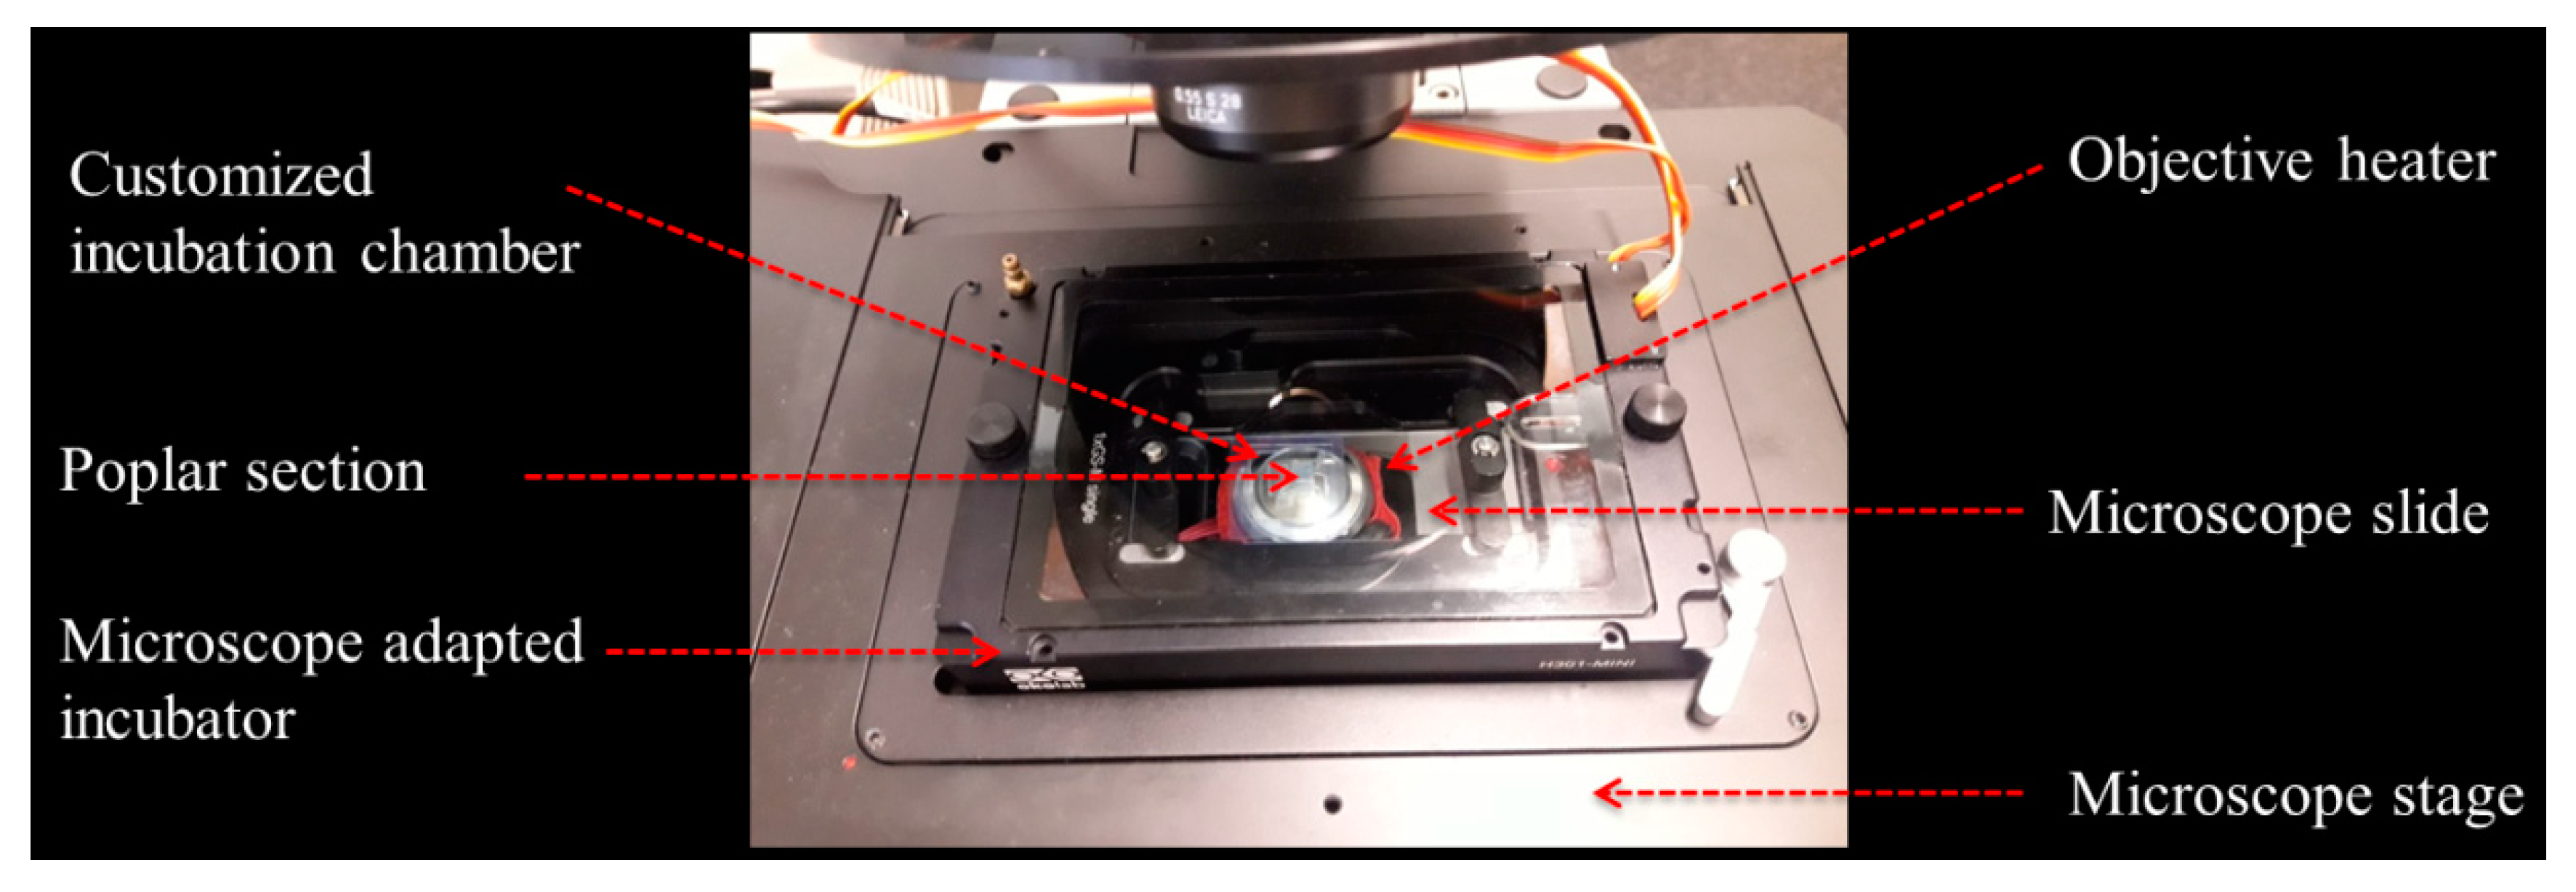
Fix the customized incubation chamber inside a microscope adapted incubator, previously calibrated, in which the temperature is constant at 50 °C for at least 30 min.
PAUSE STEP. Make sure that the incubator is calibrated so that the temperature in the incubation chamber is 50 °C.
PAUSE STEP. Cellic CTec2® activity was measured at 20 and 50 °C. The results show that cellulase activity decreased by 90% at 20 °C compared with 50 °C.
xiv.
An objective heater must be used to avoid dissipation of heat; if not, sample temperature will drop due to oil contact with the cold objective.
PAUSE STEP. To use an objective heater, perform oil immersion imaging with a top stage incubator or use a dipping lens with an upright top stage incubator.

3.4. Imaging Samples Using Confocal Microscopy

Poplar sections were imaged using a laser scanning microscope (Leica TCS SP8, Germany).
PAUSE STEP. The parameters of the microscope must be set up before the mounting of the incubation chamber to avoid the enzymatic degradation of the cell wall before the first acquisition.
i.
Place the incubator containing the customized chamber on the microscope stage equipped with an oil-immersion objective with a magnification of 63× (Figure 4).
PAUSE STEP. Image as quickly as possible, because enzymes in the reaction mixture can be inactivated by photobleaching.
ii.
Adjust the intensity of the laser at 405 nm to 4% to collect the autofluorescence (between 415 and 700 nm).
PAUSE STEP. Different laser intensities (1%, 2%, 3%, 4%, 5%, 6%, 10%) were tested in order to obtain images with high signal to noise ratio and to avoid sample photobleaching.
iii.
Adjust the detectors sensitivity, the fluorescence emission range to (415–700 nm).
PAUSE STEP. Both PMT detector and HyD detector in counting mode were tested, HyD was selected because of its higher sensitivity compared with PMT.
iv.
Acquire images (256 × 256 pixels) at 400 Hz (acquisition speed).
PAUSE STEP. Image resolution was set at 256 × 256 pixels to minimize sample laser exposure, higher resolutions may be suitable for shorter-time experiments.
v.
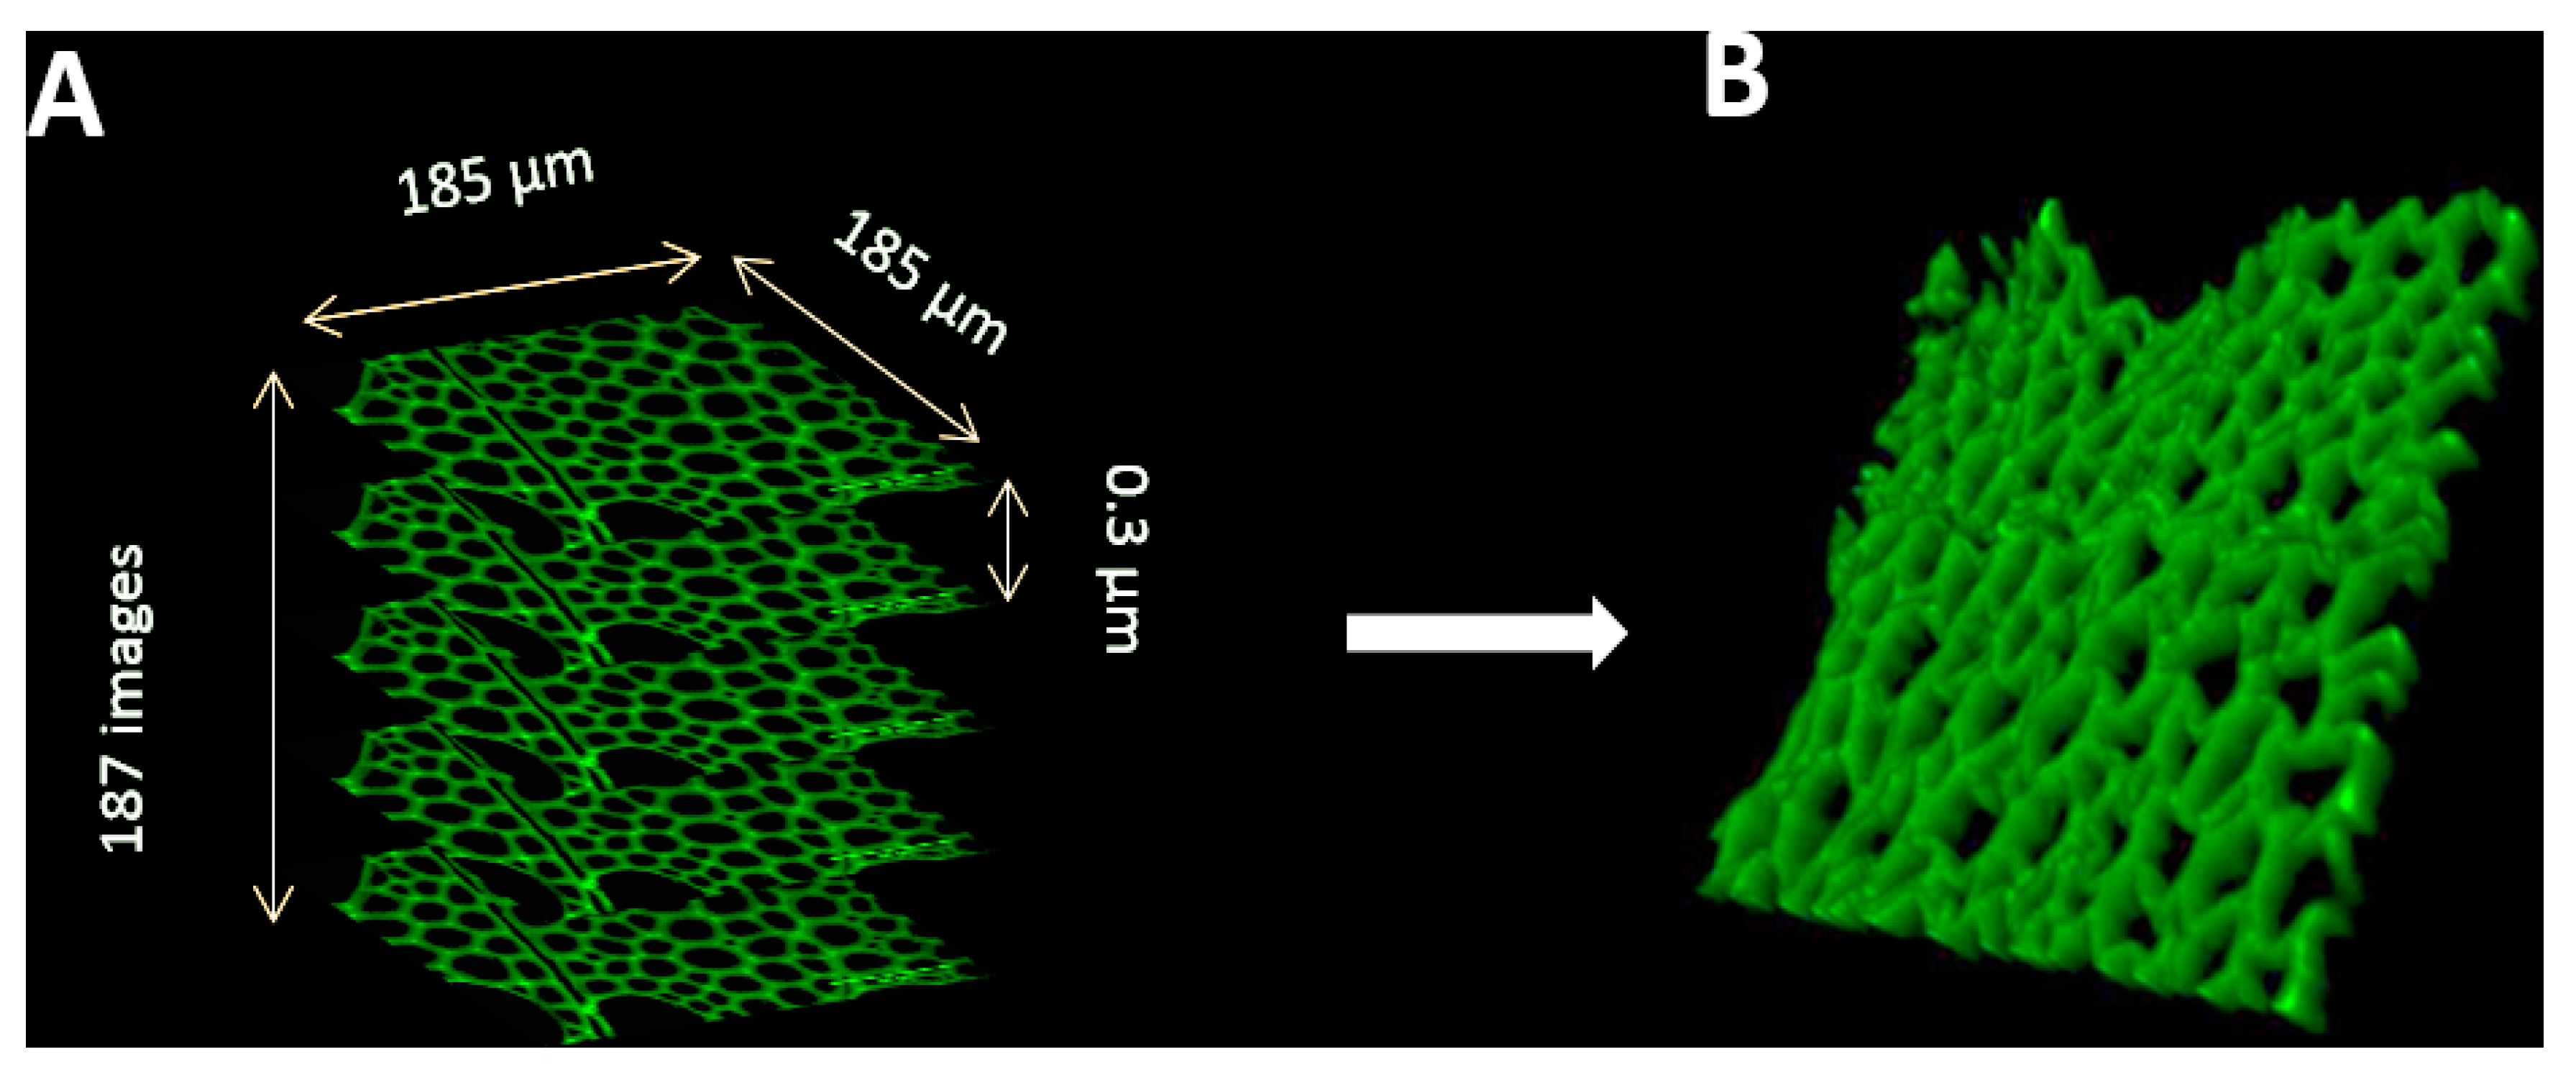
To acquire confocal z-stacks, first define the top and the bottom of the microscope stage. Set the z step to 0.3µm and pinhole to 1 Airy unit (Figure 5).
vi.
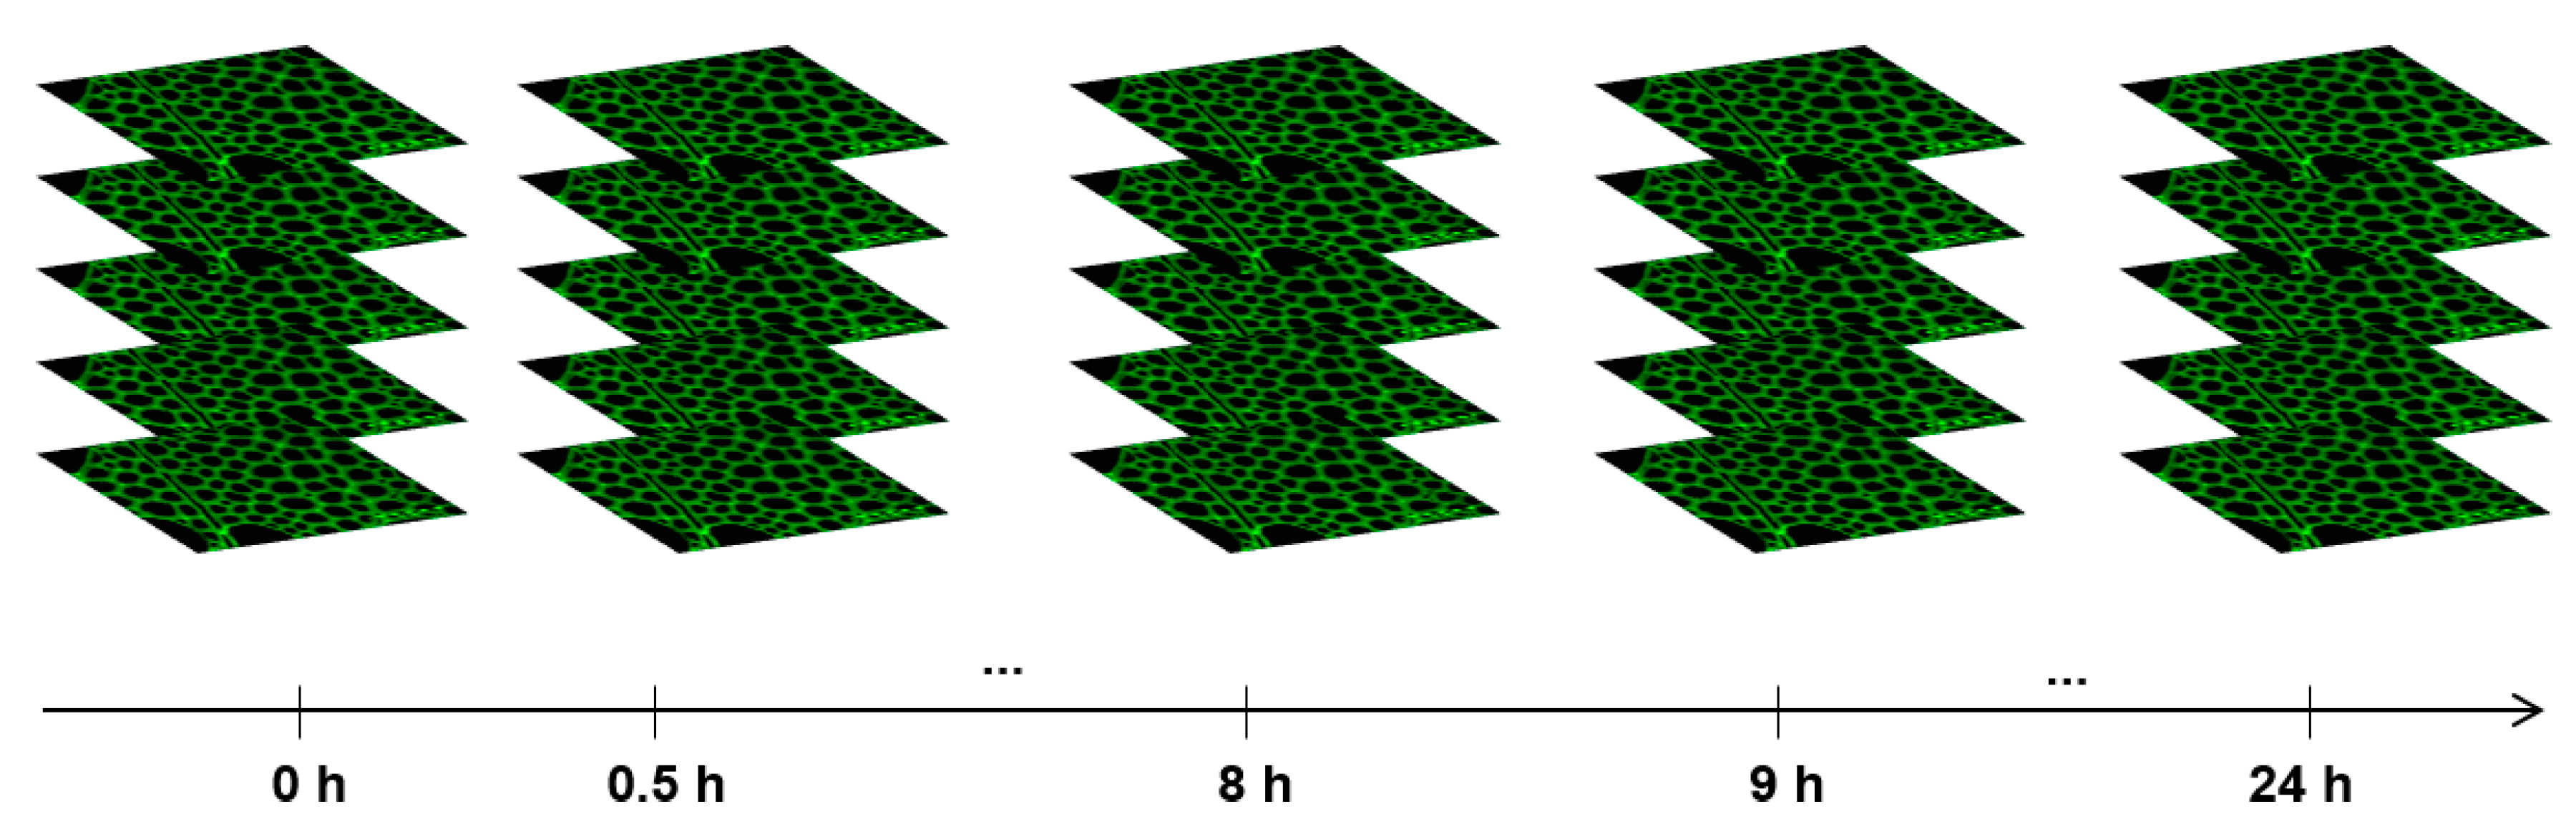
Acquire and save a confocal z-stack every 30 min for the first 4 h, then every hour for the next 20 h (Figure 6).
PAUSE STEP. The time interval was optimized to avoid photobleaching of the samples due to laser exposure.
PAUSE STEP. The optimal microscope parameter values were determined as a compromise between suitable acquisition quality for subsequent segmentation and reduced laser exposure.

3.5. Analyzing Confocal Images: Three Dimensional Image Registration

To register acquired confocal images, we used Block-matching frame [9,11]. More precisely, let {I0, …, IT} be the set of 3D confocal images representing the time-lapse acquisitions over hydrolysis time, T, and It and It+Δt be two successive confocal z-stacks, 0 ≤ t < t + Δt < T. Using the Block-matching framework [9,11], the affine transformation that registered It (floating image) onto It+Δt (reference image) was first computed. The affine transformation was then used to initialize the Block-matching algorithm to compute the non-linear transformation T It←It+Δt that registered It onto It+Δt.
Image registration was also used to quantify signal intensity loss (i.e., the voxels’ intensity reduction in confocal image) between successive z-stacks. The signal loss was computed by subtracting the voxels’ intensities between the registered floating image, It T It←It+Δt, and the reference image It+Δt and summing up the subtracted values (Scripts are available at the FARE Laboratory Gitlab Repository https://gitlab.com/farelab/teamyr/publications/zoghlami_et_al_sus_chem_2020).

4. Results

Using the protocol, we acquired confocal images of pretreated poplar samples during hydrolysis (Figure 7). We could visually observe that the cell walls gradually degraded over time. To illustrate the advantages offered by using this protocol to achieve a quantitative characterization of biomass deconstruction, we implemented a segmentation and tracking method. We first performed Otsu thresholding on the 3D image before hydrolysis, which separated the confocal image into two classes: cell wall and background. We labelled the voxels belonging to the cell wall as one and those belonging to the background as zero. Using the threshold value computed by Otsu thresholding, we also segmented the confocal image acquired after hydrolysis into cell wall voxels, labelled one, and background voxels, labelled zero. To compute the deconstructed cell walls, the confocal image before acquisition was registered onto the confocal image at 24 h and thresholding was performed using the threshold value previously computed, which generated an image in which the cell wall voxels were labelled one and the background labelled zero. We called the resulting image: “registered segmented image at 0 h”. The difference between the registered segmented image at 0 h and segmented image at 24 h was computed (voxel by voxel subtraction of the registered segmented image at 0 h and segmented image at 24 h) which represented the deconstructed cells walls (Figure 8 and Figure 9). The ratio of the number of voxels of the deconstructed cell walls, labelled one, over the number of the registered segmented images at 0 h, labelled one, represented the deconstructed tissue volume ratio. For the images in Figure 8 and Figure 9, the deconstructed tissue volume ratio was 58%. This indicated that 58% of the tissue was deconstructed and only 42% of the tissue remained after 24 h of hydrolysis.

5. Conclusions

This paper lays out the details of an imaging protocol of LB deconstruction as an important first step to understanding hydrolysis at tissular scale. To illustrate the potential advantages of the protocol, an image segmentation and tracking method was developed to show the possibility of extraction of the dynamics of tissular scale changes during enzymatic deconstruction of LB using image analysis. Such advantages are mainly due to the fact that the protocol captures the tissular deconstruction as structural variations in 3D images acquired over time suitable for tissular-resolution segmentation methods, whereas other methods fail to produce 4D (space and time) data sufficient for image processing algorithms at tissular scale. Combining the 3D data acquired during hydrolysis using the protocol with more advanced quantitative image analysis would allow bridging tissular scale deconstruction and the underlying molecular reactions, in order to pinpoint the parameters underlying LB recalcitrance.

Author Contributions

Conceptualization, G.P.; methodology, A.Z., Y.R.; validation, G.P., C.T. and Y.R.; formal analysis, A.Z., G.P., C.T. and Y.R.; investigation, A.Z., G.P., C.T. and Y.R.; resources, A.Z., G.P., C.T. and Y.R.; writing—original draft preparation, A.Z.; writing—review and editing, G.P., C.T. and Y.R.; supervision, G.P., Y.R.; project administration, G.P.; funding acquisition, G.P. and Y.R. All authors have read and agreed to the published version of the manuscript.

Funding

This research was funded by Grand Est Region, FEDER (PhD TECMI-4D scholarship project to A.Z.), INRAE ANS Grant LIMO4DE (to Y.R.) and ANR BIOMOD Grant (ANR-19-CE43-0010 to Y.R.).

Acknowledgments

We thank Grégoire Malandain for use of Block-matching software and Anouck Habrant for her relevant guidance in confocal microscopy imaging.

Conflicts of Interest

The authors declare no conflict of interest.

References

  1. Hassan, S.S.; Williams, G.A.; Jaiswal, A.K. Moving towards the second generation of lignocellulosic biorefineries in the EU: Drivers, challenges, and opportunities. Renew. Sust. Energ. Rev. 2019, 101, 590–599. [Google Scholar] [CrossRef] [Green Version]
  2. Dugarova, E.; Gülasan, N. Global Trends: Challenges and Opportunities in the Implementation of the Sustainable Development Goals; United Nations Research Institute for Social Development: New York, NY, USA, 2017. [Google Scholar]
  3. Claassen, P.A.M.; Van Lier, J.B.; Contreras, A.M.L.; Van Niel, E.W.J.; Sijtsma, L.; Stams, A.J.M.; De Vries, S.S.; Weusthuis, R.A. Utilisation of biomass for the supply of energy carriers. Appl. Microbiol. Biotechnol. 1999, 52, 741–755. [Google Scholar] [CrossRef]
  4. Zoghlami, M.; Paës, G. Lignocellulosic Biomass: Understanding Recalcitrance and Predicting Hydrolysis. Front. Chem. 2019, 7, 874. [Google Scholar] [CrossRef] [PubMed] [Green Version]
  5. Studer, M.H.; DeMartini, J.D.; Davis, M.F.; Sykes, R.W.; Davison, B.; Keller, M.; Tuskan, G.A.; Wyman, C.E. Lignin content in natural Populus variants affects sugar release. Proc. Natl. Acad. Sci. USA 2011, 108, 6300–6305. [Google Scholar] [CrossRef] [PubMed] [Green Version]
  6. Xu, H.; Che, X.; Ding, Y.; Kong, Y.; Li, B.; Tian, W. Effect of crystallinity on pretreatment and enzymatic hydrolysis of lignocellulosic biomass based on multivariate analysis. Bioresour. Technol. 2019, 279, 271–280. [Google Scholar] [CrossRef] [PubMed]
  7. Hallac, B.B.; Ragauskas, A.J. Analyzing cellulose degree of polymerization and its relevancy to cellulosic ethanol. Biofuels Bioprod. Bioref. 2011, 5, 215–225. [Google Scholar] [CrossRef]
  8. Herbaut, M.; Zoghlami, A.; Paës, G. Dynamical assessment of fluorescent probes mobility in poplar cell walls reveals nanopores govern saccharification. Biotechnol. Biofuels 2018, 11, 271–284. [Google Scholar] [CrossRef]
  9. Willis, L.; Refahi, Y.; Wightman, R.; Landrein, B.; Teles, J.; Huang, K.C.; Meyerowitz, E.M.; Jönsson, H. Cell size and growth regulation in the Arabidopsis thaliana apical stem cell niche. Proc. Natl. Acad. Sci. USA 2016, 113, 8238–8246. [Google Scholar] [CrossRef] [Green Version]
  10. Guignard, L.; Fiuza, U.M.; Leggio, B.; Faure, E.; Laussu, J.; Hufnagel, L.; Malandain, G.; Godin, C.; Lemaire, P. Contact-dependent cell communications drive morphological invariance during ascidian embryogenesis. Science 2020, 369, eaar5663. [Google Scholar] [CrossRef] [PubMed]
  11. Michelin, G.; Refahi, Y.; Wightman, R.; Jönsson, H.; Traas, J.; Godin, C.; Malandain, G. Spatio-temporal registration of 3D microscopy image sequences of Arabidopsis floral meristems. In Proceedings of the 2016 IEEE 13th International Symposium on Biomedical Imaging (ISBI), Prague, Czech Republic, 13–16 April 2016; pp. 1127–1130. [Google Scholar]
Figure 1. Sample preparation and dilute acid pretreatment.
Suschem 01 00007 g001
Figure 2. Influence of the volume of the reaction mixture on the presence of air bubbles. (A volume of 60 µL was selected to reduce the presence of air bubbles while heating and to avoid the loss of the reaction mixture.).
Suschem 01 00007 g002
Figure 3. Experimental set-up of the customized incubation chamber for imaging during enzymatic hydrolysis. A sealed frame (65 µL) contains the poplar section and the reaction mixture. To avoid the movement of the sample section over the course of acquisition time, the sample is fixed to the cover glass using a temperature resistant adhesive.
Suschem 01 00007 g003
Figure 4. Experimental setup for confocal imaging during enzymatic hydrolysis. The customized incubation chamber (frame and poplar section and reaction mixture) was fixed inside a microscope adapted incubator placed on the microscope stage.
Suschem 01 00007 g004
Figure 5. Confocal z-stack images (A) and 3D reconstruction (B). Natural autofluorescence of lignocellulose was used to image Z-stacks of the poplar section.
Suschem 01 00007 g005
Figure 6. Confocal time-lapse imaging of poplar samples. Confocal z-stacks are acquired every 0.5 h during the first 4 h, followed by acquisitions every 1 h for the next 20 h.
Suschem 01 00007 g006
Figure 7. Acquired 3D confocal images using the protocol. (A): Confocal image before hydrolysis. (B): Confocal image after 24 h of hydrolysis.
Suschem 01 00007 g007
Figure 8. Segmented confocal images. (A): segmented image at 0 h. (B): Segmented image after 24 h of hydrolysis. (C): Computed deconstructed cell wall (difference between (A) and (B)). The color transparency of the computed cell wall deconstruction indicates its hollow structure.
Suschem 01 00007 g008
Figure 9. Combined segmented images at 0 h and 24 h of hydrolysis ((B) is a tilted view of (A)). Cell walls not modified by hydrolysis (green) are displayed with cell walls deconstructed during hydrolysis (yellow). Small portions of cell walls at 24 h (red) appear on the left side because of slight sample movement in the X-Y plane.
Suschem 01 00007 g009

