Review

Water Footprint Assessment in Tomato Production: Strengths, Limitations and Complementarity of WFN and LCA-Based Approaches


Department for Sustainable Food Process (DISTAS), Università Cattolica del Sacro Cuore, 29122 Piacenza, Italy
*
Authors to whom correspondence should be addressed.
World 2026, 7(8), 132; https://doi.org/10.3390/world7080132
Submission received: 22 June 2026 / Revised: 27 July 2026 / Accepted: 28 July 2026 / Published: 1 August 2026

Abstract

Freshwater scarcity is an increasing concern for agricultural systems, making water footprint (WF) assessment an important tool for evaluating water use in crop production and supporting sustainable water resource management. Two main methodological approaches are widely used: the water footprint network (WFN) framework and Life Cycle Assessment (LCA)-based approaches. This review synthesizes 27 peer-reviewed studies that use tomato production as a representative case study to compare the two approaches across methodological frameworks, geographical contexts, production systems, system boundaries, functional units, and research objectives. The reviewed studies revealed substantial methodological heterogeneity, with WFN representing the predominant approach, whereas LCA-based applications remained comparatively limited. WFN was primarily applied to quantify water use and identify water-use hotspots, whereas LCA-based approaches focused on evaluating the potential environmental impacts of water consumption under local water-scarcity conditions. The review also highlights the ongoing debate surrounding scarcity-weighted indicators and the interpretation of water footprint results. Reported water footprint values varied considerably due to differences in climate, irrigation management, crop productivity, system boundaries, and methodological assumptions, particularly in the calculation of gray water footprint. Overall, the findings indicate that WFN and LCA-based approaches provide complementary perspectives on freshwater sustainability. Their combined application can support more comprehensive water assessments and better-informed decision-making in agricultural systems, while greater methodological harmonization is needed to improve the comparability of future studies.

1. Introduction

Freshwater is a fundamental natural resource that supports human well-being, ecosystem functioning, agricultural production, and economic development [1]. However, increasing demand associated with population growth, food production, industrial development, and urbanization is intensifying pressure on freshwater resources worldwide [2,3]. Consequently, water scarcity has emerged as one of the most pressing environmental challenges, particularly in regions where water withdrawals exceed natural replenishment rates [3].
Agriculture plays a central role in this context, representing one of the most water-intensive economic sectors and a major contributor to freshwater consumption and degradation [4,5]. The challenge is especially relevant in Mediterranean countries, where recurrent droughts, increasing temperatures, and growing competition among water users are expected to further exacerbate water scarcity conditions [6]. The growing concern surrounding sustainable water management is reflected in Sustainable Development Goal 6 (SDG 6), which promotes improvements in water-use efficiency and freshwater conservation [7].
Among the methodologies developed to assess freshwater appropriation, water footprint (WF) assessment has emerged as one of the most widely adopted tools for quantifying water use and its environmental implications [8,9]. By accounting for freshwater consumption and degradation across supply chains, WF supports the identification of water-use hotspots and the development of more sustainable management strategies [3,10]. Despite its widespread adoption, WF assessment exhibits substantial methodological diversity. Two major approaches currently dominate the field: the water footprint network (WFN) framework, based on the volumetric accounting of blue, green, and gray water resources [8], and life cycle assessment (LCA)-based approaches developed under ISO 14046, which evaluate the potential environmental impacts associated with freshwater use through characterization factors [11,12]. Although both approaches are commonly referred to as water footprint methodologies, they differ in their conceptual foundations, assessment procedures, and interpretation of results, often providing complementary rather than directly comparable information [13]. A major point of divergence concerns the incorporation of local water scarcity into WF indicators. While LCA-based approaches increasingly rely on scarcity characterization methods such as AWARE [14], the suitability of scarcity-weighted indicators remains debated within the scientific community [15,16,17].
Tomato production represents a particularly suitable case study for investigating these methodological differences. Tomatoes are among the most important horticultural crops in Mediterranean agriculture and are predominantly cultivated in regions frequently affected by water stress [6,18,19]. Moreover, tomato production systems have been extensively assessed using both WFN- and LCA-based approaches, providing a robust empirical basis for methodological comparison [20,21,22].
Although previous studies have compared specific aspects of WFN- and LCA-based methodologies [13,23], a comprehensive synthesis of their applications within a common agricultural context remains lacking. Furthermore, despite increasing recognition that the two approaches should be viewed as complementary rather than competing frameworks [24], practical guidance regarding their interpretation and use remains fragmented. Therefore, this study presents a systematic literature review (SLR) of water footprint assessments applied to tomato production systems, with the primary objective of critically comparing WFN and LCA-based methodological paradigms. Specifically, the review aims to: (i) analyze the conceptual foundations and methodological assumptions underlying the two approaches; (ii) examine how they have been applied across tomato production systems and supply chains; (iii) identify their respective strengths, limitations, and areas of complementarity; and (iv) discuss their implications for supporting sustainable water management and decision-making under increasing water scarcity conditions. By synthesizing the available evidence, this review seeks to contribute to the ongoing methodological debate surrounding water footprint assessment and provide guidance for future research and practical applications in the agricultural sector.

2. Theoretical Framework for Water Footprint Assessment

2.1. Evolution of the Water Footprint Concept

The origins of WF assessment can be traced back to the concept of “virtual water”, introduced by Allan during the early 1990s while investigating water scarcity in the Middle East and North Africa [25]. Virtual water refers to the volume of freshwater embedded in commodities and traded through international markets, highlighting how water-scarce countries effectively import water by purchasing agricultural products produced elsewhere. Although influential in policy and water governance debates, the concept initially lacked a standardized quantitative framework. Building upon Allan’s work, Hoekstra introduced the concept of the water footprint in the early 2000s as a comprehensive indicator for quantifying freshwater appropriation by products, individuals, companies, and nations [26]. This transition transformed the virtual water concept from a qualitative perspective on water trade into an operational assessment framework applicable across different spatial scales.

2.2. The Water Footprint Network Framework

A major methodological milestone was achieved through the development of the WFN framework, consolidated in the Water Footprint Assessment Manual [8]. This approach formalized the distinction among green, blue, and gray water components, enabling the separate quantification of different forms of freshwater appropriation and pollution. Its primary objective is to quantify freshwater consumption and pollution across supply chains and subsequently evaluate their sustainability within the hydrological context in which water is used. The three-component structure that became the WFN’s defining contribution is as follows:
  • Blue water footprint: This represents the consumption of surface and groundwater. In agriculture, this generally refers to the volume of water evaporated during irrigation or used for the dilution and application of fertilizers and pesticides [27].
  • Green water footprint: This refers to the precipitation stored in the soil as moisture, which is eventually consumed by crops through evapotranspiration [27]. It represents the “on-site” water consumed by plants that does not become runoff or recharge groundwater [28].
  • Gray water footprint: This is an indicator of freshwater pollution. It is defined as the volume of freshwater required to assimilate a load of pollutants to the point that the water quality remains above specific water quality standards [29]. In agriculture, this is primarily associated with the volume of water needed to dilute nutrient leaching (specifically nitrogen) from fertilizers into soil and aquifers [30].

2.3. The Emergence of LCA-Based Water Footprint Assessment

While the WFN framework was becoming established, the LCA community was developing alternative approaches for evaluating freshwater use within the ISO 14040/44 framework [31,32]. Unlike volumetric accounting approaches, LCA scholars argued that water consumption should be interpreted in terms of its potential environmental consequences, which depend strongly on local water availability conditions. The parallel development of these approaches ultimately led to the publication of ISO 14046 in 2014 [11], which established internationally recognized principles and guidelines for water footprint assessment from a life-cycle perspective. Under this framework, water consumption inventories are translated into potential environmental impacts through characterization factors, allowing freshwater use to be integrated into broader environmental assessments alongside climate change, eutrophication, and other impact categories.

2.4. Convergence and Methodological Divergence

The coexistence of the WFN and LCA-based approaches has generated one of the most important methodological debates in water footprint research. Although both frameworks aim to support sustainable freshwater management, they operate at different stages of the assessment process (see Table 1). According to Boulay et al. (2013) [13], the WFN framework primarily focuses on inventory-based volumetric accounting, whereas LCA-based approaches focus on impact assessment using characterization factors. Consequently, the two methodologies often answer different questions. WFN emphasizes transparency in freshwater appropriation and supply-chain analysis, while LCA-based approaches seek to quantify potential environmental impacts associated with water consumption under specific local conditions. Increasingly, scholars have suggested that these approaches should be viewed as complementary rather than competing frameworks, as they provide different but mutually informative perspectives on freshwater sustainability. To avoid misleading comparisons, this review deliberately refrains from a direct quantitative comparison of absolute WF values across the cited literature. Volumetric metrics and impact-oriented LCA methods evaluate fundamentally different indicators and are not mathematically comparable. Furthermore, raw WF values are highly sensitive to local spatial and temporal variables (e.g., regional climate, irrigation systems, and local water scarcity). Without systematic methodological and contextual harmonization, comparing absolute magnitudes across diverse studies is unsound; thus, this work focuses strictly on analyzing the conceptual frameworks, applicability, and interpretive differences in these assessment methodologies in tomato production.

3. Research Methodology

This study employed an SLR to synthesize findings from research addressing WF assessments for tomato crops. Specifically, tomatoes account for approximately 27% of Europe’s total fresh vegetable production, with more than 60% harvested in Italy and Spain.
Adopting the SLR framework proposed by Do et al. (2021) [33], which builds upon the seminal work of Tranfield et al. (2003) [34], this review was organized into two primary phases:
  • Material collection: This phase involves identifying a representative set of keywords, constructing search strings, and selecting the academic databases for exploration.
  • Material selection and evaluation: To establish the final review sample, the initial results were filtered through a rigorous application of predefined inclusion and exclusion criteria.

3.1. Material Collection

The keywords were strategically selected to represent the core research themes and identify scientific contributions aligned with the objectives of this SLR. To ensure high scientific rigor, these keywords were queried in Scopus. This platform is widely recognized as one of the most comprehensive databases for the peer-reviewed literature, offering the broadest coverage of high-impact scientific papers [33]. Furthermore, the database features a high density of journals within the specific fields that are relevant to this study, including ‘Environmental Science’, ‘Commodity Science’, and ‘Engineering’ [35,36]. Following the approach of Do et al. (2021) [33], results from multiple studies in the database were merged to maximize the detection of relevant contributions and ensure a rigorous selection process for the final review sample. To identify the relevant literature, a series of Boolean searches were conducted by combining specific keywords with the ‘AND’ operator to refine the results. Following the methodology of Do et al. (2021) [33], keywords were organized considering terms related to water use, including “water footprint”, “freshwater degradation”, “freshwater use”, “freshwater depletion” and “LCA water” and “tomato” crop (e.g., “water footprint” AND “tomato”). The search was applied to the “Article title, Abstract, Keywords” field in Scopus and was conducted in April 2026 with no time restrictions, and it was limited to research articles.

3.2. Material Selection and Evaluation

As previously noted, this phase involved a multi-stage screening process based on specific inclusion and exclusion criteria, following the methodologies of Do et al. (2021) [33]. To ensure consistency and minimize selection bias, the search, screening, and selection processes were executed by both authors and critically verified by the second author (L.L.). Disagreements regarding study eligibility or thematic classification were resolved through collaborative discussion and consensus. The selection process was conducted as follows:
  • Language and peer-review: Only peer-reviewed articles published in English were considered.
  • Document type exclusion: Book chapters and conference proceedings were excluded due to potential inconsistencies in accessibility and data extraction.
  • Keyword de-duplication: Instances where different keyword combinations returned the same article were reconciled by counting the paper only once.
  • Abstract screening: An initial screening was conducted at the abstract level. Articles were included if they assessed indicators related to water consumption or degradation for the selected crop. Studies featuring these indicators in holistic or integrated assessments were also included, as were papers in which crop cultivation was analyzed as part of a larger food supply chain or alongside other agricultural products.
  • Full-text analysis: Papers meeting the criteria in steps 3 through 4 were retrieved in full and thoroughly reviewed to ensure their alignment with the research objectives. Papers were evaluated based on the clarity of their methodological descriptions, the completeness of their reported crop-water footprints or degradation metrics, and their alignment with our core research objectives. Papers lacking clear methodological baselines were excluded.
  • Snowballing (reference scanning): The references of the selected papers were scanned to identify any additional relevant studies that may have been missed during the initial search.

3.3. Data Extraction and Classification

For each selected article, a structured data extraction procedure was conducted to ensure consistency in comparing methodological approaches and reported outcomes. Following previous systematic review studies in the field [33,35], information was collected regarding: (i) publication characteristics (authors, year of publication, and study location); (ii) the production system investigated (open-field, greenhouse, hydroponic, or processing systems); (iii) the system boundaries adopted for the assessment (primary production, processing); (iv) the methodological framework applied, including WFN and LCA-based approaches; (v) the functional unit; (vi) the water footprint components considered (green, blue, gray, or scarcity-based indicators) and the main quantitative results reported by each study; and (vii) the main objective of the studies. To facilitate a comparison between methodological paradigms, particular attention was devoted to determining whether water use was assessed using volumetric accounting approaches or impact-oriented characterization methods that incorporate local water scarcity conditions. Additional information regarding the objectives of the studies, water management scenarios, climate change assessments, irrigation strategies, and supply-chain stages included within the system boundaries was also extracted when available. The extracted information was subsequently used to classify the reviewed literature according to the methodological approach, geographical distribution, production system, water footprint components assessed, and primary research objectives. This classification enabled a systematic comparison of the strengths, limitations, and practical applications of WFN and LCA-based water footprint methodologies in tomato production systems.

4. Results and Discussion

4.1. Overview of the Reviewed Literature

The initial number of results retrieved from Scopus for each keyword combination and the application of these criteria are detailed in Table 2.
As shown in Table 2, the initial search results were predominantly retrieved using the “freshwater use” keyword combination (55% of the total), followed by “water footprint” (35%). However, the abstract screening reversed this trend, revealing that most relevant results fell under the “water footprint” category. According to the authors, this shift may be attributed to the comprehensive, integrated approach that the WF framework offers in accounting for and assessing freshwater consumption and degradation issues. Through the selection process, a final sample of 27 articles published between 2009 and 2025 was selected from the total 421 papers listed in Table 2. This sample aligns with the aim of this review, represents the currently available specialized literature, and provides a comprehensive overview of WF assessments for tomato crops.

Paper Classification

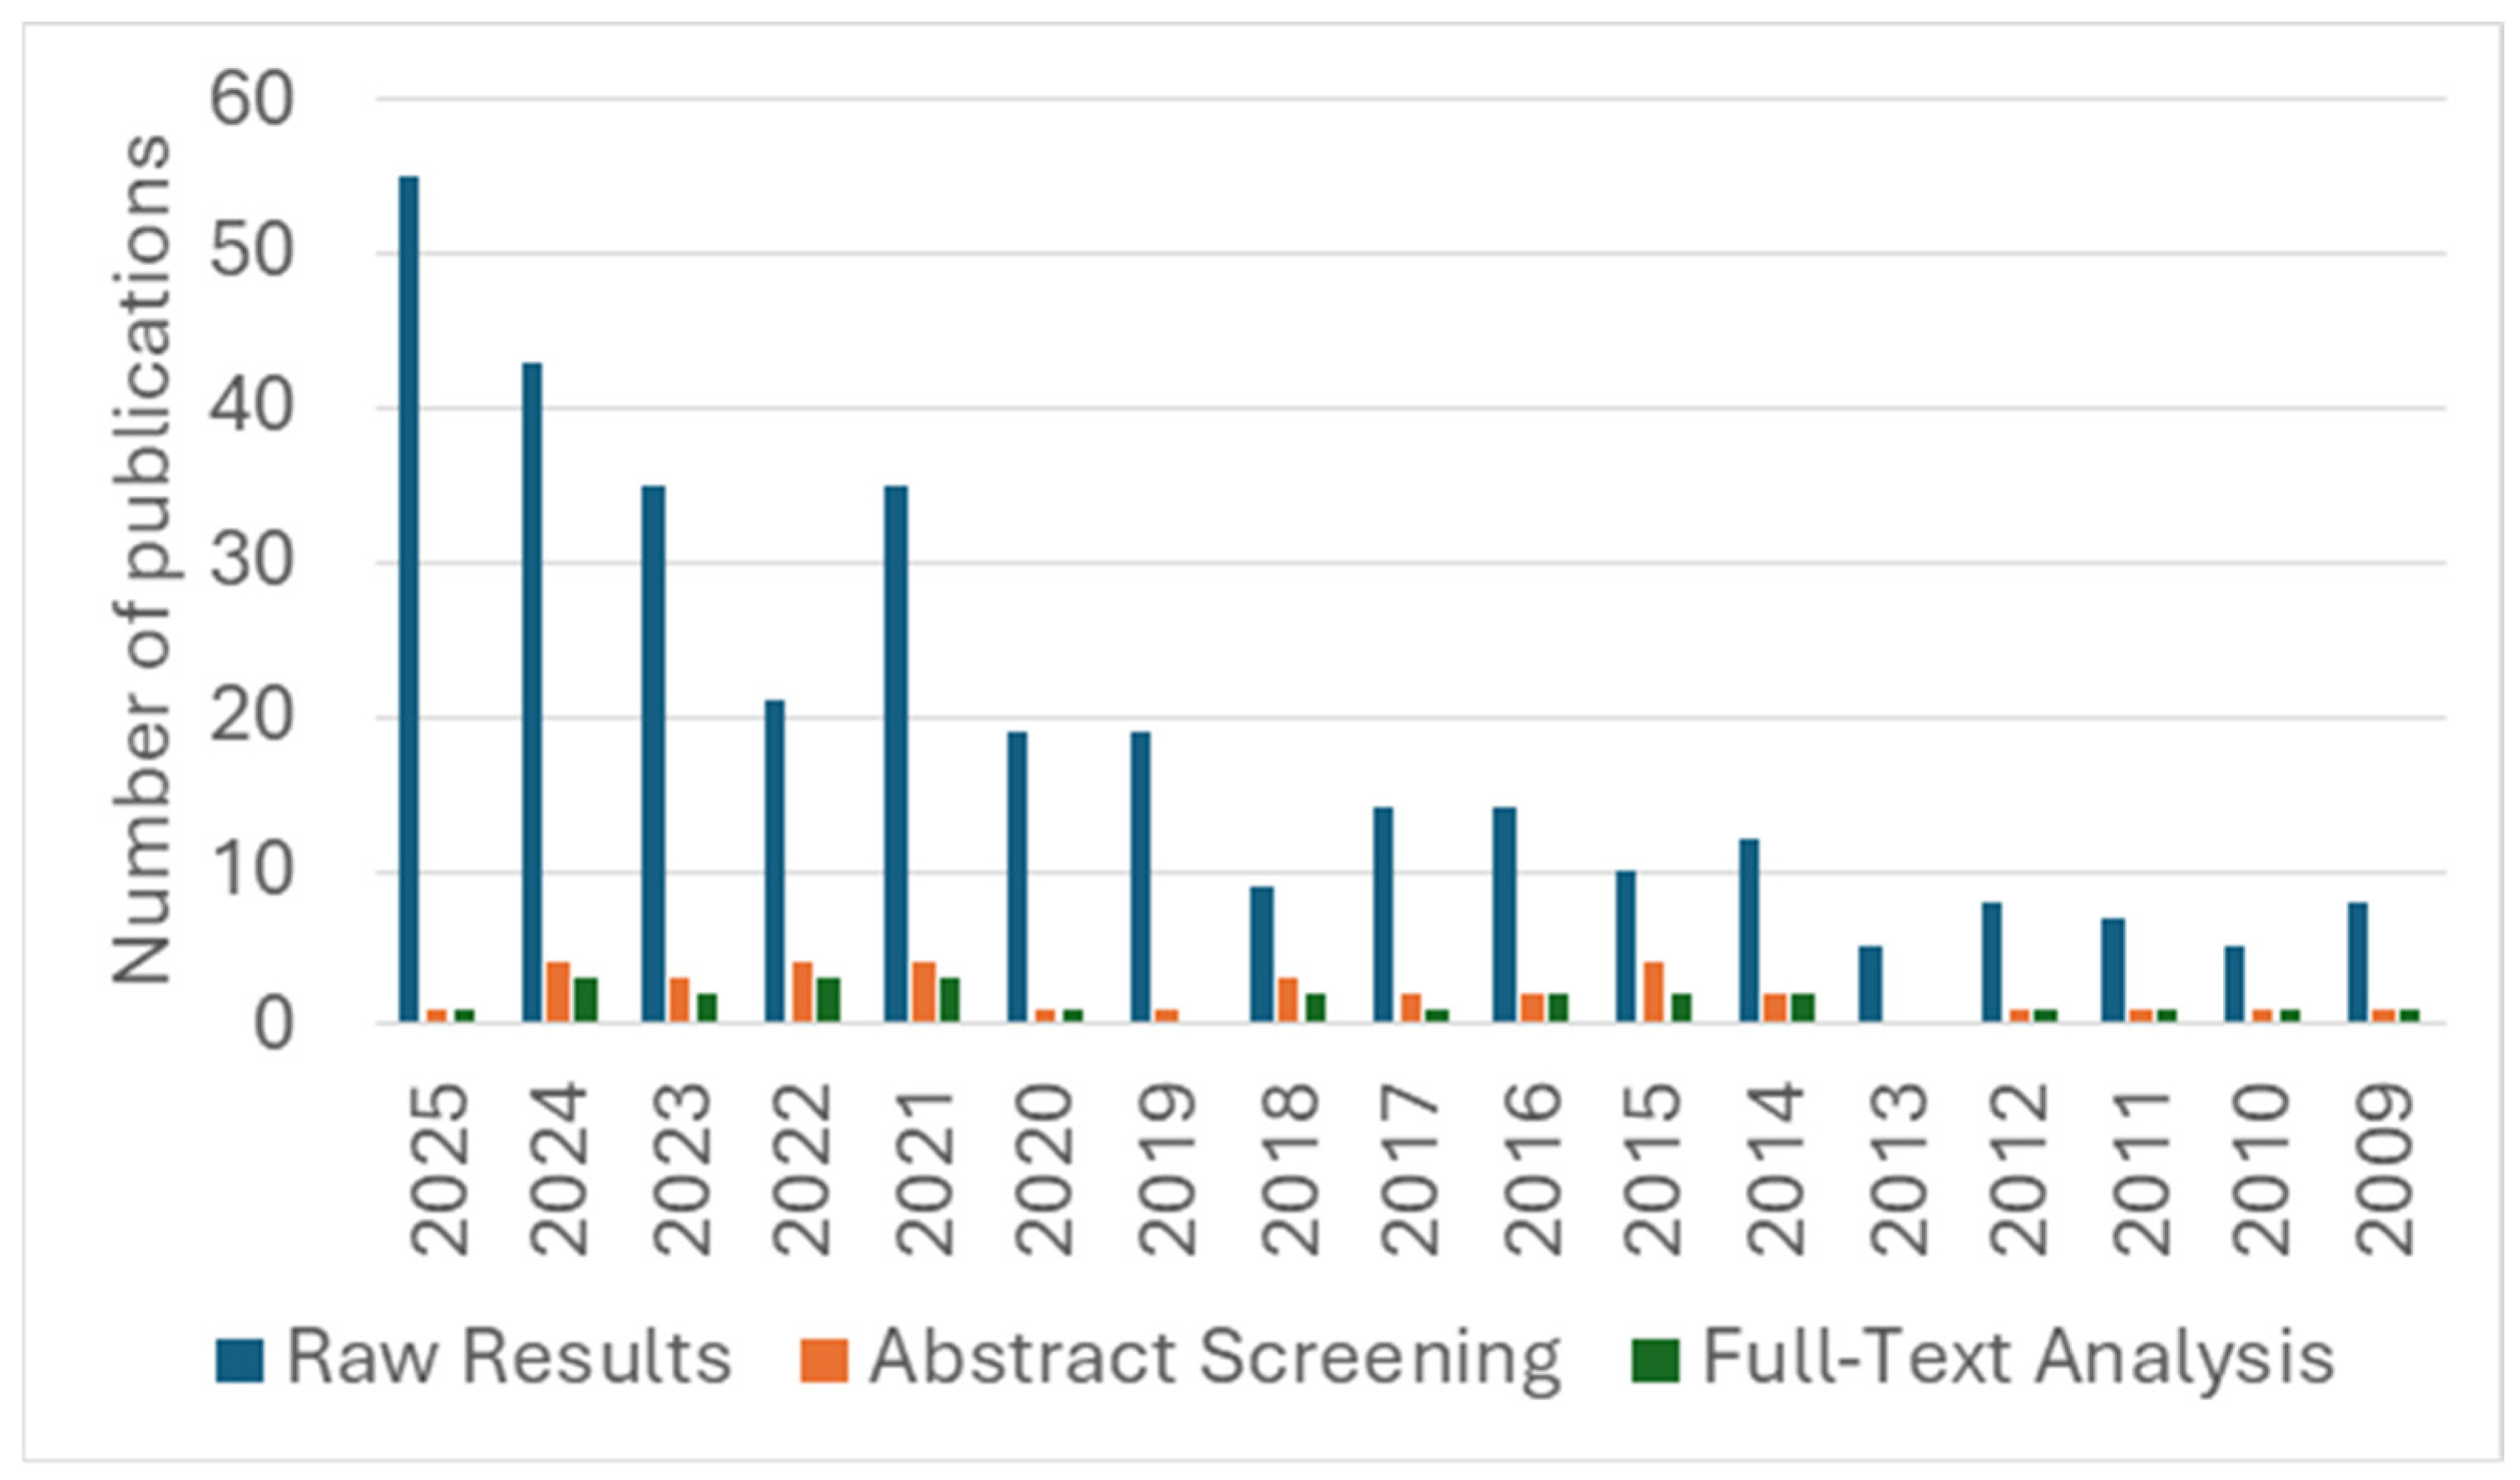
The articles found were classified by publication year (Figure 1) and aggregated across the different screening selections. From Figure 1, there is evidence that although no temporal restrictions were imposed, the first published study on WF was published in 2009. Additionally, a remarkable increase in the number of published papers was observed overall during 2013–2025, with the highest values being between 2021 and 2025, highlighting growing interest in research on agricultural WF.
The collected papers span a wide range of journals across scientific areas, including environmental sustainability, LCA, water resource management, and agriculture and food production. However, the paper distribution looks to this author team to be quite uneven, considering that the ‘Journal of Cleaner Production’ accounts for almost 20% of the articles included in this review, thereby proving the increasingly dominating role of this journal in such a rapidly advancing field of water footprinting. Moreover, information on the countries where the studies were conducted was reported to help identify the spatial dimension of freshwater use. In this regard, papers relate to 13 countries, with most studies concentrated in the Mediterranean basin (65% of the total), particularly in Italy (27%) and Spain (15%). Consistent with this study’s aim, this confirms what was stated in the previous section regarding the relevance and representativeness of the crop chosen for the review. Along with this, following [35], detailed information such as study area, WF assessment method, type of water use (whether it is consumptive or degradative), system investigated, and several other elements was extrapolated from the papers reviewed and tabled to summarize the most relevant and representative overall findings from this review. Moreover, to establish the WF concept in the context of a supply chain, the authors examined the system boundaries of the reviewed case studies and highlighted all supply chain steps considered in the WF assessment.

4.2. Objectives and Findings of the Papers Reviewed

Tomatoes are increasingly a significant component of human diets due to their nutritional and nutraceutical properties, including vitamins and antioxidant compounds such as lycopene and anthocyanins. In addition, in the Mediterranean region, tomatoes are part of the local cultural identity, particularly given their close association with pasta consumption [37]. A comparison between the selected papers is reported in Table 3.

4.2.1. Methodological Comparison Between WFN and LCA

Overall, Table 3 highlights the substantial methodological and contextual heterogeneity among studies on tomato production across geographical conditions, production systems, system boundaries, functional units, indicators, and research objectives. The methodological classification shows a clear predominance of the WFN approach, with LCA-based methods applied in fewer studies, and only a few studies considering both methodological frameworks. This imbalance confirms that volumetric water footprint accounting remains the most frequently applied approach in tomato production, whereas impact-oriented methods are less represented in the available literature. Functional units were generally expressed per mass of fresh tomatoes, most frequently as liters per kilogram of fresh product. However, some studies adopted different functional units depending on their methodological frameworks, system boundaries, or the products considered, including processed tomato products and LCA-based equivalent units. This heterogeneity limits the direct quantitative comparison and statistical aggregation of reported WF values but provides a relevant basis for identifying recurring methodological patterns, application contexts, and research gaps. Overall, the findings emphasize that the selection and interpretation of WF indicators should be consistent with the specific research objective, geographical and production context, and intended application of the assessment. Most studies focused on WF quantification (22%), followed by methodological development/comparison (15%), irrigation management (11%), climate change assessment (11%), and supply-chain analyses (11%). Only a limited number of studies explicitly compared WFN and LCA-based approaches, highlighting the need for a more comprehensive synthesis of methodological implications. Among the papers using WFN methodology, Chapagain and Orr (2009) [20] were the first to analyze the WF of tomatoes. Their research aimed to link European Union (EU) tomato consumption to specific production sites in Spain, thereby refining WF methods to better account for local growing conditions and addressing broader questions regarding water-resource responsibility. Ultimately, the authors confirmed that the impact of EU consumption on Spain’s water footprint is highly location-specific, dictated by local soil, climate, farming practices, water scarcity levels, and overall production volumes.
The reviewed studies reveal considerable variability not only in the WF methodology applied and in the WF values, but also in the selection of water footprint components included in the assessment. Only a subset of studies simultaneously quantified Blue, Green, and Gray WF, whereas many focused on one or two components in line with their research objectives. Some studies (13) quantified all three components, whereas others focused on one (5) or two components (3) based on their research objectives and data availability. Blue and Gray WF were considered in sixteen studies: the first was considered in those reflecting the importance of irrigation water in tomato production, while the second was particularly relevant in studies addressing fertilizer use, pollution, and water quality [41,54]. Green was reported in fifteen studies, showing substantial variability across production systems and geographical contexts, and was excluded in greenhouse-based studies. The highest Green WF values were reported by Hossain (2021) [52], with results exceeding the global average (108 L/kg of FT). The substantial variability in Green and Blue WF values among the investigated fields reflects differences in irrigation volumes, crop yields, and site-specific environmental conditions. In general, fields receiving larger irrigation volumes tend to rely more strongly on Blue Water, while the relative contribution of Green Water is lower. Conversely, fields with lower irrigation inputs may show a greater contribution from Green WF, as a larger proportion of crop evapotranspiration is met by effective precipitation and soil-stored rainfall. This pattern is particularly evident when comparing fields located under different site-specific conditions, like those shown in the study by Evangelou et al. (2016) [39], in which farms representative of the main agro-climatic zones and soil texture classes within the river basin have been selected, and where variations in rainfall distribution, soil water availability, and irrigation requirements influence the relative contribution of Green and Blue Water [39]. Similarly, the study conducted in Ecuador [46] reported substantial variability in WF values, which cannot be attributed solely to geographical and hydroclimatic differences among production areas but also to differences in tomato field management practices (agro-ecological vs. conventional). A similar variability was observed in Iran [59], where WF components differed substantially among tomato-producing areas, with much wider variations in Blue WF and Gray WF. Variable results were reported [50] for tomato production in the Apulia region of southern Italy, where climate scenarios, soil properties, and geographical location strongly influenced water requirements, yield, and WF values. The northern area, characterized by higher temperatures and lower rainfall, showed a lower contribution of Green Water to crop evapotranspiration and a progressively greater dependence on Blue Water. Consequently, Blue Water requirements and total WF increased from the southern to the northern part of the region and from the baseline scenario to the most severe climate-change scenario. Soil characteristics also contributed to the observed variability. Sandy soils exhibited higher Blue Water requirements and WF values due to their lower water-retention capacity, greater drainage losses, and lower crop yields. Yield emerged as a particularly important determinant of product-based WF values: the relatively low WF values simulated in the study were largely attributable to the high tomato yields obtained under full irrigation and non-limiting nitrogen conditions. Studies addressing irrigation management further showed that changes in irrigation technologies and strategies may affect WF results through their combined effects on water consumption and crop yield [53,57,62]. This confirms that differences in WF cannot be interpreted solely in terms of water consumption, as the indicator expressed per unit of product is strongly affected by crop productivity.
Overall, the reviewed studies consistently indicate that differences in Green and Blue WF are primarily driven by the interaction between climate, irrigation management, soil characteristics, and crop yield, rather than by geographical location alone. The wide range of Gray WF values indicates the influence of fertilization practices, crop productivity, and local conditions affecting pollutant assimilation requirements. Among the studies, the dividing line is methodological. Most of them compute a gray term from a pollutant-dilution load—usually nitrogen leaching—whereas LCA-style studies do not handle pollution through impact categories or at all. Two main observations emerge. First, Egea et al. (2024) [57] was the only study to estimate Gray WF using site-specific nitrogen leaching rather than assuming a fixed leaching fraction. Second, the relative contribution of Gray WF varied considerably across the reviewed studies—ranging from negligible values (0.96 L/kg; Taipe Velasco et al. [46]) to dominant contributions (327 L/kg on average; Bazarfshan et al. [59])—largely reflecting differences in pollutant selection and methodological assumptions rather than intrinsic differences among production systems. In most of the reviewed studies, Gray WF was estimated by considering only nitrogen leaching, consistent with the standard WFN methodology. For example, Maffia et al. [54] explicitly stated that only nitrogen fertilizers were included in the Gray WF calculation, following Hoekstra et al. (2011) [8] and the EU Nitrates Directive. Similarly, Chapagain and Orr [20] calculated Gray WF based on nitrate dilution requirements, whereas Egea et al. [57] estimated Gray WF using site-specific nitrogen losses through deep drainage. Under this approach, Gray WF is primarily influenced by nitrogen application rates, the assumed or measured leaching fraction, and crop yield. Consequently, studies adopting a nitrogen-only approach generally reported relatively low Gray WF values, as illustrated by Maffia et al. [54] (0.04–0.39 L kg−1).
Most reviewed studies estimated Gray WF by considering only nitrogen leaching. However, Gil et al. [41] demonstrated that when phosphorus is included in the assessment, Gray WF values may increase substantially, owing to the more stringent water quality thresholds adopted for phosphorus. They report Gray WFs of 79, 6182, and 223 m3/t for nitrogen, phosphorus, and pesticides, respectively—phosphorus is roughly 78× larger than nitrogen [41]. Among the reviewed studies, only Gil et al. [41] explicitly quantified the contribution of pesticides to Gray WF. The authors reported a pesticide-related Gray WF of 223 m3/t, with the highest observed variability (coefficient of variation ≈ 615%) among the pollutants considered. Although these results indicate that pesticides may contribute substantially to Gray WF under intensive chemical management, the evidence is currently limited to a single study and therefore does not support broader generalizations across tomato production systems. In arid/saline or industrial systems, the “pollutant” is not a nutrient at all. Ramírez’s dried-tomato chain defines gray around chloride dilution (to limit blossom-end rot) and citric-acid processing residue rather than fertilizer leaching, and Khaskhoussy’s saline-irrigation study has gray and total WF rising with irrigation salinity under climate scenarios. Here, salinity, not fertilizer, drives the gray term.
The analysis underscores the critical need for a standardized approach to incorporating pollutants into GWF calculations. Overall, these findings emphasize that both geographical context and field management practices must be considered when interpreting differences in WF values among tomato production systems. Therefore, the observed variability confirms the spatially explicit nature of WF assessment and demonstrates that WF components should be interpreted in relation to local hydroclimatic conditions, irrigation management, and crop yield rather than being compared solely based on their absolute values.
The four LCA-based studies [38,40,43,44], adopted impact-oriented indicators that differ conceptually from the volumetric indicators used within the WFN framework. Rather than quantifying the volume of water consumed, three of these studies [38,40,43] assessed the potential environmental consequences of water use by incorporating local water scarcity through characterization factors or broader impact assessment methods. However, the limited number of LCA-based studies, together with differences in impact indicators, functional units, and system boundaries, prevents a direct quantitative comparison of their results. Page et al. (2011) [38] compared volumetric water-use efficiency with a scarcity-weighted water footprint, demonstrating that the two approaches may lead to opposite conclusions because the latter accounts for local water availability. Similarly, Payen et al. [44] applied a scarcity-based characterization method, expressing freshwater use in H2O equivalents, thereby assigning different environmental relevance to water consumed under contrasting hydroclimatic conditions. Conversely, Maaoui et al. [43] assessed water use within a broader ILCD midpoint framework, considering water resource depletion as one of several environmental impact categories rather than as a stand-alone scarcity indicator. Further differences concerned the level of impact assessment. While Page et al. (2011) [38], Payen et al. [44], and Maaoui et al. [43] remained at the midpoint level, Page et al. (2012) [40] combined water use and greenhouse gas emissions at the endpoint level, allowing the relative contribution of climate change and water consumption to overall environmental damage to be evaluated. The studies also differed in scope, ranging from water-specific assessments to comprehensive multi-impact LCAs including global warming, eutrophication, and energy use.
The results of this review underline the existence of two distinct methodological paradigms within WF assessment. Although both the WFN framework and LCA-based approaches aim to evaluate freshwater use and support sustainable water management, they differ fundamentally in their conceptual foundations and in how they interpret results. As highlighted by Boulay et al. (2013) [13], the key distinction lies in the stage of the assessment process at which the indicator is generated. The WFN framework produces inventory-based indicators through the volumetric accounting of green, blue, and gray water components, followed by a separate sustainability assessment. Conversely, LCA-based approaches generate impact-oriented indicators by translating water consumption into potential environmental consequences through characterization factors. Consequently, although both methodologies generate indicators commonly referred to as “water footprints”, they answer different questions. WFN primarily addresses how much water is appropriated by a product or process, whereas LCA-based approaches seek to determine the environmental consequences associated with that water use. In addition, one of the most debated issues emerging from the literature concerns the incorporation of local water scarcity into water footprint indicators. The development of scarcity-weighted methods, particularly the AWARE approach proposed by Boulay et al. (2018) [14], reflects the growing consensus within the LCA community that the environmental relevance of water consumption depends not only on the volume consumed but also on local water availability conditions. Under this perspective, consuming one liter of water in a highly stressed basin generates greater environmental consequences than consuming the same amount in a water-abundant region. However, this approach remains controversial. Hoekstra (2016) [17] argued that scarcity weighting may obscure the physical meaning of water consumption indicators, create dependencies on external basin conditions, and overlook important dimensions such as Green Water scarcity [17]. In response, Pfister et al. (2017) [16] defended the ISO 14046 perspective, arguing that impact-oriented indicators are essential for environmental decision-making and should complement rather than replace volumetric accounting approaches [16]. The broader concerns raised by Vanham and Mekonnen (2021) [15] further suggest that scarcity-weighted indicators may occasionally generate counterintuitive results when used as standalone sustainability metrics. Therefore, caution is warranted when interpreting scarcity-based water footprint indicators without considering the underlying volumetric water-use patterns.

4.2.2. System Boundaries and Functional Unit

Another consistent pattern concerns the adopted system boundaries. Most studies (93%) limited their assessment to primary production, whereas only a few extended their analysis to processing or other stages of the supply chain. Consequently, evidence on downstream stages remains comparatively limited. Studies adopting broader system boundaries generally identified agricultural production as the main contributor to water use and highlighted the potential influence of irrigation technologies, processing operations, and water reuse strategies on overall water-related performance [42,47,48]. Similarly, open-field production was the most frequently investigated production system (74%), although greenhouse cultivation and, less frequently, hydroponic, ecological, and conventional production systems were also considered. The predominance of assessments limited to primary production suggests that the implications of broader supply-chain boundaries remain comparatively underexplored in the tomato-specific literature. Comparisons among alternative production systems remain relatively limited in the reviewed literature. The three studies, including the processing phase, are not directly comparable in absolute numbers because different functional units (fresh-tomato kg vs. finished-product kg) and system boundaries have been selected. Manfredi and Vignali (2014) [47] assessed the life cycle of tomato puree production in Northern Italy (packaged in 700 g glass jars), revealing that 99% of the total WF was attributable to the cultivation phase, with Blue Water representing the largest share, followed by Green and Gray Water. Ramírez et al. (2015) [42] applied the WFN methodology to evaluate a dried tomato value chain, analyzing the mitigation potential of different technical interventions. They modeled an energy-efficient greenhouse equipped with solar thermal collectors as the cultivation system, in which the water footprint is reduced from 91 to 51.1 L per kg (about a 44% reduction), and they introduced a green water component of 29.8 L through the capture and reuse of plant transpiration condensed on the greenhouse collector roofs for irrigation. Also in this case, most of the impacts are from primary production and the drying (post-harvest) stage; the drying stage explicitly accounts for 5 L of blue water for washing per kg of tomato and 2.5 L of gray water from the 2% citric acid pre-treatment. Alternatively, Winans et al. (2020) [48] applied the Environmental Product Declaration (EPD) methodology over a 10-year timeframe (comparing 2005 against 2015) to evaluate the freshwater consumption per kilogram of tomato paste and diced products. While the processing phase showed similar inter-annual results, direct water uses during the cultivation phase remained the dominant driver, accounting for 98% of total consumption. Nevertheless, overall freshwater use was lower for both the 2015 season and for diced products specifically. The temporal reduction in the agricultural phase was driven by a major industry shift, with 50% of growers adopting highly efficient drip irrigation technologies. Most studies compared alternative production scenarios or production locations, whereas Maaoui et al. [43] evaluated a single production system using a cradle-to-farm-gate approach and a production-based functional unit (1 t of tomatoes), focusing on hotspot identification rather than scenario comparison. Overall, these differences confirm that LCA-based water assessments cannot be considered a single, homogeneous methodological group and that the interpretation of their results depends strongly on the selected impact method, assessment level, functional unit, and system boundary.

4.2.3. Complementarity Rather than Competition

The findings of this review support the growing view that WFN and LCA-based approaches should be regarded as complementary rather than competing methodologies, as reported in the methodological selection matrix for water footprint assessments (Table 4). This interpretation is consistent with the framework proposed by Boulay et al. (2013) [13] and later reinforced by Gerbens-Leenes et al. (2021) [24,63]. WFN provides transparent information regarding the magnitude, location, and composition of freshwater appropriation, making it particularly useful for water resource management, irrigation planning, and supply-chain hotspot identification. LCA-based approaches, on the other hand, provide information regarding the potential environmental consequences of water use and are therefore more appropriate for environmental product comparisons and sustainability assessments. When both approaches are applied within the same assessment, methodological consistency requires that WFN- and LCA-based indicators be interpreted as complementary rather than aggregated into a single metric and their results should be considered jointly but not summed, thereby avoiding double-counting. The debate should therefore not focus on identifying a universally superior methodology. Rather, the selection of an appropriate approach should depend on the decision context and the specific research question being addressed. WFN effectively answers the question “how much water is used?”, whereas LCA-based approaches answer the question “what are the environmental consequences of using that water?”. Neither framework alone provides a complete picture of freshwater sustainability. Integrating volumetric accounting with impact-based assessment may therefore represent the most promising direction for future water footprint research and for supporting sustainable water management in agricultural systems.

5. Conclusions

This review synthesized a final sample of 27 peer-reviewed studies published between 2009 and 2025 on water footprint assessment in tomato production, highlighting the applications of the two main methodological approaches, namely the water footprint network (WFN) framework and LCA-based methods. Although the reviewed studies showed considerable heterogeneity in terms of geographical context, production systems, system boundaries, functional units, and indicators, consistent methodological patterns emerged. The findings confirm that WFN and LCA-based approaches address different but complementary aspects of freshwater sustainability. WFN provides transparent information on water appropriation and hotspot identification, whereas LCA-based methods evaluate the potential environmental consequences of water consumption under local scarcity conditions. Consequently, the choice of methodology should depend on the specific research objective and decision context rather than on the search for a universally preferable approach.
Tomato production proved to be a particularly suitable case study for comparing WFN and LCA-based approaches because it encompasses a wide range of climatic conditions, production systems, and irrigation strategies, allowing the influence of methodological choices to be distinguished from environmental variability. Overall, integrating volumetric accounting with impact-based assessment appears to be the most promising strategy for supporting more comprehensive evaluations of freshwater sustainability and more informed decision-making in agricultural systems.
This review is subject to some limitations. The analysis was restricted to peer-reviewed studies retrieved from a single bibliographic database, potentially excluding relevant contributions from other sources. Furthermore, the heterogeneity of system boundaries, functional units, and water footprint indicators limited the direct comparability of quantitative results across studies. Future research should promote more harmonized reporting practices, particularly for system boundaries, functional units, and grey water footprint calculation, while further exploring integrated assessment frameworks that combine volumetric accounting and impact-based approaches. Applying both methodologies to the same production systems would provide a more comprehensive basis for supporting sustainable water management in agriculture.

Author Contributions

Conceptualization, D.V. and L.L.; methodology, D.V. and L.L.; validation, D.V. and L.L.; formal analysis, D.V. and L.L.; investigation, D.V. and L.L.; resources, D.V. and L.L.; data curation, D.V. and L.L.; writing—original draft preparation, D.V. and L.L.; writing—review and editing, D.V. and L.L.; visualization, D.V. and L.L.; supervision, L.L.; project administration, L.L.; funding acquisition, L.L. All authors have read and agreed to the published version of the manuscript.

Funding

This research received no external funding.

Institutional Review Board Statement

Not applicable.

Informed Consent Statement

Not applicable.

Data Availability Statement

No new data were created or analyzed in this study. Data sharing is not applicable to this article.

Acknowledgments

During the preparation of this manuscript/study, the authors used Gemini 3.0 AI and/or Chat GPT 5.5 AI for the purposes of English language revision. The authors have reviewed and edited the output and take full responsibility for the content of this publication.

Conflicts of Interest

The authors declare no conflicts of interest.

References

  1. Bayart, J.-B.; Bulle, C.; Deschênes, L.; Margni, M.; Pfister, S.; Vince, F.; Koehler, A. A Framework for Assessing Off-Stream Freshwater Use in LCA. Int. J. Life Cycle Assess. 2010, 15, 439–453. [Google Scholar] [CrossRef] [Scilit]
  2. Pfister, S.; Saner, D.; Koehler, A. The Environmental Relevance of Freshwater Consumption in Global Power Production. Int. J. Life Cycle Assess. 2011, 16, 580–591. [Google Scholar] [CrossRef] [Scilit]
  3. Hoekstra, A.Y.; Mekonnen, M.M.; Chapagain, A.K.; Mathews, R.E.; Richter, B.D. Global Monthly Water Scarcity: Blue Water Footprints versus Blue Water Availability. PLoS ONE 2012, 7, e32688. [Google Scholar] [CrossRef] [Scilit] [PubMed]
  4. Ingrao, C.; Matarazzo, A.; Tricase, C.; Clasadonte, M.T.; Huisingh, D. Life Cycle Assessment for Highlighting Environmental Hotspots in Sicilian Peach Production Systems. J. Clean. Prod. 2015, 92, 109–120. [Google Scholar] [CrossRef] [Scilit]
  5. Mekonnen, M.M.; Gerbens-Leenes, W. The Water Footprint of Global Food Production. Water 2020, 12, 2696. [Google Scholar] [CrossRef] [Scilit]
  6. Milano, M.; Ruelland, D.; Fernandez, S.; Dezetter, A.; Fabre, J.; Servat, E.; Fritsch, J.-M.; Ardoin-Bardin, S.; Thivet, G. Current State of Mediterranean Water Resources and Future Trends under Climatic and Anthropogenic Changes. Hydrol. Sci. J. 2013, 58, 498–518. [Google Scholar] [CrossRef] [Scilit]
  7. Aman, H.; Doost, Z.H.; Hejran, A.W.; Mehr, A.D.; Szczepanek, R.; Gilja, G. Survey on The Challenges for Achieving SDG 6: Clean Water and Sanitation: A Global Insight. Knowl.-Based Eng. Sci. 2024, 5, 21–42. [Google Scholar] [CrossRef] [Scilit]
  8. Hoekstra, A.Y.; Aldaya, M.M.; Mekonnen, M.M. The Water Footprint Assessment Manual: Setting the Global Standard; Earthscan: London, UK, 2011. [Google Scholar]
  9. Jiang, Q.; Chi, H.; Tao, M.; Wang, Z.; Zhao, Y. Research on Water Footprint in Supply Chain Perspective: A Review. Agric. Water Manag. 2026, 323, 110056. [Google Scholar] [CrossRef] [Scilit]
  10. Pellegrini, G.; Ingrao, C.; Camposeo, S.; Tricase, C.; Contò, F.; Huisingh, D. Application of Water Footprint to Olive Growing Systems in the Apulia Region: A Comparative Assessment. J. Clean. Prod. 2016, 112, 2407–2418. [Google Scholar] [CrossRef] [Scilit]
  11. ISO14046; Environmental Management—Water Footprint—Principles, Requirements and Guidelines 2014. ISO: Geneva, Switzerland, 2014.
  12. Quinteiro, P.; Ridoutt, B.G.; Arroja, L.; Dias, A.C. Identification of Methodological Challenges Remaining in the Assessment of a Water Scarcity Footprint: A Review. Int. J. Life Cycle Assess. 2018, 23, 164–180. [Google Scholar] [CrossRef] [Scilit]
  13. Boulay, A.-M.; Hoekstra, A.Y.; Vionnet, S. Complementarities of Water-Focused Life Cycle Assessment and Water Footprint Assessment. Environ. Sci. Technol. 2013, 47, 11926–11927. [Google Scholar] [CrossRef] [Scilit] [PubMed]
  14. Boulay, A.-M.; Bare, J.; Benini, L.; Berger, M.; Lathuillière, M.J.; Manzardo, A.; Margni, M.; Motoshita, M.; Núñez, M.; Pastor, A.V.; et al. The WULCA Consensus Characterization Model for Water Scarcity Footprints: Assessing Impacts of Water Consumption Based on Available Water Remaining (AWARE). Int. J. Life Cycle Assess. 2018, 23, 368–378. [Google Scholar] [CrossRef] [Scilit]
  15. Vanham, D.; Mekonnen, M.M. The Scarcity-Weighted Water Footprint Provides Unreliable Water Sustainability Scoring. Sci. Total Environ. 2021, 756, 143992. [Google Scholar] [CrossRef] [Scilit] [PubMed]
  16. Pfister, S.; Boulay, A.-M.; Berger, M.; Hadjikakou, M.; Motoshita, M.; Hess, T.; Ridoutt, B.; Weinzettel, J.; Scherer, L.; Döll, P.; et al. Understanding the LCA and ISO Water Footprint: A Response to Hoekstra (2016) “A Critique on the Water-Scarcity Weighted Water Footprint in LCA”. Ecol. Indic. 2017, 72, 352–359. [Google Scholar] [CrossRef] [Scilit] [PubMed]
  17. Hoekstra, A.Y. A Critique on the Water-Scarcity Weighted Water Footprint in LCA. Ecol. Indic. 2016, 66, 564–573. [Google Scholar] [CrossRef] [Scilit]
  18. Saraiva, A.; Rodrigues, G.; Mamede, H.; Silvestre, J.; Dias, I.; Feliciano, M.; Oliveira e Silva, P.; Oliveira, M. The Impact of the Winery’s Wastewater Treatment System on the Winery Water Footprint. Water Sci. Technol. 2019, 80, 1823–1831. [Google Scholar] [CrossRef] [Scilit] [PubMed]
  19. Saraiva, A.; Presumido, P.; Silvestre, J.; Feliciano, M.; Rodrigues, G.; Silva, P.O.; Damásio, M.; Ribeiro, A.; Ramôa, S.; Ferreira, L.; et al. Water Footprint Sustainability as a Tool to Address Climate Change in the Wine Sector: A Methodological Approach Applied to a Portuguese Case Study. Atmosphere 2020, 11, 934. [Google Scholar] [CrossRef] [Scilit]
  20. Chapagain, A.K.; Orr, S. An Improved Water Footprint Methodology Linking Global Consumption to Local Water Resources: A Case of Spanish Tomatoes. J. Environ. Manag. 2009, 90, 1219–1228. [Google Scholar] [CrossRef] [Scilit] [PubMed]
  21. Almeida, J.; Achten, W.M.J.; Verbist, B.; Heuts, R.F.; Schrevens, E.; Muys, B. Carbon and Water Footprints and Energy Use of Greenhouse Tomato Production in Northern Italy. J. Ind. Ecol. 2014, 18, 898–908. [Google Scholar] [CrossRef] [Scilit]
  22. Payen, S.; Basset-Mens, C. Environmental Assessment with LCA of Tomato Produced in Morocco and Exported to France: The Importance of Freshwater Use Impacts. In Proceedings of the SWUP-MED Project Final Conference “Sustainable Water Use for Securing Food Production in the Mediterranean Region Under Changing Climate”, Agadir, Morocco, 10–15 March 2013; IAV Hassan II, University of Copenhagen: Copenhagen, Denmark, 2013; pp. 612–627. [Google Scholar]
  23. Le Roux, B.; van der Laan, M.; Gush, M.B.; Bristow, K.L. Comparing the Usefulness and Applicability of Different Water Footprint Methodologies for Sustainable Water Management in Agriculture. Irrig. Drain. 2018, 67, 790–799. [Google Scholar] [CrossRef] [Scilit]
  24. Gerbens-Leenes, W.; Berger, M.; Allan, J. Water Footprint and Life Cycle Assessment: The Complementary Strengths of Analyzing Global Freshwater Appropriation and Resulting Local Impacts. Water 2021, 13, 803. [Google Scholar] [CrossRef] [Scilit]
  25. Allan, J.A. Fortunately There Are Substitutes for Water Otherwise Our Hydro-Political Futures Would Be Impossible. Prior. Water Resour. Alloc. Manag. 1993, 13, 26. [Google Scholar]
  26. Chapagain, A.K.; Hoekstra, A.Y. Water Footprints of Nations, Volume 1: Main Report; Value of Water Research Series No. 16; UNESCO-IHE Institute for Water Education: Delft, The Netherlands, 2004. [Google Scholar]
  27. Borsato, E.; Tarolli, P.; Marinello, F. Sustainable Patterns of Main Agricultural Products Combining Different Footprint Parameters. J. Clean. Prod. 2018, 179, 357–367. [Google Scholar] [CrossRef] [Scilit]
  28. Pfister, S.; Koehler, A.; Hellweg, S. Assessing the Environmental Impacts of Freshwater Consumption in LCA. Environ. Sci. Technol. 2009, 43, 4098–4104. [Google Scholar] [CrossRef] [Scilit] [PubMed]
  29. Voccia, D.; Mortella, G.; Ferrari, F.; Fontanella, M.C.; Trevisan, M.; Lamastra, L. The Anthropic Pressure on the Grey Water Footprint: The Case of the Vulnerable Areas of the Emilia-Romagna Region in Italy. Sustainability 2022, 14, 16353. [Google Scholar] [CrossRef] [Scilit]
  30. Franke, N.A.; Boyacioglu, H.; Hoekstra, A.Y. Grey Water Footprint Accounting: Tier 1 Supporting Guidelines; Value of Water Research Report Series No. 65; UNESCO-IHE Institute for Water Education: Delft, The Netherlands, 2013; p. 64. [Google Scholar]
  31. ISO14044; Environmental Management—Life Cycle Assessment—Requirements and Guidelines 2006. ISO: Geneva, Switzerland, 2006.
  32. ISO14040; Environmental Management—Life Cycle Assessment—Principles and Framework 2006. ISO: Geneva, Switzerland, 2006.
  33. Do, Q.; Ramudhin, A.; Colicchia, C.; Creazza, A.; Li, D. A Systematic Review of Research on Food Loss and Waste Prevention and Management for the Circular Economy. Int. J. Prod. Econ. 2021, 239, 108209. [Google Scholar] [CrossRef] [Scilit]
  34. Tranfield, D.; Denyer, D.; Smart, P. Towards a Methodology for Developing Evidence-Informed Management Knowledge by Means of Systematic Review. Br. J. Manag. 2003, 14, 207–222. [Google Scholar] [CrossRef] [Scilit]
  35. Aivazidou, E.; Tsolakis, N.; Iakovou, E.; Vlachos, D. The Emerging Role of Water Footprint in Supply Chain Management: A Critical Literature Synthesis and a Hierarchical Decision-Making Framework. J. Clean. Prod. 2016, 137, 1018–1037. [Google Scholar] [CrossRef] [Scilit]
  36. Mongeon, P.; Paul-Hus, A. The Journal Coverage of Web of Science and Scopus: A Comparative Analysis. Scientometrics 2016, 106, 213–228. [Google Scholar] [CrossRef] [Scilit]
  37. Capurso, A. The Mediterranean Diet: A Historical Perspective. Aging Clin. Exp. Res. 2024, 36, 78. [Google Scholar] [CrossRef] [Scilit] [PubMed]
  38. Page, G.; Ridoutt, B.; Bellotti, B. Fresh Tomato Production for the Sydney Market: An Evaluation of Options to Reduce Freshwater Scarcity from Agricultural Water Use. Agric. Water Manag. 2011, 100, 18–24. [Google Scholar] [CrossRef] [Scilit]
  39. Evangelou, E.; Tsadilas, C.; Tserlikakis, N.; Tsitouras, A.; Kyritsis, A. Water Footprint of Industrial Tomato Cultivations in the Pinios River Basin: Soil Properties Interactions. Water 2016, 8, 515. [Google Scholar] [CrossRef] [Scilit]
  40. Page, G.; Ridoutt, B.; Bellotti, B. Carbon and Water Footprint Tradeoffs in Fresh Tomato Production. J. Clean. Prod. 2012, 32, 219–226. [Google Scholar] [CrossRef] [Scilit]
  41. Gil, R.; Bojacá, C.R.; Schrevens, E. Environmental Savings in Tomato Production under Optimal Agrochemicals Management: A Modeling Approach. In Proceedings of the V International Symposium on Applications of Modelling as an Innovative Technology in the Horticultural Supply Chain-Model-IT 1154, Wageningen, The Netherlands, 15 March 2017; Volume 1154. [Google Scholar]
  42. Ramírez, T.; Meas, Y.; Dannehl, D.; Schuch, I.; Miranda, L.; Rocksch, T.; Schmidt, U. Water and Carbon Footprint Improvement for Dried Tomato Value Chain. J. Clean. Prod. 2015, 104, 98–108. [Google Scholar] [CrossRef] [Scilit]
  43. Maaoui, M.; Boukchina, R.; Hajjaji, N. Environmental Life Cycle Assessment of Mediterranean Tomato: Case Study of a Tunisian Soilless Geothermal Multi-Tunnel Greenhouse. Environ. Dev. Sustain. 2021, 23, 1242–1263. [Google Scholar] [CrossRef] [Scilit]
  44. Payen, S.; Basset-Mens, C.; Perret, S. LCA of Local and Imported Tomato: An Energy and Water Trade-Off. J. Clean. Prod. 2015, 87, 139–148. [Google Scholar] [CrossRef] [Scilit]
  45. Platis, D.P.; Mamolos, A.P.; Kalburtji, K.L.; Menexes, G.C.; Anagnostopoulos, C.D.; Tsaboula, A.D. Analysis of Energy and Carbon and Blue Water Footprints in Agriculture: A Case Study of Tomato Cultivation Systems. Euro-Mediterr. J. Environ. Integr. 2021, 6, 12. [Google Scholar] [CrossRef] [Scilit]
  46. Taipe Velasco, C.M.; Lizano Acevedo, R.X.; Mátyás, B. Comparative Study of the Environmental Impact of Models of Conventional Agricultural and Agro-Ecological Agriculture in the Agricultural Phase of Tomato Cultivation. F1000Research 2018, 7, 666. [Google Scholar] [CrossRef] [Scilit]
  47. Manfredi, M.; Vignali, G. Life Cycle Assessment of a Packaged Tomato Puree: A Comparison of Environmental Impacts Produced by Different Life Cycle Phases. J. Clean. Prod. 2014, 73, 275–284. [Google Scholar] [CrossRef] [Scilit]
  48. Winans, K.; Brodt, S.; Kendall, A. Life Cycle Assessment of California Processing Tomato: An Evaluation of the Effects of Evolving Practices and Technologies over a 10-Year (2005–2015) Timeframe. Int. J. Life Cycle Assess. 2020, 25, 538–547. [Google Scholar] [CrossRef] [Scilit]
  49. Irabien, A.; Darton, R.C. Darton Energy–Water–Food Nexus in the Spanish Greenhouse Tomato Production. Clean Technol. Environ. Policy 2016, 18, 1307–1316. [Google Scholar] [CrossRef] [Scilit]
  50. Ventrella, D.; Giglio, L.; Garofalo, P.; Dalla Marta, A. Regional Assessment of Green and Blue Water Consumption for Tomato Cultivated in Southern Italy. J. Agric. Sci. 2018, 156, 689–701. [Google Scholar] [CrossRef] [Scilit]
  51. Aldaya, M.M.; Hoekstra, A.Y. The Water Needed for Italians to Eat Pasta and Pizza. Agric. Syst. 2010, 103, 351–360. [Google Scholar] [CrossRef] [Scilit]
  52. Hossain, I.; Imteaz, M.A.; Khastagir, A. Water Footprint: Applying the Water Footprint Assessment Method to Australian Agriculture. J. Sci. Food Agric. 2021, 101, 4090–4098. [Google Scholar] [CrossRef] [Scilit] [PubMed]
  53. Parada, F.; Gabarrell, X.; Rufí-Salís, M.; Arcas-Pilz, V.; Muñoz, P.; Villalba, G. Optimizing Irrigation in Urban Agriculture for Tomato Crops in Rooftop Greenhouses. Sci. Total Environ. 2021, 794, 148689. [Google Scholar] [CrossRef] [Scilit] [PubMed]
  54. Maffia, A.; Marra, F.; Canino, F.; Oliva, M.; Mallamaci, C.; Celano, G.; Muscolo, A. Comparative Study of Fertilizers in Tomato-Grown Soils: Soil Quality, Sustainability, and Carbon/Water Footprints. Soil Syst. 2023, 7, 109. [Google Scholar] [CrossRef] [Scilit]
  55. Crovella, T.; Paiano, A.; Lagioia, G. A Meso-Level Water Use Assessment in the Mediterranean Agriculture. Multiple Applications of Water Footprint for Some Traditional Crops. J. Clean. Prod. 2022, 330, 129886. [Google Scholar] [CrossRef] [Scilit]
  56. Wang, M.; Du, Y.; Jiang, T. Risk-Based Decision-Making Systems in Water and Food Security of Global Drylands. Water Supply 2023, 23, 2224–2232. [Google Scholar] [CrossRef] [Scilit]
  57. Egea, G.; Castro-Valdecantos, P.; Gómez-Durán, E.; Munuera, T.; Domínguez-Niño, J.M.; Nortes, P.A. Impact of Irrigation Management Decisions on the Water Footprint of Processing Tomatoes in Southern Spain. Agronomy 2024, 14, 1863. [Google Scholar] [CrossRef] [Scilit]
  58. Khaskhoussy, K.; Zarai, B.; Zouari, M.; Nasr, Z.; Hachicha, M. The Impact of Climate Change on Tomato Water Footprint under Irrigation with Saline Water in a Kairouan Irrigated Area (Tunisia Center). Horticulturae 2024, 10, 1267. [Google Scholar] [CrossRef] [Scilit]
  59. Bazarfshan, O.; Yahyazadeh, M.; Jamshidi, S.; Zamani, H. Spatial Prioritization of Tomato Cultivation Based on Water Footprint, Land Productivity, and Economic Indices. Irrig. Drain. 2022, 71, 1363–1378. [Google Scholar] [CrossRef] [Scilit]
  60. Botello-Aguillón, C.; Alcalá, R.V.; Sangerman-Jarquín, D.M.; Ortiz, J.H.; García, F.G.G.; Romero, F.S. Estimation of the Agricultural Water Footprint of DR 011, Upper Lerma River [Estimación de La Huella Hídrica Agrícola Del DR 011, Alto Río Lerma]. Rev. Mex. Cienc. Agric. 2024, 15, e3319. [Google Scholar] [CrossRef] [Scilit]
  61. Wyngaard, S.R.; Kissinger, M. Tomatoes from the Desert: Environmental Footprints and Sustainability Potential in a Changing World. Front. Sustain. Food Syst. 2022, 6, 994920. [Google Scholar] [CrossRef] [Scilit]
  62. Iacuzzi, N.; Tortorici, N.; Mosca, C.; Bondì, C.; Sarno, M.; Tuttolomondo, T. Crop Water Requirement Estimated with Data-Driven Models Improves the Reliability of CROPWAT 8.0 and the Water Footprint of Processing Tomato Grown in a Hot-Arid Environment. Agronomy 2025, 15, 1533. [Google Scholar] [CrossRef] [Scilit]
  63. Mekonnen, M.M.; Hoekstra, A.Y. The Green, Blue and Grey Water Footprint of Crops and Derived Crop Products. Hydrol. Earth Syst. Sci. 2011, 15, 1577–1600. [Google Scholar] [CrossRef] [Scilit]
Figure 1. Yearly distribution of the paper published from 2009 to 2025 about WF (dark blue), after abstract screening (orange) and full-text analysis (dark green).
World 07 00132 g001
Table 1. Main methodological differences between WFN and LCA-based water footprint assessment.
AspectWFNLCA-Based
Primary objectiveWater appropriation accountingEnvironmental impact assessment
Assessment stageInventoryImpact assessment
Main indicatorGreen, Blue, Gray WFWater scarcity footprint
Unitm3 waterm3 world-eq/m3 deprived
Green waterIncludedNot included
Gray waterIncludedGenerally, not included
Local water scarcityAssessed separatelyEmbedded in characterization factors
Main applicationWater resource managementProduct environmental comparison
Main strengthTransparency and traceabilityEnvironmental relevance
Main limitationLimited impact interpretationReduced physical transparency
Adapted from [11,12,13,24].
Table 2. Number of papers found with keyword combinations and relative screening.
KeywordsBoolean Operator + CropRaw ResultsAbstract ScreeningFull-Text Analysis
Water footprintAND
Tomato
1243123
Freshwater use193129
Freshwater depletion822
Freshwater degradation700
LCA water891211
Total4215745
Total (without duplicates)3513627
Table 3. List of papers selected, specifying authors, location, system boundaries, production system, adopted methodology, functional unit, indicator and main objective.
AuthorsStudy AreaSystem BoundariesProduction SystemApproachFunctional UnitGreen WFBlue WFGray WFLCA-Based IndicatorPrimary Research Objective
Page et al., 2011 [38]AustraliaPrimary productionOpen fieldWFN, LCAL/kg of FT and Leq/kg of FT-2.1–16-3.2–27Methodological comparison
Chapagain & Orr, 2009 [20]SpainPrimary productionOpen fieldWFNL/kg of FT13.660.57.2-Methodological development
Evangelou et al., 2016 [39]GreecePrimary productionOpen fieldWFNL/kg of FT1.84–49.716.10–68.2310.24–42.65-WF quantification
Page et al., 2012 [40]AustraliaPrimary productionOpen fieldLCALeq/kg of FT---4.97–52.78Sustainability assessment
Gil et al., 2017 [41]Colombia (NF)Primary productionOpen fieldWFNL/kg of FT--79-Water pollution assessment (Gray WF)
Colombia (PF)WFN--6182.1-
Colombia (P)WFN--232.2-
Almeida et al., 2014 [21]Northern ItalyPrimary productionGreenhouseWFNL/kg of FT-9131.6-Sustainability assessment
Ramirez et al., 2015 [42]MexicoPrimary productionGreenhouseWFNL/kg of FT-63.621.5-Scenario analysis
Semi-closed greenhouses29.86.310.8
ProcessingDrying 510
Maaoui et al., 2021 [43]TunisiaPrimary productionGreenhouseWFN
LCA
m3/ton of FT (WF)
m3eq/ton of FT (WRD)
---1.33Sustainability assessment/scenario analysis
Payen et al., 2015 [44]MoroccoPrimary productionGreenhouseLCALeq/kg of FT---27.93Sustainability assessment
Platis et al., 2021 [45]GreecePrimary productionOpen field, Greenhouse and HydroponicWFNL/kg of FT----Production system comparison
Taipe Velasco et al., 2018 [46]EcuadorPrimary productionEcological and conventional plotsWFNL/kg of FT1.5–34.420.76–87.540.11–259-Production system comparison
Manfredi & Vignali, 2014 [47]ItalyPrimary production and processingOpen fieldWFNL/700 g puree54.534.615.7-Supply chain assessment
Winans et al., 2020 [48]CaliforniaPrimary production and processingGreenhouseLCAL/kg FT (FWU)----Supply chain assessment
GreenhouseLCAL/kg processed tomatoes (FWU)----
Irabien & Darton, 2016 [49]SpainPrimary productionGreenhouseWFNL/kg of FT-66121-Sustainability assessment
Ventrella et al., 2018 [50]ItalyPrimary productionOpen fieldWFNL/kg of FT508–579- Climate change assessment
Aldaya & Hoekstra, 2010 [51]ItalyPrimary productionOpen fieldWFNL/kg of FT356019-WF quantification
Hossain et al., 2021 [52]AustraliaPrimary productionOpen fieldWFNL/kg of FT136.264.411.7-WF quantification
Parada et al., 2021 [53]SpainPrimary productionGreenhouseWUEL/kg of FT-48.7–75.2--Irrigation management assessment
Maffia et al., 2023 [54]ItalyPrimary productionOpen fieldWFNL/kg of FT34.2–42.245.6–56.70.0–0.4-Fertilization management assessment
Crovella et al., 2022 [55]ItalyPrimary productionOpen fieldWFNL/kg of FT13.836.5219.4-Climate change assessment
Wang et al., 2023 [56]ChinaPrimary productionOpen fieldWFNL/kg of FT265–283 Water management/food security assessment
GWI 255–272
Egea et al., 2024 [57]SpainPrimary productionOpen fieldWFNL/kg of FT6.7–8.721.9–40.48.8–95.6-Irrigation management assessment
Khaskhoussy et al., 2024 [58]TunisiaPrimary productionOpen fieldWFNL/kg of FT16.271.850.9-Climate change assessment
Bazarfshan et al., 2022 [59]IranPrimary productionOpen fieldWFNL/kg of FT1.5–38.8 46.2–63886.8–771.6-Sustainability assessment
Botello-Aguillòn et al., 2024 [60]MexicoPrimary productionOpen fieldWFNL/kg of FT46.7195.950.1-WF quantification
Wyngaard & Kissinger, 2022 [61]IsraelPrimary productionOpen fieldWFNL/kg of FT-79–116--WF quantification
Iacuzzi et al., 2025 [62]ItalyPrimary productionOpen fieldWFNL/kg of FT2.5–5.423.5–44.96.2–9.1-Irrigation management assessment
Note: WFN = water footprint network; LCA = life cycle assessment; WF = water footprint; NF, PF, and P = nitrogen and phosphorus fertilizer and pesticides, WUE = water use efficiency. “-” indicates that the corresponding WF component or indicator was not assessed or reported in the original study. Numerical values and units are reported according to the functional units and methodological frameworks adopted in the original studies. WFN-based volumetric WF values and LCA-based impact indicators represent conceptually different metrics and are therefore not directly comparable. Even within the same methodological framework, direct comparison may be limited by differences in system boundaries, geographical and hydroclimatic contexts, production systems, and methodological assumptions.
Table 4. Methodological selection matrix for water footprint assessments.
Decision ContextPrimary UserRecommended ApproachKey Justification
On-farm irrigation scheduling and agronomic water-use efficiencyAgronomists, Farmers, Irrigation DistrictsWFNRequires precise physical volumes of green and blue water evapotranspiration to optimize crop yield per drop.
Local watershed water-allocation and basin-level resource stewardshipRiver Basin Authorities, Regional GovernmentsWFNRequires transparent volumetric accounting of water consumption against local ecological reserve requirements.
Product environmental declarations (EPD) and comparative ecolabelingSustainability Managers, Product DesignersLCA-based (ISO 14046)ISO compliance ensures scientific rigor, allows normalization, and prevents “double-counting” in product supply chains.
Assessing trade-offs between water efficiency and other environmental impacts (e.g., energy, greenhouse gases)Life Cycle Practitioners, ResearchersLCA-based (ISO 14046)Seamlessly integrates with other midpoint impact categories (e.g., Global Warming Potential, Eutrophication).
Corporate water risk assessment and strategic supply-chain sourcingCorporate Sustainability Officers, Procurement TeamsCombined (WFN + LCA)WFN maps the exact volumetric dependencies of sourcing regions; LCA translates these volumes into local scarcity-weighted risks to identify critical hotspots.
Agrochemical runoff and diffuse water pollution managementEnvironmental Regulators, Basin PlannersCombined (WFN + LCA)WFN (Gray WF) acts as an immediate volumetric indicator of regional chemical load pressures; LCA models the complex ecotoxicological fate and nutrient enrichment impacts on aquatic ecosystems.
Disclaimer/Publisher’s Note: The statements, opinions and data contained in all publications are solely those of the individual author(s) and contributor(s) and not of MDPI and/or the editor(s). MDPI and/or the editor(s) disclaim responsibility for any injury to people or property resulting from any ideas, methods, instructions or products referred to in the content.