Article

Particle Swarm Optimization-Enhanced Fuzzy Control for Electrical Conductivity Regulation in Integrated Water–Fertilizer Irrigation Systems

College of Engineering, Anhui Agricultural University, Hefei 230036, China
*
Author to whom correspondence should be addressed.
Automation 2025, 6(4), 76; https://doi.org/10.3390/automation6040076
Submission received: 22 September 2025 / Revised: 3 November 2025 / Accepted: 12 November 2025 / Published: 20 November 2025
(This article belongs to the Section Intelligent Control and Machine Learning)

Abstract

Traditional water–fertilizer control systems often suffer from poor precision and slow response, limiting precision agriculture development. This study developed an electrical conductivity (EC) control system for water–fertilizer integration using a fuzzy Proportional-Integral-Derivative (PID) controller optimized by particle swarm optimization (PSO) and integrated with IoT technology. MATLAB/Simulink simulations showed the proposed controller achieved the smallest overshoot (7.64–8.15%), with average settling time reduced by 62.48 s and 20.38 s compared to conventional PID and fuzzy PID controllers, respectively (p < 0.001). Field experiments on winter wheat demonstrated a mean absolute EC deviation of 0.01125 ms/cm, with root-mean-square error (RMSE) of 0.0217 ms/cm, indicating high precision under field conditions. The system also maintained soil moisture in the optimal range (19–25%) with high irrigation uniformity (Christiansen’s coefficient Cu = 97.6%). The system maintained soil moisture in the optimal range (19–25%) while supporting stable soil nutrient levels and crop growth parameters. This study provides a validated technical solution for precision EC control while establishing a foundation for future fully integrated water–fertilizer management systems.

1. Introduction

Global agriculture faces dual challenges of water scarcity [1] and soil degradation [2] caused by excessive fertilizer application [3], making integrated water–fertilizer technology [4] critical for safeguarding crop yields and agricultural sustainability. In integrated water–fertilizer systems, the accuracy of fertilizer concentration control—characterized by the electrical conductivity (EC) value [5]—directly influences fertilization efficacy. The performance of concentration regulation significantly affects both crop development and resource-use efficiency. Conventional PID controllers [6,7,8] have been widely adopted in early-stage fertilizer concentration control systems due to their simple structure and ease of implementation. However, the water–fertilizer mixing process exhibits time delays and nonlinear disturbances. The fixed parameters of traditional PID controllers [9] hinder their ability to adapt to dynamic changes in system behavior, often resulting in excessive overshoot, response lag, and significant steady-state error. As a result, they fall short of meeting the demands of precision fertilization. Fuzzy PID controllers [10], which adjust PID parameters dynamically via fuzzy rules, offer improved adaptability compared to conventional PID control. Nevertheless, the design of fuzzy rules and the selection of quantization and scaling factors often depend heavily on expert experience, which may lead to suboptimal parameter tuning. Thus, even fuzzy PID control exhibits limited performance in complex field environments.
With the advancement of IoT technology and intelligent optimization algorithms [11] the integration of intelligent algorithms with conventional control methods has emerged as a key approach to addressing challenges in water–fertilizer concentration control. As an efficient intelligent optimization technique, the particle swarm optimization (PSO) algorithm [12] offers rapid convergence and strong global search capabilities, making it well-suited for optimizing parameters in fuzzy PID controllers. This integration significantly enhances control precision and system stability. Meanwhile, IoT technology enables real-time acquisition [13], transmission, and remote control of farmland environmental data, providing essential data support and an operational platform for the practical implementation of fertilization control models.
Currently, scholars both domestically and internationally have conducted extensive research in the field of water–fertilizer integrated fertilization control. Research abroad started earlier, with countries such as Israel and the Netherlands [14,15] having achieved full-chain development spanning algorithm optimization, equipment development, and system integration. For instance, the integrated water–fertilizer irrigation system developed by Netafim (Israel) achieves precise EC control with an error margin of ±0.02 ms/cm. Similarly, Wageningen University (The Netherlands) proposed a model predictive control (MPC)-based regulation strategy that further enhances system response speed and fertilizer utilization efficiency. Although domestic research began later, it has progressed rapidly in recent years. Notable advances have been made in optimizing control algorithms—such as fuzzy PID and genetic algorithm-optimized PID—with researchers proposing various improved approaches including genetic algorithms [16], neural network algorithms [17], and ant colony optimization [18]. Progress has also been made in the localization of key components (e.g., EC sensors and integrated water–fertilizer machines) and the integration of IoT-based systems. Nevertheless, most existing studies focus on isolated improvements in either control algorithms or hardware equipment, with limited emphasis on the deep integration of control models with IoT technology. Moreover, the anti-interference capability and practical performance under complex field conditions still require further validation.
In this study, a fuzzy PID fertilization control model optimized by particle swarm optimization (PSO) is designed, in which key parameters of the fuzzy PID controller are tuned using an improved PSO algorithm. Supported by IoT technology, the system hardware was selected and a Web-based cloud platform was developed. Both simulation and field experiments were conducted to validate the proposed approach. The aim of this work is to address the limitations in precision and response speed inherent in traditional fertilization control methods, thereby providing an effective technical solution for precision fertilization in water–fertilizer integrated systems and supporting the transition toward modernized and sustainable agricultural practices [19].
This study tests the following hypotheses:
Hypothesis 1:
The PSO-optimized fuzzy PID controller will significantly reduce overshoot, settling time, and steady-state error compared to conventional PID and standard fuzzy PID controllers in water–fertilizer mixing processes.

2. Materials and Methods

2.1. System Hardware Architecture

The fertilization control system mainly includes three parts: the perception layer [20], the network layer [21], and the application layer [22]. The composition and functions of each part are as follows: The perception layer is responsible for collecting key data required for fertilization control and serves as the basis for control decision-making. Its core components include EC sensors [23], electrical flowmeters, and equipment status detection components; the network layer is connected through the water–fertilizer integrated machine and the Web cloud platform to ensure the real-time transmission of control commands (such as EC target value, adjusting the fertilizer injection pump); the application layer includes a control algorithm module, a Web cloud platform, and an execution mechanism.
The core goal of the fertilization control system is the precise control of the EC value [24] of the water–fertilizer solution. The specific workflow is as follows: First, the EC sensors in the perception layer collect the EC values of the water–fertilizer solution and soil in real time, the electromagnetic flowmeter monitors the irrigation water flow, and the status monitoring component of the water–fertilizer integrated machine synchronously obtains data such as the rotation speed of the fertilizer injection pump and the switch status of the solenoid valve. After being summarized, these data are first subjected to preprocessing such as filtering and temperature compensation, and then uploaded to the network layer through the NB-IoT wireless transmission method; the network layer transmits the data from the perception layer to the application layer through NB-IoT, and at the same time issues the control commands from the application layer to the water–fertilizer integrated machine through Ethernet wired transmission, ensuring the real-time performance of data and commands; in the application layer, the Web cloud platform receives the uploaded data and provides functions such as EC target value setting and data visualization. The particle swarm optimization (PSO) module optimizes the quantization factors and proportional factors of the fuzzy PID controller with the goal of minimizing ITAE. The fuzzy PID controller outputs the PID parameter correction amounts according to the EC value deviation e and the deviation change rate ec. Finally, the core node of the algorithm calculates the PWM duty cycle of the fertilizer injection pump and generates control commands; after receiving the control commands, the execution mechanism adjusts the fertilizer injection amount of the Venturi fertilizer injection pump according to the PWM duty cycle, the solenoid valve adjusts the irrigation water flow in a matching manner, and the stirring motor is started to ensure that the water and fertilizer are mixed uniformly within 3 min. After the fertilizer solution configuration is completed, the EC sensor collects the EC value again, feeds the data back to the perception layer, and re-enters the links of data collection and deviation calculation to form a closed-loop control and realize stable and precise fertilization control. The specific workflow is illustrated in Figure 1.

2.2. Control Algorithm Design

2.2.1. Conventional PID Controller

The PID controller realizes control through the linear combination of three parts: proportional (P), integral (I), and differential (D). The expression of its continuous-time domain control law is:
u t = k p e t + 1 T i 0 t e t d t + T d d e ( t ) d t + u 0
In the formula, k p is the proportional coefficient; T i is the integral time constant; T d is the differential time constant; u 0 is the initial value of the controller output.
In the digital control system, the incremental PID control algorithm is adopted to avoid the deviation accumulation of the integral link, and its discretization expression is:
u k = u k u k 1 = k p ( e k e k 1 ) + k i e k + k d ( e k 2 e k 1 + e k 2 )
In the formula, k is the sampling sequence number; k p is the proportional coefficient; k i is the integral coefficient; k d is the differential coefficient.

2.2.2. Fuzzy PID Controller

The fuzzy PID controller dynamically modifies the PID parameters through fuzzy reasoning, and its structure is shown in Figure 2. With the EC value deviation e and the deviation change rate ec as inputs, after fuzzification, fuzzy reasoning, and defuzzification, the PID parameter correction amounts k p , k i , k d are output to realize the online adjustment of the PID parameters. The correction formula is as shown in (3):
k p = k p 0 + k p k i = k i 0 + k i k d = k d 0 + k d
In the formula, k p 0 , k i 0 , k d 0 are the parameters before correction; k p , k i   and   k d are the correction amounts; k p , k i   and   k d are the control parameters after correction.
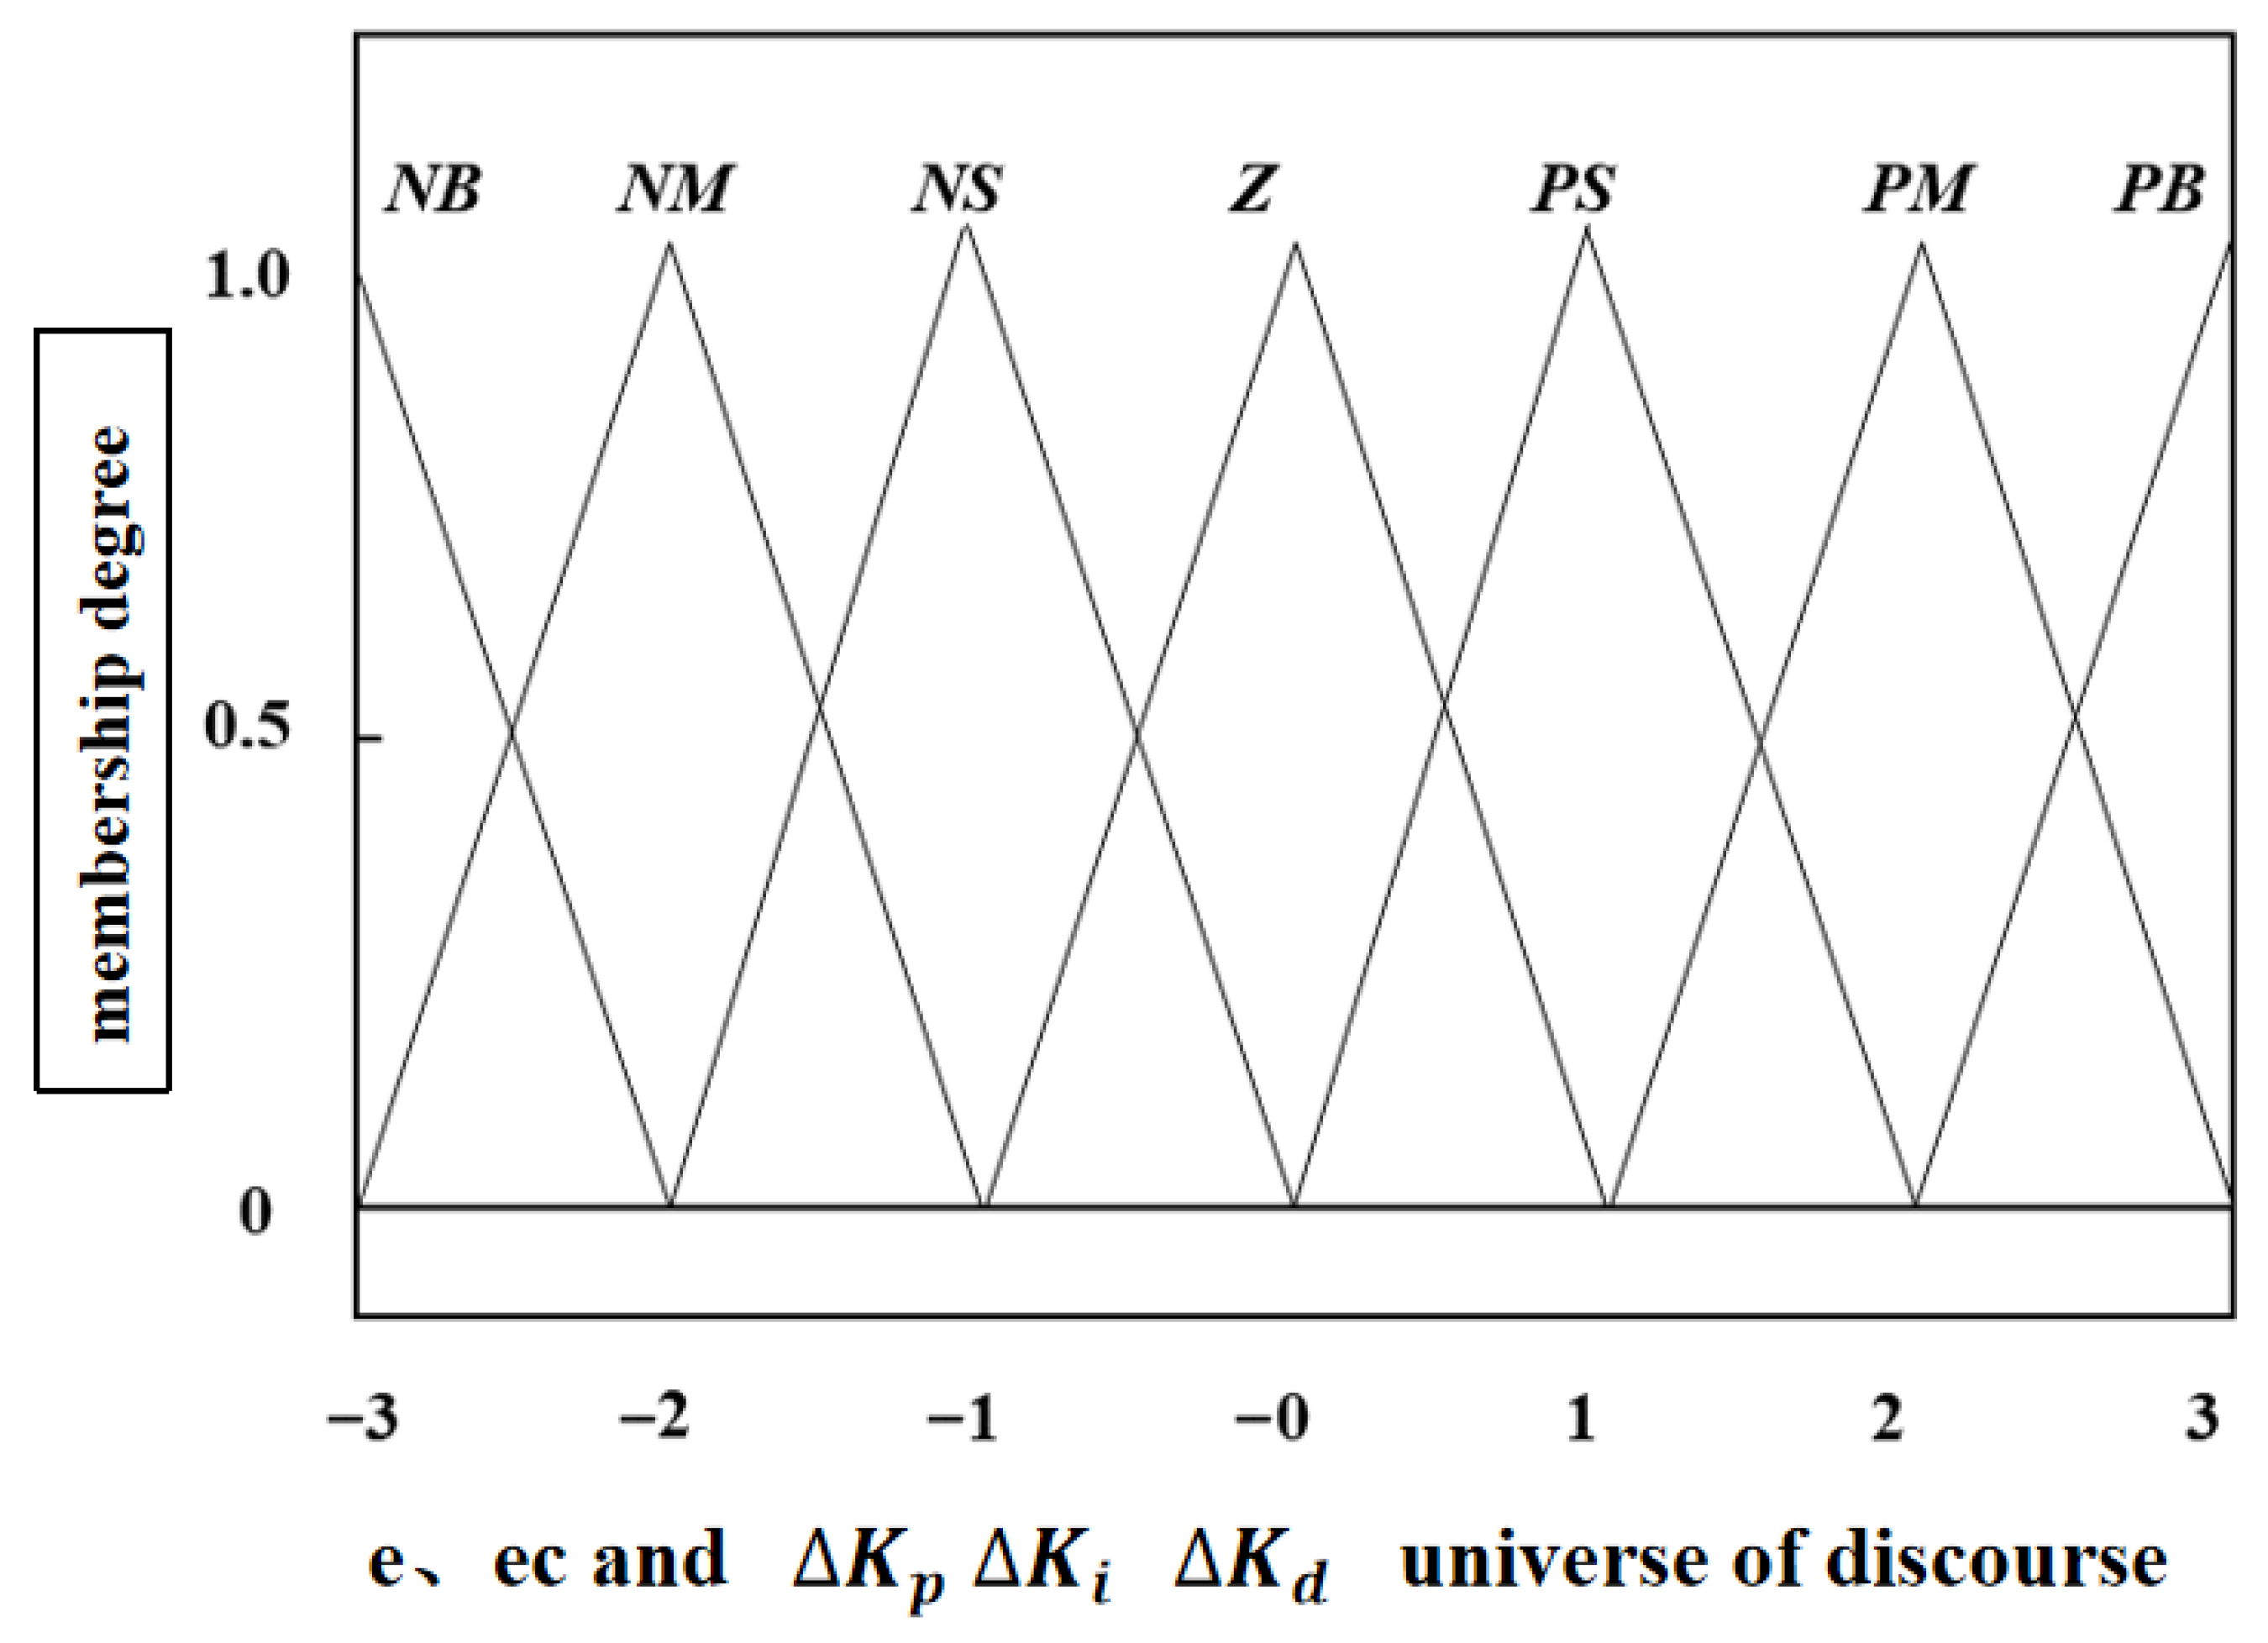
The fuzzy universes of the inputs e, ec and outputs k p , k i ,   k d are all set to [−3, −2, −1, 0, 1, 2, 3], and the fuzzy subsets are divided into {NB (Negative Big), NM (Negative Medium), NS (Negative Small), ZO (Zero), PS (Positive Small), PM (Positive Medium), PB (Positive Big)}. The triangular membership function is used to realize the conversion from precise values to fuzzy quantities, and the triangular membership function [25] is shown in Figure 3.
The fuzzy quantity obtained by the Mamdani-type fuzzy [26] controller through fuzzy reasoning needs to go through the defuzzification process to obtain the precise quantity for system control, which is then transmitted to the PID controller. In this system, the center of area method is selected in the defuzzification link of the fuzzy control, and the calculation formula is:
k p = k p _ u k p k i = k i _ u k i k d = k d _ u k d
The fuzzy quantities k p , k i   and   k d   need to be adjusted by the proportional factors.
k p , k i   and   k d   to obtain the precise correction amounts k p , k i   and   k d   of the PID controller control parameters. Then, the correction amounts are transmitted to the PID controller to realize the automatic follow-up adjustment of the three control parameters k p , k i   and   k d . Finally, the PID controller outputs a control signal to act on the controlled object to realize the control operation.
According to the experience of EC value control of water–fertilizer solution, fuzzy reasoning rules [27] are formulated. For example, when e = PB (large deviation) and ec = NB (large negative deviation change rate), it is necessary to increase k p to speed up the response, reduce k i to avoid overshoot, and set k p = PB, k i = NB, k d = NS.
The fuzzy control rules for k p , k i and k d are shown in Table 1, Table 2 and Table 3, respectively.
in [0, 1].
To balance the global search and local convergence capabilities, the PSO algorithm is improved in two aspects:
  • Dynamic adjustment of inertia weight: Adjust w based on the particle fitness value. Particles with poor fitness have an increased w to expand the search range, while particles with good fitness have a decreased w for fine search. The formula is:
w = w m i n w m a x w m i n f i f m i n f a v g f m i n , f i f a v g w m a x , f i > f a v g
Among them, f i is the fitness of particle i, and f a v g and f m i n are the average fitness and minimum fitness of the population, respectively.
2.
Adaptive change of learning factors: Increase c 1 in the early iteration stage to enhance individual cognition, and increase c 2 in the later stage to enhance global collaboration. The formulas are:
c 1 = c 1 m a x + c 1 m a x c 1 m i n s i n π 2 1 i i m a x
c 2 = c 2 m a x c 2 m a x c 2 m i n s i n π 2 1 i i m a x
In these formulas, c 1 m a x   a n d   c 1 m i n are the maximum and minimum values of c 1 , respectively; c 2 m a x   a n d   c 2 m i n are the maximum and minimum values of c 2 , respectively; i is the current number of iterations; and i m a x is the total maximum number of iterations set for the algorithm.
The core of the PSO-optimized fuzzy PID controller lies in using the improved PSO algorithm to search for the optimal values of the quantization factors ( k e , k e c ) and proportional factor ( k u ) of the fuzzy controller. These optimized factors enable the fuzzy PID controller to adapt dynamically to the nonlinear and time-delayed characteristics of the water–fertilizer mixing system, thereby improving control precision and response speed. The structure of the optimized fuzzy PID controller is illustrated in Figure 4 below.
To comprehensively evaluate the control performance (including overshoot, settling time, and steady-state error), the Integral of Time-weighted Absolute Error (ITAE) was selected as the fitness function for the PSO algorithm. The ITAE index emphasizes the cumulative error over time, which is more consistent with the actual demand for stable and rapid EC value control in water–fertilizer systems. Its expression is:
J I T A E = 0 t e d t
Based on the principles of mass conservation and the time-delay characteristics of the water–fertilizer mixing process, the mathematical model of the EC value control process is established as follows:
G s = K T p s + 1 T M s + 1 e τ s
where s is the complex frequency in the Laplace domain; T p is the time constant of the fertilizer dissolution and mixing process; T M is the time constant of the solution mixing in the buffer tank (virtual volume); τ is the total time delay of the system, including the response delay of the EC sensor and the action delay of the fertilizer injection pump.
The parameters of the transfer function [28] were determined through experimental calibration and data fitting using the actual hardware configuration of the system: the mixing tank volume was 50 L, the EC sensor (SEN0244) had a response time of less than 2 s, and the Venturi fertilizer injection pump had an adjustment delay of 5 s. Finally, the calibrated parameters were obtained as follows: K = 0.035 ,   T p = 30   s ,   T m = 50   s ,   τ = 10   s .
The optimization process of the particle swarm optimization-based fuzzy PID controller is as follows and the flowchart is shown in Figure 5.
(1)
Initialize the particle swarm. The spatial dimension is set to 5, the swarm size to 80, and the maximum number of iterations to 80. Subsequently, parameters including the inertia weight, cognitive coefficient, and social coefficient are defined. The particle swarm [29] is initialized within the search space, and the initial position and velocity of each particle are assigned.
(2)
Evaluate fitness. Each particle in the swarm is passed to a fuzzy PID controller, where its corresponding fitness value is computed based on the Integral of Time multiplied by Absolute Error (ITAE) performance criterion. The fitness of each particle is compared with its previous best value to update the personal best ( P b e s t ) and the global best ( G b e s t ).
(3)
Update particle position and velocity. The inertia weight is calculated using a weighting strategy [30], and the cognitive and social learning factors are determined. These values are then substituted into Equations (5) and (6) to update the current velocity and position of each particle.
(4)
Check termination condition. If the target criterion is satisfied, the algorithm terminates and returns the optimal solution. Otherwise, the process returns to Step (2) to continue the optimization until the maximum number of iterations is reached, at which point the current global best solution is output.

2.3. Experimental Design and Data Collection

2.3.1. Overall Experimental Methodology

The experimental validation followed a structured approach comprising simulation verification followed by field implementation. This sequential methodology ensured algorithmic validation under controlled conditions prior to real-world deployment, addressing both theoretical performance and practical applicability. The simulation experiments established baseline performance metrics, while the field validation confirmed operational robustness under agricultural conditions.

2.3.2. Simulation Design Experiment

To verify the superiority of the proposed PSO-optimized fuzzy PID controller, comparative simulations were conducted in MATLAB R2020a. Three types of controllers were implemented: the conventional PID controller, the fuzzy PID controller, and the PSO-optimized fuzzy PID controller.
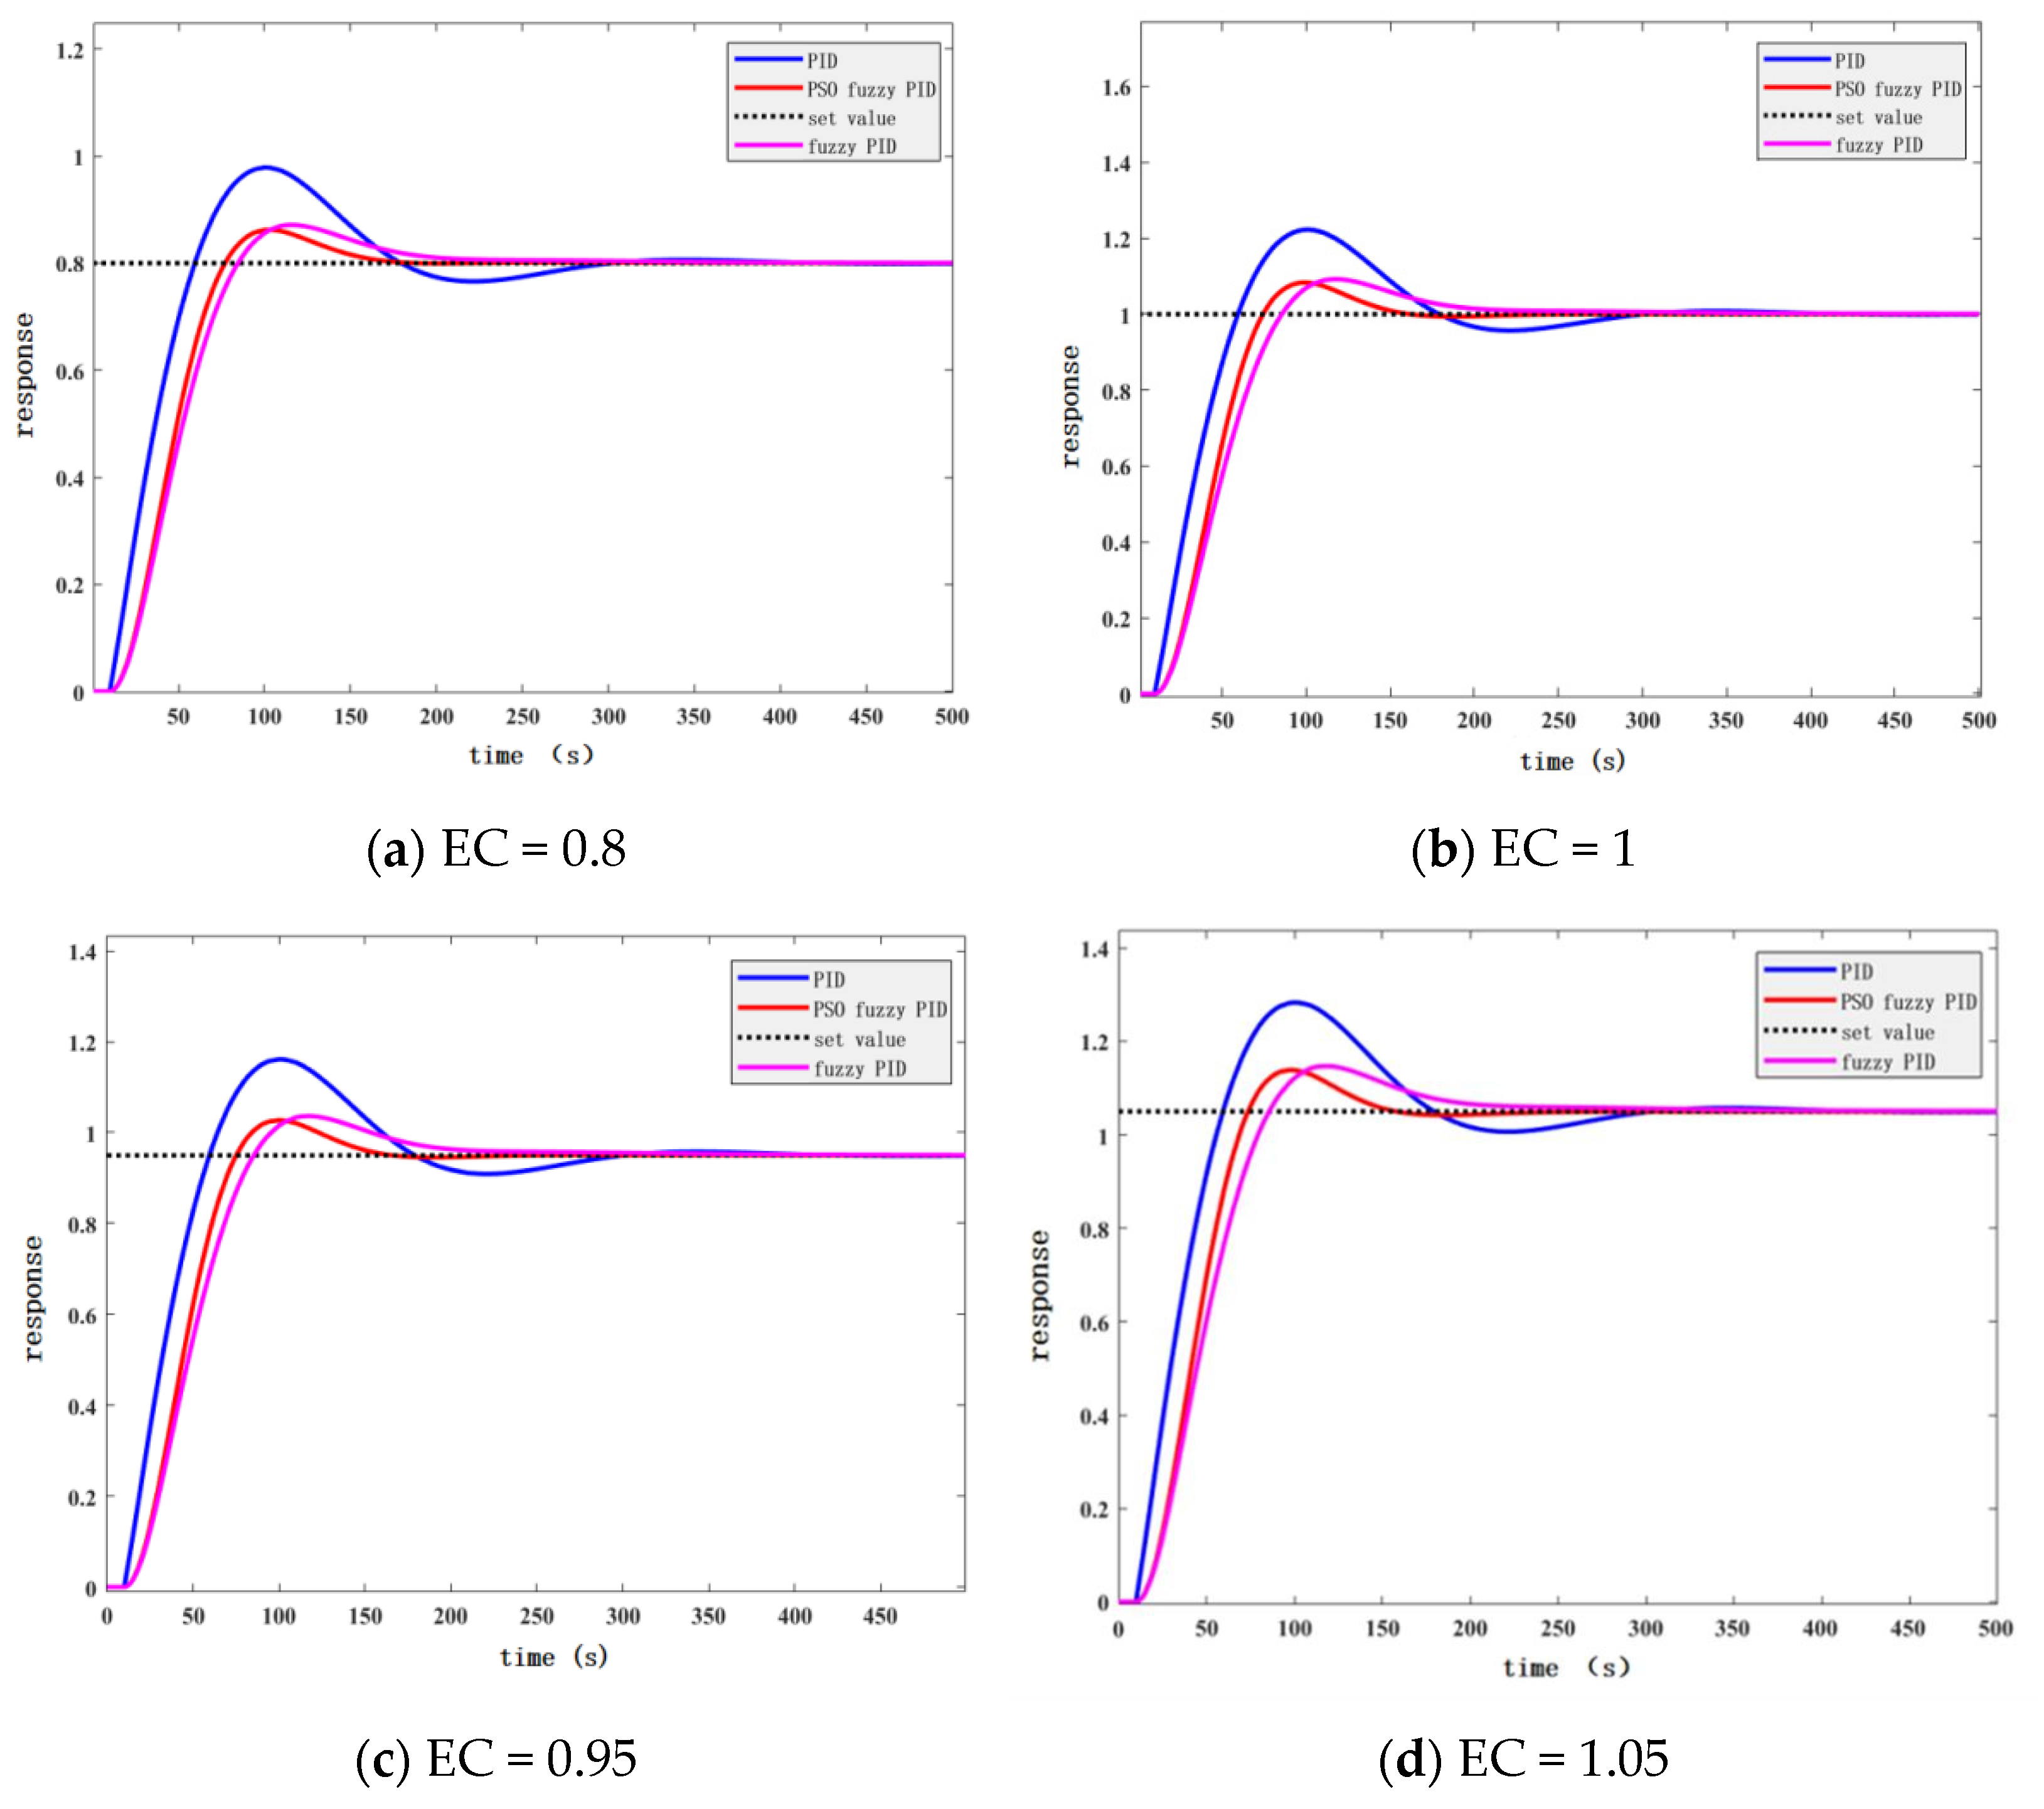
The simulation parameters were configured to match the actual field conditions: the simulation duration was set to 500 s and the set EC values were 0.8 ms/cm, 0.95 ms/cm, 1.0 ms/cm, and 1.05 ms/cm.

2.3.3. Field Experiment Setup and Performance Metrics

The field experiment was conducted at the Northern Anhui Experimental Station in Suzhou City, Anhui Province, using wheat as the test crop. The crop coefficients in the model were adjusted to K c m i d = 1.15 and K c e n d = 0.25 − 0.4.
The weather station in Figure 6 can collect air parameters, and the sensor in Figure 7 can collect some soil parameters. Finally, the data is integrated into the intelligent water and fertilizer control system. According to the collected data, the right water and fertilizer are matched.
The water–fertilizer irrigation equipment and sprinkler irrigation in this study are shown in Figure 8 and Figure 9.
A portable pH meter was used to determine soil pH, with an average value of 7.2 (range: 7.0–7.4).
To validate the control accuracy of the designed particle swarm optimization-based fuzzy PID controller, a water–fertilizer solution preparation test was conducted at the Northern Anhui Experimental Station in Suzhou City, Anhui Province. The test procedure was as follows: First, the target electrical conductivity (EC) value was set via a cloud platform to issue the solution preparation command. The fertigation machine, which incorporates the proposed particle swarm optimization-based fuzzy PID controller as the actuating mechanism, was used to regulate the preparation process. After the solution was prepared, a sample was collected for accuracy testing. The main equipment employed included a fertigation machine, fertilizer tanks, a 24 V lithium battery, a water EC sensor, and a 250 mL beaker, as shown in Figure 10.
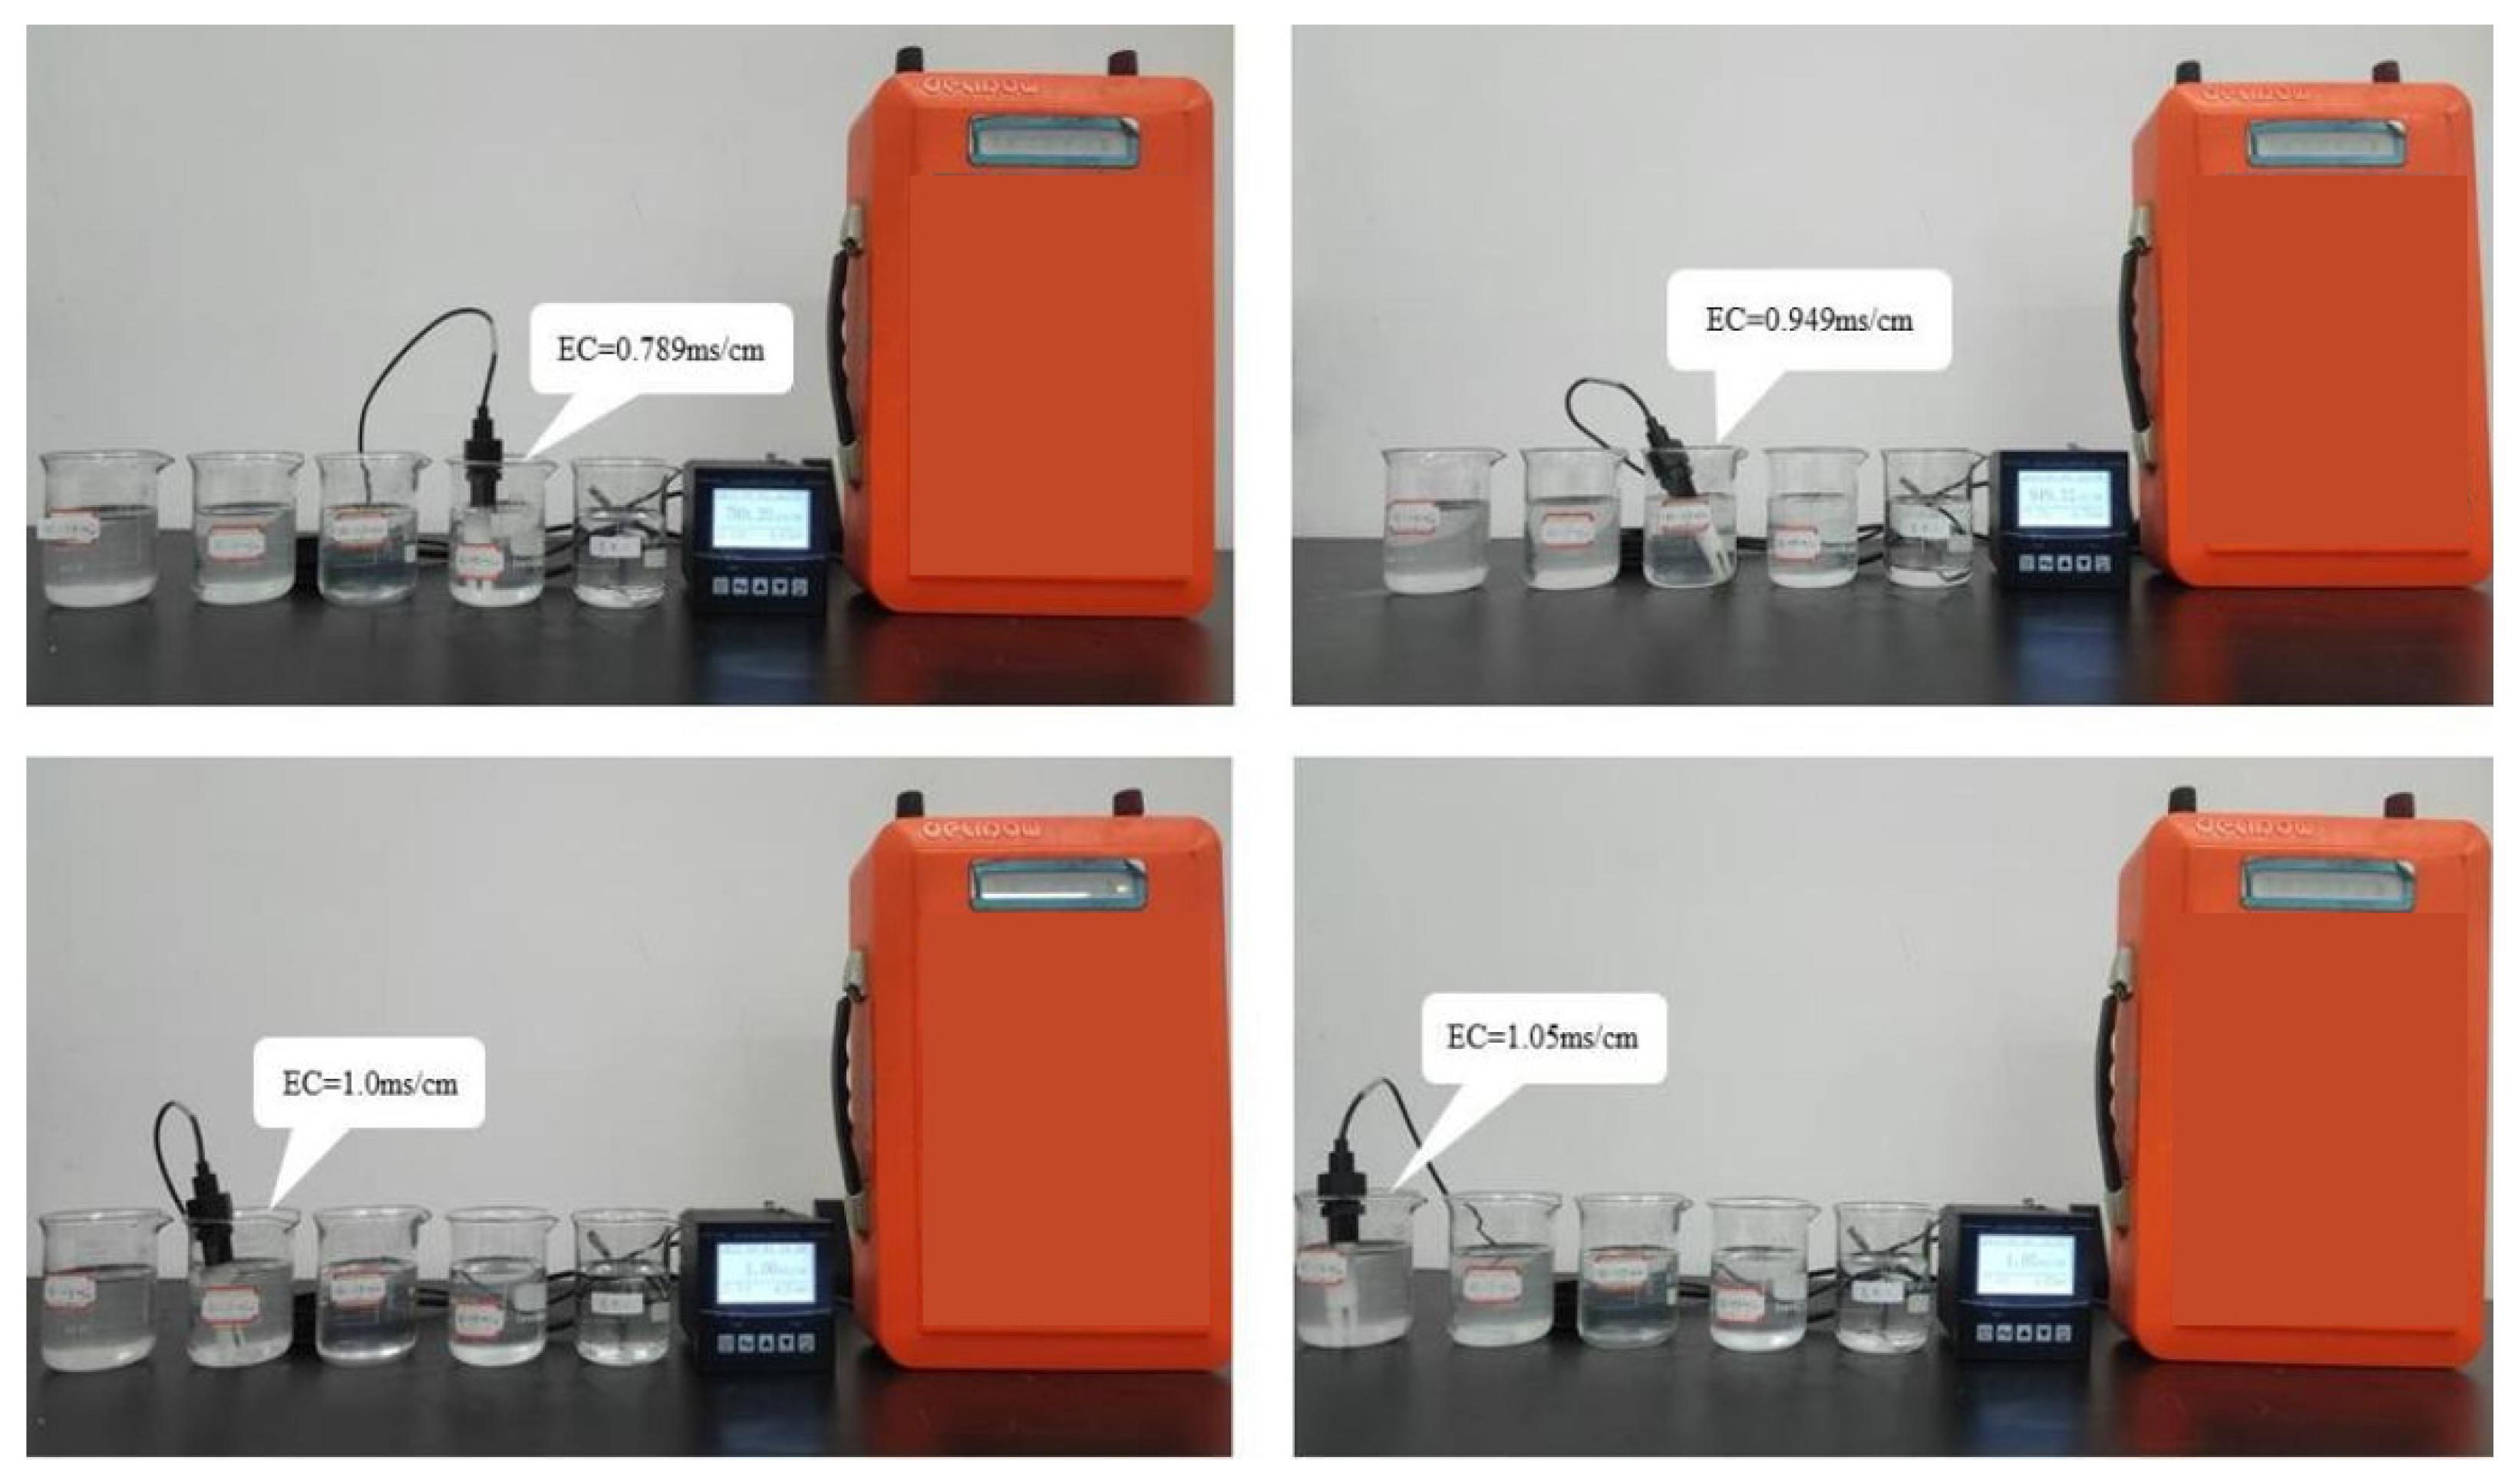
To further evaluate the accuracy of the water–fertilizer solution preparation process, four target EC values—0.8 ms/cm, 1.0 ms/cm, 0.95 ms/cm, and 1.05 ms/cm—were set for solution mixing at the Northern Anhui Experimental Station. Each target concentration was prepared three times, and samples were collected from each batch to measure the actual EC values. These measurements were used to quantify the deviation between the prepared solutions and the system-set target values. Partial EC test results are illustrated in Figure 11, while the measured EC values of the sampled solutions for the four target concentrations are summarized in Table 6.

3. Results

3.1. Simulation Results

The dynamic response curves for the three controllers under different EC setpoints are shown in Figure 12. The quantitative performance data from all simulation runs are summarized in Table 4. The results of the ANOVA analysis of the three controller performance indicators are shown in Table 5.
As shown in Table 4, the PSO-optimized fuzzy PID controller exhibited the smallest overshoot [31] (ranging from 7.64% to 8.15%) and the shortest settling time (ranging from 272 s to 295 s) across all four EC setpoints, compared to the fuzzy PID and conventional PID controllers.
According to the ANOVA results in Table 5, the differences among the three methods in overshoot, settling time, and steady-state error all reached a significant level (p < 0.001).

3.2. EC Control Accuracy

EC Control and Soil Nutrient Correlation

It is important to note that one measurement at the 1.0 ms/cm setpoint showed a deviation of +0.070 ms/cm (Table 6). This outlier is may be caused by a temporary partial clogging of the Venturi fertilizer injector, a common challenge in field operations. But it Satisfies most of the field operation requirements. This event highlights that while the control algorithm itself is robust, overall system performance can be affected by physical component reliability. However, the system demonstrated effective recovery, as subsequent measurements immediately returned to within the target precision range. For a comprehensive evaluation. When the EC value of the water–fertilizer solution was controlled within 0.8–1.05 ms/cm. Meanwhile, the soil pH value stayed around 7.2, with no significant fluctuation (±0.1) caused by water–fertilizer application.
At the target value of 0.8 ms/cm, the measured values ranged from 0.784 to 0.789 ms/cm, with a maximum deviation of −0.016 ms/cm;
At the target value of 0.95 ms/cm, the results of three replicate experiments were 0.949 ms/cm, with a deviation of −0.001 ms/cm;
At the target value of 1.0 ms/cm, the measured values ranged from 0.999 to 1.070 ms/cm, with a maximum deviation of −0.070 ms/cm (Note: The value of 1.070 ms/cm is an outlier, possibly caused by uneven stirring of the solution. After exclusion, the maximum deviation becomes +0.001 ms/cm);
At the target value of 1.05 ms/cm, the measured values ranged from 1.040 to 1.050 ms/cm, with a maximum deviation of −0.010 ms/cm.
Under the same EC target value, the coefficient of variation (CV) for the three replicate experiments ranged from 0.32% to 0.45%. The smallest CV (0.32%) was observed at the target value of 0.8 ms/cm.
The results of the water–fertilizer solution preparation tests are shown in Table 6. The maximum deviation between the measured EC and the target value was 0.016 ms/cm.
As can be seen from Table 7, the RMSE of EC control accuracy is 0.0217 ms/cm, and R2 is 0.9462, indicating that the fitting degree between EC measured value and target value is very high.
Table 8 shows statistical analysis of field EC control performance.
Table 9 shows some growth indices of crops.

3.3. Irrigation Performance

The system effectively maintained soil moisture within the optimal range (19–25%), as shown in Table 10. On days with sufficient rainfall the system correctly suspended irrigation.
The soil moisture content before and after irrigation, alongside system decisions, are detailed in Table 10.
Water use efficiency is shown in Table 11.

4. Discussion

4.1. Superiority of the PSO-Fuzzy PID Controller

The simulation results unequivocally demonstrate the superior performance of the proposed controller. The statistical analysis (ANOVA) confirmed that the differences in overshoot, settling time, and steady-state error between the three controllers were statistically significant (p < 0.001, Table 5).
The PSO-Fuzzy PID controller achieved a 66.5% to 73.7% reduction in overshoot compared to the conventional PID, and an 11.9% to 30.2% reduction compared to the standard fuzzy PID (Table 4). This indicates that the optimized controller effectively suppresses the overshoot phenomenon caused by the nonlinearity and time delay of the water–fertilizer system. Such suppression is critical in practice, as it prevents the momentary application of excessively concentrated fertilizer, which could potentially damage crop root systems.
Furthermore, the proposed controller reduced the average settling time by 62.48 s and 20.38 s compared to the conventional PID and fuzzy PID controllers, respectively. This faster response implies that the system can reach the target EC value more rapidly, ensuring a timely and accurate supply of nutrients during the critical growth stages of crops.
In terms of steady-state performance [32], the EC fluctuation of the PSO-Fuzzy PID controller was smaller than that of the other two controllers. This demonstrates its stronger robustness against external disturbances and its ability to maintain higher steady-state control precision, which is fundamental for consistent fertilizer delivery.
This performance superiority is attributed to the improved PSO algorithm, which effectively finds a near-optimal set of scaling factors for the fuzzy controller. This enables more precise and adaptive tuning of the PID parameters than what is achievable through manual expert design alone, allowing the controller to better cope with the system’s nonlinear dynamics and time delays.
In summary, the PSO-optimized fuzzy PID controller effectively overcomes the limitations of traditional controllers and provides a reliable algorithmic foundation for the practical application of high-precision water–fertilizer integrated systems.

4.2. System Integration and Agricultural Practicality

Under the dynamic regulation of the intelligent irrigation system, the soil moisture content after irrigation was consistently maintained within the optimal range for crop growth (19–25%) [33,34]. As indicated in Table 10, the soil moisture content before irrigation was only 15.8% (below the lower limit of the optimal range); the system automatically calculated an irrigation volume of 16.55 mm based on the predicted crop transpiration (4.5 mm), and after irrigation, the soil moisture content rose to 20.7%, returning to the optimal range. Due to 1.3 mm of natural rainfall, the soil moisture content had reached 20.6% (within the optimal range), so the system determined no irrigation was needed, avoiding water waste. During other test periods, the system also accurately adjusted the irrigation volume by integrating soil moisture content, crop transpiration demand, and meteorological rainfall data.
Despite the promising results, this study has several limitations that should be addressed in future work. First, while the system demonstrated high-precision EC control and supported stable crop growth parameters (plant height, SPAD), its direct impact on the final crop yield was not quantified in this single-season experiment. The thousand-grain weight provides an initial yield proxy, but full-season yield analysis is necessary for a comprehensive agronomic evaluation. Second, the soil ionic composition was not measured, which represents a gap in fully characterizing the “integrated water–fertilizer” system’s nutrient balance. Future iterations will incorporate multi-ion sensors to enable true multi-nutrient management. Third, the experiments were conducted under specific field conditions at a single location; the controller’s robustness across diverse soil types, climates, and crop types requires further validation. Lastly, the current system focuses on the control of total nutrient concentration via EC; future work should explore multi-nutrient synergistic control strategies.

5. Conclusions

This study successfully designed and validated an electrical conductivity control system for integrated water–fertilizer irrigation, implementing a PSO-optimized fuzzy PID controller. The key conclusions are:
Algorithm Efficacy: The improved PSO algorithm effectively optimized the fuzzy PID parameters, resulting in a controller that significantly outperformed both conventional and standard fuzzy PID controllers. Statistical analysis confirmed significant reductions in overshoot (7.64–8.15%) and settling time.
Agronomic Utility: The system demonstrated extended utility beyond EC control, also providing smart irrigation management, providing not only precise fertilization but also smart irrigation management, maintaining soil moisture in the optimal range and demonstrating good water distribution uniformity.
In conclusion, this work validates the PSO-Fuzzy PID controller as a high-performance solution for the critical task of EC regulation. It is acknowledged that this study focuses on this core control parameter, and the system’s performance in multi-nutrient management and its direct impact on crop yield remain to be fully investigated in future work. Including the system’s performance was primarily evaluated based on EC control accuracy, while other agronomic parameters such as soil nutrient dynamics and crop yield were not extensively investigated. Second, the experiments were conducted under specific field conditions at a single location; the controller’s robustness across diverse environments and crop types requires further validation. Lastly, the current system focuses on the control of a single nutrient solution; future work should explore multi-nutrient synergistic control strategies.

Author Contributions

Conceptualization, J.Y. and L.L.; methodology, J.Y.; resources, L.L.; data curation, J.Y. and Q.Z.; writing—original draft preparation, J.Y. and X.L.; writing—review and editing, J.Y. and L.L.; supervision, Q.Z. and L.L.; project administration, L.L.; funding acquisition, L.L. All authors have read and agreed to the published version of the manuscript.

Funding

This research was funded by the National Key Research and Development Program of China (Grant No. 2023YFD1901003) and Anhui Provincial Science and Technology Program Project (Grant No. 311222444024).

Data Availability Statement

Due to the sensitivity and confidentiality of the data, this study does not provide the original data when publishing the paper. For data acquisition, please contact the corresponding author.

Conflicts of Interest

The authors declare no conflicts of interest.

References

  1. Gunarasan, C.P.J.; Lee, W.J. Biomimetic materials for fog harvesting: Prospects and challenges. Desalination 2025, 615, 119324. [Google Scholar] [CrossRef]
  2. Kopittke, P.M.; Harper, S.M.; Asio, L.G.; Asio, V.B.; Batalon, J.T.; Batuigas, A.M.T.; Gonzaga, A.B.; Gonzaga, N.R.; de Guzman, M.T.L.; Lumanao, D.M.; et al. Soil degradation: An integrated model of the causes and drivers. Int. Soil Water Conserv. Res. 2025, 13, 744–755. [Google Scholar] [CrossRef]
  3. Kohtaro, I.; Kenta, I.; Joseph, B.B. Heterogeneity effects of plant density and fertilizer application on cowpea grain yield in soil types with different physicochemical characteristics. Field Crops Res. 2023, 292, 108825. [Google Scholar] [CrossRef]
  4. Xing, Y.; Zhang, X.; Wang, X. Enhancing soil health and crop yields through water-fertilizer coupling technology. Front. Sustain. Food Syst. 2024, 8, 1494819. [Google Scholar] [CrossRef]
  5. Jain, S.; Kaur, M. Design and Implementation of an IoT-based automated EC and pH Control System in an NFT-based Hydroponic Farm. Eng. Technol. Appl. Sci. Res. 2024, 14, 13078–13081. [Google Scholar] [CrossRef]
  6. Liu, H.P.; Long, C.J.; Wan, P.; Wang, X.Y.; Hu, B. Fuzzy PID control of plant protection quadrotor aircraft. Trans. Chin. Soc. Agric. Eng. 2015, 31, 71–77. [Google Scholar]
  7. Li, L.; Wang, J.H.; Meng, F.J.; Mu, Y.H.; Yuan, H.B.; Wang, H.H.; Sigrimis, N. Nutrient solution regulation model based on quadratic hybrid mechanism and PID algorithm implementation. Trans. Chin. Soc. Agric. Eng. 2016, 32, 100–106. [Google Scholar]
  8. Yao, J.F.; Lu, J.; Zheng, Y.L.; Wang, X.F.; Zhao, Y.D.; Chen, X.C.; Lei, G.N.; Tang, S.Z. DC motor speed control of tree ring measuring instrument based on variable universe fuzzy control algorithm. Trans. Chin. Soc. Agric. Eng. 2019, 35, 57–63. [Google Scholar]
  9. Yan, L.; Webber, J.L.; Mehbodniya, A.; Moorthy, B.; Sivamani, S.; Nazir, S.; Shabaz, M. Distributed optimization of heterogeneous UAV cluster PID controller based on machine learning. Comput. Electr. Eng. 2022, 101, 108059. [Google Scholar] [CrossRef]
  10. Mohindru, P. Review on PID, fuzzy and hybrid fuzzy PID controllers for controlling non-linear dynamic behaviour of chemical plants. Artif. Intell. Rev. 2024, 57, 97. [Google Scholar] [CrossRef]
  11. Kok, C.L.; Heng, J.B.; Koh, Y.Y.; Teo, T.H. Energy-, Cost-, and Resource-Efficient IoT Hazard Detection System with Adaptive Monitoring. Sensors 2025, 25, 1761. [Google Scholar] [CrossRef]
  12. Jain, M.; Saihjpal, V.; Singh, N.; Singh, S.B. An overview of variants and advancements of PSO algorithm. Appl. Sci. 2022, 12, 8392. [Google Scholar] [CrossRef]
  13. Don Chua, W.F.; Lim, C.L.; Koh, Y.Y.; Kok, C.L. A Novel IoT Photovoltaic-Powered Water Irrigation Control and Monitoring System for Sustainable City Farming. Electronics 2024, 13, 676. [Google Scholar] [CrossRef]
  14. Mondal, P.; Basu, M. Adoption of precision agriculture technologies in India and in some developing countries: Scope, present status and strategies. Prog. Nat. Sci. 2009, 19, 659–666. [Google Scholar] [CrossRef]
  15. Dan, Z. Problems and Development Countermeasures of Agricultural Water-Saving Irrigation. Meteorol. Environ. Res. 2018, 9, 101–104, 108. [Google Scholar]
  16. Katoch, S.; Chauhan, S.S.; Kumar, V. A review on genetic algorithm: Past, present, and future. Multimed. Tools Appl. 2021, 80, 8091–8126. [Google Scholar] [CrossRef]
  17. Abdolrasol, M.G.M.; Hussain, S.M.S.; Ustun, T.S.; Sarker, M.R.; Hannan, M.A.; Mohamed, R.; Ali, J.A.; Mekhilef, S.; Milad, A. Artificial neural networks based optimization techniques: A review. Electronics 2021, 10, 2689. [Google Scholar] [CrossRef]
  18. Miao, C.; Chen, G.; Yan, C.; Wu, Y. Path planning optimization of indoor mobile robot based on adaptive ant colony algorithm. Comput. Ind. Eng. 2021, 156, 107230. [Google Scholar] [CrossRef]
  19. SS, V.C.; Hareendran, A.; Albaaji, G.F. Precision farming for sustainability: An agricultural intelligence model. Comput. Electron. Agric. 2024, 226, 109386. [Google Scholar] [CrossRef]
  20. Khattak, H.A.; Shah, M.A.; Khan, S.; Ali, I.; Imran, M. Perception layer security in Internet of Things. Future Gener. Comput. Syst. 2019, 100, 144–164. [Google Scholar] [CrossRef]
  21. Bhagwat, P.; Perkins, C.; Tripathi, S. Network layer mobility: An architecture and survey. IEEE Pers. Commun. 2002, 3, 54–64. [Google Scholar] [CrossRef]
  22. Karagiannis, V.; Chatzimisios, P.; Vázquez-Gallego, F.; Alonso-Zárate, J. A survey on application layer protocols for the internet of things. Trans. IoT Cloud Comput. 2015, 3, 11–17. [Google Scholar]
  23. Bañón, S.; Álvarez, S.; Bañón, D.; Ortuño, M.F.; Sánchez-Blanco, M.J. Assessment of soil salinity indexes using electrical conductivity sensors. Sci. Hortic. 2021, 285, 110171. [Google Scholar] [CrossRef]
  24. Li, X.; Wang, H.; Yang, X.; Li, Z.; Cheng, Y.; Zheng, J.; Han, X.; Wang, J. Standard nutrient-solution-based fish-tail-water-fertilizer machine: Design, control, and decision. Comput. Electron. Agric. 2025, 238, 110774. [Google Scholar] [CrossRef]
  25. Cheng, S.; Gao, Y.; Liu, J.; Guo, C.; Xu, F.; Fu, L. An Optimal Control Strategy Considering Fatigue Load Suppression for Wind Turbines with Soft Switch Multiple Model Predictive Control Based on Membership Functions. Energies 2025, 18, 4695. [Google Scholar] [CrossRef]
  26. Vadood, M.; Haji, A. Prediction of Color Coordinates of Polyester Fabrics Dyed with Madder Using Mamdani-Fuzzy Logic and Optimization Algorithm. Fibers Polym. 2025, 26, 3463–3472. [Google Scholar] [CrossRef]
  27. Shoaip, N.; El-Sappagh, S.; Abuhmed, T.; Elmogy, M. A dynamic fuzzy rule-based inference system using fuzzy inference with semantic reasoning. Sci. Rep. 2024, 14, 4275. [Google Scholar] [CrossRef]
  28. Stamenov, D.; Rogne, Ø.; Abbiati, G.; Sauder, T. Comparison of empirical methods for estimation of quadratic transfer functions of low-frequency hydrodynamic loads. Ocean Eng. 2025, 341 Pt 3, 122582. [Google Scholar] [CrossRef]
  29. Chang, L.; Li, Y.; Li, D.; Zhang, M.; Du, W.; Cheng, K. Spatiotemporal representation of internal fracture sources using dual-surface infrared radiation and particle swarm optimization algorithm. Theor. Appl. Fract. Mech. 2026, 141 Pt A, 105249. [Google Scholar] [CrossRef]
  30. Cui, D.; Mo, Y.; Yuan, X.; Ye, L.; Wang, K.; Shen, F.; Wang, Y.; Yang, C.; Gui, W. Deep learning-based model predictive control with exponential weighting strategy and its application in energy management systems. J. Process Control 2025, 155, 103542. [Google Scholar] [CrossRef]
  31. Ali, A.; Majhi, S. PI/PID controller design based on IMC and percentage overshoot specification to controller setpoint change. ISA Trans. 2009, 48, 10–15. [Google Scholar] [CrossRef] [PubMed]
  32. Zhang, X.; Jiang, J.; Peng, J.; Zheng, J.; Hong, X.; Tang, D.; Peng, X.; Yu, H.; Xu, D.; Zhou, Z. Corrigendum to ‘Study on the steady-state performance and condensation phase change flow of steam hydrostatic dry gas seals’ [Thermal Sci. Eng. Prog. 65(2025) September 103931]. Therm. Sci. Eng. Prog. 2025, 67, 104086. [Google Scholar] [CrossRef]
  33. Zhang, Q.M. Green cultivation technology and promotion of wheat. Guangdong Canye 2022, 56, 54–56. [Google Scholar]
  34. Xu, S.D. Wheat cultivation management and pest control technology. Agric. Dev. Equip. 2022, 12, 226–227. [Google Scholar]
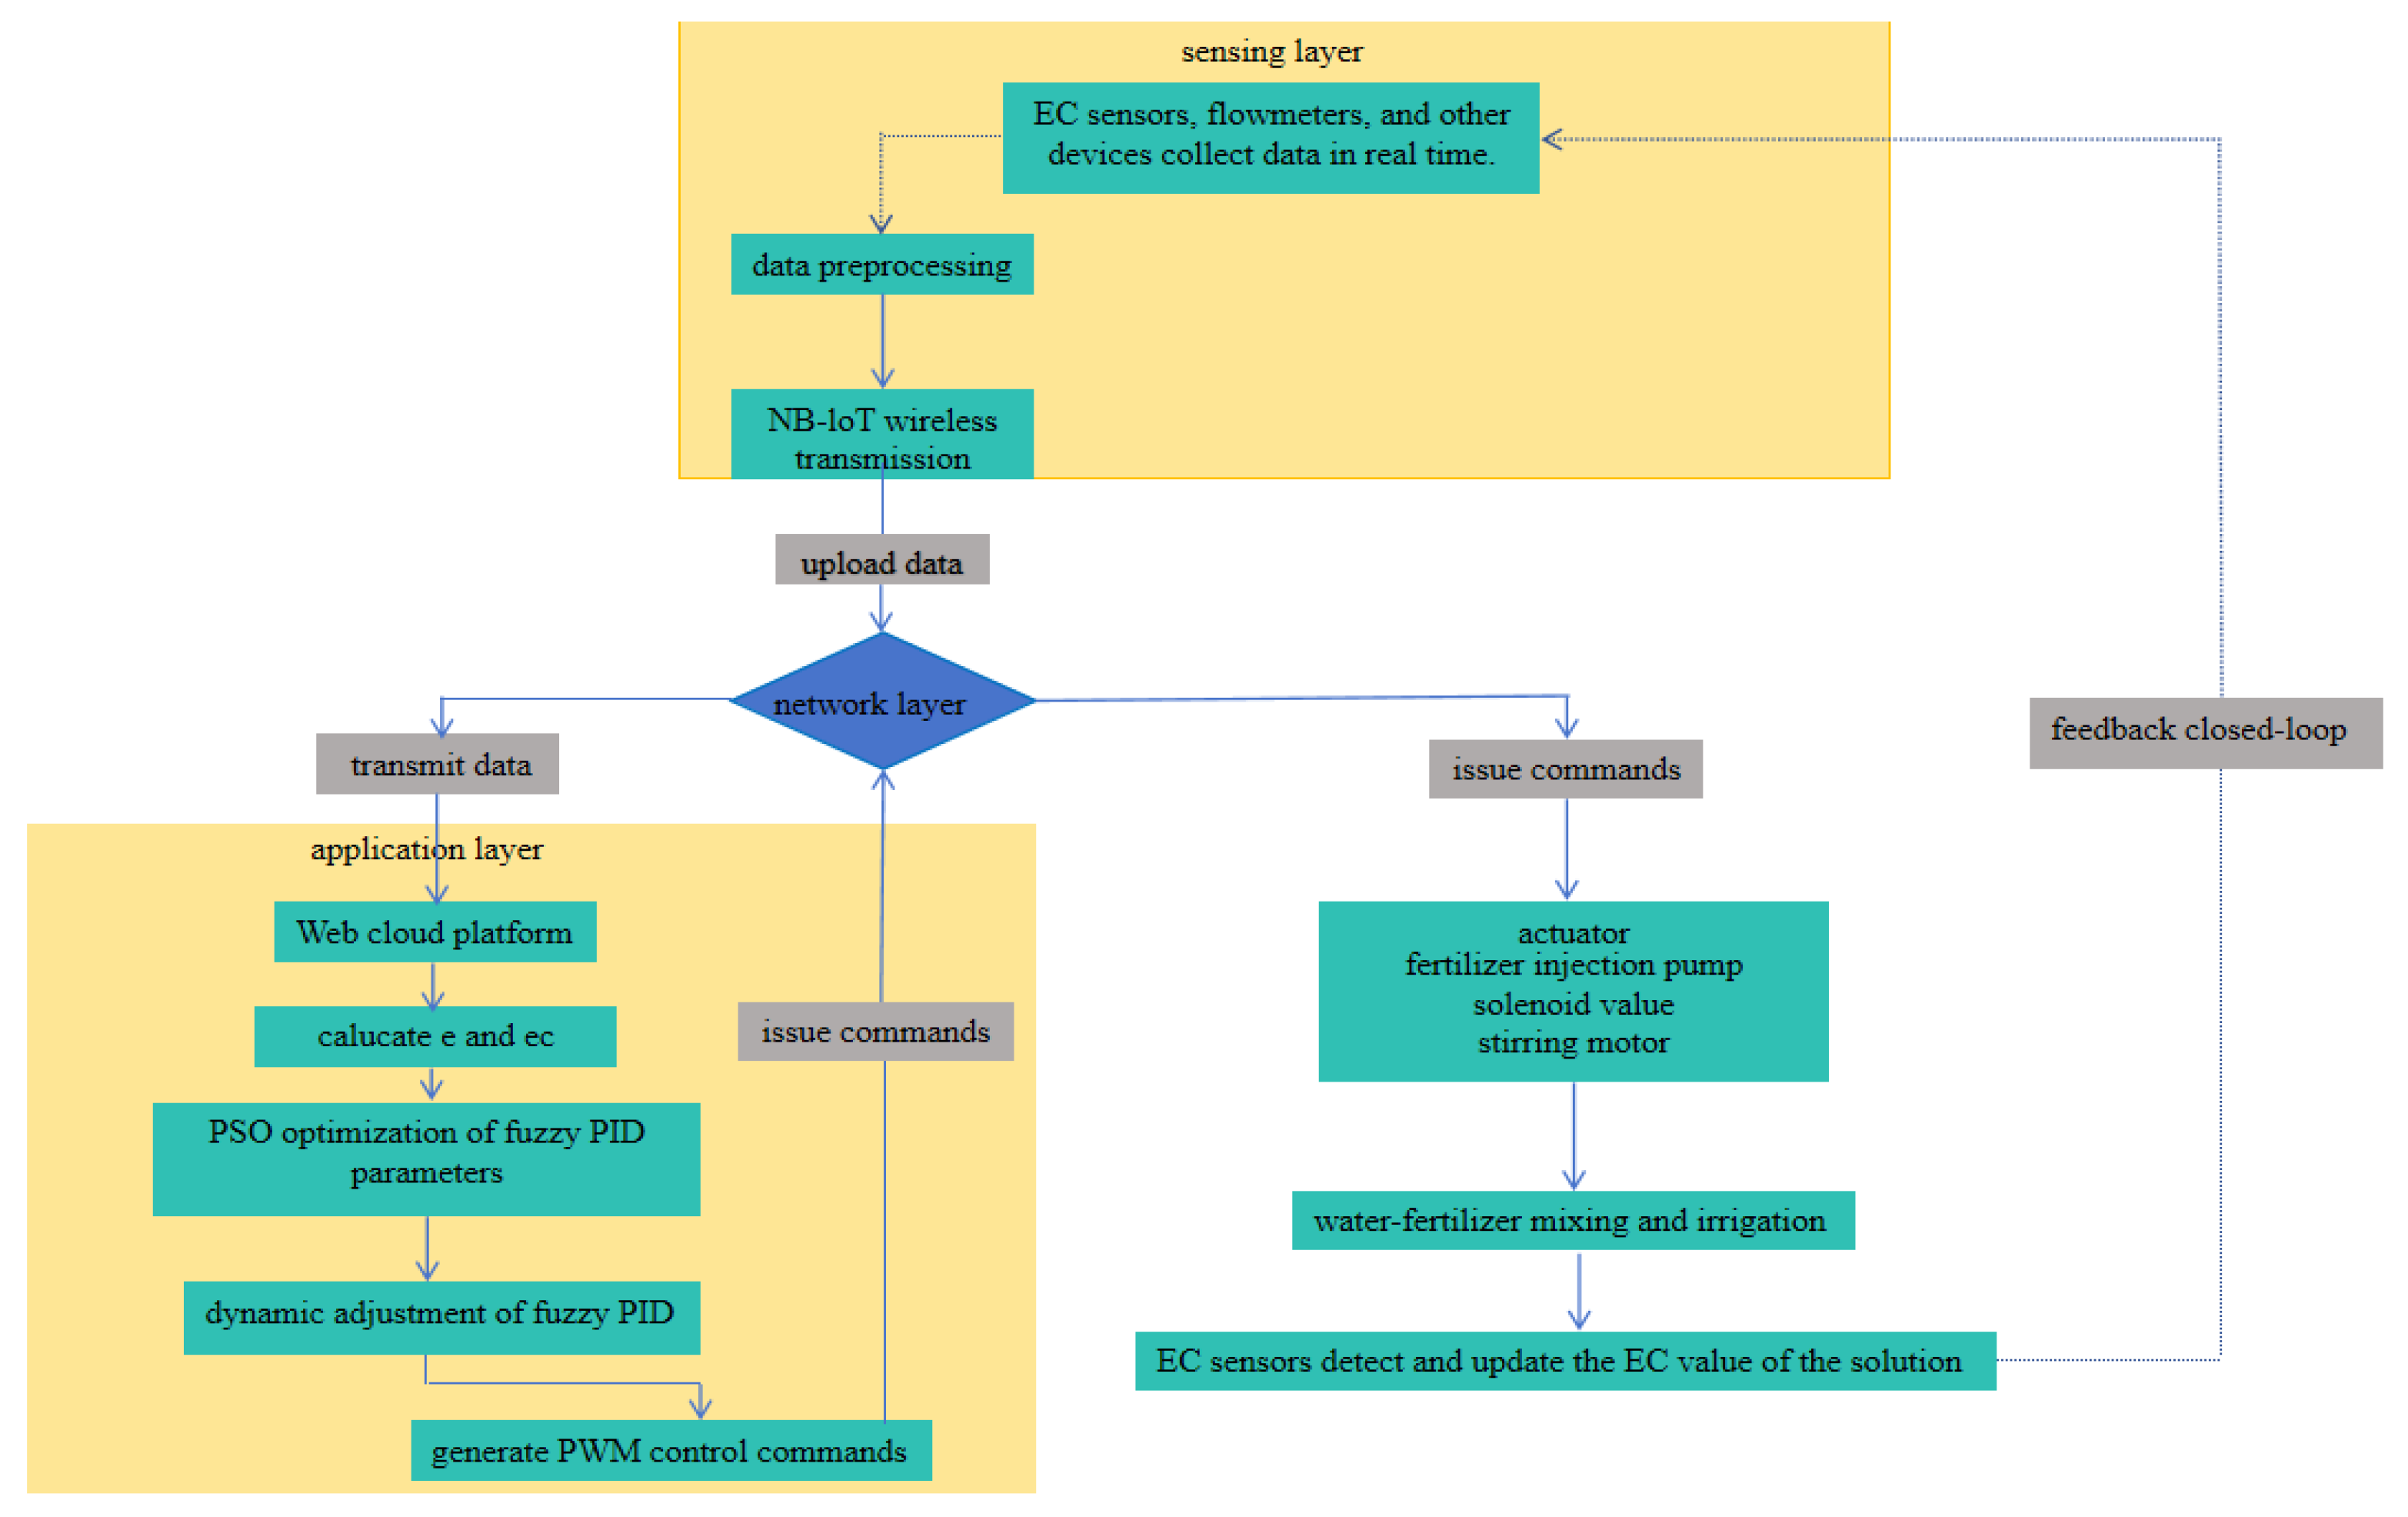
Figure 1. Flowchart of system working principle.
Automation 06 00076 g001
Figure 2. Schematic diagram of fuzzy PID control system.
Automation 06 00076 g002
Figure 3. Input/output degree function.
Automation 06 00076 g003
Figure 4. Structure diagram of PSO-Fuzzy PID controller.
Automation 06 00076 g004
Figure 5. Flow chart of particle swarm optimization fuzzy PID controller.
Automation 06 00076 g005
Figure 6. Physical map of meteorological monitoring station.
Automation 06 00076 g006
Figure 7. Physical map of soil EC value sensor.
Automation 06 00076 g007
Figure 8. Irrigation equipment.
Automation 06 00076 g008
Figure 9. Field Operation of Sprinkler Irrigation.
Automation 06 00076 g009
Figure 10. EC Testing Equipment for Fertilizer-Water Solution.
Automation 06 00076 g010
Figure 11. Partial Test Results of Water–Fertilizer Solution Preparation.
Automation 06 00076 g011
Figure 12. Comparison of simulation results of EC value model of water–fertilizer solution.
Automation 06 00076 g012
Table 1. Fuzzy control rules of k p .
ece
NBNMNSZOPSPMPB
NBPBPBPMPMPSZOZO
NMPBPBPMPSPSZONS
NSPMPMPMPSZONSNS
ZOPMPMPSZONSNSNM
PSPSPSZONSNSNMNM
PMPSZONSNMNMNMNB
PBZOZONMNMNMNBNB
Table 2. Fuzzy control rules of k i .
ece
NBNMNSZOPSPMPB
NBNBNBNMNMNSZOZO
NMNBNBNMNSNSZOZO
NSNMNMNSNSZOPSPS
ZONMNMNSZOPSPMPM
PSNMNSZOPSPSPMPB
PMZOZOPSPSPMPBPB
PBZOZOPSPMPMPBPB
Table 3. Fuzzy control rules of k d .
ece
NBNMNSZOPSPMPB
NBPSNSNBNBNBNMPS
NMPSNSNBNMNMNSZO
NSZONSNMNMNSNSZO
ZOZONSNSNSNSNMZO
Table 4. Comparison of simulation results of EC value control models.
EC ValuePSO-Fuzzy PID ControllerFuzzy PID ControllerPID Controller
OvershootSettling TimeOvershootSettling TimeOvershootSettling Time
0.87.64%272 s8.67%288.4 s22.84%344.8 s
0.957.96%280 s11.8%297.8 s23.56%345.95 s
18.152%286.3 s9.34%313.6 s23.56%345.95 s
1.058.152%295 s9.66%315 s28.7%346.5 s
Table 5. ANOVA results for three controller performance metrics.
Performance MetricsDegrees of FreedomF Valuep Value
Overshoot2108.3<0.001
Setting time272.25<0.001
Steady-state error233.75<0.001
Table 6. Conductivity test of water and fertilizer Solution.
EC Target ValueNumber of SamplesActual Measured ValueDeviation
10.784 ms/cm−0.016 ms/cm
0.8 ms/cm20.787 ms/cm−0.013 ms/cm
30.789 ms/cm−0.011 ms/cm
10.949 ms/cm−0.001 ms/cm
0.95 ms/cm20.949 ms/cm−0.001 ms/cm
30.949 ms/cm−0.001 ms/cm
11.0 ms/cm0.000 ms/cm
1.0 ms/cm20.999 ms/cm−0.001 ms/cm
31.07 ms/cm+0.070 ms/cm
11.04 ms/cm−0.010 ms/cm
1.05 ms/cm21.05 ms/cm0.000 ms/cm
31.06 ms/cm+0.010 ms/cm
Table 7. The results of the water–fertilizer solution preparation tests.
Error MetricValue
RMSE (ms/cm)0.0217
MAE (ms/cm)0.01125
R20.9462
Table 8. Statistical Analysis of Field EC Control Performance.
Statistical TestTeat ValueResultp-ValueConclusion
One-sample t-test0.02 ms/cmt(11) = 8.37<0.001Significantly better than precision ag standard
One-way ANOVABetween EC targetsF(3,8) = 1.240.36Consistent performance across operational range
Coefficient of variation-0.32–0.45%-High reproducibility
Table 9. Winter Wheat Growth Index Monitoring Results.
Serial NumberPlant HeightSPAD Value1000-Grain Weight
168.245.3-
276.548.142.3
Table 10. Field Irrigation Test Results.
Soil Moisture Before IrrigationRainfall ForecastCrop Transpiration PredictionIrrigation VolumeSoil Moisture After Irrigation
Serial number/%/mm/mm/mm/%
115.804.516.5520.7
218.105.311.3521.2
320.61.31.60
418.404.313.7522.1
520.702.80
Table 11. Analysis of Irrigation Performance.
IndicatorValueEvaluation
Christiansen’s Uniformity Coefficient (Cu)97.6%Good
Average Soil Moisture after Irrigation21.3%Within Optimal Range (19–25%)
Disclaimer/Publisher’s Note: The statements, opinions and data contained in all publications are solely those of the individual author(s) and contributor(s) and not of MDPI and/or the editor(s). MDPI and/or the editor(s) disclaim responsibility for any injury to people or property resulting from any ideas, methods, instructions or products referred to in the content.