Abstract
Osmotic dehydration (OD) is an effective pre-treatment for fruit preservation, but conventional processes often lack precision due to manual control of critical variables. This work reports the design and validation of an automated OD system integrating a programmable logic controller (PLC), human–machine interface (HMI), and IoT-enabled sensors for real-time monitoring of syrup concentration and process temperature. Mango (Mangifera indica) cubes were treated under a 23 factorial design with sucrose concentrations of 45 and 50 °Brix, immersion times of 120 and 180 min, and temperatures of 30 and 40 °C. Validation demonstrated that the IoT hydrometer achieved strong agreement with reference devices (R2 = 0.985, RMSE = 0.36 °Brix), while the PLC-integrated tank sensor also demonstrate improved performance over existing calibrated thermometer (R2 = 0.992, MAE = 0.20 °C). ANOVA indicated that concentration, temperature, and time significantly affected water loss and weight reduction (p < 0.01), with temperature being the dominant factor. Water loss ranged from 18.62% to 39.15% and weight reduction from 9.48% to 34.47%, while maximum solid gain reached 9.31% at 50 °Brix and 40 °C for 180 min, with stabilization consistent with case hardening. Drying kinetics were best described by the Page model (R2 > 0.97). The findings highlight the effectiveness of the system for precise monitoring and optimization of OD processes.
1. Introduction
The increasing demand for high-quality, minimally processed food products with extended shelf life has driven the development of innovative preservation techniques that maintain nutritional and sensory attributes [1,2]. Among these, osmotic dehydration has emerged as an efficient pre-treatment method that reduces water activity while preserving the texture, flavor, and bioactive compounds of fruits and vegetables [3,4].
Osmotic dehydration is a process that uses concentrated solutions to extract water from foods while preserving their structure and essential properties [5,6,7,8] From a physical standpoint, OD is driven by the difference in chemical potential between the food tissue and the surrounding hypertonic solution, which produces a gradient that promotes mass transfer [5,9]. Osmotic dehydration involves three simultaneous mass transfer processes. Primarily, water moves out from the food tissue into the surrounding hypertonic solution. At the same time, solids from the external medium enter the food surface and matrix [3]. Lastly, internal solutes like organic acids, sugars, vitamins, minerals, and compounds affecting color, flavor, and aroma migrate into the osmotic solution [3,10].
From a thermodynamic perspective, osmotic dehydration is driven by the difference in chemical potential of water between the food matrix and the hypertonic osmotic solution [3,11]. The mass transfer can be described as a diffusion-controlled process following Fick’s first law [12]:
where is the mass flux (kg·m−2·s−1), the effective diffusion coefficient (m2·s−1), and the solute concentration gradient. The driving force is the osmotic pressure gradient (), directly related to differences in water activity () and solute concentration according to:
where is the gas constant, the absolute temperature (K), and the molar volume of water. As the process proceeds, water diffuses outward while solutes migrate inward until the osmotic potentials equilibrate, leading to the observed changes in water loss (WL) and solid gain (SG). These formulations quantitatively describe the physical basis of osmotic dehydration and provide a framework for analyzing mass transfer kinetics and diffusion mechanisms [13,14,15].
This method is particularly useful for delicate products such as fruits and vegetables, where water loss must be controlled to avoid degradation of bioactive compounds and maintain their natural appearance and flavor [4,10]. Also, several strategies have been explored to improve the efficiency of osmotic dehydration. Among these, ultrasound-assisted osmotic dehydration (UAOD) stands out due to its ability to disrupt cell walls through acoustic cavitation, increasing tissue porosity and accelerating water loss and solid gain with minimal impact on sensory and nutritional qualities [9,16]. This technique has been effectively applied to fruits such as mango, strawberry, and pineapple, leading to reduced processing times, enhanced mass transfer rates, and better preservation of phenolic compounds and color [17,18].
Other methods to improve osmotic dehydration include vacuum-assisted OD and ultrasound-vacuum pre-treatments (USVOD), which have been found to enhance water loss and solid gain more than traditional OD in fruits like black jamun and oranges [19,20]. Pulsed Electric Field (PEF) pre-treatments have also been applied successfully to strawberries, kiwifruit, and pumpkin, resulting in higher mass transfer rates, shorter drying times, reduced energy use, and better preservation of quality characteristics [17,20,21].
The use of alternative osmotic agents like polyols (e.g., erythritol, xylitol), natural sweeteners, and fruit juice or concentrate solutions has gained interest for maintaining or enhancing dehydration efficiency while offering healthier options and preserving bioactive compounds [8,22,23]. Additionally, combining osmotic dehydration with edible coatings, structural modifications, and finishing methods such as vacuum drying, microwave-vacuum drying, or freeze-drying improves color, texture, antioxidant retention, and shortens drying time [24,25].
However, traditional osmotic dehydration processes often rely on manual operations and lack precise control over critical parameters, which may result in inconsistencies in product quality and process inefficiencies [6,26]. Recent advances in automation and digital technologies, particularly the integration of Internet of Things (IoT) devices, programmable logic controllers (PLC), and human–machine interfaces (HMI), offer new opportunities to overcome these limitations by enabling real-time monitoring, data-driven control, and improved process reliability [27,28,29]. IoT-enabled sensors allow remote monitoring of key parameters such as syrup concentration, temperature, and immersion time, optimizing the osmotic dehydration process without constant operator presence [27,30,31]. Automation also enhances process precision and consistency, lowering operating costs and minimizing human errors [32].
Recent research has employed intelligent control and modeling techniques to enhance osmotic dehydration processes. Adaptive neuro-fuzzy inference systems (ANFIS) have been utilized to predict water loss, solid gain, and moisture content in vegetables treated with various osmotic agents and concentration [33]. Optimization of ultrasonic-assisted OD parameters such as immersion time, solid-to-solution ratio, ultrasonic power, and solution concentration for small fruits has been achieved by combining UAOD with response surface methodology and ANFI [34]. IoT-enabled systems have also been designed to monitor temperature, concentration, and agitation remotely during OD, resulting in enhanced process stability and reproducibility [27].
The implementation of IoT in this context allows remote and real-time monitoring of critical variables such as temperature and concentration, optimizing process control without the need for constant operator intervention [35].
IoT integration in osmotic dehydration also opens up new possibilities for scalability and process customization. Connected sensors can collect detailed data on food behavior during the process, making it possible to adjust conditions for different types of products and obtain optimal results [36,37]. In addition, the ability to monitor and control the process remotely facilitates equipment supervision and maintenance, reducing downtime and improving overall system efficiency [38,39].
In this context, the objective of this study is to present the design and implementation of an automated osmotic dehydration (OD) system that integrates IoT-based sensors for real-time monitoring of syrup concentration and process temperature, together with a programmable logic controller (PLC) and a human–machine interface (HMI) for precise control of critical variables such as agitation and heating. The system was validated through experimental trials using mango (Mangifera indica) as a case study under different combinations of sucrose concentration, temperature, and immersion time. The monitoring devices showed high reliability compared with laboratory standards, confirming their suitability for continuous process control. Overall, the trials demonstrated that the developed prototype ensures accurate and reproducible monitoring of OD, highlighting its potential to optimize mass transfer, improve product quality, and increase operational efficiency in food dehydration processes.
2. Materials and Methods
2.1. Equipment Design
2.1.1. Process Variables
Among the process variables used in the design of the equipment are temperature, agitation, concentration of the osmotic solution and the ratio between the feed and the osmotic medium. Temperature directly influences the kinetics of mass transfer, accelerating or retarding the loss of water and the gain of solids; agitation guarantees a homogeneous distribution of concentration and temperature, avoiding stagnation zones that could affect the uniformity of the process [3,40]. On the other hand, the concentration of the solution determines the osmotic rate, the main driving force of the process, while the ratio between the food and the solution impacts the saturation and efficiency of the medium [41]. Table 1 lists the selected variables and the working range considered for the design of devices and sensors.

Table 1.
Osmodehydration process variables considered for equipment design.
2.1.2. Selection of Elements for the Automation of the Equipment
Temperature control: For the temperature control of the designed equipment, a system based on a high-precision temperature sensor (Thermocouple, Type K, from TC Medida y Control de Temperatura, S.A.’s Series 12, Madrid, Spain) and a PID (Proportional–Integral–Derivative) controller was implemented. This system allowed continuous monitoring of the process temperature and automatic adjustment of the heating element power, ensuring a stable and accurate maintenance of the desired temperature. The PID controller calculates the deviation or error between the measured value and the desired value by applying three control actions: proportional, which determines the reaction to the actual error; integral, which generates a correction proportional to the integral of the error; and derivative, which determines the reaction according to the rate of change of the error [42,43].
- Agitation control: For the recirculation control in the process tank of the designed equipment, a water pump connected by means of stainless-steel piping was used, which guarantees a constant and corrosion-resistant flow during the process. This system allows maintaining a homogeneous circulation of the liquid, favouring the transfer of mass and temperature [27]. On the other hand, in the syrup preparation tank, an ON-OFF type control was implemented for the agitation system, using blades that facilitate the efficient mixing of the components. This simple and effective method ensures the uniformity of the syrup prior to its use in the process, thus optimising the initial conditions of the system.
- IoT sensor selection: For this research, a commercial IoT sensor (Tilt Hydrometer) was selected (Figure 1), which is an affordable alternative and allows for the remote and real-time measurement of the concentration of sugars and the temperature of liquids during fermentation processes, mainly in the production of beer and wine. Although the Tilt Hydrometer is a commercially available device and not one that was custom-designed for this research, it was selected for its compatibility with IoT technologies, which allows it to be easily integrated into our monitoring system. This sensor has a specific gravity measurement range of 1.190 to 1.310 and a temperature range of −17.8 °C to 60 °C (0 °F to 140 °F). The specific gravity is accurate ± 0.002° within the Tilt’s range of 1.190–1.310. The thermometer is accurate ± 1 degree F (± 0.5 degree C). The operation of the Tilt Hydrometer is based on the principle of buoyancy and angular displacement: the device floats freely in the liquid, and its tilt angle varies according to the specific gravity of the solution. An internal inertial measurement unit (IMU) detects this angle and transmits the data via Bluetooth to a microcontroller or mobile device, where it is converted into specific gravity (SG), °Plato, or °Brix using a calibration curve. In parallel, the integrated temperature sensor allows automatic temperature compensation of the readings, ensuring accurate and stable real-time measurements [44,45]. It should be noted that the TILT hydrometer has been used for real-time monitoring of syrup concentration during the TQ1 process. This was crucial for verifying that the concentration remained stable or for detecting and quantifying its dilution as the fruit lost water. The integration of this commercial sensor demonstrates how IoT technology can be adapted to existing processes, providing an effective and cost-efficient solution for real-time data collection in the field of fermentation. By using this commercially available device, the research benefits from a readily available and reliable tool, capable of providing continuous and precise measurements, without the need to develop a custom sensor for the process [46].
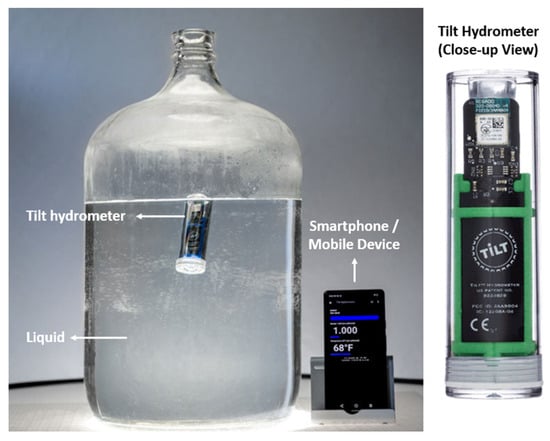 Figure 1. “Tilt Hydrometer” float sensor (https://tilthydrometer.com/).
In terms of IoT technology, the Tilt Hydrometer uses Bluetooth 4.0+ connectivity to transmit data in real time to compatible devices such as smartphones (iOS and Android), tablets or systems such as Raspberry Pi via the free “Tilt 2” app, which allows automatic viewing and recording of measurements, even storing them in the cloud through platforms such as Google Sheets (Figure 2), facilitating remote and continuous analysis of the process [46,47].
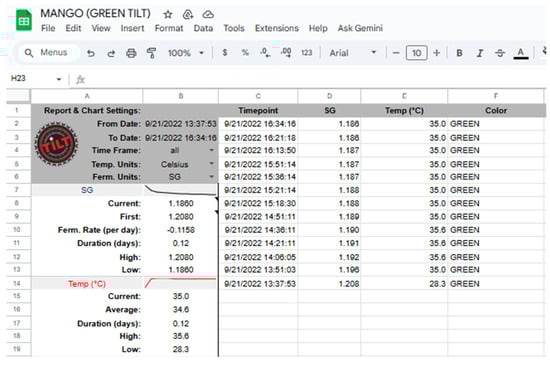
Figure 2.
Data obtained in real time by the “Tilt Hydrometer” stored in Google Sheets.
2.1.3. Control System
The control system was based on the use of an integrated system between a HNC HCG-8X8Y-R PLC and HNC Electric HMI HT3000-B7H. Both units were supplied by HNC Electric, originating from the manufacturing base in Zhejiang, China. Within this system, the PLC programs dehydration cycles, adjusting parameters such as time, temperature and agitation according to the type of food The PLC activates/deactivates heating elements and recirculation pumps according to sensor readings. Moreover, The HMI allows real time data visualization and setpoint modification through touch screens (e.g., 45 °C temperature).
2.2. Validation of Sensor Measurements
To validate the monitoring system, evaluations were performed on both the Tilt Hydrometer and the process sensor within the tank. The Tilt was immersed directly in the osmotic solution, recording specific gravity (expressed in °Brix) and temperature simultaneously. Its data were compared with those from reference devices: a digital refractometer (HI96801, Hanna® Instruments; Lima, Perú; accuracy ± 0.2% °Brix) for measuring concentration and a calibrated laboratory thermometer (HI98501, Hanna® Instruments; Lima, Perú; accuracy ± 0.2% °C) for temperature, both sampling the same solution near the Tilt sensor. This approach allowed verification that the sensor’s measurements inside the tank aligned with established laboratory standards.
Simultaneously, the process temperature sensor installed in the tank and connected to the PLC underwent validation as well. Unlike the Tilt, this sensor is fixed within the tank wall and primarily functions to control the heating. Since the manufacturer does not provide an accuracy specification, an acceptance margin of ±0.5 °C was established, aligning with typical class A Resistance Temperature Detector (RTD) sensor used in food processing. Its measurements were compared against those from the same calibrated thermometer used in the Tilt sensor validation. This combined validation strategy enabled evaluation of both the Tilt’s ability to monitor conditions in real time within the solution and the dependability of the stationary sensor responsible for managing the heating system.
2.3. Evaluation of Equipment Performance
The methodology for testing the equipment was based on the work of [48] with some modifications. The fruit chosen for testing was mango, as it is a high-yield fruit in Peru. The tests correspond to the evaluation carried out by a group of thesis students from the Food Industries Engineering at the Universidad Nacional de Frontera who were part of the funded project from which this equipment originated. Figure 3 shows the resulting steps, which are explained below.
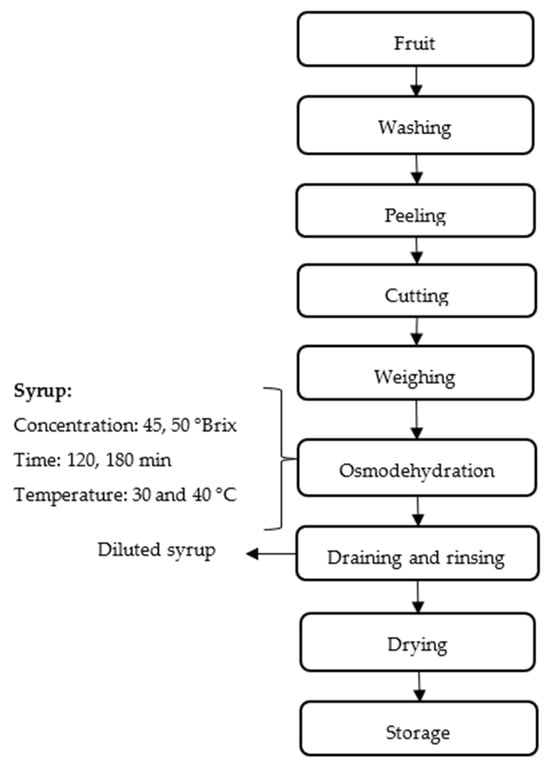
Figure 3.
Flow chart of the osmodeshydration process.
2.3.1. Sample Preparation
The mangoes (Mangifera indica) used in this study were obtained from a local market in the city of Tambogrande, Perú, selecting only fruits in good condition, without signs of excessive ripeness, bruising, or visible deterioration. To remove any residue or surface dirt, the fruits were washed with running water. They were then immersed in a 50-ppm chlorinated water solution for 5 min as a disinfection measure, following the guidelines established by FAO [49]. After disinfection, the peel was carefully removed using a peeler, and with the help of a specialized cutter, the mangoes were cut into 10 × 10 mm cubes, ensuring that the sizes were uniform to optimize the dehydration process.
2.3.2. Osmotic Dehydration
Following preparation, the fruit moves into the critical Osmodehydration stage. In this step, the fruit is immersed in a Syrup solution. The experiment tests two key variables: the Syrup Concentration (45 and 50 °Brix) and the Time of immersion (120 and 180 min). This osmotic treatment aims to draw out a significant portion of the fruit’s water content. The spent solution, now less concentrated, is recovered as Diluted syrup. The designed equipment allowed maintaining the syrup temperature at 30 and 40 °C during the process and programming the recirculation in intervals for 120 and 180 min, which was the duration of the treatments. The fruit-to-syrup ratio used was 1:4 (w/w). This process involved mass transfer, where the water contained in the fruit moved towards the osmotic solution, and the solutes from the solution entered the fruit. This process resulted in water loss from the fruit and solids gain. The mass transfer was evaluated by calculating water loss (WL), weight reduction (WR), and solids uptake (SG) following the method described in [50].
where and represent the initial weight and the weight after osmotic dehydration (OD), respectively, and and correspond to the moisture content before and after OD. Finally, and denote the concentration values in °Brix prior to and following the OD process. It should be clarified that and were not calculated values but directly measured using an ATAGO PAL-3 digital refractometer (Atago Co., Ltd., Tokio, Japan) before and after the osmotic dehydration process. These measurements were performed in triplicate, and the average °Brix values were temperature-corrected according to the manufacturer’s specifications (reference temperature: 20 °C). Therefore, and represent the experimentally determined soluble solids content of the fruit at the initial and final stages of the process, respectively, and not parameters derived from the syrup concentration monitored by the Tilt Hydrometer.
Moisture content was measured using an AND MX-50 moisture analyzer (Kyoto, Japan), which enables faster determination compared to conventional methods. Meanwhile, the °Brix values were obtained through refractometry.
2.4. Hot Air Drying
After the osmotic dehydration process, the fruit goes through a post-treatment phase. This involves draining and rinsing to remove excess syrup from the surface of the fruit, which is subsequently dried. The entire process concludes with the Storage of the final dried product. The drying process was performed using a hot air tray dryer set at a temperature of 50 °C. Drying continued until the moisture content was reduced to below 15%, as moisture levels above this threshold can promote fungal growth and spoilage [51]. Maintaining humidity below this limit is crucial to ensure the microbial stability and extended shelf life of the dried product [52].
Evaluation of Drying Kinetics
The moisture data obtained were recorded on a wet basis and subsequently converted to a dry basis for analysis. The reduced moisture (RM) was calculated for each drying time using the following equation:
where: is the moisture content on a dry basis at time t, is the initial moisture content, and the equilibrium moisture content was considered negligible. Three empirical models widely used in food drying studies reported by [53,54,55] were adjusted.
The adjustment was performed using nonlinear regression with least squares, and the degree of representation of each model was evaluated using the coefficients of determination (R2) and the root mean square error (RMSE), according to criteria suggested by [56].
2.5. Experimental Design for Performance Evaluation
A 23 factorial design (Table 2) was executed, encompassing concentration (45 and 50 °Brix), temperature (30 and 40 °C), and time (120 and 180 min) as the experimental factors. The response variables under investigation include weight reduction (WR), water loss (WL), solids gain (SG), and drying time. The treatments will be carried out in triplicate and the data obtained will be analyzed using ANOVA. An untreated control sample was used for drying kinetics comparisons.
Table 2.
Factorial design 23.
3. Results and Discussions
3.1. Design of the Osmodehydrator
An osmotic dehydration equipment was built (Figure 4) with two tanks, one for the formulation of the syrups and the other for the process. The equipment also allows the process tank to be drained, facilitating the extraction of the fruit after the process, with the help of a grid. The grid is specially designed to contain the fruit and to maintain the buoyancy of the sensor.
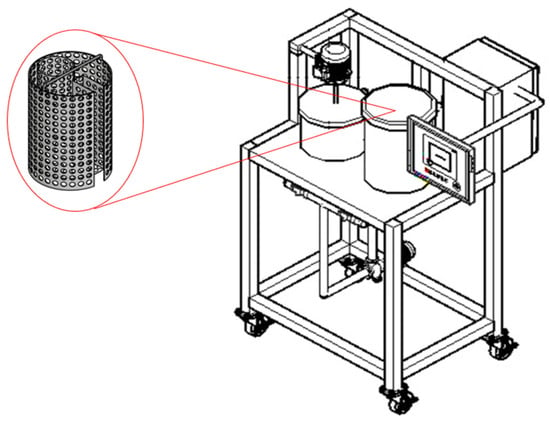
Figure 4.
The figure shows the 3D design of the prototype, showing the two tanks (syrup preparation and process), the HMI screen, the control box and bearings for transporting the equipment. It also shows the design of the grid used in the process tank.
The two-tank design (TQ1: Processing; TQ2: Syrup preparation) is an essential technical decision driven by the need for precise physical condition control during osmotic dehydration. The separation is indispensable due to the incompatibility of the required agitation systems: TQ2 utilizes blades for vigorous mixing, ensuring rapid sugar dissolution and the precise homogenization of the syrup concentration; conversely, TQ1 employs a recirculation system that only induces a gentle flow, which is fundamental for preventing mechanical damage (breakage or maceration) to the delicate fruit pieces being processed. Furthermore, this design maximizes efficiency by allowing the syrup, after processing in TQ1, to be drained and returned to TQ2 for reuse or regeneration. This leaves the fruit ready for recovery on the TQ1 sieve, simplifying the final step and avoiding the clutter of incompatible machinery within a single vessel.
In preliminary comparative trials, the use of a single-tank system equipped with mechanical blades led to visible erosion and partial disintegration of mango slices, with approximately 12–15% of samples showing structural defects after 180 min of processing at 50 °Brix and 40 °C. The two-tank configuration prevented this deterioration by isolating vigorous mixing to TQ2 and maintaining gentle recirculation in TQ1, thereby preserving tissue integrity while ensuring uniform syrup concentration (±0.3 °Brix) and temperature stability (±0.5 °C). This configuration thus provides both process homogeneity and mechanical protection to the fruit tissue, aligning with previous findings that reduced shear environments during osmotic dehydration enhance microstructural preservation and mass transfer efficiency.
The process tank is also equipped with a heating system and a temperature control system to control the process temperature. Authors note that implementing a temperature control system is essential for optimizing mass transfer, minimizing energy consumption, and ensuring the quality and safety of osmo-dehydrated foods [57,58].
Moreover, the equipment incorporates a concentration sensor equipped with a Bluetooth module, which enables connection to the network and access to the sensor data from anywhere. A critical aspect in the design and control of osmotic dehydrators is the accurate and continuous measurement of the sugar concentration during the process, as this variable directly influences the dehydration kinetics and the final product properties [59].
Despite its importance, existing literature and designs do not include accessible sensors to measure this concentration in real time, due to the lack of inexpensive and suitable devices for this purpose [27]. This lack is due to the fact that most of the sensors available in the industry, such as industrial Brix meters (e.g., the BRIX MONITOR from Centec or the Teqwave H from Endress+Hauser), are oriented towards industrial applications with high costs and technical complexity that do not suit smaller scale projects or budget constraints.
The design also proposes an automated recirculation system with stainless steel pipes and a set of solenoid valves for control, avoiding the formation of diluted zones in the process tank. The use of systems with conventional blades or agitators can cut or damage the fruit, affecting its integrity and final quality [27].
The control system is interactive and with graphic interface of the process, in this way, on the panel we can observe a process graph, but also program the factors such as process temperature, agitation rpm for the syrup preparation tank, and the control of the valves for recirculation.
3.1.1. Automated Control System (PLC and HMI)
Control System Diagram
Figure 5 shows the diagram of the control system designed for the osmo-dehydration process, which integrates a PLC with an HMI model HT3000-B7H for automation and real-time monitoring. The diagram illustrates the connection between the temperature sensor, the heating actuator (electrical resistances) and the recirculation system, all controlled by the PLC. This scheme ensures efficient two-way communication between the components, ensuring thermal stability and homogeneity of the osmotic solution, key factors in optimizing mass transfer and preserving the quality of the final product.
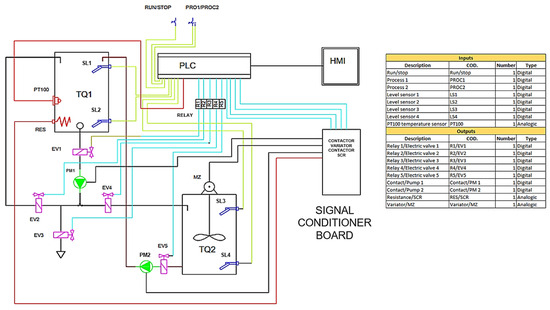
Figure 5.
Control system diagram.
HMI Functionalities
In the present automated system, the HT3000-B7H HMI (Human Machine Interface) played a key role in facilitating real-time monitoring and control of the osmo-dehydration process. Through its high-resolution touch screen, the HMI allowed continuous visualization of critical variables such as temperature, osmotic solution concentration (°Brix) and actuator status, providing the operator with clear and accessible information for immediate decision making.
The interface has a main menu (Figure 6) where the process development is graphically displayed, allowing an intuitive and dynamic visual monitoring of the variables during the operation.
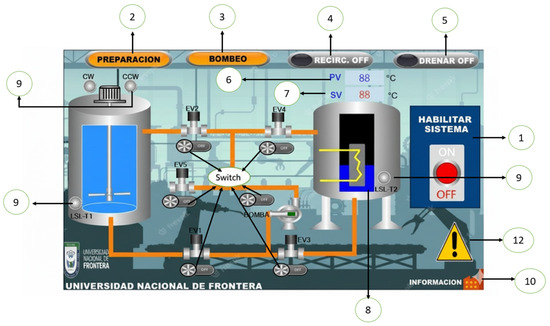
Figure 6.
Control system diagram. Main menu: (1) “Enable system” button”, (2) “Preparation” sub-window, (3) “Pumping” sub-window, (4) “Recirculation On/Off” button, (5) “Drain On/Off” button, (6) PV: Process temperature, (7) SV: Desired temperature, (8) Resistance ON, (9) Component signal, (10) Additional information, (11) EV (electrovalves), (12) Warning: Check the automatic mode and connection.
In addition, the HMI interface has a specific submenu for syrup preparation (Figure 7), where the motor speed, running time, clockwise or counterclockwise rotation, as well as system start-up and shutdown can be controlled.
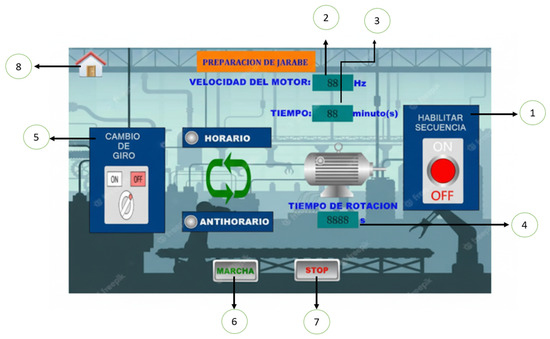
Figure 7.
Syrup preparation menu: (1) “Enable sequence” button”, (2) Motor speed, (3) Time, (4) Rotating time (5) Rotation change, (6) Start, (7) Stop, (8) Return to main menu.
Additionally, it has a submenu dedicated to the control of the syrup temperature in the process tank (Figure 8), where it is possible to adjust and maintain the desired temperature, ensuring optimal conditions for dehydration.
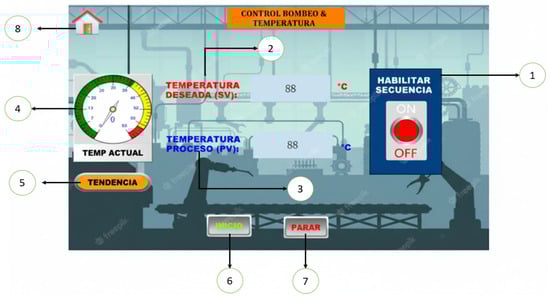
Figure 8.
Temperature control menu: (1) “Enable sequence” button”, (2) Desired temperature, (3) Process temperature, (4) Current temperature (5) Trend, (6) Start, (7) Stop, (8) Return to main menu.
Finally, the HMI includes a menu where the temperature trend is graphed over time (Figure 9), allowing the operator to perform a detailed follow-up and detect any deviation that requires intervention.
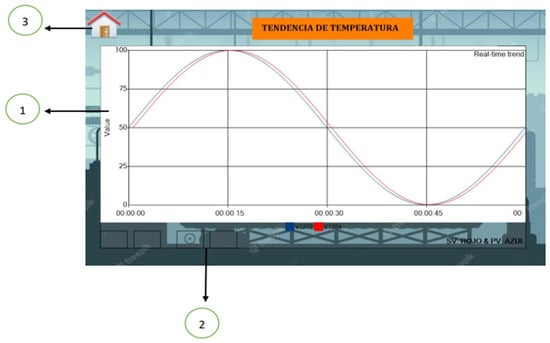
Figure 9.
Temperature trend graph: (1) Temperature vs. Time, (2) Zoom, (3) Return to main menu.
The integration of Human–Machine Interfaces (HMI) and Programmable Logic Controllers (PLC) in the design and automation of osmotic dehydrators is essential for optimizing the dehydration process and ensuring the quality of the final product. Both HMI and PLC enhance the control and monitoring capabilities of the system, allowing for precise adjustments in response to real-time data inputs.
Osmotic dehydration (OD) applications in food processing necessitate precise control over several parameters, such as osmotic agent concentration, temperature, and time, which are critical for achieving desired moisture content and preserving food quality. The HMI provides a user-friendly interface for operators to interact with the system, enabling them to set parameters, monitor progress, and assess the performance of the dehydration process visually [60]. With features to display critical data, HMI systems enhance users’ ability to manage variations in fluid dynamics and mass transfer mechanisms occurring during osmotic dehydration, which have been discussed in various studies [61,62].
On the other side, PLC plays a vital role in automation by executing control commands based on the parameters set through the HMI. It enables the orchestration of multiple processes such as maintaining the osmotic solution’s temperature, which are crucial for optimal mass transfer. The automation capabilities of PLC enhance reproducibility and consistency in food processing, leading to improved product quality [63]. The seamless communication between HMI and PLC allows operators not only to observe the process but also to intervene directly adjusting setpoints, initiating start/stop commands, or troubleshooting faults in real time [64,65,66]. This integration reduces manual intervention, minimizes human error, and enhances the reliability and repeatability of industrial processes [38,67].
Recent advancements have led to the development of integrated HMI-PLC units, which combine control and visualization in a single device, further streamlining system architecture, reducing wiring and installation costs, and facilitating remote access and diagnostics [67]. Such systems are particularly valuable in applications requiring high flexibility, rapid changeovers, and stringent quality control, as seen in food processing, pharmaceuticals, and advanced manufacturing [65,67]. Overall, the combined use of HMI and PLC not only optimizes process automation but also empowers operators with actionable information, contributing to improved productivity, safety, and process transparency [38,67,68].
3.1.2. Sensor Validation
A total of 72 paired measurements were gathered to compare the Tilt sensor with the refractometer. The key statistical results are presented in Table 3. The average difference was −0.12 ± 0.32 °Brix, with a mean absolute error (MAE) of 0.28 °Brix and a root mean square error (RMSE) of 0.36 °Brix. Regression analysis demonstrated a very high correlation (R2 = 0.985), and no significant statistical differences were found (p > 0.05). The Bland–Altman test showed an average bias of −0.12 °Brix, with 95% limits of agreement ranging from −0.74 to + 0.50 °Brix, all remaining within the manufacturer’s specified accuracy of ±0.5 °Brix.
Table 3.
Statistical summary of Tilt Hydrometer vs. refractometer (°Brix).
During the dynamic dilution test, the Tilt device accurately monitored concentration changes, with a maximum deviation of 0.8 °Brix at the peak change point and a response delay under 30 s. Consistency tests under stable conditions showed a coefficient of variation of 0.4%, demonstrating high stability and reliability in the measurements.
For temperature, the Tilt vs. reference comparison yielded the results presented in Table 4. The average difference was −0.12 ± 0.27 °C, with a mean absolute error (MAE) of 0.25 °C and a root mean square error (RMSE) of 0.30 °C. A strong correlation was observed (R2 = 0.986), and no statistically significant differences were detected (p > 0.05). These findings validate that the Tilt’s temperature readings align with its manufacturer’s specified accuracy of ±0.5 °C.
Table 4.
Statistical summary of Tilt Hydrometer vs. reference thermometer (°C).
The temperature readings from the sensor integrated into the PLC were also compared with those of the calibrated thermometer, with results summarized in Table 5. The average difference recorded was +0.05 ± 0.22 °C, with a mean absolute error (MAE) of 0.20 °C and a root mean square error (RMSE) of 0.23 °C; regression analysis showed a strong correlation (R2 = 0.992). In the absence of manufacturer specifications, an acceptance range of ±0.5 °C was applied, in accordance with class A RTD standards (IEC 60751) [69]. All readings fell within this range, demonstrating that the tank sensor provides reliable control for the process.
Table 5.
Statistical summary of tank sensor vs. reference thermometer (°C).
The validation outcomes confirm that both the commercial Tilt Hydrometer and the tank sensor integrated with the PLC deliver precise and trustworthy measurements under laboratory conditions during osmotic dehydration. The differences observed (within ±0.5 °Brix and ±0.5 °C) are consistent with the Tilt’s manufacturer specifications and the tolerance set for the tank sensor, supporting their appropriateness for process monitoring.
The slight variations observed in this study can be attributed to factors such as the placement of sensors, local variations in temperature or concentration within the tank, and the manual handling involved in refractometry sampling. These factors align with findings from other researchers who emphasize how sampling methods and sensor positioning affect measurement precision in liquid food systems [70,71]. Additionally, IoT devices like the Tilt sensor have been shown to provide reliable performance in fermentation and beverage monitoring when benchmarked against laboratory standards, although minor biases often arise due to fluid movement and temperature response delays [72,73].
These results endorse the use of the monitoring system as a reliable solution for real-time oversight of osmotic dehydration processes. Consistent with earlier research on food industry digitalization and automation [74,75], the combination of validated IoT sensors with PLC control improves process dependability and supports potential scaling. Future investigations should focus on validating the system in pilot- or industrial-scale settings to evaluate its durability across varied operational scenarios and extended production periods, as recommended by other studies on IoT-based food monitoring [76,77].
3.2. System Performance
An osmotic dehydration process was carried out on mango (Mangifera indica) by immersing pieces of the fruit in sucrose solutions of different concentrations. For this experiment, the main variables considered were solution concentration, temperature, and immersion time, following a 23 factorial design. Throughout the procedure, the osmotic dehydration equipment operated optimally, maintaining stable and controlled conditions that allowed precise management of temperature and recirculation time. This technological efficiency facilitated the observation of significant changes in the mango’s response to the different treatments, enabling a more accurate analysis of how these factors influence mass transfer and the final product quality. The results demonstrated that osmotic dehydration was effective in reducing the water content of the mango while preserving the fruit’s structure, a fundamental aspect for subsequent drying stages.
3.2.1. Mass Transfer Evaluation
Mass transfer was evaluated using three response variables: weight reduction (WR), water loss (WL), and solid gain (SG). The data were evaluated using the Shapiro-Wilk normality test, obtaining p-values > 0.05, allowing the application of factorial ANOVA. Table 6 presents a summary of the mass transfer results obtained.
Table 6.
Mass transfer results.
Statistical analyses using ANOVA models for the variables water loss (WL) and weight reduction (WR) showed highly significant results with an excellent fit, having coefficients of determination R2 of 0.995 in both cases (WL: p < 0.001; WR: p < 0.001). Regarding WL, significant effects were identified for the three main factors—concentration, temperature, and time—as well as for the interaction concentration temperature and temperature time. For WR, these same main factors were also significant, along with the interaction concentration time and temperature time. The average values of WL ranged from 18.62 ± 0.33 to 39.15 ± 1.34, while for WR the values varied from 9.48 ± 0.46 to 34.47 ± 1.34, showing a clear increase in both variables as the levels of sucrose concentration, temperature, and time increased. The predominant effect of temperature on water loss stands out, reflecting its decisive influence on the osmotic process.
In the case of solids gain (SG), the analysis of variance revealed a statistically significant model (p < 0.001), although with a lower coefficient of determination (R2 = 0.772), indicating a more moderate fit compared to the other variables. Significance was found only for the main effect of concentration and its interaction with time. SG values ranged from 6.87 ± 0.23 (T3) to 9.31 ± 0.73 (T7), clearly showing that this variable was primarily influenced by the concentration of the osmotic agent. Treatments with more concentrated solutions promoted greater incorporation of soluble solids into the fruit, especially when combined with longer immersion times.
Figure 10 shows the interaction graphs for WR and Wl at temperatures of 30 °C and 40 °C. The interaction shows that both water loss (WL) and weight reduction (WR) in mango increase with longer immersion times, higher osmotic solution concentrations (45 and 50 °Brix), and temperature. At 30 °C, both processes show a moderate increase: WL rises from approximately 18.62% to 23.45% at 45 °Brix and from 19.38% to 25.20% at 50 °Brix, while WR increases from 9.48% to 16.42% at 45 °Brix and from 11.67% to 19.53% at 50 °Brix, reflecting less intense mass transfer. At 40 °C, both WL and WR increase significantly, with WL reaching between 32.76% and 36.89% at 45 °Brix and from 35.80% to 39.15% at 50 °Brix; WR rises from 25.36% to 31.80% at 45 °Brix and from 29.25% to 34.47% at 50 °Brix. This greater increase is attributed to enhanced molecular mobility and diffusion rate, which favor the movement of water and solids from inside the fruit to the solution. In all cases, the final loss is clearly influenced by the osmotic gradient, exposure time, and especially temperature, which is a key factor for process efficiency.
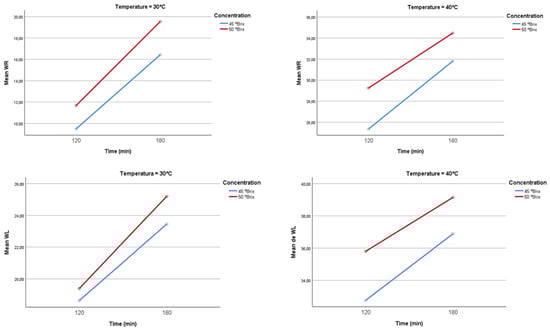
Figure 10.
Weight reduction interaction (WR) at 30 °C and 40 °C.
Regarding the effect of temperature, various studies have shown that increasing temperature, especially within the range of 45 °C to 60 °C, promotes greater water loss. Authors of Ref. [78] attribute this effect to the expansion of cell membranes, which lowers resistance to mass transfer and facilitates water exit. Similarly, Refs. [79,80] indicate that elevated temperatures reduce the viscosity of the osmotic solution, easing the movement of water and solutes through the mango’s membranes. Likewise, Ref. [81] reported a statistically significant influence of temperature on water loss during osmotic dehydration, with a p-value below 0.05, confirming the crucial role temperature plays in the efficiency of water removal in this process.
Figure 11 illustrates the interaction effect of immersion time and solution concentration on Solid Gain (SG). The data show that increasing the osmotic agent concentration from 45 °Brix (blue lines) to 50 °Brix (red lines) consistently generates a higher initial SG, which is coherent with the principle of a greater chemical potential gradient. For example, the highest SG (9.31% at 50 °Brix and 40 °C at 180 min) was achieved under the most intense conditions. While longer durations generally increase SG, as reported in Ref. [82] with a statistically significant correlation (p < 0.01), the trends observed for the 50 °Brix condition are characterized by a pronounced stabilization of SG between 120 and 180 min, indicating a significant drop in the mass transfer rate. More recent studies, such as Ref. [83], have indicated that SG tends to stabilize after 2 to 4 h under controlled conditions, supporting previous findings that suggest a linear relationship between immersion time and SG in the initial stages of the process [82].
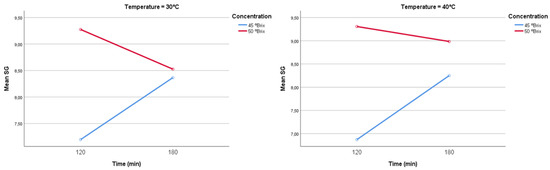
Figure 11.
Solid gain interaction (SG) at 30 °C and 40 °C.
From a physical point of view, this attenuated trend is explained by the rapid establishment of a diffusion resistance barrier at the food’s surface. This phenomenon, commonly termed ‘Case Hardening’, has been widely documented [6,84]. The high osmotic pressure created by the 50 °Brix solution induces a very rapid Water Loss (WL) from the tissue, especially at elevated temperatures This accelerated surface dehydration causes two crucial physical changes: the densification and shrinkage of the external tissue, which increases the resistance of the diffusion pathway for solute molecules [80,85]; and the accumulation and high concentration of the osmotic agent on the surface, which acts as a low-permeability physical barrier that limits further solute penetration [86]. As a result, the SG rate under the 50°Brix condition is significantly lowered because the concentration gradient’s driving force can no longer overcome the diffusion resistance presented by this surface layer. This explains why very high concentrations may reduce solids gain efficiency, suggesting an optimal concentration point that maximizes process benefits [4,6]. Hence, intermediate concentrations, generally between 40 and 60°Brix, are regarded as most effective for preserving product quality and enhancing process efficiency [87,88]. Finally, the combined effect of temperature and osmotic solution concentration is critical, as shown by Ref. [88], with several studies concluding that the highest water loss and solids gain occur when temperature, concentration, and treatment duration are optimized simultaneously [89,90,91].
Although the present study did not include a complete diffusional modeling of solute transfer, the observed SG behavior can be interpreted within the framework of Fickian diffusion and osmotic pressure gradients. Literature reports indicate that the effective solute diffusivity () in mango tissue under osmotic dehydration typically ranges between and m2·s−1 at 40–50 °Brix and 35–45 °C [92,93]. The progressive increase in SG during the first 120 min, followed by a stabilization phase, is consistent with a diffusion-controlled process initially governed by the concentration gradient between the fruit and the syrup. As dehydration progresses, the accumulation of solutes on the fruit surface leads to a case-hardening effect, where the formation of a dense sucrose layer reduces permeability and limits further solute penetration. A schematic representation (Figure 12) illustrates this resistance layer and the direction of water and solute fluxes during the process. These results confirm that the solute uptake observed in this study follows the diffusion-limited behavior reported for similar mango tissues, reinforcing the physical interpretation of the osmotic dehydration mechanism.
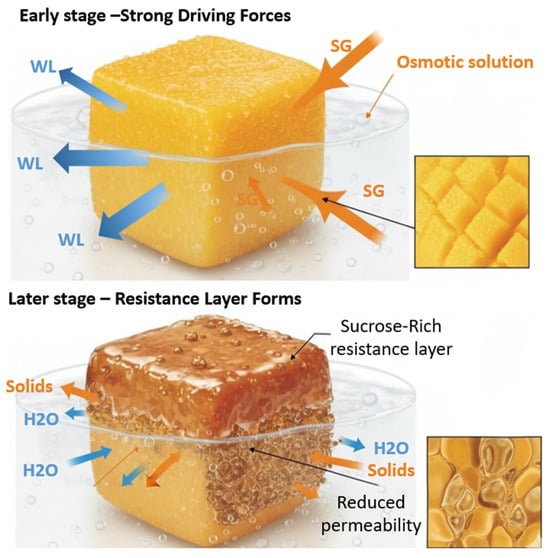
Figure 12.
Mass Transfer Mechanism and Resistance Layer (Case Hardening) Formation during Osmotic Dehydration.
3.2.2. Evaluation of Drying Kinetics After Osmotic Dehydration
Figure 13 presents a graph showing the drying curves of the treatments. Treatments T1, T2, T3, and T5 display a rapid decline, indicating more efficient drying and greater water loss within a shorter time frame. In contrast, T6 and T7 maintain higher moisture levels for a longer period, suggesting increased resistance to drying, which may be related to solids gain. The treatment T0, representing fresh mango, starts with the highest moisture content, approximately between 4 and 5 g/g dry matter, and experiences a steep decrease. Lastly, treatments T4 and T8 show a reduction in moisture as well, but in a more moderate manner compared to the others.
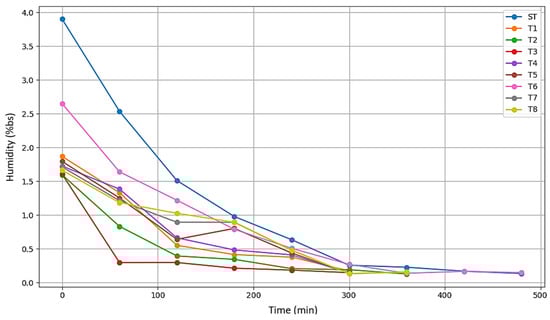
Figure 13.
Drying curves-Moisture on a dry basis vs. time.
The results of the kinetic model fitting for each evaluated treatment are shown in Table 7. Overall, the Page model provided the highest coefficients of determination (R2 > 0.97), indicating the best fit in most cases, particularly in treatments T2 (R2 = 0.9919) and T3 (R2 = 0.9978). This superior performance of the Page model aligns with previous studies; for instance, Ref. [94] reported that this model accurately described the drying kinetics of onion slices, while Ref. [95] found similar results in mango slices, demonstrating its efficacy for products with varying moisture contents. Additionally, Ref. [96], in a comprehensive review, highlighted the robustness and applicability of the Page model in diverse drying processes. Meanwhile, the Henderson-Pabis model, which includes an additional parameter, showed comparable performance, particularly in treatment T6 (R2 = 0.9950), suggesting it is also suitable for handling the complexity of mango drying kinetics, a finding supported by Ref. [97], who reported R2 values above 0.97 for this model in banana cultivars. In contrast, the Lewis model exhibited limitations, as evidenced by its poor fit in treatment ST (R2 = 0.7370). Studies such as Ref. [98] have documented that the Lewis model is insufficient to represent complex moisture transfer dynamics under variable conditions.
Table 7.
Parameters and adjustment of drying kinetics models.
The parameter k, representing the drying rate constant, varied across treatments, reflecting differences in drying speed likely influenced by variations in fruit characteristics or treatment conditions (see Figure 14 for treatments T0 to T3, and Figure 15 for treatments T4 to T8). Treatments such as T3 showed notably high k values in the Page model, indicative of a more rapid drying process possibly due to increased porosity or lower moisture retention. Furthermore, the parameter n in the Page model, which modulates the curve shape, suggested differing drying mechanisms among treatments, with values diverging from unity pointing to more complex moisture removal dynamics beyond simple exponential decay. In this regard, treatments T1 and T2 exhibited higher drying rates compared to T6 and T8, a result consistent with Ref. [99], who indicated that prolonged exposures can create diffusion barriers slowing drying, as observed in treatments with higher concentrations and longer times.
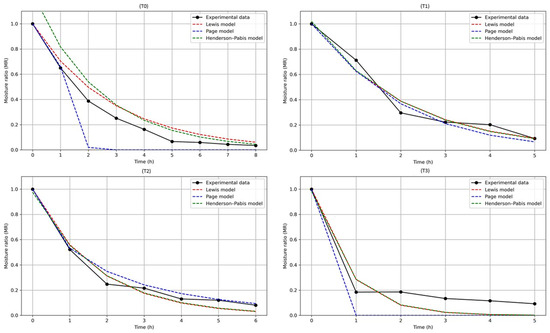
Figure 14.
Modeling of drying curves for T0 (control), T1 (45 °Brix–30 °C–120 min), T2 (45 °Brix–30 °C–180 min), T3 (45 °Brix–40 °C–120 min).

Figure 15.
Modeling of drying curves for T4 (45 °Brix–40 °C–180 min), T5 (50 °Brix–30 °C–120 min), T6 (50 °Brix–30 °C–180 min), T7 (50 °Brix–40 °C–120 min) and T8 (50 °Brix–40 °C–180 min).
4. Conclusions
This study demonstrated the feasibility of an automated osmotic dehydration (OD) system equipped with PLC/HMI control and IoT sensors for real-time monitoring of syrup concentration and process temperature. Sensor validation confirmed the reliability of both devices: the IoT hydrometer showed excellent agreement with refractometer measurements (R2 = 0.985, RMSE = 0.36 °Brix), while the PLC-integrated tank sensor demonstrated high accuracy compared with a calibrated thermometer (R2 = 0.992, MAE = 0.20 °C). Experimental trials on mango (Mangifera indica) confirmed that sucrose concentration, temperature, and immersion time significantly influenced mass transfer (ANOVA, p < 0.01). Water loss ranged from 18.62% to 39.15%, and weight reduction varied between 9.48% and 34.47%, with temperature emerging as the dominant factor. Solid gain reached a maximum of 9.31% at 50 °Brix and 40 °C after 180 min, with stabilization attributed to case hardening. Drying kinetics were best fitted by the Page model (R2 > 0.97), confirming its suitability to describe the dehydration behavior of pretreated mango. Overall, the results highlight that the developed prototype ensures accurate, reproducible monitoring and control of OD, representing a valuable tool for process optimization and product quality improvement in fruit dehydration.
Author Contributions
Conceptualization and project coordination, M.S.-C.; Methodology and investigation, M.S.-C. and L.C.F.-M.; Validation and formal analysis, W.R.M.-Z. and J.S.-C.; Data curation, L.C.F.-M.; Writing—original draft preparation, M.S.-C. and L.C.F.-M.; Writing—review and editing, W.R.M.-Z. and J.S.-C. All authors have read and agreed to the published version of the manuscript.
Funding
This research was funded by the project “Deshidratación osmótica como tecnología emergente para la innovación en la conservación de alimentos”, developed and financed under agreement No. 004-2024 by the Universidad Nacional de Frontera (UNF). The publication costs were also funded by the same project.
Data Availability Statement
The data that support the findings of this study are available from the corresponding author upon reasonable request. No publicly archived datasets were generated or analyzed during this study. Data sharing is not applicable due to ongoing project confidentiality.
Conflicts of Interest
The authors declare no conflicts of interest. The funders had no role in the design of the study; in the collection, analyses, or interpretation of data; in the writing of the manuscript; or in the decision to publish the results.
Abbreviations
The following abbreviations are used in this manuscript:
| OD | Osmotic Dehydration |
| WR | Weight reduction |
| WL | Water loss |
| SG | Solid gain |
| PLC | Programmable Logic Controller |
| HMI | Human–Machine Interface |
| IoT | Internet of things |
| PID | Proportional–Integral–Derivative |
References
- De Corato, U. Improving the Shelf-Life and Quality of Fresh and Minimally-Processed Fruits and Vegetables for a Modern Food Industry: A Comprehensive Critical Review from the Traditional Technologies into the Most Promising Advancements. Crit. Rev. Food Sci. Nutr. 2020, 60, 940–975. [Google Scholar] [CrossRef]
- Robles-Sánchez, R.M.; Rojas-Graü, M.A.; Odriozola-Serrano, I.; González-Aguilar, G.A.; Martín-Belloso, O. Effect of Minimal Processing on Bioactive Compounds and Antioxidant Activity of Fresh-Cut “Kent” Mango (Mangifera indica L.). Postharvest Biol. Technol. 2009, 51, 384–390. [Google Scholar] [CrossRef]
- Abrahão, F.R.; Corrêa, J.L.G. Osmotic Dehydration: More than Water Loss and Solid Gain. Crit. Rev. Food Sci. Nutr. 2023, 63, 2970–2989. [Google Scholar] [CrossRef] [PubMed]
- Asghari, A.; Zongo, P.A.; Osse, E.F.; Aghajanzadeh, S.; Raghavan, V.; Khalloufi, S. Review of Osmotic Dehydration: Promising Technologies for Enhancing Products’ Attributes, Opportunities, and Challenges for the Food Industries. Compr. Rev. Food Sci. Food Saf. 2024, 23, e13346. [Google Scholar] [CrossRef]
- Rahman, S.; Nassef, A.; Al-Dhaifallah, M.; Abdelkareem, M.; Rezk, H. The Effect of a New Coating on the Drying Performance of Fruit and Vegetables Products: Experimental Investigation and Artificial Neural Network Modeling. Foods 2020, 9, 308. [Google Scholar] [CrossRef]
- Mari, A.; Parisouli, D.N.; Krokida, M. Exploring Osmotic Dehydration for Food Preservation: Methods, Modelling, and Modern Applications. Foods 2024, 13, 2783. [Google Scholar] [CrossRef]
- Ma, Y.; Yi, J.; Bi, J.; Wu, X.; Li, X.; Li, J.; Zhao, Y. Understanding of Osmotic Dehydration on Mass Transfer and Physical Properties of Freeze-Dried Apple Slices: A Comparative Study of Five Saccharides Osmotic Agents. J. Food Process. Preserv. 2022, 46, e16328. [Google Scholar] [CrossRef]
- Kowalska, H.; Trusinska, M.; Rybak, K.; Wiktor, A.; Witrowa-Rajchert, D.; Nowacka, M. Shaping the Properties of Osmo-Dehydrated Strawberries in Fruit Juice Concentrates. Appl. Sci. 2023, 13, 2728. [Google Scholar] [CrossRef]
- Salehi, F. Recent Advances in the Ultrasound-Assisted Osmotic Dehydration of Agricultural Products: A Review. Food Biosci. 2023, 51, 102307. [Google Scholar] [CrossRef]
- Nowacka, M.; Dadan, M.; Tylewicz, U. Current Applications of Ultrasound in Fruit and Vegetables Osmotic Dehydration Processes. Appl. Sci. 2021, 11, 1269. [Google Scholar] [CrossRef]
- Kaur, K.; Kalsi, B.S.; Zalpouri, R.; Potdar, P.P.; Sharma, S.R.; Alam, M.S.; Pandiselvam, R. Advancements in Thermal and Nonthermal Process-Assisted Osmotic Dehydration: A Comprehensive Review on Current Technologies for Enhancing the Quality of Foods. Qual. Assur. Saf. Crop. Foods 2025, 17, 319–340. [Google Scholar] [CrossRef]
- Shi, J.; Le Maguer, M. Osmotic Dehydration of Foods: Mass Transfer and Modeling Aspects. Food Rev. Int. 2002, 18, 305–335. [Google Scholar] [CrossRef]
- Lazarides, H.N.; Katsanidis, E.; Nickolaidis, A. Mass Transfer Kinetics during Osmotic Preconcentration Aiming at Minimal Solid Uptake. J. Food Eng. 1995, 25, 151–166. [Google Scholar] [CrossRef]
- Chiralt, A.; Talens, P. Physical and Chemical Changes Induced by Osmotic Dehydration in Plant Tissues. J. Food Eng. 2005, 67, 167–177. [Google Scholar] [CrossRef]
- Rahman, S. Handbook of Food Preservation, 2nd ed.; CRC Press: Boca Raton, FL, USA, 2007. [Google Scholar]
- Alshehhi, M.; Wu, G.; Kangsadan, T.; Chew, K.W.; Show, P.L. Ultrasound-Assisted Food Processing: A Mini Review of Mechanisms, Applications, and Challenges. In E3S Web of Conferences, Proceedings of the 2023 Research, Invention, and Innovation Congress, Online, 24–25 August 2023; EDP Sciences: Les Ulis, France, 2023; Volume 428, p. 02011. [Google Scholar] [CrossRef]
- Pobiega, K.; Matys, A.; Trusinska, M.; Rybak, K.; Witrowa-Rajchert, D.; Nowacka, M. The Effect of Ultrasound and Pulsed Electric Field on the Osmotic Dehydration Process of Strawberries. Appl. Sci. 2023, 13, 12335. [Google Scholar] [CrossRef]
- Ahmad, F.; Zaidi, S. The Influence of Ultrasound-Assisted Osmotic Dehydration as a Pre-Treatment Method on the Quality of Vacuum Dried Pineapple. Food Humanit. 2023, 1, 137–146. [Google Scholar] [CrossRef]
- Sharma, M.; Dash, K.K. Effect of Ultrasonic Vacuum Pretreatment on Mass Transfer Kinetics during Osmotic Dehydration of Black Jamun Fruit. Ultrason. Sonochem. 2019, 58, 104693. [Google Scholar] [CrossRef]
- Huang, Y.; Zhang, M.; Ju, R.; Law, C.L.; Fan, D.; Semenov, G.V.; Luo, Z. Effect of Ultrasound Assisted Vacuum Osmotic Dehydration on the Mass Transfer Kinetics and Qualities of Orange Slices. Dry. Technol. 2023, 41, 1636–1650. [Google Scholar] [CrossRef]
- Zongo, P.A.; Khalloufi, S.; Mikhaylin, S.; Ratti, C. Pulsed Electric Field and Freeze-Thawing Pretreatments for Sugar Uptake Modulation during Osmotic Dehydration of Mango. Foods 2022, 11, 2551. [Google Scholar] [CrossRef]
- Wiktor, A.; Chadzynska, M.; Rybak, K.; Dadan, M.; Witrowa-Rajchert, D.; Nowacka, M. The Influence of Polyols on the Process Kinetics and Bioactive Substance Content in Osmotic Dehydrated Organic Strawberries. Molecules 2022, 27, 1376. [Google Scholar] [CrossRef]
- Sethi, K.; Kaur, M. Effect of Osmotic Dehydration on Physicochemical Properties of Pineapple Using Honey, Sucrose and Honey-Sucrose Solutions. Int. J. Eng. Adv. Technol. 2019, 9, 6257–6262. [Google Scholar] [CrossRef]
- Mari, A.; Stergiopoulos, C.; Vasileiou, C.; Krokida, M. A Comprehensive Study on Osmotic Dehydration and Edible Coatings with Bioactive Compounds for Improving the Storage Stability of Fresh Berries. Processes 2025, 13, 2006. [Google Scholar] [CrossRef]
- Kowalska, H.; Marzec, A.; Domian, E.; Kowalska, J.; Ciurzyńska, A.; Galus, S. Edible Coatings as Osmotic Dehydration Pretreatment in Nutrient-Enhanced Fruit or Vegetable Snacks Development: A Review. Compr. Rev. Food Sci. Food Saf. 2021, 20, 5641–5674. [Google Scholar] [CrossRef]
- Dermesonlouoglou, E.; Pittas, L.; Taoukis, P.; Giannakourou, M. Osmodehydrofreezing of Tomatoes: Optimization of Osmotic Dehydration and Shelf Life Modeling. Foods 2024, 13, 2689. [Google Scholar] [CrossRef]
- Flores-Mendoza, L.C.; Calle-Berru, E.M.; Sanchez-Chero, M. IoT Implemented Osmotic Dehydrator. Curr. Res. Nutr. Food Sci. 2023, 11, 1204–1217. [Google Scholar] [CrossRef]
- Caldwell, D.G.; Davis, S.; Moreno Masey, R.J.; Gray, J.O. Automation in Food Processing. In Springer Handbook of Automation; Springer: Berlin/Heidelberg, Germany, 2009; pp. 1041–1059. [Google Scholar] [CrossRef]
- Rehg, J. Plcs in the New Automation Laboratory. In Proceedings of the 2002 Annual Conference, Montreal, QC, Canada, 16–19 June 2002; pp. 7.920.1–7.920.6. [Google Scholar] [CrossRef]
- Alimadani, R.; Adedeji, A.A.; Narimani, M. A Review of IoT Applications in Food Processing and Related Fields. J. Food Process. Preserv. 2025, 2025, 3064441. [Google Scholar] [CrossRef]
- Liberata Ullo, S.; Sinha, G.R.; Bacco, M.; Gotta, A.; Cassarà, P.; Agbinya, J.I. Advances in IoT and Smart Sensors for Remote Sensing and Agriculture Applications. Remote Sens. 2021, 13, 2585. [Google Scholar] [CrossRef]
- Caldwell, D.G. Automation in Food Manufacturing and Processing. In Springer Handbook of Automation; Springer: Cham, Switzerland, 2023; Volume Part F674, pp. 949–971. [Google Scholar] [CrossRef]
- Rahman, S.M.A.; Rezk, H.; Shaikh, B.; Abdelkareem, M.A.; Olabi, A.G.; Nassef, A.M. Prediction of Mass Transfer during Osmotically Treated Zucchini Fruit Product Using Advanced Fuzzy Inference System. Neural Comput. Appl. 2023, 35, 3125–3141. [Google Scholar] [CrossRef]
- Kumar Dash, K.; Sundarsingh, A.; BhagyaRaj, G.V.S.; Kumar Pandey, V.; Kovács, B.; Mukarram, S.A. Modelling of Ultrasonic Assisted Osmotic Dehydration of Cape Gooseberry Using Adaptive Neuro-Fuzzy Inference System (ANFIS). Ultrason. Sonochem. 2023, 96, 106425. [Google Scholar] [CrossRef]
- Nica, E.; Stehel, V. Internet of Things Sensing Networks, Artificial Intelligence-Based Decision-Making Algorithms, and Real-Time Process Monitoring in Sustainable Industry 4.0. J. Self-Gov. Manag. Econ. 2021, 9, 35–47. [Google Scholar]
- Alahmad, T.; Neményi, M.; Nyéki, A. Applying IoT Sensors and Big Data to Improve Precision Crop Production: A Review. Agronomy 2023, 13, 2603. [Google Scholar] [CrossRef]
- Dadhaneeya, H.; Nema, P.K.; Arora, V.K. Internet of Things in Food Processing and Its Potential in Industry 4.0 Era: A Review. Trends Food Sci. Technol. 2023, 139, 104109. [Google Scholar] [CrossRef]
- Mhetraskar, S.S.; Namekar, S.A.; Holmukhe, R.M.; Tamke, S.M. Industrial Automation Using PLC, HMI and Its Protocols Based on Real Time Data for Analysis. Int. J. Adv. Res. Eng. Technol. 2020, 11, 1353–1363. Available online: https://iaeme.com/Home/article_id/IJARET_11_10_129 (accessed on 16 April 2025).
- Jambrak, A.R.; Nutrizio, M.; Djekić, I.; Pleslić, S.; Chemat, F. Internet of Nonthermal Food Processing Technologies (IoNTP): Food Industry 4.0 and Sustainability. Appl. Sci. 2021, 11, 686. [Google Scholar] [CrossRef]
- Ahmed, I.; Qazi, I.M.; Jamal, S. Developments in Osmotic Dehydration Technique for the Preservation of Fruits and Vegetables. Innov. Food Sci. Emerg. Technol. 2016, 34, 29–43. [Google Scholar] [CrossRef]
- Muñiz-Becerá, S.; Méndez-Lagunas, L.L.; Rodríguez-Ramírez, J. Solute Transfer in Osmotic Dehydration of Vegetable Foods: A Review. J. Food Sci. 2017, 82, 2251–2259. [Google Scholar] [CrossRef]
- Jamil, A.A.; Tu, W.F.; Ali, S.W.; Terriche, Y.; Guerrero, J.M. Fractional-Order PID Controllers for Temperature Control: A Review. Energies 2022, 15, 3800. [Google Scholar] [CrossRef]
- Nair, R.; Mohan, K. Control of Temperature Using PID Controller. Int. J. Sci. Res. 2016, 5, 1203–1206. [Google Scholar] [CrossRef]
- Neville, M. Product Review | Tilt Wireless Hydrometer & Thermometer. Available online: https://brulosophy.com/2022/01/13/product-review-tilt-wireless-hydrometer-thermometer/?utm_source=chatgpt.com (accessed on 15 October 2025).
- Hawse, A. Tilt Hydrometer Overview & Out-of-Box (Part 1). Available online: https://iotexpert.com/tilt-hydrometer-overview-out-of-box-part-1?utm_source=chatgpt.com (accessed on 15 October 2025).
- TiltHydrometer. Tilt Float Hydrometer for Float Pods. Available online: https://tilthydrometer.com/products/copy-of-dealer-price-float-tank-hydrometer (accessed on 21 June 2025).
- Schlegel, B. Review: TILT Electric Hydrometer Tracking Specific Gravity over Time. Available online: https://bierbot.com/blog/hardware-reviews/tilt-electric-hydrometer-specific-gravity/ (accessed on 16 April 2025).
- Valdiviezo-Seminario, C.S.; Sánchez-Chero, M.J.; Flores-Mendoza, L.C. Effect of Osmotic Dehydration Pretreatment on Melon (Cucumis Melo) Drying Time. Curr. Res. Nutr. Food Sci. 2024, 12, 1421–1432. [Google Scholar] [CrossRef]
- Center for Food Safety and Applied Nutrition. FDA Guidance for Industry: Guide to Minimize Microbial Food Safety Hazards for Fresh Fruits and Vegetables; Center for Food Safety and Applied Nutrition: College Park, MD, USA, 1998.
- Bozkir, H.; Rayman Ergün, A.; Serdar, E.; Metin, G.; Baysal, T. Influence of Ultrasound and Osmotic Dehydration Pretreatments on Drying and Quality Properties of Persimmon Fruit. Ultrason. Sonochem. 2019, 54, 135–141. [Google Scholar] [CrossRef] [PubMed]
- Badui Dergal, S. Química de Los Alimentos, 5th ed.; Pearson Educaclón: Mexico City, México, 2013. [Google Scholar]
- Kilic, M.; Sahin, M.; Hassan, A.; Ullah, A. Preservation of Fruits through Drying—A Comprehensive Review of Experiments and Modeling Approaches. J. Food Process. Eng. 2024, 47, e14568. [Google Scholar] [CrossRef]
- Akpinar, E.K.; Bicer, Y.; Yildiz, C. Thin Layer Drying of Red Pepper. J. Food Eng. 2003, 59, 99–104. [Google Scholar] [CrossRef]
- Vega-Gálvez, A.; Notte-Cuello, E.; Lemus-Mondaca, R.; Zura, L.; Miranda, M. Mathematical Modelling of Mass Transfer during Rehydration Process of Aloe Vera (Aloe barbadensis Miller). Food Bioprod. Process. 2009, 87, 254–260. [Google Scholar] [CrossRef]
- Doymaz, I. Evaluation of Some Thin-Layer Drying Models of Persimmon Slices (Diospyros kaki L.). Energy Convers. Manag. 2012, 56, 199–205. [Google Scholar] [CrossRef]
- Doymaz, I. Drying Kinetics of White Mulberry. J. Food Eng. 2004, 61, 341–346. [Google Scholar] [CrossRef]
- Chandra, S.; Kumari, D. Recent Development in Osmotic Dehydration of Fruit and Vegetables: A Review. Crit. Rev. Food Sci. Nutr. 2015, 55, 552–561. [Google Scholar] [CrossRef]
- Anil, A.; Jadhav, H.B.; Shewale, S.R.; Annapure, U.S. Osmo Hydrocolloid Assisted Dehydration of Onion Slices: Effect on Bioactive Components, Rehydration, Microstructure. Meas. Food 2024, 16, 100207. [Google Scholar] [CrossRef]
- Wang, X.; Feng, H.; Wang, X.; Feng, H. Investigating the Role Played by Osmotic Pressure Difference in Osmotic Dehydration: Interactions between Apple Slices and Binary and Multi-Component Osmotic Systems. Foods 2023, 12, 3179. [Google Scholar] [CrossRef]
- Mourtzis, D.; Angelopoulos, J.; Panopoulos, N. The Future of the Human–Machine Interface (HMI) in Society 5.0. Future Internet 2023, 15, 162. [Google Scholar] [CrossRef]
- Kucner, A.; Papiewska, A.; Klewicki, R.; Sójka, M.; Klewicka, E. Influence of Thermal Treatment on the Stability of Phenolic Compounds and the Microbiological Quality of Sucrose Solution Following Osmotic Dehydration of Highbush Blueberry Fruits. Acta Sci. Pol. Technol. Aliment. 2014, 13, 79–88. [Google Scholar] [CrossRef]
- Haneef, N.; Hanif, N.; Hanif, T.; Raghavan, V.; Garièpy, Y.; Wang, J. Food Fortification Potential of Osmotic Dehydration and the Impact of Osmo-Combined Techniques on Bioactive Component Saturation in Fruits and Vegetables. Braz. J. Food Technol. 2024, 27, e2023028. [Google Scholar] [CrossRef]
- Qubasi, M.; Shekib, L.; El-Shimy, N.M.; Mousa, H. Effect of Osmotic-Air Dehydration on Drying Kinetics and Microstructure of Apple Slices and Cubes. J. Food Dairy Sci. 2015, 6, 405–418. [Google Scholar] [CrossRef]
- Koondhar, M.A.; Kaloi, G.S.; Junejo, A.K.; Soomro, A.H.; Chandio, S.; Ali, M. The Role of PLC in Automation, Industry and Education Purpose: A Review. Pak. J. Eng. Technol. Sci. 2023, 11, 22–31. [Google Scholar] [CrossRef]
- Chang, W.; Xie, J.; Wang, J.; Teng, W.; Sun, Y.; Zheng, M. Application of PLC and HMI in the Measurement and Control Platform of Single-Tube Heat Transfer Experiment Rig. Adv. Mech. Eng. 2020, 12, 1–14. [Google Scholar] [CrossRef]
- Ardi, S.; Febriansyah, M.B.; Hidayat, M.; Fairus, S.; Suprapto, H. Modification of Control System Using PLC and HMI on Drill Oil Hole Machine to Speed up Piston Model Replacement Process Time in Automotive Manufacturing Industry. J. Pendidik. Teknol. Dan. Kejuru. 2025, 31, 1–14. Available online: https://jurnal.uny.ac.id/index.php/jptk/article/view/78878 (accessed on 16 April 2025).
- Harwell, R. Integrated HMI and PLC. Intech Ind. Comput. 2012, 59, 12. [Google Scholar]
- Bagawathi, R.; Sharmie, V.; Anuraga, J.; Anusuya Devi, G.; Jaanu, A.S.N.; Rajamani, M.P.E. Monitoring RO Plant Using Virtual HMI and PLC with Visual Programming Tool. In Proceedings of the 3rd International Conference on Electronics and Sustainable Communication Systems, ICESC 2022—Proceedings, Coimbatore, India, 17–19 August 2022; pp. 199–205. [Google Scholar] [CrossRef]
- International Electrotechnical Commission. IEC 60751: Industrial Platinum Resistance Thermometers and Platinum Temperature Sensors, 3rd ed.; International Electrotechnical Commission: Geneva, Switzerland, 2022. [Google Scholar]
- Rivas Pellicer, M.; Tungekar, M.Y.; Carpitella, S. Where to Place Monitoring Sensors for Improving Complex Manufacturing Systems? Discussing a Real Case in the Food Industry. Sensors 2023, 23, 3768. [Google Scholar] [CrossRef]
- Watson, N.J.; Bowler, A.L.; Rady, A.; Fisher, O.J.; Simeone, A.; Escrig, J.; Woolley, E.; Adedeji, A.A. Intelligent Sensors for Sustainable Food and Drink Manufacturing. Front. Sustain. Food Syst. 2021, 5, 642786. [Google Scholar] [CrossRef]
- Jaywant, S.A.; Singh, H.; Arif, K.M. Sensors and Instruments for Brix Measurement: A Review. Sensors 2022, 22, 2290. [Google Scholar] [CrossRef]
- Kaučić, L.; Kovačević, I.; Aleksi, I.; Keser, T.; Zidar, J.; Rimac-Drlje, S. A Low-Cost Buoyant Force Measurement Device for Monitoring Sugar Concentration in Water Solution. In Proceedings of the International Conference on Electrical, Computer, Communications and Mechatronics Engineering, ICECCME 2023, Tenerife, Spain, 19–21 July 2023. [Google Scholar] [CrossRef]
- Konur, S.; Lan, Y.; Thakker, D.; Morkyani, G.; Polovina, N.; Sharp, J. Towards Design and Implementation of Industry 4.0 for Food Manufacturing. Neural Comput. Appl. 2023, 35, 23753–23765. [Google Scholar] [CrossRef]
- Kesharia, A.; More, P.; Adeshra, K.; Sutar, R. Cost Effective Food Quality Monitoring Using PLC: An Optimized Approach. In Proceedings of the 2018 International Conference on Recent Innovations in Electrical, Electronics and Communication Engineering, ICRIEECE 2018, Bhubaneswar, India, 27–28 July 2018; pp. 1026–1031. [Google Scholar] [CrossRef]
- Pavon-Vargas, D.J.; Alfonsi, V.; Georgé, S.; Gozzi, M.; Rainieri, S.; Cattani, L. Validation of Ohmic Heating Pilot Plant for Vitamin C Retention and E. Coli Surrogate Inactivation on Strawberry Nectar. Int. J. Food Sci. 2025, 2025, 2464512. [Google Scholar] [CrossRef]
- Zhang, M. Pilot-Scale Studies, Scaling-Up, and Technology Transfer. In Iron Ores Bioprocessing; Springer: Cham, Switzerland, 2023; pp. 161–167. [Google Scholar] [CrossRef]
- Devic, E.; Guyot, S.; Daudin, J.D.; Bonazzi, C. Effect of Temperature and Cultivar on Polyphenol Retention and Mass Transfer during Osmotic Dehydration of Apples. J. Agric. Food Chem. 2010, 58, 606–614. [Google Scholar] [CrossRef] [PubMed]
- Vieira, G.S.; Pereira, L.M.; Hubinger, M.D. Optimisation of Osmotic Dehydration Process of Guavas by Response Surface Methodology and Desirability Function. Int. J. Food Sci. Technol. 2012, 47, 132–140. [Google Scholar] [CrossRef]
- Zongo, A.P.; Khalloufi, S.; Ratti, C. Effect of Viscosity and Rheological Behavior on Selective Mass Transfer during Osmotic Dehydration of Mango Slices in Natural Syrups. J. Food Process. Eng. 2021, 44, e13745. [Google Scholar] [CrossRef]
- Filho, R.d.S.F.; de. Gusmão, R.P.; da Silva, W.P.; Gomes, J.P.; Filho, E.V.C.; El-Aouar, Â.A. Osmotic Dehydration of Pineapple Stems in Hypertonic Sucrose Solutions. Agric. Sci. 2015, 06, 916–924. [Google Scholar] [CrossRef]
- Zhao, J.H.; Ding, Y.; Yuan, Y.J.; Xiao, H.W.; Zhou, C.L.; Tan, M.L.; Tang, X.M. Effect of Osmotic Dehydration on Desorption Isotherms and Glass Transition Temperatures of Mango. Int. J. Food Sci. Technol. 2018, 53, 2602–2609. [Google Scholar] [CrossRef]
- Zongo, A.P.; Khalloufi, S.; Ratti, C. Sugar Profiles Modulation of Mangoes during Osmotic Dehydration in Agave Syrup Solutions. J. Food Sci. 2023, 88, 228–243. [Google Scholar] [CrossRef] [PubMed]
- Barrera, C.; Betoret, N.; Seguí, L. Potential of Vacuum Impregnation and Osmotic Dehydration Techniques in Producing Jaggery-Fortified Apple Snacks. Sustain. Food Technol. 2024, 2, 1041–1051. [Google Scholar] [CrossRef]
- Aguirre-García, M.; Cortés-Zavaleta, O.; Ruiz-Espinosa, H.; Ochoa-Velasco, C.E.; Ruiz-López, I.I. The Role of Coupled Water and Solute Diffusion and Product Shrinkage during Osmotic Dehydration. J. Food Eng. 2022, 331, 111121. [Google Scholar] [CrossRef]
- do Carmo, J.R.; Corrêa, J.L.G.; Resende, M.; Cirillo, M.Â.; Corona-Jiménez, E.; Telis-Romero, J. Mango Enriched with Sucrose and Isomaltulose (Palatinose®) by Osmotic Dehydration: Effect of Temperature and Solute Concentration through the Application of Multilevel Statistical Models. J. Food Process. Preserv. 2022, 46, e17147. [Google Scholar] [CrossRef]
- Azoubel, P.M.; Da Silva, F.O. Optimisation of Osmotic Dehydration of ‘Tommy Atkins’ Mango Fruit. Int. J. Food Sci. Technol. 2008, 43, 1276–1280. [Google Scholar] [CrossRef]
- Galdino, P.O.; Queiroz, A.J.d.M.; de Figueirêdo, R.M.F.; Santiago, Â.M.; Galdino, P.O. Production and Sensory Evaluation of Dried Mango. Rev. Bras. Eng. Agrícola E Ambient. 2021, 25, 44–50. [Google Scholar] [CrossRef]
- Mundada, M.; Singh, B.; Maske, S. Optimisation of Processing Variables Affecting the Osmotic Dehydration of Pomegranate Arils. Int. J. Food Sci. Technol. 2010, 45, 1732–1738. [Google Scholar] [CrossRef]
- Assis, F.R.; Morais, R.M.S.C.; Morais, A.M.M.B. Mathematical Modelling of Osmotic Dehydration Kinetics of Apple Cubes. J. Food Process. Preserv. 2017, 41, e12895. [Google Scholar] [CrossRef]
- Bhagya Raj, G.V.S.; Dash, K.K. Ultrasound Assisted Osmotic Dehydration of Dragon Fruit Slices: Modeling and Optimization Using Integrated Artificial Neural Networks and Genetic Algorithms. J. Food Process. Preserv. 2022, 46, e16993. [Google Scholar] [CrossRef]
- Ayala-Aponte, A.A.; Molina-Cortés, A.; Serna-Cock, L.; Ayala-Aponte, A.A.; Molina-Cortés, A.; Serna-Cock, L. Osmotic Dehydration of Green Mango Samples (Mangifera indica L., Filipino Var.) in Ternary Solutions. Vitae 2018, 25, 8–16. Available online: https://revistas.udea.edu.co/index.php/vitae/article/view/325276 (accessed on 16 April 2025). [CrossRef]
- Alakali, J.S.; Ariahu, C.C.; Nkpa, N.N. Kinetics of Osmotic Dehydration of Mango. J. Food Process. Preserv. 2006, 30, 597–607. [Google Scholar] [CrossRef]
- Süfer, Ö.; Sezer, S.; Demir, H. Thin Layer Mathematical Modeling of Convective, Vacuum and Microwave Drying of Intact and Brined Onion Slices. J. Food Process. Preserv. 2017, 41, e13239. [Google Scholar] [CrossRef]
- Xia, D.; Jiang, L.; Cheng, J.; Hou, X.; Li, S.; Luo, Q.; Shen, G.; Wu, H.; Chen, A.; Zhang, Z. Influence of Drying Methods on Quality of Zanthoxylum Armatum DC. and Mathematical Modelling of the Drying Kinetics. In E3S Web of Conferences, Proceedings of the 2021 International Conference on Environmental Engineering, Agricultural Pollution and Hydraulical Studies, Wuhan, China, 29–30 May 2021; EDP Sciences: Les Ulis, France, 2021; Volume 269. [Google Scholar] [CrossRef]
- Topuz, F.C. Examination of Rehydration Ratio, Color Properties and Drying Kinetics of Microwave Dried Garlic (Allium sativum L.). NOHU J. Eng. Sci. 2022, 11, 642–646. [Google Scholar] [CrossRef]
- Furtado, T.D.R.; Muniz, J.A.; Silva, E.M.; Frühauf, A.C.; Fernandes, T.J. Natural Convection Drying Kinetics of ‘Prata’ and ‘D’Água’ Banana Cultivars (Musa ssp) by Nonlinear Regression Models. Rev. Bras. Frutic. 2019, 41, e426. [Google Scholar] [CrossRef]
- Akowuah, J.O.; Bart-Plange, A.; Dzisi, K.A. Thin Layer Mathematical Modelling of White Maize in a Mobile Solar-Biomass Hybrid Dryer. Res. Agric. Eng. 2021, 67, 74–83. [Google Scholar] [CrossRef]
- de Moraes, M.S.; de Melo Queiroz, A.J.; de Figueirêdo, R.M.F.; de Matos, J.D.P.; da Silva, L.P.F.R.; do Nascimento Silva, S.; Vieira, A.F. Germinated Seeds of Three Cucurbita Varieties: Physical Characteristics, Minerals Profile, and Drying Behavior. J. Food Process. Eng. 2021, 44, e13865. [Google Scholar] [CrossRef]
Disclaimer/Publisher’s Note: The statements, opinions and data contained in all publications are solely those of the individual author(s) and contributor(s) and not of MDPI and/or the editor(s). MDPI and/or the editor(s) disclaim responsibility for any injury to people or property resulting from any ideas, methods, instructions or products referred to in the content. |
© 2025 by the authors. Licensee MDPI, Basel, Switzerland. This article is an open access article distributed under the terms and conditions of the Creative Commons Attribution (CC BY) license (https://creativecommons.org/licenses/by/4.0/).