Article

Toward Autonomous Pavement Inspection: An End-to-End Vision-Based Framework for PCI Computation and Robotic Deployment

1
Civil Engineering Department, The British University in Egypt, El Sherouk City 11837, Egypt
2
Construction and Building Engineering, Arab Academy for Science, Technology, and Maritime Transport—Sheraton Heliopolis, Cairo 11799, Egypt
*
Author to whom correspondence should be addressed.
Automation 2025, 6(4), 67; https://doi.org/10.3390/automation6040067
Submission received: 4 August 2025 / Revised: 10 September 2025 / Accepted: 22 October 2025 / Published: 4 November 2025
(This article belongs to the Section Robotics and Autonomous Systems)

Abstract

Advancements in robotics and computer vision are transforming how infrastructure is monitored and maintained. This paper presents a novel, fully automated pipeline for pavement condition assessment that integrates real-time image analysis with PCI (Pavement Condition Index) computation, which is specifically designed for deployment on mobile and robotic platforms. Unlike traditional methods that rely on costly equipment or manual input, the proposed system uses deep learning-based object detection and ensemble segmentation to identify and measure multiple types of road distress directly from 2D imagery, including surface weathering, a key precursor to pothole formation often overlooked in previous studies. Depth estimation is achieved using a monocular diffusion model, enabling volumetric assessment without specialized sensors. Validated on real-world footage captured by a smartphone, the pipeline demonstrated reliable performance across detection, measurement, and scoring stages. Its potential hardware-agnostic design and modular architecture position it as a practical solution for autonomous inspection by drones or ground robots in future smart infrastructure systems.

1. Introduction

Roads are a cornerstone of economic development, facilitating local and regional growth by enabling commerce and trade [1,2]. To ensure the continued functionality and longevity of these vital assets, regular pavement condition assessment is essential [3]. Traditionally, pavement condition assessment, such as the pavement condition index (PCI), has been conducted manually. This process involves visually inspecting the pavement, classifying distresses, measuring their severity, and applying indices to compute the PCI for the road segment under review [4]. However, manual pavement inspection is subject to several significant challenges that hinder its effectiveness and efficiency. These include subjectivity and inconsistencies in evaluations [5,6,7,8], the time-consuming and labor-intensive nature of the work [6,7,8,9], safety concerns for inspectors working near traffic [7,8,10], the high costs associated with manual inspections [8,9,11], and the disruption to traffic flow during inspections [8].
Given these limitations, there is a growing demand for fully automated, scalable, and objective methods for pavement condition evaluation. Recent advances in computer vision and robotics have opened new avenues for non-invasive pavement inspection, offering the potential to utilize drones or ground robots equipped with AI models. While several existing approaches focus on classification or segmentation, many fail to integrate these processes into a cohesive PCI computation pipeline [12,13,14,15,16]. Others have shown promising results in accurately predicting PCI [4] or alternative indices like ASPDI [17,18].
This paper presents a fully automated framework for pavement condition assessment, which eliminates the need for manual processing. The proposed system integrates classification, segmentation, and geometric quantification into a unified PCI computation pipeline, as illustrated in Figure 1. Although the current implementation uses smartphone-captured images for evaluation, the system is designed with flexibility in mind, enabling potential deployment on a various hardware platforms, including drones and robotic systems. This adaptability suggests that the pipeline could extend its functionality beyond smartphones, accommodating a broad range of mobile or robotic devices for diverse inspection scenarios.

Research Goal and Objectives

The goal of this paper is to present a fully automated PCI computation without any human interference. The system includes key innovations such as (1) an auto-calibration method that converts pixel measurements to real-world units without manual input; (2) a monocular depth estimation model that accurately measures the depth of distresses such as cracks and potholes using only 2D images; (3) an ensemble segmentation approach capable of detecting and quantifying early-stage weathering and raveling, including area and diameter measurements; and (4) a proof-of-concept evaluation method using real-world footage captured by a smartphone, demonstrating the pipeline’s performance under practical field conditions. These components together deliver a hardware-independent, scalable, and standards-compliant solution for autonomous pavement assessment.

2. Literature Review

2.1. Object Detection in Pavement Inspection

In recent years, the YOLO (You Only Look Once) family of models has dominated the object detection landscape, gaining recognition for their real-time inference capabilities and high detection accuracy [19]. These advantages have led to widespread adoption in pavement distress detection. Enhanced YOLO variants—such as YOLO integrated with Omni-Scale Networks (OSNets) for improved multi-scale feature extraction [20]. With attention mechanisms like the Convolutional Block Attention Module (CBAM) for enhanced localization [21], YOLO variants have shown promising results. YOLOv5 remains the most frequently applied version in pavement inspection [22,23,24,25,26], while newer models such as YOLOv8 offer enhanced robustness and accuracy [27,28,29,30]. A limited but growing number of studies have begun exploring YOLOv11 for distress detection [31,32,33], reflecting its emerging potential in this domain.

2.2. Quantitative Distress Measurement Techniques

To quantitatively assess distress, various methods have been proposed. Crack length and width are often measured using multi-angle imaging or classical edge detection techniques [34,35]. More advanced strategies such as skeletonization have been employed for medial axis extraction, facilitating precise length and width calculations [36,37]. For depth estimation, studies have employed various technological approaches, including stereo vision, LiDAR, RGB-D cameras, and ultrasonic sensors [23,38,39]. These tools produce disparity maps or point clouds from which depth and volume can be computed using geometric algorithms such as convex hull fitting. However, no existing studies have demonstrated accurate depth estimation from a single 2D image, making these methods impractical for lightweight, low-cost, or mobile robotic deployments. This gap highlights an important innovation opportunity for systems capable of inferring relative depth or surface severity using monocular vision alone.

2.3. PCI Computation Pipelines

Several studies have proposed semi-automated PCI pipelines by combining visual detection with rule-based scoring frameworks [40,41,42]. However, many of these approaches rely on simplified mappings, predefined thresholds, or expert calibration, limiting scalability and consistency. While some deep learning pipelines have achieved high accuracy in distress quantification and PCI approximations such as the work by [37], which reported 95.7% accuracy using skeleton-based crack measurements, their scope remains narrow, often excluding less prominent but critical distresses. More recent end-to-end frameworks, such as those by Ibragimov et al. [37] and Cano-Ortiz et al. [17], further advance automated assessment by integrating detection and PCI or related indices. Ibragimov et al. [37] present a crack-focused pipeline using DeepLabV3+ and skeletonization, achieving high accuracy but remaining limited to cracking without addressing volumetric assessment or diverse distress types. Cano-Ortiz et al. [17], on the other hand, broaden the scope by introducing the ASPDI index and incorporating photogrammetry-based 3D reconstruction for volumetric pothole analysis; however, their approach requires overlapping imagery and specific capture protocols, making it less adaptable to lightweight or real-time robotic deployment.

3. Research Gap and Novelty

Existing pavement condition assessment models often fail to capture a comprehensive set of distresses, typically focusing on common types like cracking and potholes while neglecting subtle indicators like weathering. Despite its importance as an early sign of pavement degradation, weathering is often excluded, limiting the effectiveness of current models in proactive maintenance. Moreover, many end-to-end PCI calculation models either omit specific distress types or rely on modified PCI scoring methods that do not fully account for all distresses. This study presents a fully integrated pipeline that simultaneously classifies and quantifies 12 distress types, from common issues like cracking to subtle ones like weathering, while directly calculating PCI values. Unlike existing models, which often treat distresses separately or use modified indices, this approach provides a cohesive and comprehensive solution for pavement condition assessment. Additionally, the system incorporates monocular depth estimation using only 2D smartphone images, eliminating the need for specialized hardware such as LiDAR or stereo cameras. This allows for cost-effective and scalable real-time pavement inspections, making the system more accessible and suitable for widespread deployment.

4. Methodology

This study proposes a fully automated image-based pavement assessment system designed for integration with robotic platforms such as drones or ground vehicles. The modular pipeline is separated into two levels: frame-level and segment level.

4.1. Data Acquisition and Preparation

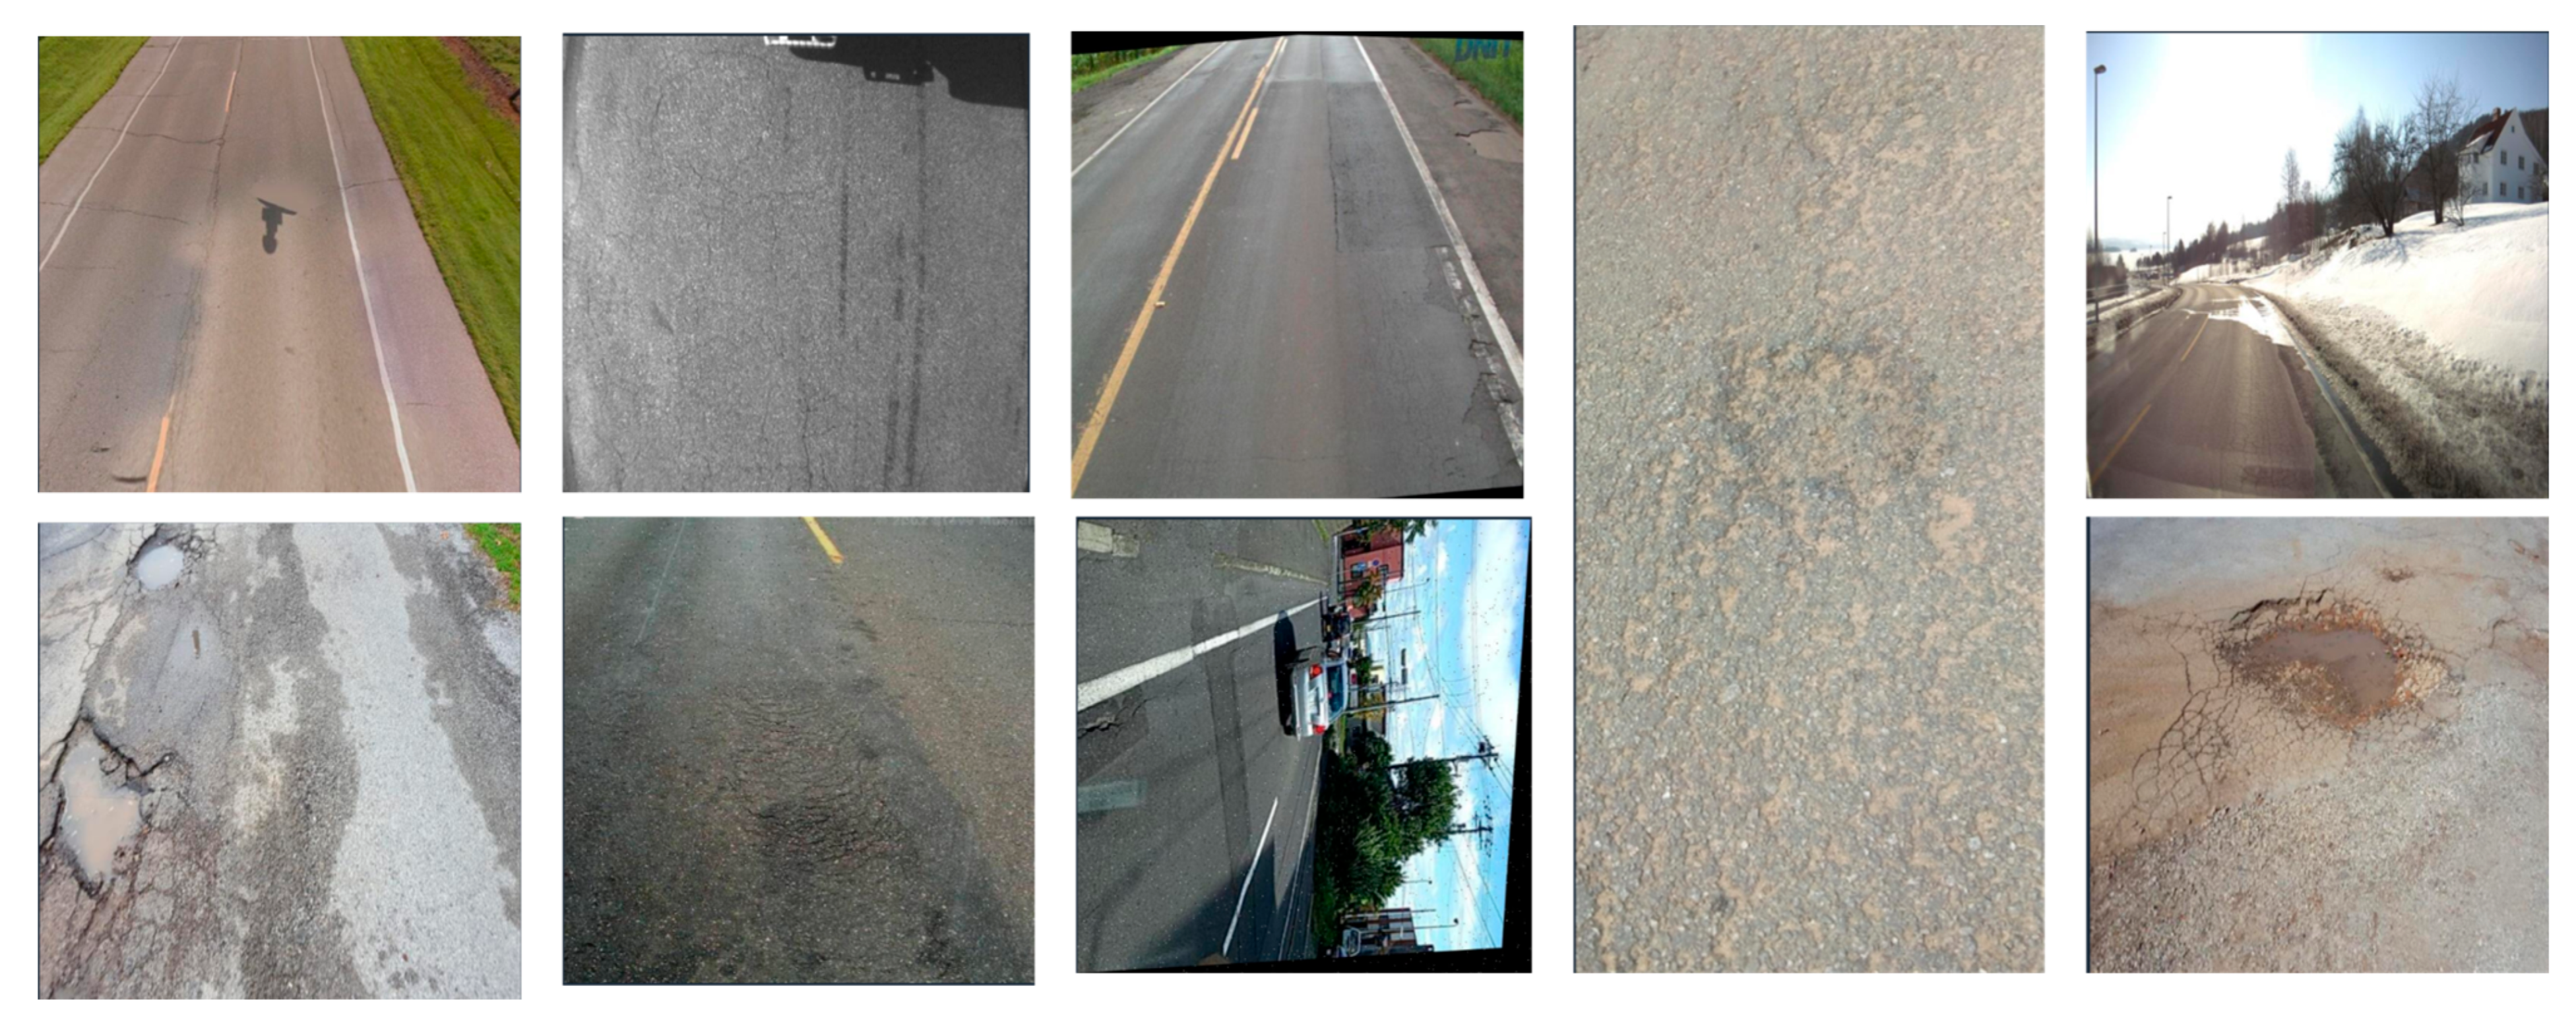
An extensive dataset comprising 70,000 images was assembled from 26 publicly available sources hosted on Roboflow. These images were selected to ensure broad coverage of distress types relevant to Egyptian pavement conditions. To enhance generalizability, the dataset was curated to include variations in environmental conditions such as lighting, shadows, water pooling, and oil stains, as well as multiple viewpoints (e.g., top-down and wide-angle perspectives), as shown in Figure 2. Figure 3 provides a visual representation of the diverse conditions present in the dataset, including examples of different road surfaces, distress types, and environmental factors.
Following data acquisition, a rigorous cleaning and relabeling process was conducted to ensure consistency and eliminate irrelevant elements such as traffic signs, lighting infrastructure, speed bumps, and manholes. A custom Python 3.9 script was used to standardize class labels across all datasets, after which the data were imported into Roboflow for bounding box refinement and verification of proper distress localization. To enhance model performance and maintain consistency in measurement, visually or functionally similar distresses—such as block and alligator cracking, or longitudinal and transverse cracking—were consolidated into unified classes, as their densities are computed using the same metrics. All included distresses were quantitatively measurable (by length, width, area, or depth), while qualitative indicators were excluded to minimize subjectivity and improve reproducibility.

4.2. Frame Extraction

The input to the system is expected to be a video, as shown in Figure 3, from which individual frames are extracted for further analysis. The frame extraction process is designed to optimize the capture of relevant pavement distress features, accounting for key parameters such as vehicle speed, camera height, and overlapping between consecutive frames. The vehicle’s speed directly influences the capture rate, ensuring that frames are extracted at intervals that correspond to the movement of the vehicle. The camera height is also a critical parameter, as it is factored into the calibration process described in Section 4.5, ensuring that the distress regions can be accurately scaled from pixels to centimeters.
To address the potential issue of duplicate distress detection across overlapping frames, a tracking and merging algorithm is employed. This algorithm tracks distress regions across consecutive frames by analyzing their spatial continuity and geometric properties. When overlapping distress regions are detected, they are merged based on a predefined overlap threshold defined by the user. This ensures that each distress is counted only once, preventing double-counting and ensuring that the resulting Pavement Condition Index (PCI) computation is accurate and reliable.

4.3. Pavement Distress Classification

Distress classification was conducted using YOLOv11, a one-stage object detection model optimized for real-time performance as shown in the pipeline Figure 4. Yolov11 was selected for this application due to its enhanced feature extraction capabilities, which are critical for accurately localizing and classifying the heterogeneous and often low-contrast morphologies of pavement distresses such as fine cracking and surface weathering [63]. Furthermore, its next-generation re-parameterized architecture achieves a superior trade-off between mean Average Precision (mAP) and computational latency compared to prior versions [64]. This specific attribute is indispensable for ensuring robust detection performance under the variable lighting and surface conditions encountered in real-world pavement inspection, while simultaneously meeting the stringent efficiency requirements for onboard processing on autonomous robotic platforms. The model was trained to identify multiple pavement distresses using bounding box annotations. To further enhance model generalization, mosaic data augmentation was implemented, combining multiple training samples into a single image. YOLOv11 was fine-tuned using Roboflow’s model training pipeline, achieving accurate detection performance across all 12 targeted distress types. The model’s lightweight structure and fast inference capability render it suitable for onboard deployment in robotic platforms operating under resource constraints.

4.4. Ensemble Segmentation of Distress Regions

To delineate the spatial extent of detected distresses, a multi-model segmentation framework was introduced. Three segmentation models were selected: two instance segmentation networks pretrained on ImageNet, and a third model based on Roboflow 3.0’s semantic segmentation framework. Each model exhibited strengths in capturing specific distress patterns, linear cracks, irregular deformations, and interconnected cracking geometries, respectively.
An ensemble strategy using soft voting was adopted to combine the outputs from all three models. This method computes a pixel-level consensus based on each model’s confidence scores, applying a dynamic thresholding mechanism that retains low-confidence yet contextually relevant predictions.

4.5. Quantitative Measurement and Severity Classification

For linear distresses, skeletonization was employed to extract the medial axis from the segmentation masks, allowing for accurate measurement of both crack length and width. Crack width was derived by calculating orthogonal distances from the skeleton to the boundary edges. In parallel, an alternative method for crack width measurement was tested using point-to-point edge detection, which identifies the maximum distance between the farthest points along the edges of the crack within the segmentation mask. This method provides an estimate of the maximum width, and although both methods produced similar results, skeletonization was ultimately chosen as the preferred method due to its robustness in handling irregularly shaped cracks. For irregular or circular distresses such as potholes or slippage, we used contour analysis and ellipse fitting techniques. Contour analysis is used for irregularly shaped distresses where the boundary is not perfectly round such as weathering, as it traces the outline of the distress and analyzes its shape. On the other hand, ellipse fitting is applied to circular or near-circular distresses, such as potholes or slippage, to estimate equivalent diameters by fitting an ellipse to the distress shape.
As for the depth, a parameter critical to assessing distresses like rutting and potholes, a monocular depth estimation model known as Marigold was applied. This diffusion-based model estimates three-dimensional surface profiles from single 2D images by propagating depth information based on intensity gradients. The model analyzes pixel intensity variations; darker for depressions and lighter for elevated areas and applies a diffusion process to generate a continuous depth map, inferring vertical displacement without the need for stereo vision or LiDAR. Additionally, the model maps the location of the maximum depth, identifying the point with the greatest vertical displacement, which is crucial for quantifying the severity of distress.
The pixel-based measurements obtained from the images were converted into metric units using a calibration protocol involving a known reference square (1 cm × 1 cm) overlaid on the images in AutoCAD 2023. This process ensures the precise mapping of pixel dimensions to real-world measurements. The calibration was further refined using a two-stage correction mechanism, wherein real-world test images, captured at varying camera heights, were utilized to account for perspective distortions and height-related scaling effects.
To establish the correction factor, the number of pixels corresponding to the 1 cm × 1 cm reference square was measured. The calibration factor was then computed by dividing the actual physical dimension (1 cm) by the pixel measurement, yielding the calibration factor in terms of cm per pixel. This calibration relationship was modeled using a second-degree polynomial, the general form of which is expressed as
C(h) = max(1, a⋅h2 + b⋅h + c)
where
  • C(h) represents the calibration factor for a given camera height h;
  • a, b, and c are the coefficients determined through the curve-fitting process;
  • h denotes the camera height in centimeters.
The system employs this calibration equation to dynamically adjust pixel-based measurements based on the camera’s height, ensuring that measurements are accurately scaled regardless of the altitude from which the images were captured. This ensures dimensional consistency which is crucial for the accurate quantification of pavement distresses.

4.6. Digitalizing the Deduct Curves

The Pavement Condition Index was computed in accordance with ASTM D6433 [65] specifications. Deduction values are based on distress type, severity, and densities were extracted from officially published deduction curves, which were digitized using a plot digitizer tool. Each curve was segmented and fitted with best-fit equations (linear, polynomial, or exponential), depending on curve complexity. These equations formed a computational library for real-time deduction value lookup.
Distress densities were computed using one of three approaches, area-based, length-based, or count-based, depending on the nature of the defect. Each raw measurement was normalized by dividing by the area of the analysis segment to ensure comparability. The resulting densities were input into the appropriate regression equations to retrieve deduction values.

4.7. Segment-Level PCI Aggregation and Maintenance Mapping

Frame-level deductions were aggregated to form a segment-level corrected deduction value using curve-based adjustment factors outlined in the ASTM D6433 code. The final PCI for each segment was calculated using the standard formulation:
PCI = 100 − CDV
Each PCI score was then mapped to a maintenance action category, supporting automated, data-driven decision-making for infrastructure management. This scoring system facilitates scalable, repeatable assessments of pavement networks with no human intervention required, making it well-suited for integration into robotic road inspection workflows.

5. Results and Discussion

5.1. Model Performance

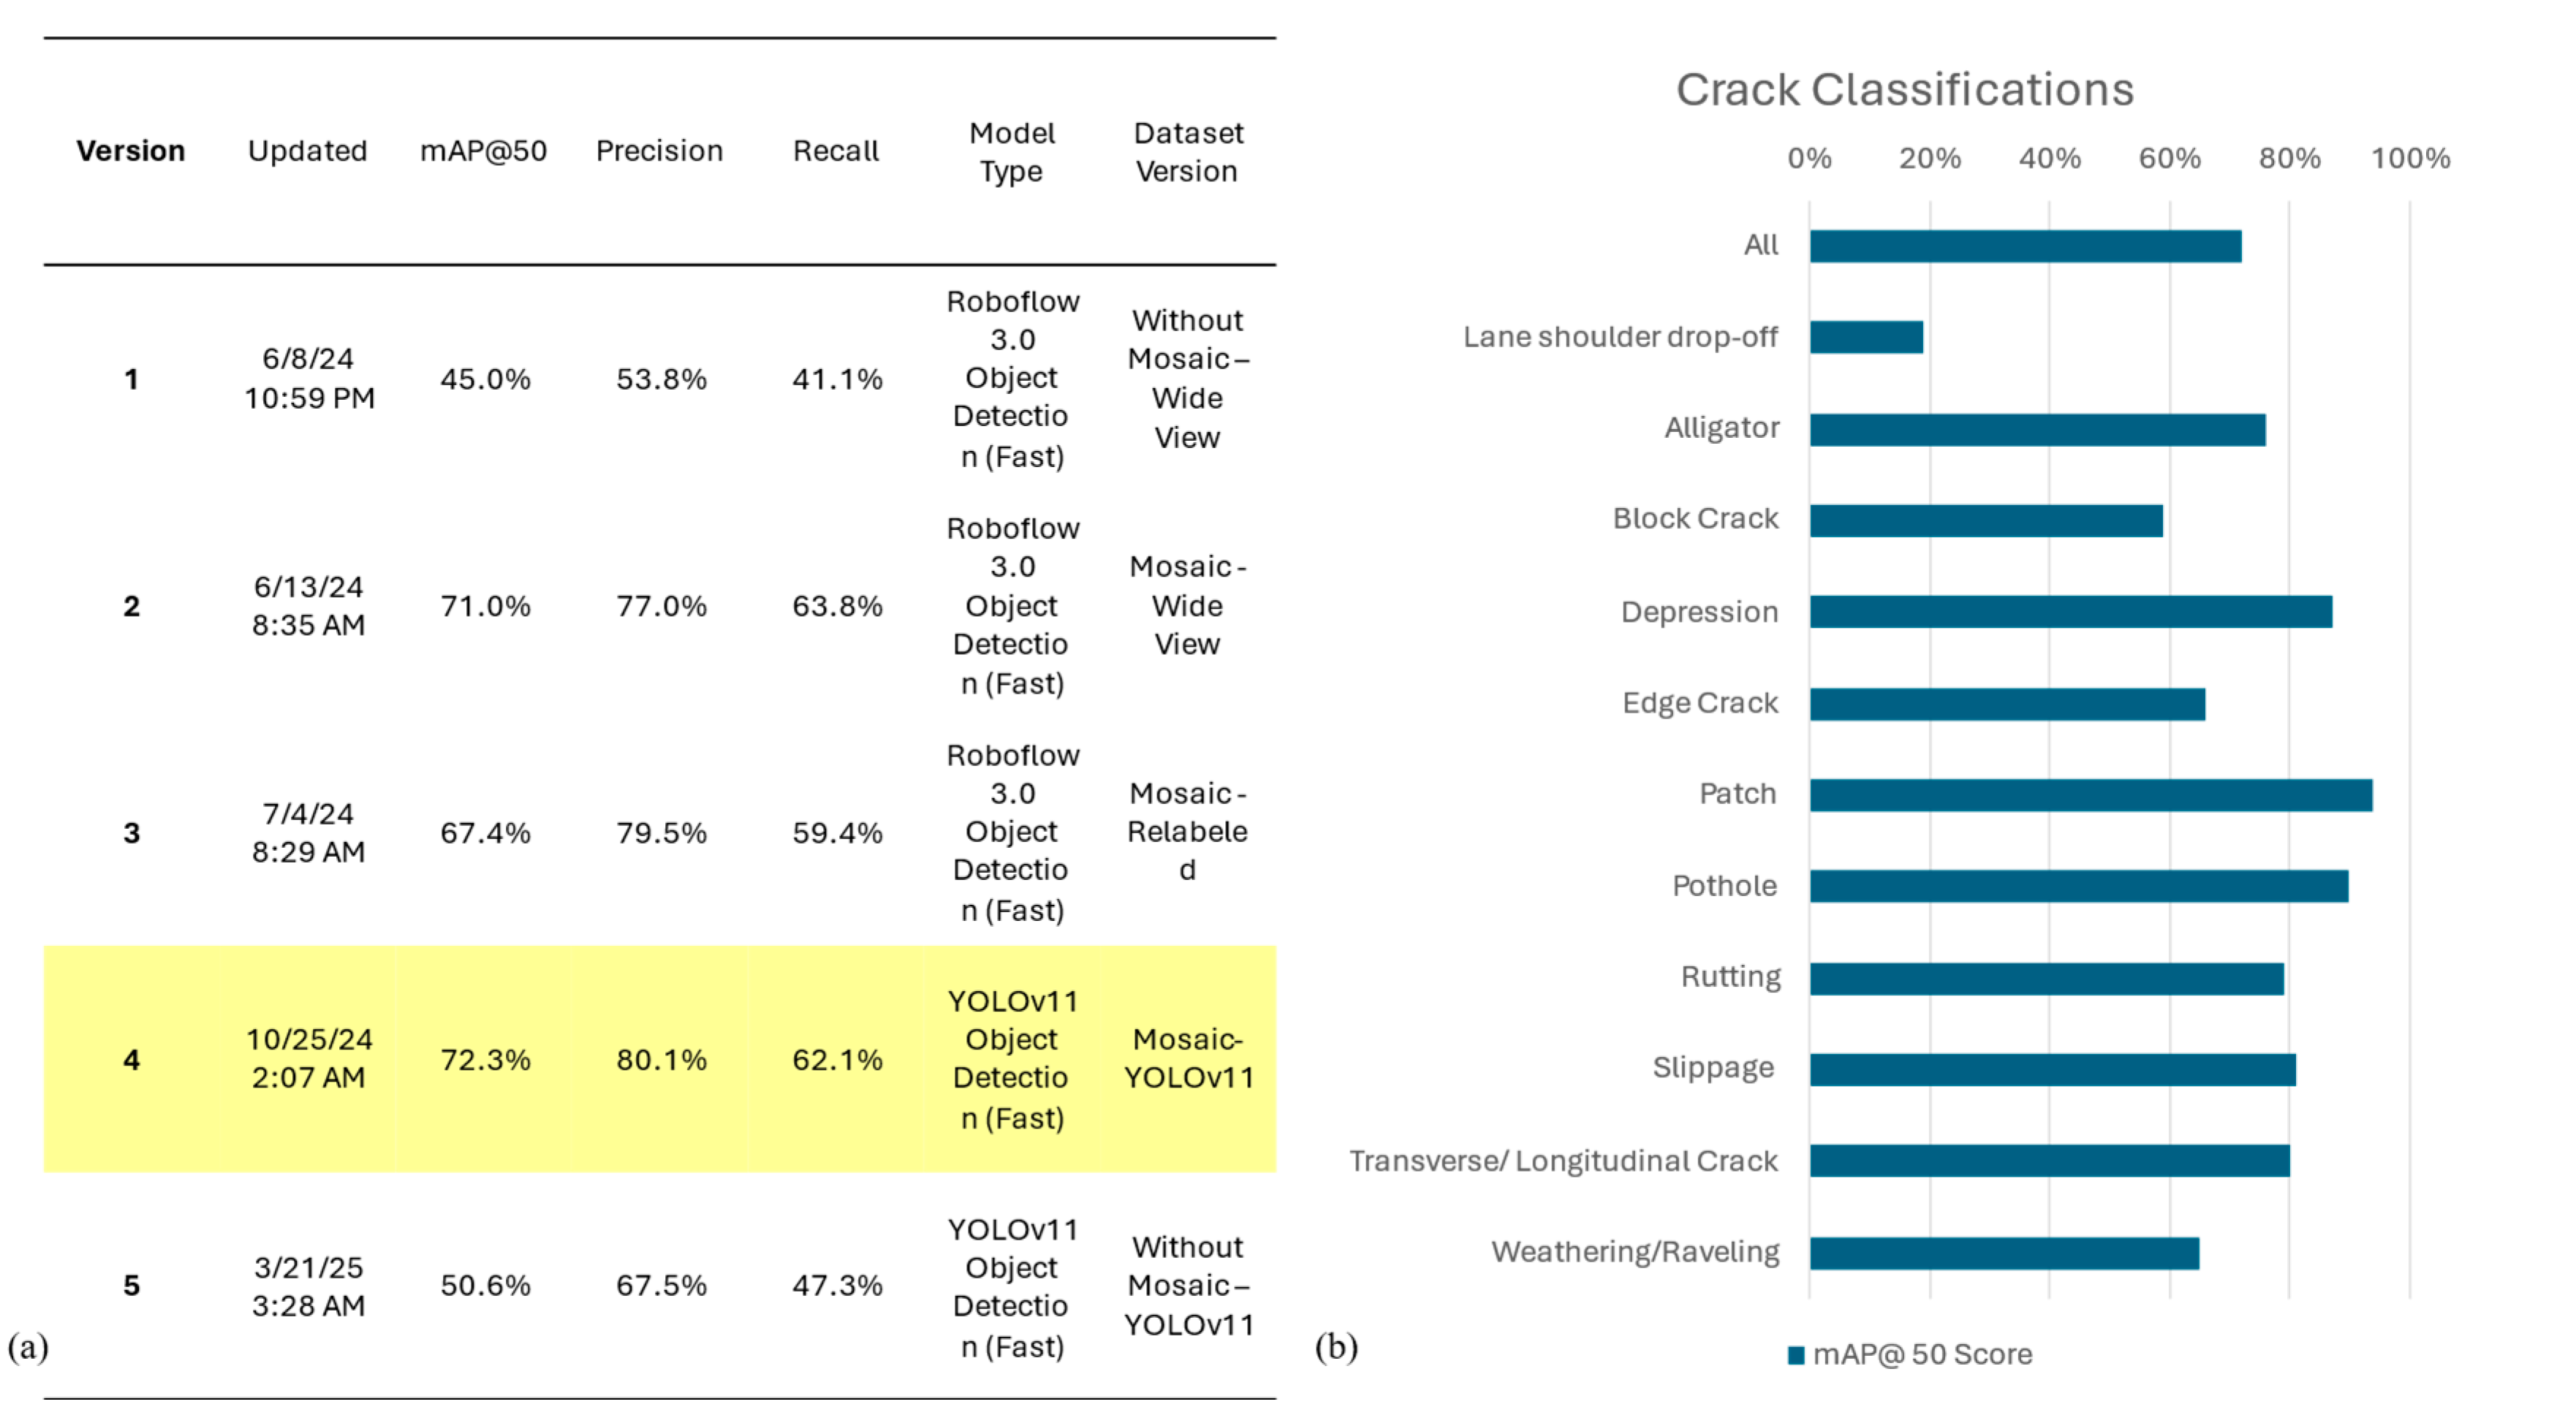
The proposed system was evaluated across multiple components: detection accuracy, segmentation quality, severity measurement precision, and final PCI computation reliability. The YOLOv11 model, trained on the curated dataset of 12 distress types, achieved a mean Average Precision (mAP) of 80.1% and recall of 62.1% as shown in Figure 5a. Crack detection, particularly for longitudinal and transverse types, showed the highest precision due to their consistent linear geometry. Potholes and depressions demonstrated slightly lower precision, attributable to their visual similarity under poor lighting and shadowing conditions as shown in Figure 5b. To further demonstrate the practical output of the classification stage, a sample of the model’s predictions on real pavement images is provided in Figure 6.

5.2. Segmentation Evaluation

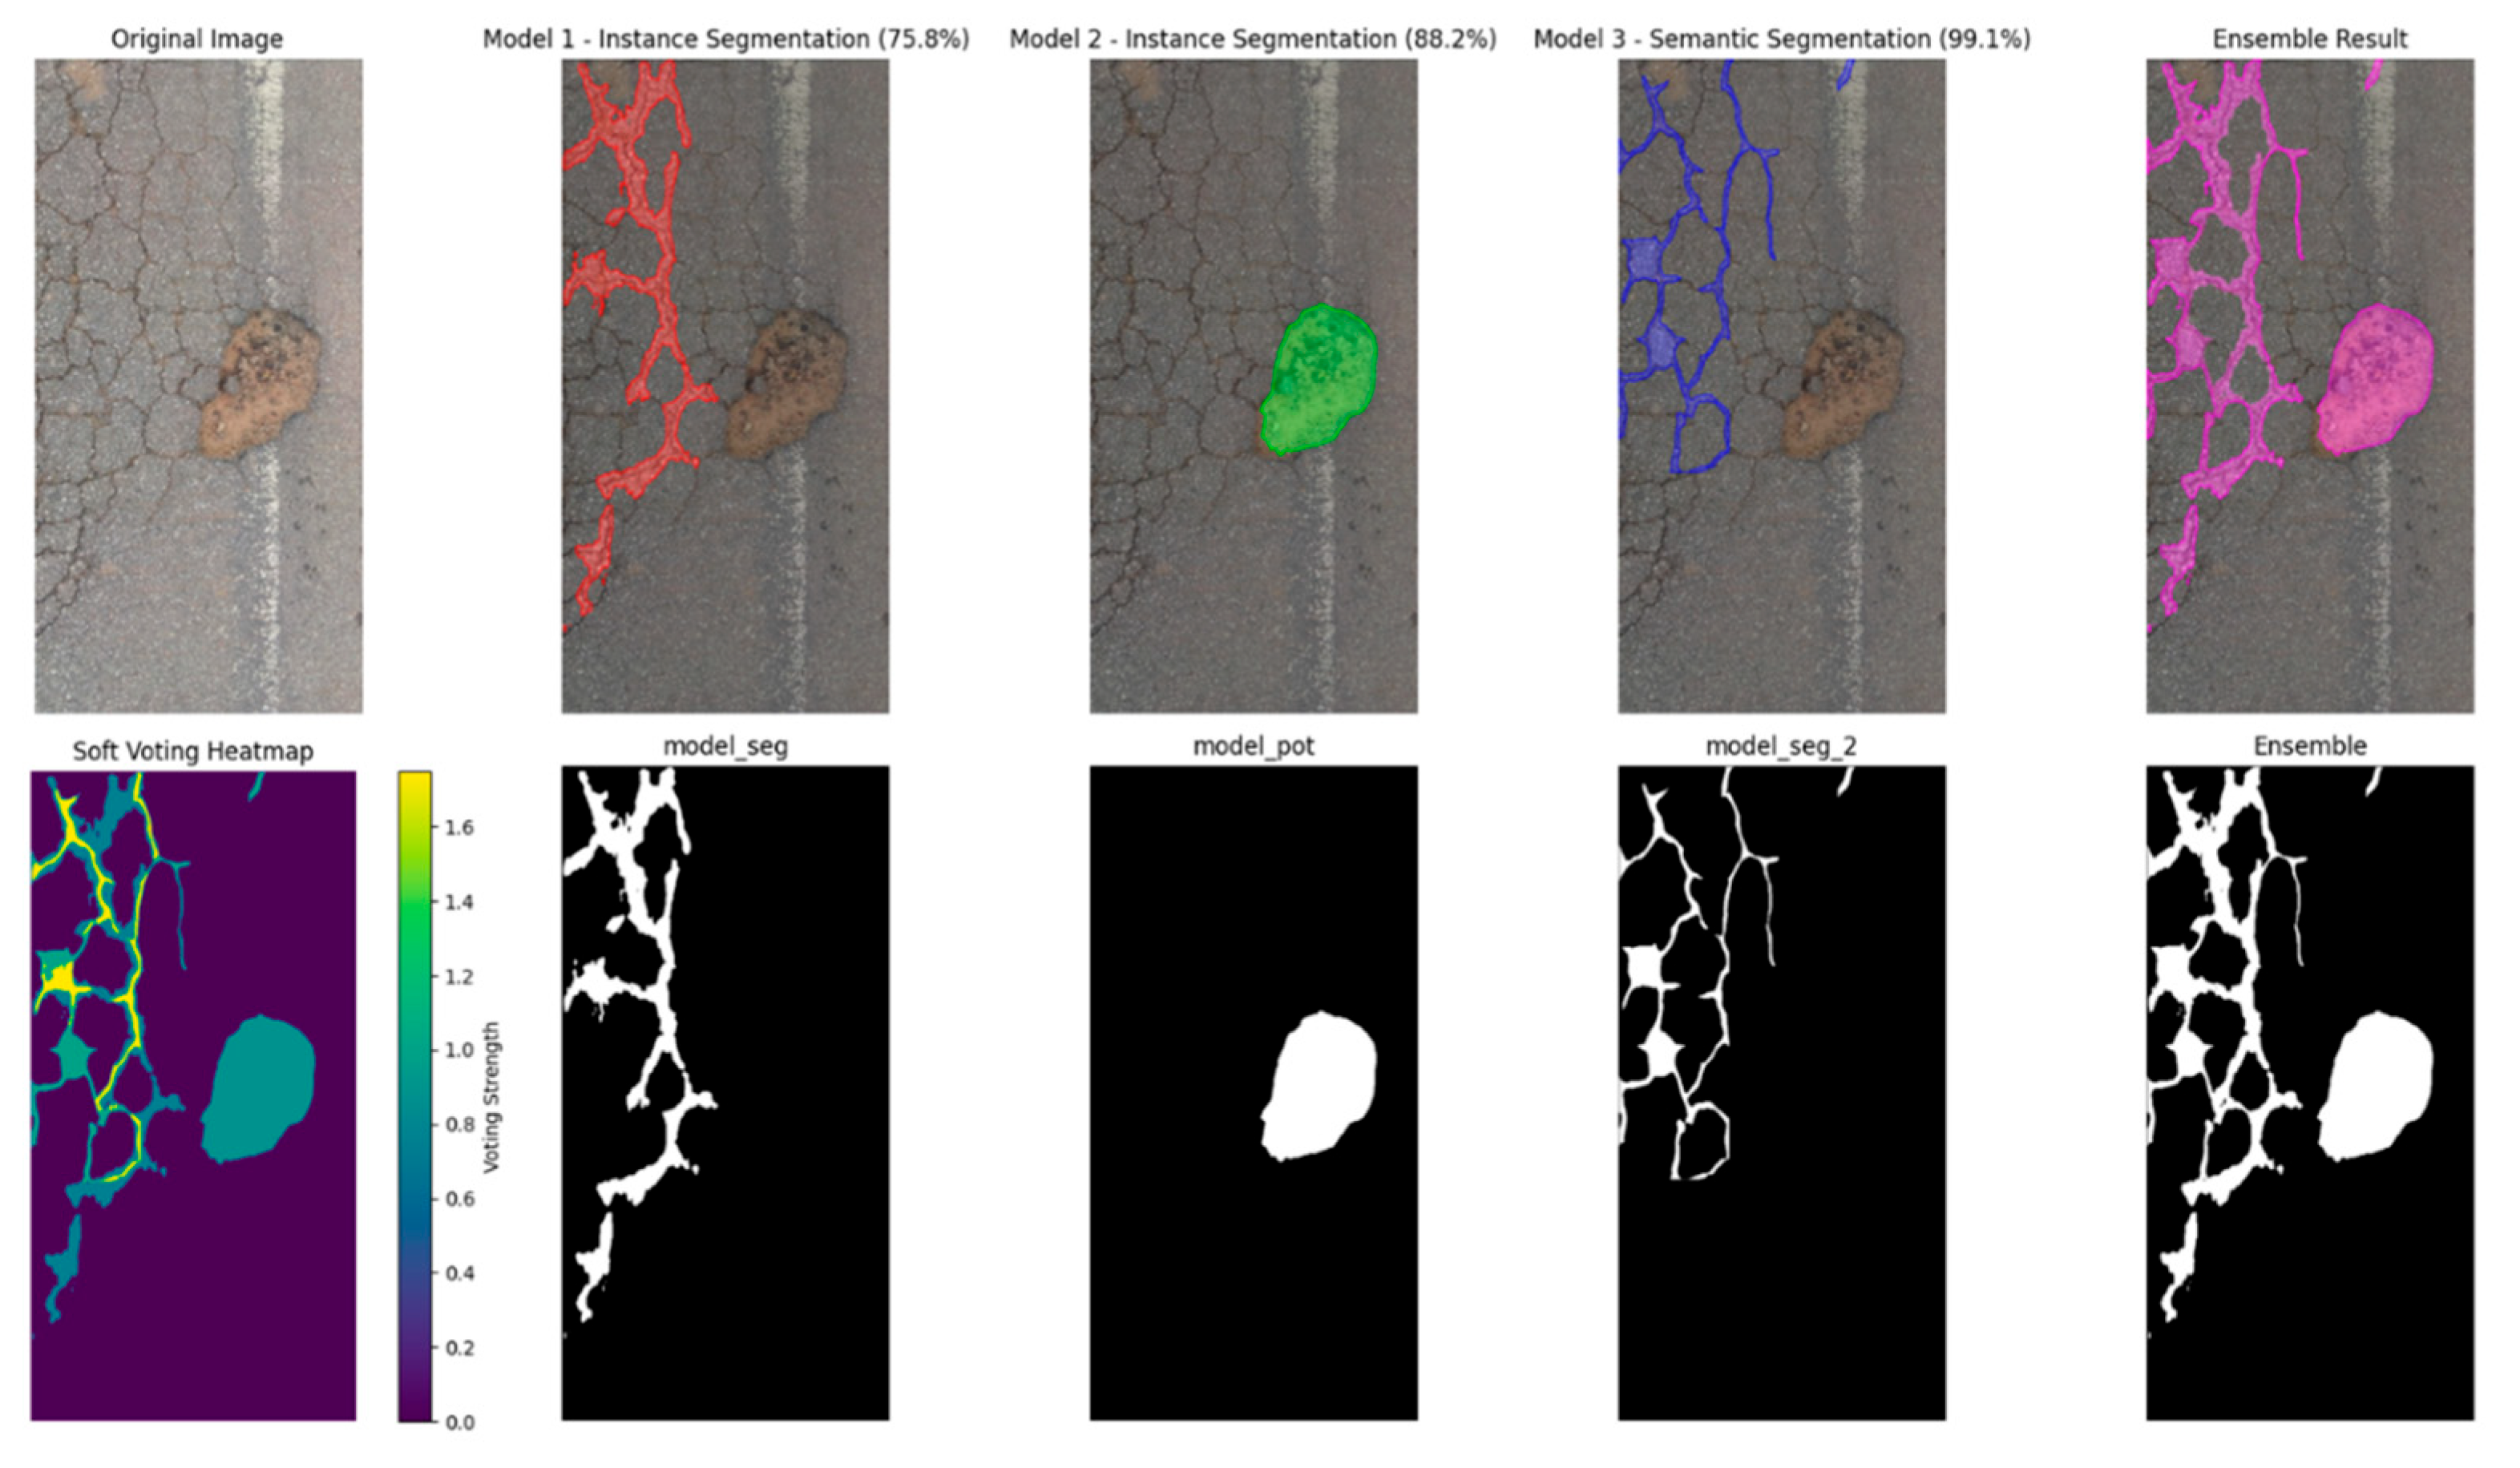
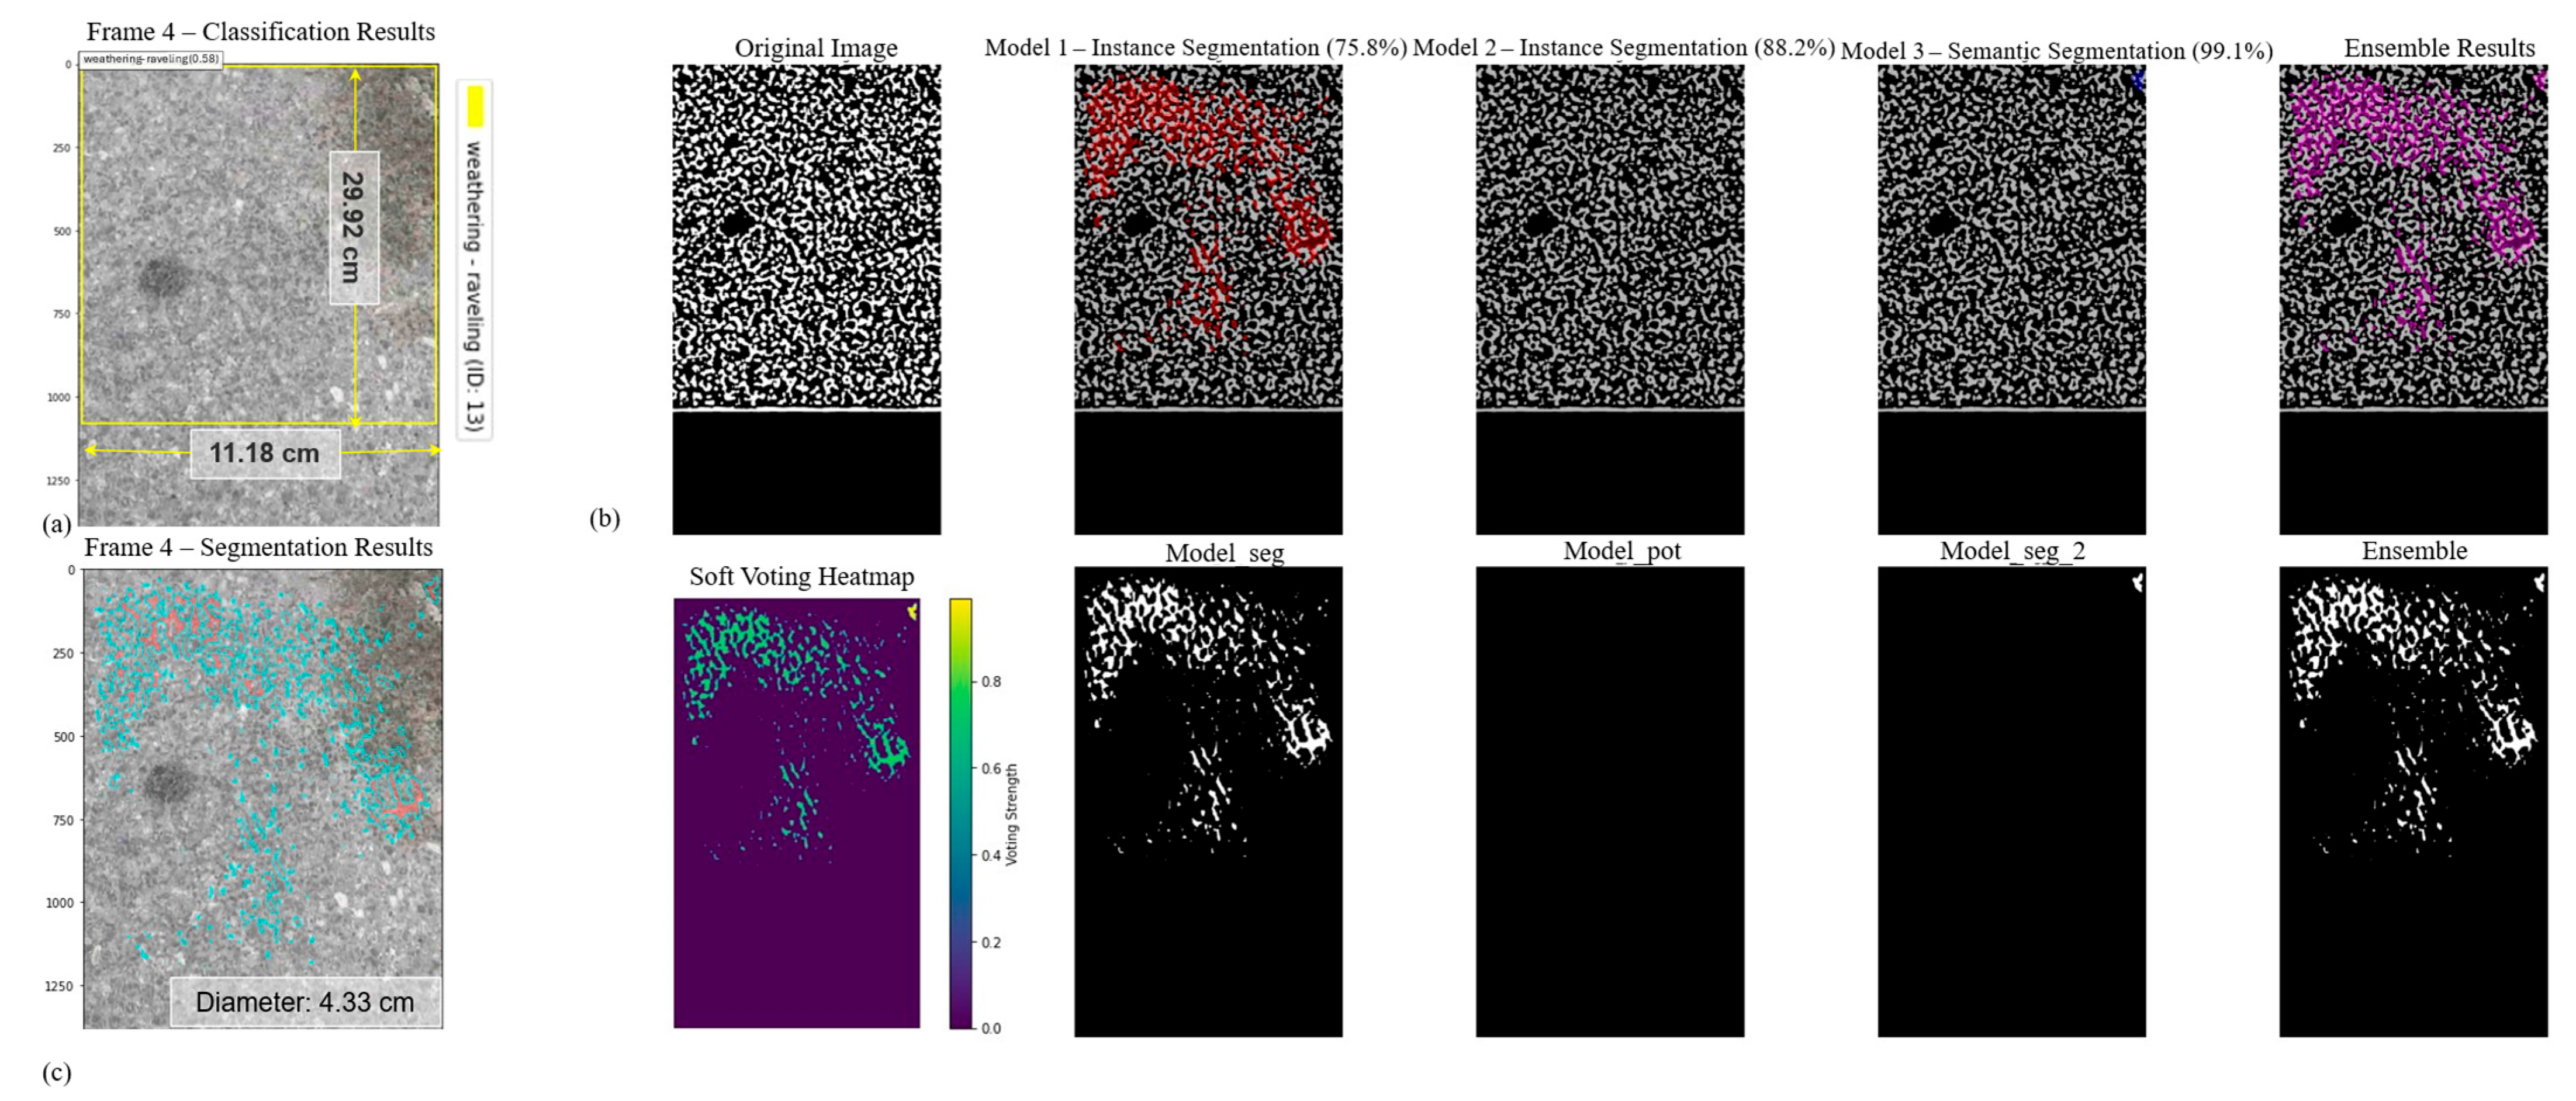
To enhance the robustness of distress segmentation, outputs from three fine-tuned models were combined using a soft voting ensemble strategy. As shown in Figure 7, each model demonstrated varying strengths: the first instance segmentation model (mIoU: 75.8%) captured elongated crack patterns with high recall; the second (mIoU: 84.2%) provided better discrimination of isolated potholes; and the semantic segmentation model (precision: 91.9%) achieved high pixel-wise accuracy, particularly in delineating complex, connected cracking structures. The ensemble result merged these strengths, resulting in more complete and geometrically consistent masks. The soft voting heatmap further highlights the agreement and confidence across models, validating the utility of probabilistic fusion. This fusion approach proved especially advantageous in mixed-distress scenarios, where both alligator cracking and potholes co-occur, improving both detection fidelity and measurement reliability for subsequent severity classification and PCI calculation.

5.3. Quantitative Distress Analysis

Measurement results from the skeletonization approach demonstrated high consistency and reliability in extracting crack lengths and widths directly from segmentation masks. The method efficiently captured the medial axis and edge relationships of linear cracks, offering rapid computation with stable performance across varied image resolutions and surface conditions. An alternative point-pair sampling method was also evaluated and produced comparable estimates, typically differing by only a few millimeters. However, skeletonization was ultimately selected for its superior computational speed and structural consistency, making it the preferred method for large-scale, automated assessments as shown in Figure 8.
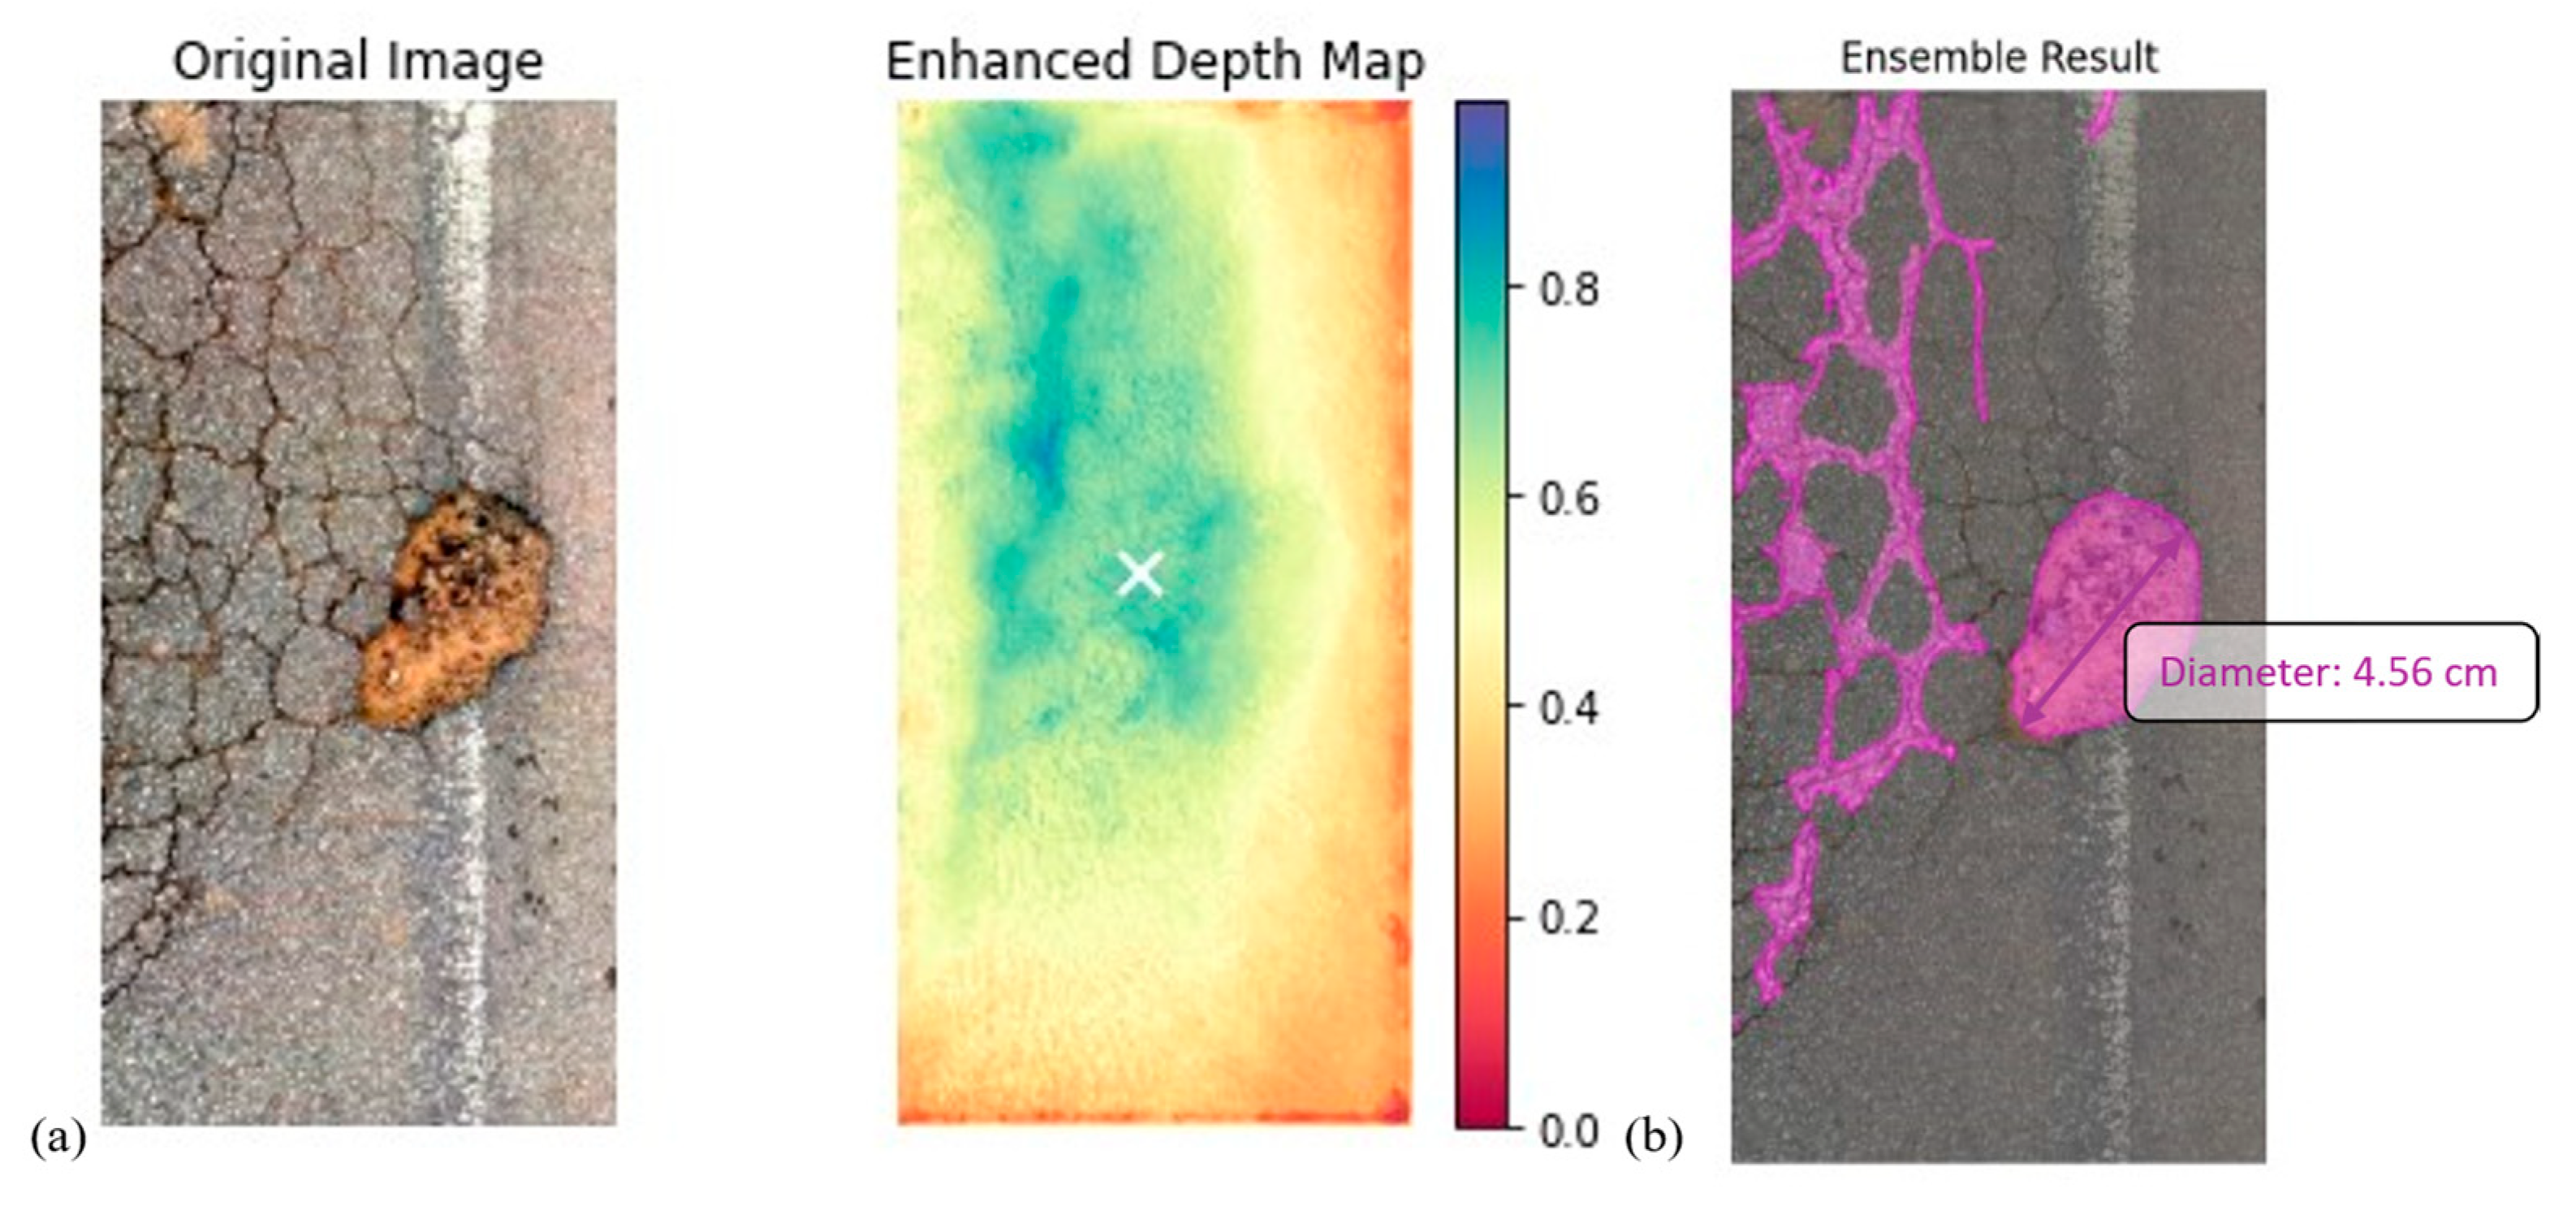
For depth estimation, the Marigold diffusion-based monocular model was integrated into the pipeline to extract three-dimensional surface profiles from single 2D images. Slippage and potholes were accurately differentiated by depth levels, validating the model’s capacity to infer meaningful geometric deformation from standard RGB input as shown in Figure 9. This represents a significant advancement toward low-cost, hardware-agnostic pavement condition analysis.

5.4. PCI Computation and Validation

To validate the end-to-end performance of the proposed pavement assessment pipeline, field deployments were conducted in two urban districts of Cairo, Egypt. The first segment was recorded in Shorouk City at approximately 08:00 a.m. under stable daylight conditions, while the second segment was captured in Nasr City at 05:00 p.m., thereby incorporating a lower-light, pre-evening environment. In the first case, a mobile device equipped with a 12-megapixel wide-angle sensor; ƒ/1.8 aperture, 26 mm focal length, optical image stabilization, was operated manually at a height of 50 cm in a perpendicular orientation while walking, corresponding to an effective ground speed of approximately 10 km/h. The second case was conducted from a vehicle traveling at 65 km/h, with the same device positioned at a height of 70 cm, introducing motion dynamics. These complementary deployments ensured evaluation of the system under heterogeneous illumination settings, acquisition heights, and operational speeds, thereby enhancing the robustness and generalizability of the validation process while retaining the simplicity of consumer-grade equipment without reliance on calibration or specialized sensors.
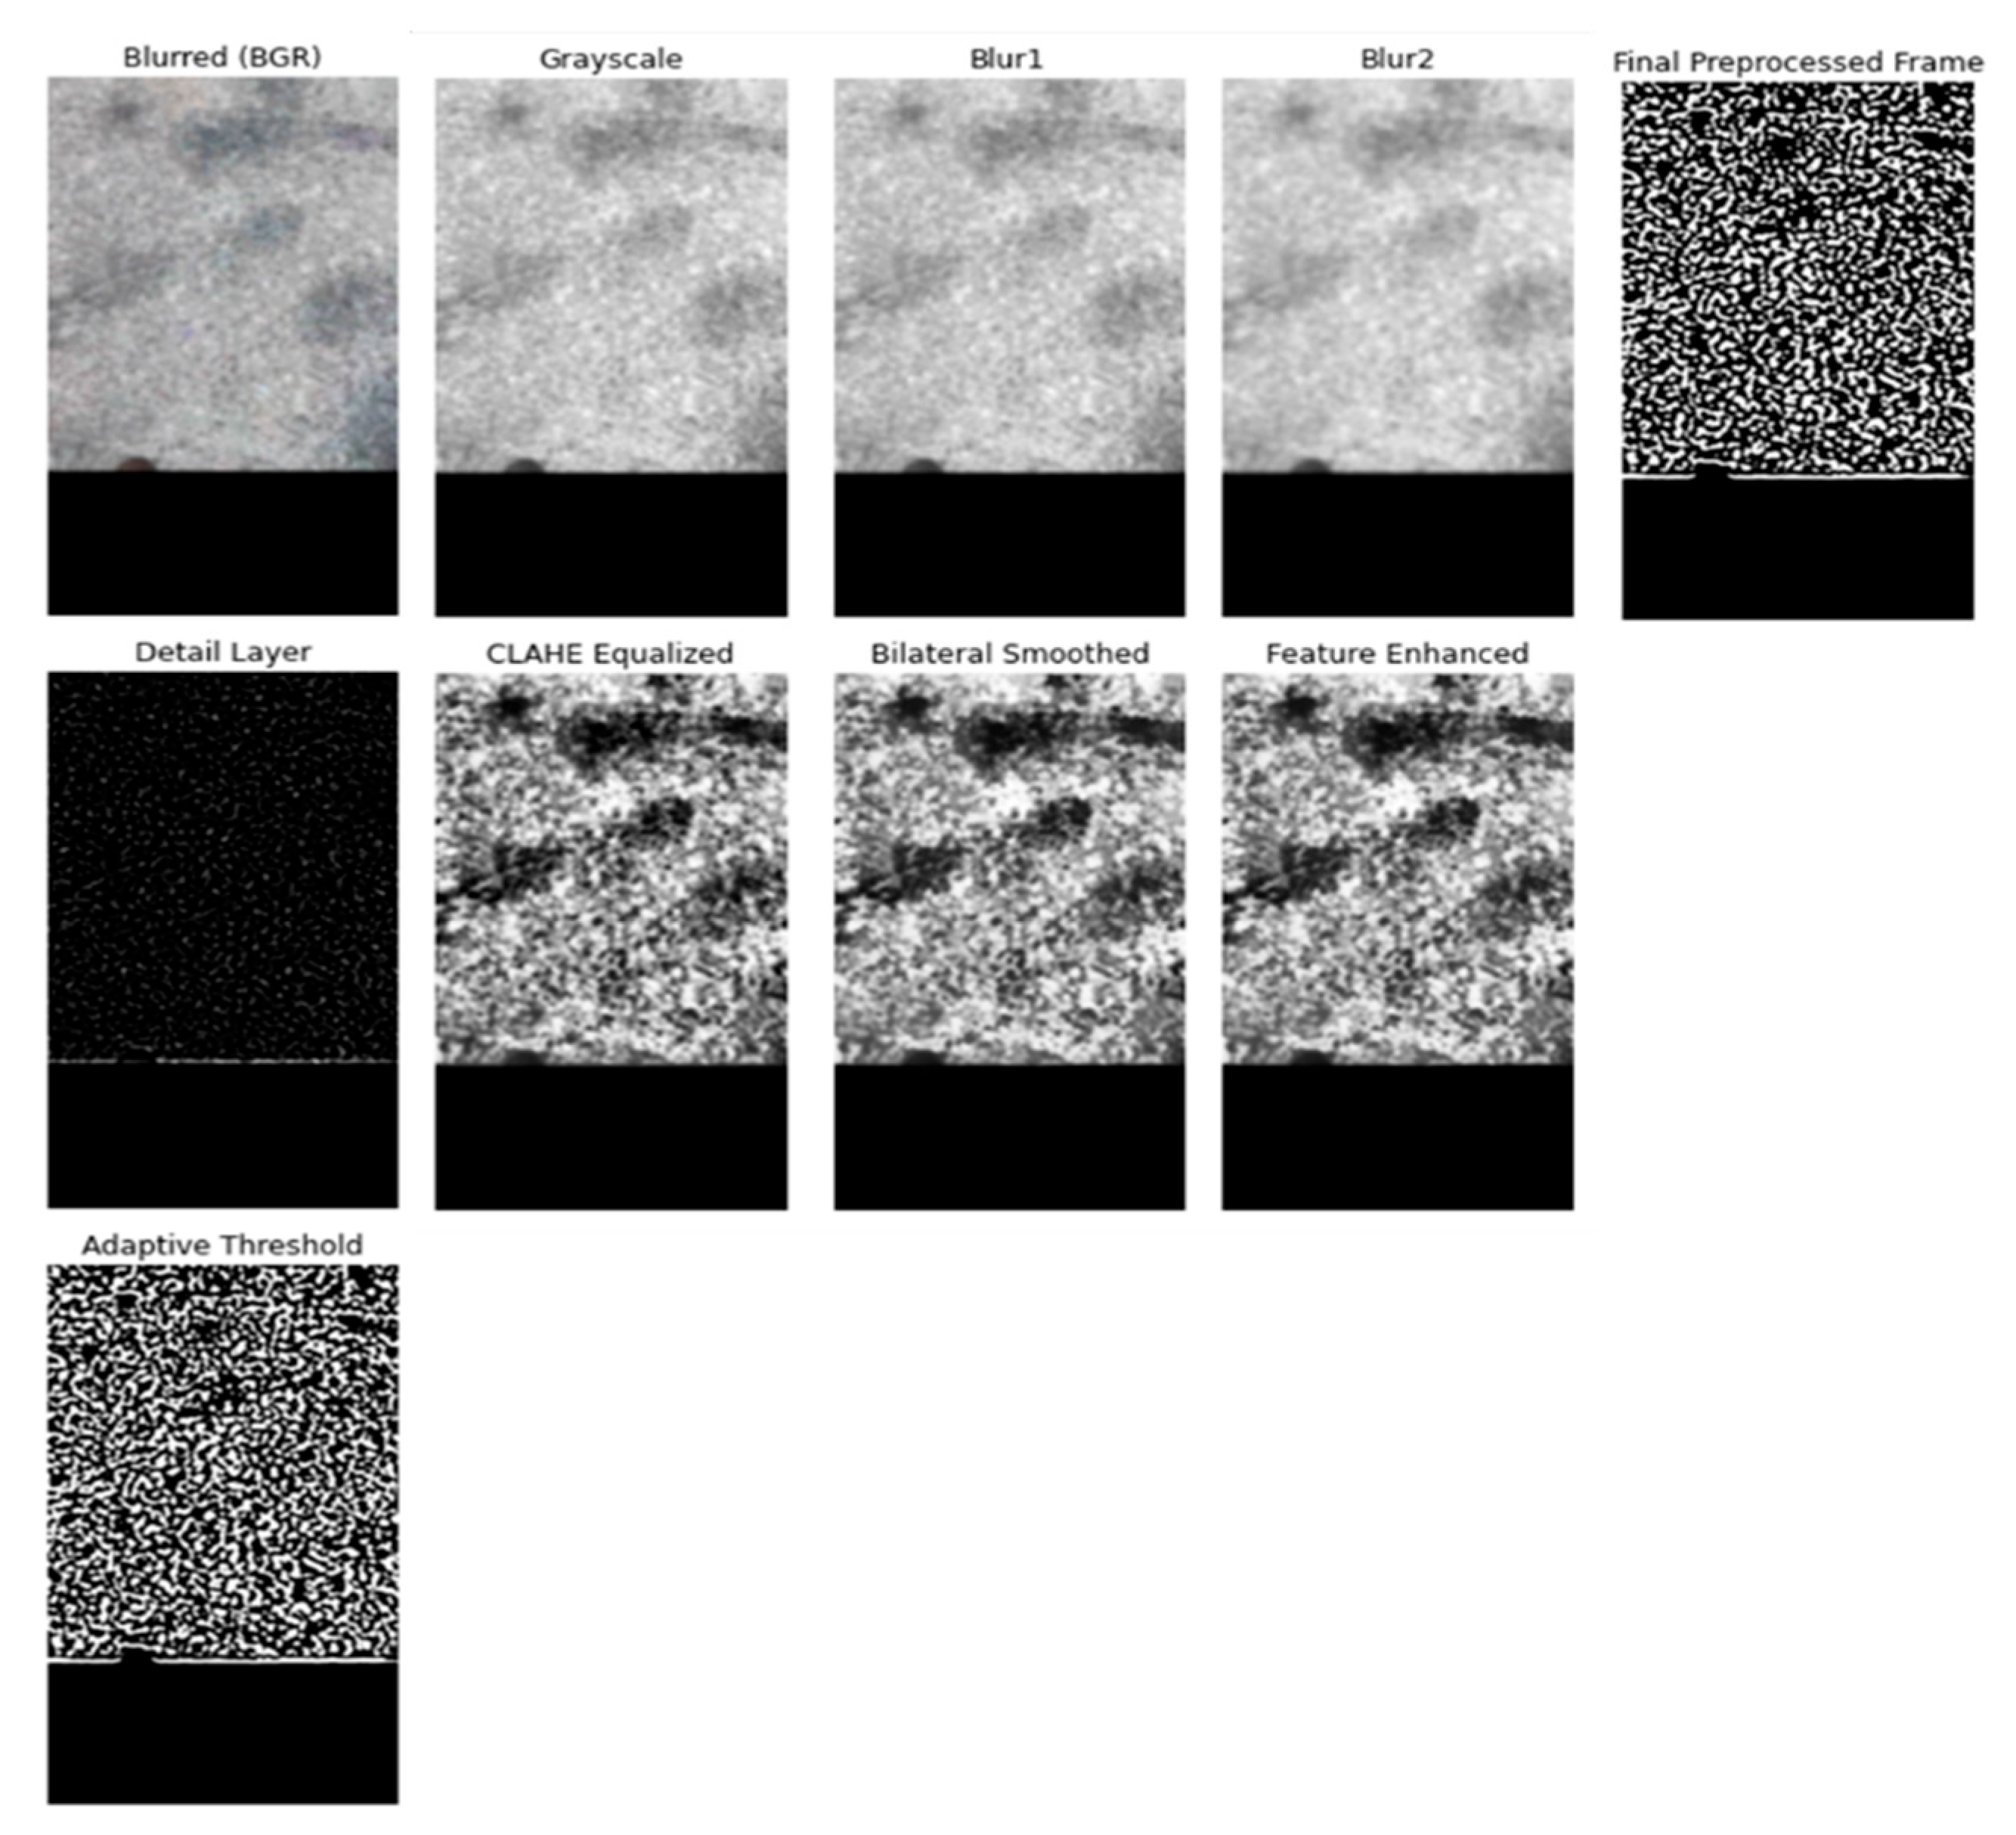
Segment 1 covered a total pavement surface of 0.8497 m2, serving as a proof-of-concept trial. The second segment, by contrast, spanned 31.95 m2, providing a broader validation of scalability under varied lighting and motion conditions. In total, 4 frames were analyzed in Segment 1 and 170 frames in Segment 2. For both, each extracted frame underwent a standardized preprocessing pipeline: device-induced artifacts such as contrast stretching, sharpening and auto-exposure were mitigated, frames were converted to LAB color space, smoothed with Gaussian and bilateral filters, and enhanced with CLAHE. Morphological operations were subsequently applied to refine the binary masks and ensure accurate distress localization as shown in Figure 10.
Once preprocessed, frames were processed through the classification and segmentation modules. Detected distress regions were quantitatively measured based on their geometry and converted into real-world units using height-calibrated scaling. Each distress was categorized into severity levels; low, medium and high, based on thresholds defined in the code. Distress densities were calculated by aggregating length, area, or count measurements and normalizing by the total surface area.
In Segment 1, the classification model detected weathering in Frame 4 as shown in Figure 11. The measured aggregate diameter of 4.33 cm exceeded the 1.3 cm threshold defined by the code, resulting in a high-severity classification. The affected region was quantified at 334.50 cm2, corresponding to a normalized density of 11.40 per m2, and assigned a deduct value of 47.06 using the high-severity deduction curve for weathering and raveling.
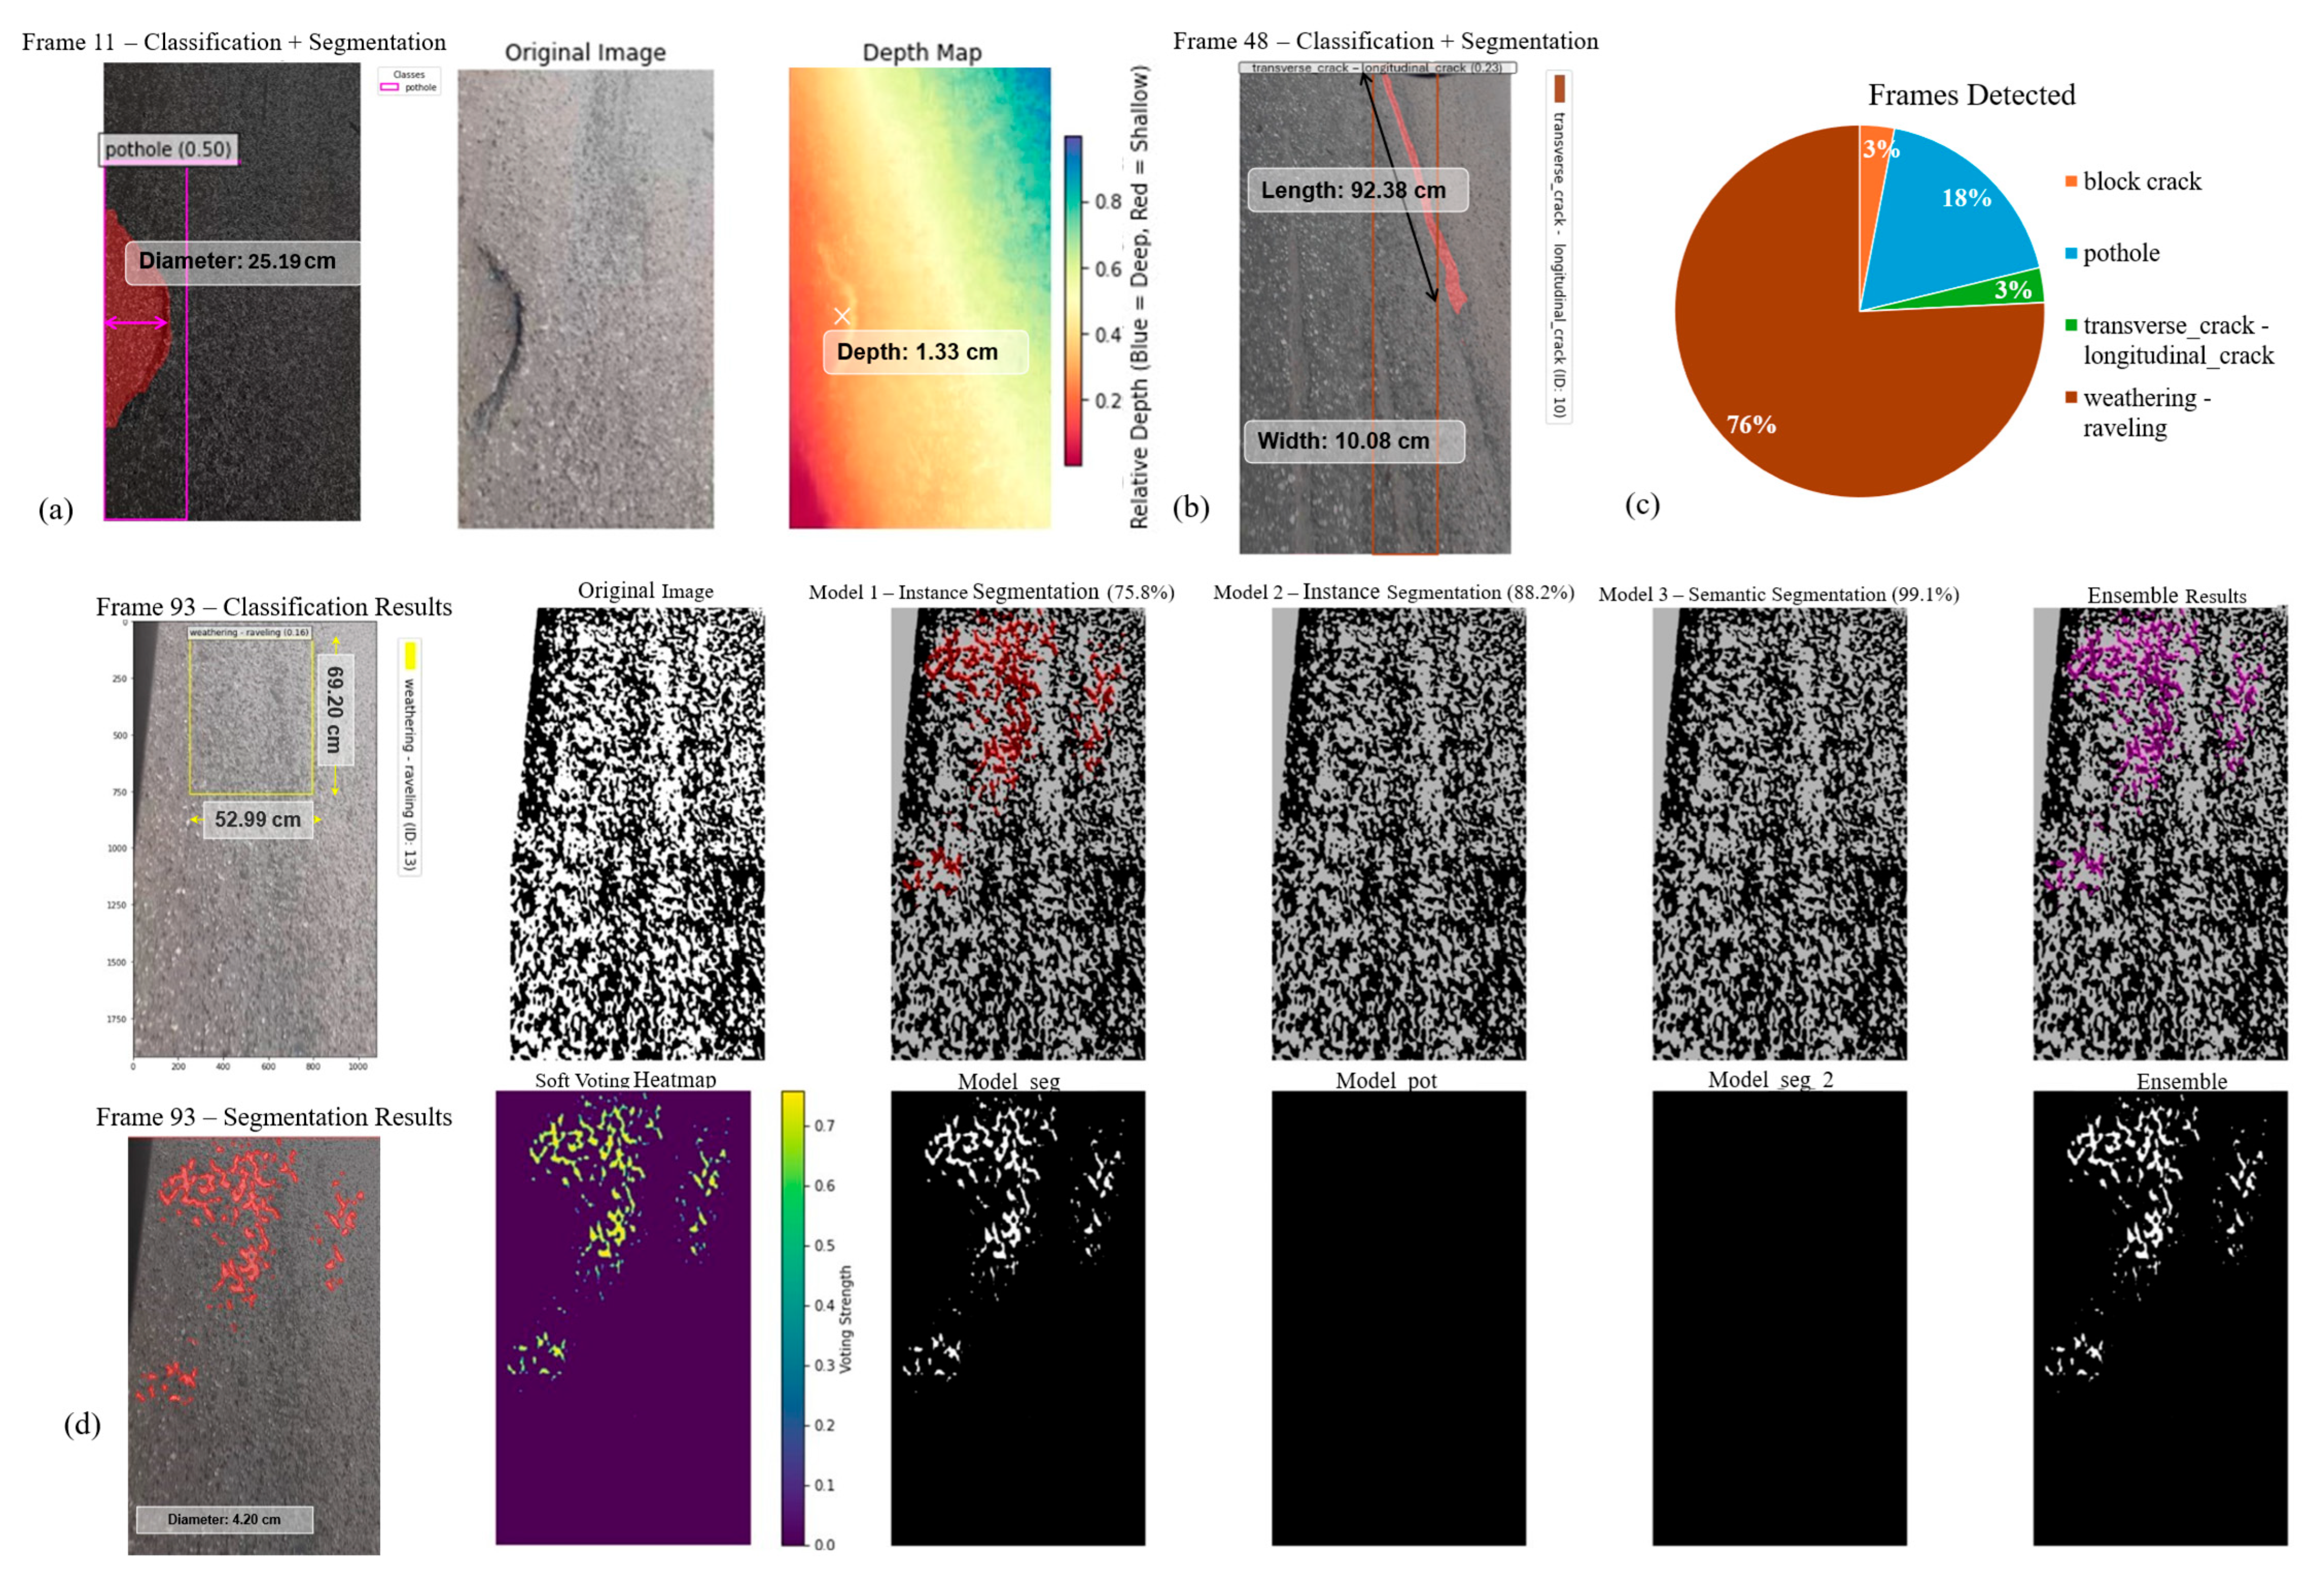
As for Segment 2, the larger dataset of analyzed frames enabled the detection of a broader spectrum of pavement distresses beyond weathering. The classification and segmentation modules successfully identified potholes, transverse cracks, longitudinal cracks, and raveling, each measured and categorized in accordance with the code. A representative weathering instance in Frame 93 exhibited a diameter of 5.63 cm and an affected area of 404.31 cm2, leading to a high-severity classification. When normalized against the total segment area, the corresponding density was 0.13 per m2, with a deduct value of 7.9. Additional detections included low-severity potholes in Frame 11, with a of diameter 25.2 cm, depth 1.33 cm, density 0.0003 per m2, as well as multiple raveling regions presenting variable densities. Collectively, these findings highlight the pipeline’s ability to characterize heterogeneous pavement conditions across extended road segments, thereby demonstrating both its scalability and robustness. Representative examples of these detections are presented in Figure 12.
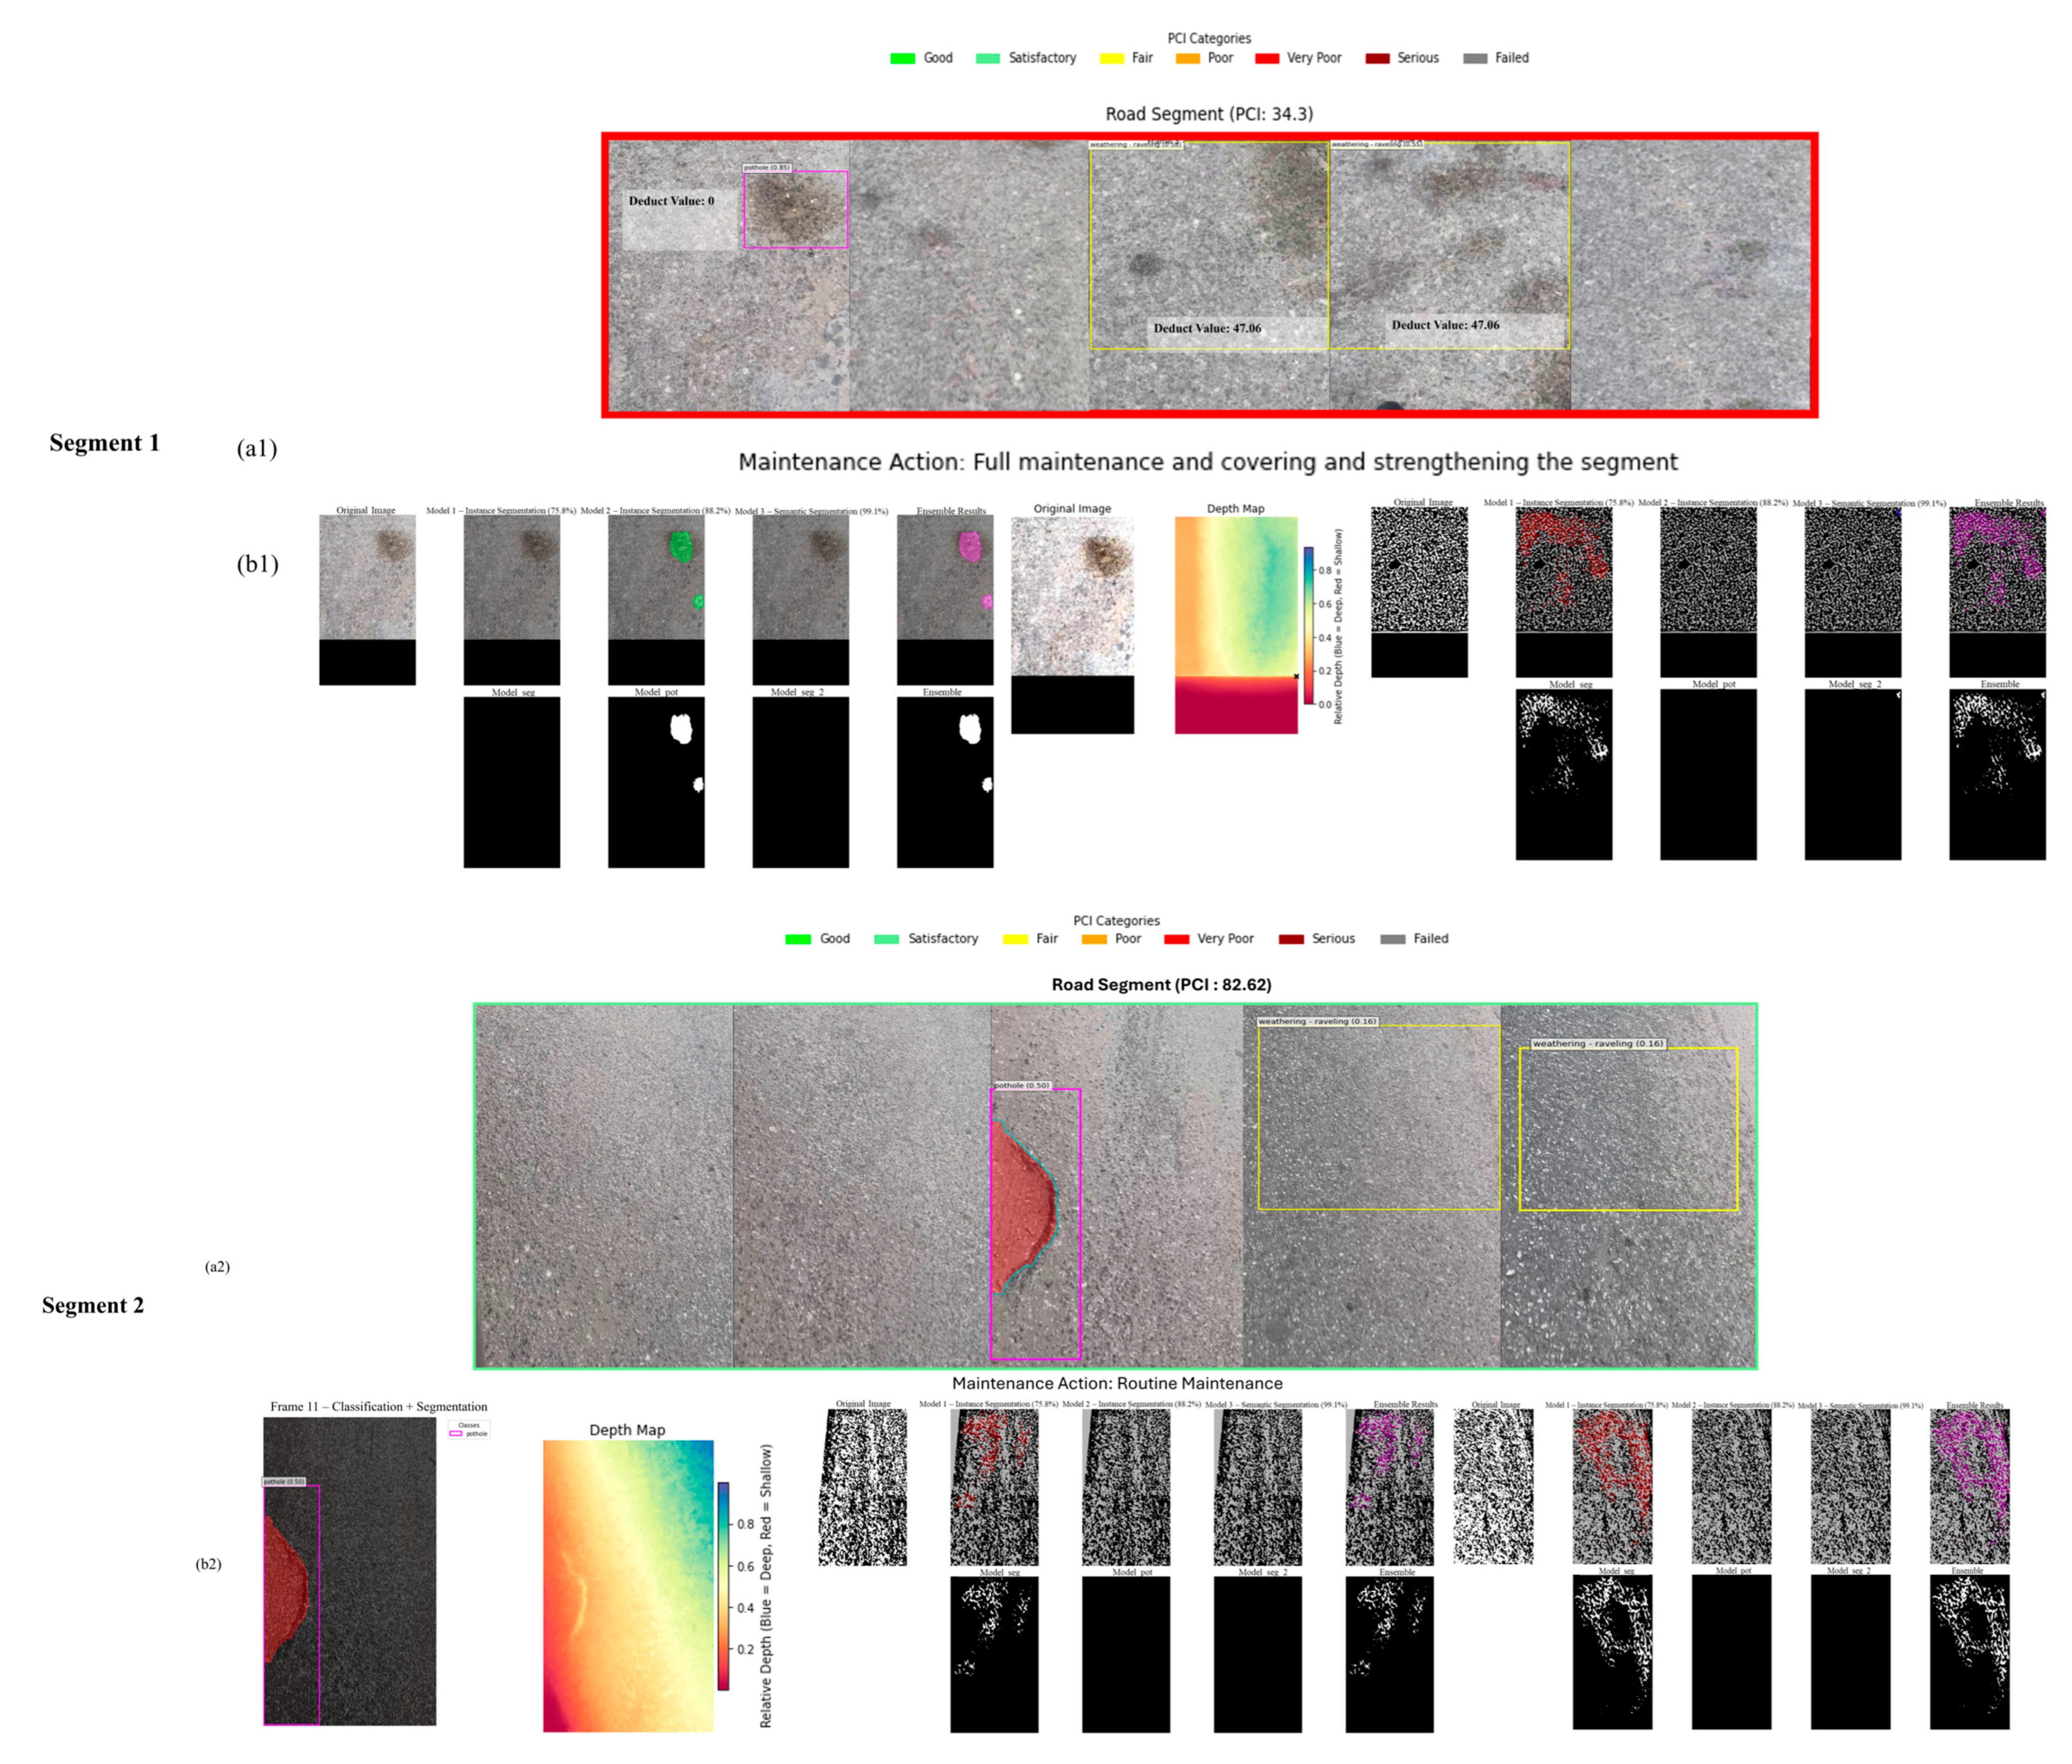
All frame-level deductions were computed separately for the two test segments. In Segment 1, deductions are summed to a Total Deduct Value (TDV) of 94.13, with q = 2 deduct values exceeding 5. Using the digitized correction curve of the ASTM D6433 Code, this corresponded to a Corrected Deduct Value (CDV) of 65.70 and a final Pavement Condition Index (PCI) score of 34.30, leading to a recommended action of full maintenance, surface covering, and segment strengthening. In contrast, Segment 2 yielded a TDV of 46.19, with q = 6, resulting in a CDV of 17.38 and a PCI score of 82.62, which corresponds to a recommendation of routine maintenance. These results demonstrate the pipeline’s ability to produce PCI outputs across both small proof-of-concept areas and larger, more heterogeneous surfaces, while remaining consistent with national standards Figure 13.
This test confirmed the system’s capability to detect and quantify multiple distress types, including weathering, and to generate PCI scores and maintenance actions in accordance with national standards, all using a streamlined and hardware-independent process. While the results are promising, future work will involve expert-based validation and manual PCI computation for selected segments to benchmark and further verify the system’s accuracy under practical field conditions.

5.5. Manual PCI Validation

To assess reliability, the automated PCI computation was benchmarked against manual curve readings on digitized ASTM D6433 Code curves. The manual procedure was applied to Frame 3 only, as Frame 4 exhibited nearly identical densities, 11.4015 and 11.4148 m2, respectively, and the chart resolution does not support two-decimal precision. Using the weathering/raveling chart and locating the high severity curve, a density of 11.40 m2 yielded a deduct of 45. With q = 2 deducts greater than five, the Total Deduct Value (TDV) entered on the corrected-deduct chart was 90, intersecting the q = 2 curve at CDV of 63 as shown in Figure 14. The resulting manual PCI was 100 − 63 = 36. The model-generated PCI for Segment 1 was 34.3, corresponding to an absolute error of 1.7 PCI points.
As for Segment 2, the frame-level outputs were analyzed according to the code weathering/raveling curves. Densities less than 0.10 fall in the near-zero region of the chart and therefore carry Deduct Value = 0. As a result, frames with densities below 0.10 were excluded from the TDV sum. Only the six high-severity weathering/raveling instances with densities ≥ 0.10 contributed to the PCI calculation. These frames, 81, 93, 115, 145, 164, and 170, had densities ranging from 0.101 to 0.127, with corresponding deducts between 7.6 and 7.9 as shown in Figure 15. The corrected-deduct chart, considering a total TDV with q = 6 deducts greater than five, yielded a CDV = 17, resulting in a manual PCI of 83, making the absolute error for Segment 2 to be 0.38 PCI points.
To ensure external validity for the interpretation and workflow, three pavement-engineering experts, with an average of 17.7 years of experience, independently reviewed the full pipeline. The experts unanimously confirmed the results and concluded that the agreement between the manual and automated PCI calculations for both segments was satisfactory, considering the precision limitations of the chart’s read-out.

6. Discussion and Limitations

The proposed pipeline demonstrated robust performance across detection, segmentation, geometry-based quantification, and PCI computation, even under heterogeneous operating conditions. Validation across two distinct urban districts in Cairo, with acquisition times at 08:00 and 17:00, camera heights of 50 cm and 70 cm, and operating speeds of 10 km/h and 65 km/h, confirmed that the system maintains consistency across illumination changes, perspective variations, and motion dynamics. Importantly, the system scaled effectively from a proof-of-concept trial covering 0.85 m2 with 4 frames to a larger segment spanning 31.95 m2 with 170 frames, indicating its adaptability to both small-scale and extended road surfaces.
Manual PCI benchmarking further validated the accuracy of the pipeline. In Segment 1, Frame 4 yielded a manual PCI of 36, compared with an automated PCI of 34.3, an absolute deviation of only 1.7 points. For Segment 2, the difference was even smaller at 0.38 points. Notably, ASTM D6433 deduction charts provide a maximum resolution of one decimal place, limiting the precision achievable by any manual calculation. Within this constraint, the automated outputs align almost exactly with manual results, indicating that the model delivers the highest level of accuracy permissible by the standard methodology. This agreement underscores the fidelity of the automated computation and confirms its practical utility for standardized pavement condition assessment.
Several limitations qualify for these results. First, the calibration protocol assumes near-orthographic imaging. Off-axis acquisitions introduce foreshortening proportional to cosθ, which biases measurements of crack length, diameter, and density. While the polynomial correction partially mitigates height-related scaling, fully compensating for angular distortion remains an open challenge. Second, the performance of the system may vary with device-specific imaging pipelines. Factors such as auto-exposure, in-camera HDR, sharpening, and environmental artifacts such as shadows, glare, or occlusion can influence classification and segmentation quality, particularly under high-speed motion where blur becomes pronounced.

7. Conclusions and Future Work

This study developed and validated a fully automated, image-based pavement assessment pipeline that integrates YOLOv11 classification, ensemble segmentation, skeletonization-based quantification, and monocular depth estimation to generate PCI scores directly from consumer-grade video. The system is capable of detecting 12 distress types, including subtle and often overlooked forms such as weathering, and demonstrated close agreement with manual PCI calculations, with absolute errors of 0.38 and 1.7 PCI points for Segment 2 and Segment 1, respectively. Given that ASTM D6433 deduction charts provide a resolution limited to one decimal place, the automated results effectively achieved the highest accuracy level possible within the standard framework. These findings highlight the potential of the pipeline as a low-cost alternative to conventional inspection methods, as it is capable of producing reliable, repeatable, and scalable pavement condition assessments.
The modular design of the pipeline positions it for integration into robotic platforms such as drones or autonomous ground vehicles, enabling real-time, large-scale monitoring of road networks. Future work will focus on three main directions: developing enhanced calibration methods to address device- and orientation-specific challenges including angular distortion and motion blur; implementing lightweight optimizations for onboard inference to support real-time deployment; and further enhancing the classification model through refined training strategies to achieve higher accuracy across varied conditions.
Overall, the results demonstrate that the proposed approach can generate standardized PCI outputs from consumer-grade imagery with an accuracy comparable to manual methods. While not intended to replace established inspection practices outright, the system offers a practical pathway toward faster, more consistent, and lower-cost pavement assessments. With continued refinement and larger-scale validation, it could meaningfully complement traditional surveys and provide infrastructure managers with a scalable tool for monitoring road conditions.

Author Contributions

Conceptualization, M.S.E.; methodology, A.A.T. and M.E.; software, N.E.D.; validation, M.E.; formal analysis, N.E.D.; investigation, N.E.D.; resources, N.E.D. and A.A.T.; data curation, N.E.D.; writing—original draft preparation, N.E.D.; writing—review and editing, A.A.T. and M.S.E.; visualization, N.E.D.; supervision, M.S.E. and M.I.; project administration, M.S.E. All authors have read and agreed to the published version of the manuscript.

Funding

This research received no external funding, and the APC was waived by the MDPI.

Data Availability Statement

Dataset available on request from the authors.

Conflicts of Interest

The authors declare no conflict of interest.

References

  1. Cheng, M.-Y.; Hoang, N.-D. A Swarm-Optimized Fuzzy Instance-based Learning approach for predicting slope collapses in mountain roads. Knowl. Based Syst. 2015, 76, 256–263. [Google Scholar] [CrossRef]
  2. Lugo, A.E.; Gucinski, H. Function, effects, and management of forest roads. For. Ecol. Manag. 2000, 133, 249–262. [Google Scholar] [CrossRef]
  3. Bukhsh, Z.A.; Stipanovic, I.; Saeed, A.; Doree, A.G. Maintenance intervention predictions using entity-embedding neural networks. Autom. Constr. 2020, 116, 103202. [Google Scholar] [CrossRef]
  4. Issa, A.; Samaneh, H.; Ghanim, M. Predicting pavement condition index using artificial neural networks approach. Ain Shams Eng. J. 2022, 13, 101490. [Google Scholar] [CrossRef]
  5. Tafida, A.; Alaloul, W.S.; Zawawi, N.A.B.W.; Musarat, M.A.; Sani, A.A. Advancing smart transportation: A review of computer vision and photogrammetry in learning-based dimensional road pavement defect detection. Comput. Sci. Rev. 2025, 56, 100729. [Google Scholar] [CrossRef]
  6. Tedeschi, A.; Benedetto, F. A real-time automatic pavement crack and pothole recognition system for mobile Android-based devices. Adv. Eng. Inform. 2017, 32, 11–25. [Google Scholar] [CrossRef]
  7. Wang, A.; Lang, H.; Peng, Y.; Chen, X.; Qian, J. Selecting and optimizing distress feature descriptors from multi-source images for pavement distress classification. Int. J. Transp. Sci. Technol. 2025, inpress. [Google Scholar] [CrossRef]
  8. Wang, W.; Wang, M.; Li, H.; Zhao, H.; Wang, K.; He, C.; Wang, J.; Zheng, S.; Chen, J. Pavement crack image acquisition methods and crack extraction algorithms: A review. J. Traffic Transp. Eng. 2019, 6, 535–556. [Google Scholar] [CrossRef]
  9. Garilli, E.; Bruno, N.; Autelitano, F.; Roncella, R.; Giuliani, F. Automatic detection of stone pavement’s pattern based on UAV photogrammetry. Autom. Constr. 2021, 122, 103477. [Google Scholar] [CrossRef]
  10. Liu, F.; Liu, J.; Wang, L.; Al-Qadi, I.L. Multiple-type distress detection in asphalt concrete pavement using infrared thermography and deep learning. Autom. Constr. 2024, 161, 105355. [Google Scholar] [CrossRef]
  11. Ranjbar, S.; Nejad, F.M.; Zakeri, H. Image-based severity analysis of Asphalt pavement bleeding using a metaheuristic-boosted fuzzy classifier. Autom. Constr. 2024, 166, 105655. [Google Scholar] [CrossRef]
  12. Ashraf, A.; Sophian, A.; Bawono, A.A. Crack Detection, Classification, and Segmentation on Road Pavement Material Using Multi-Scale Feature Aggregation and Transformer-Based Attention Mechanisms. Constr. Mater. 2024, 4, 655–675. [Google Scholar] [CrossRef]
  13. Zhang, J.; Sun, S.; Song, W.; Li, Y.; Teng, Q. A novel convolutional neural network for enhancing the continuity of pavement crack detection. Sci. Rep. 2024, 14, 30376. [Google Scholar] [CrossRef]
  14. Naseri, A.; Golroo, A.; Parsaei, A. Comparison of different deep learning algorithms in pavement crack detection. Road Mater. Pavement Des. 2025, 1–18. [Google Scholar] [CrossRef]
  15. Zhang, J.; Xia, H.; Li, P.; Zhang, K.; Hong, W.; Guo, R. A Pavement Crack Detection Method via Deep Learning and a Binocular-Vision-Based Unmanned Aerial Vehicle. Appl. Sci. 2024, 14, 1778. [Google Scholar] [CrossRef]
  16. Nafaa, S.; Ashour, K.; Mohamed, R.; Essam, H.; Emad, D.; Elhenawy, M.; Ashqar, H.I.; Hassan, A.A.; Alhadidi, T.I. Automated Pavement Cracks Detection and Classification Using Deep Learning. In Proceedings of the 2024 IEEE 3rd International Conference on Computing and Machine Intelligence (ICMI), Mt Pleasant, MI, USA, 13–14 April 2024; pp. 1–5. [Google Scholar]
  17. Cano-Ortiz, S.; Iglesias, L.L.; del Árbol, P.M.R.; Lastra-González, P.; Castro-Fresno, D. An end-to-end computer vision system based on deep learning for pavement distress detection and quantification. Constr. Build. Mater. 2024, 416, 135036. [Google Scholar] [CrossRef]
  18. Zhang, A.A.; Shang, J.; Li, B.; Hui, B.; Gong, H.; Li, L.; Zhan, Y.; Ai, C.; Niu, H.; Chu, X.; et al. Intelligent pavement condition survey: Overview of current researches and practices. J. Road Eng. 2024, 4, 257–281. [Google Scholar] [CrossRef]
  19. Galata, S.; Walkington, I.; Lane, T.; Kiriakoulakis, K.; Dick, J.J. Rapid detection of microfibres in environmental samples using open-source visual recognition models. J. Hazard. Mater. 2024, 480, 135956. [Google Scholar] [CrossRef] [PubMed]
  20. Li, J.; Yuan, C.; Wang, X. Real-time instance-level detection of asphalt pavement distress combining space-to-depth (SPD) YOLO and omni-scale network (OSNet). Autom. Constr. 2023, 155, 105062. [Google Scholar] [CrossRef]
  21. Kyem, B.A.; Kofi, E.; Denteh, O.; Kofi, J.; Student, A.P.; Tutu, K.A.; Aboah, A. Advancing Pavement Distress Detection in Developing Countries: A Novel Deep Learning Approach with Locally-Collected Datasets. arXiv 2024, arXiv:2408.05649. [Google Scholar] [CrossRef]
  22. Guo, G.; Zhang, Z. Road damage detection algorithm for improved YOLOv5. Sci. Rep. 2022, 12, 15523. [Google Scholar] [CrossRef]
  23. Yuan, Q.; Shi, Y.; Li, M. A Review of Computer Vision-Based Crack Detection Methods in Civil Infrastructure: Progress and Challenges. Remote Sens. 2024, 16, 2910. [Google Scholar] [CrossRef]
  24. Ren, M.; Zhang, X.; Chen, X.; Zhou, B.; Feng, Z. YOLOv5s-M: A deep learning network model for road pavement damage detection from urban street-view imagery. Int. J. Appl. Earth Obs. Geoinf. 2023, 120, 103335. [Google Scholar] [CrossRef]
  25. Guo, K.; He, C.; Yang, M.; Wang, S. A pavement distresses identification method optimized for YOLOv5s. Sci. Rep. 2022, 12, 3542. [Google Scholar] [CrossRef]
  26. Wu, Z.; Zhang, Y.; Zhang, Z.; Lu, N.; Zhang, Z.; Zhang, F.; He, X. A Pavement Distress Detection Method Based on Yolov5 Model. In Proceedings of the 2022 41st Chinese Control Conference (CCC), Hefei, China, 25–27 July 2022; pp. 6564–6569. [Google Scholar] [CrossRef]
  27. Zuo, H.; Li, Z.; Gong, J.; Tian, Z. Intelligent Road Crack Detection and Analysis Based on Improved YOLOv8. In Proceedings of the 2025 8th International Conference on Advanced Algorithms and Control Engineering (ICAACE), Shanghai, China, 21–23 March 2025; pp. 1192–1195. [Google Scholar]
  28. de Souza, Á.M.; de Oliveira, C.E.; Decker, P.H.B.; Corrêa, A.L.D.S.C.; Amorim, G.E.R.; Fontenele, H.B. Defect detection using YOLOv8 for determining the condition of asphalt pavements. Re-vista ALCONPAT. Rev. Alconpat 2025, 15, 79–91. [Google Scholar] [CrossRef]
  29. Wang, S.; Cai, B.; Wang, W.; Li, Z.; Hu, W.; Yan, B.; Liu, X. Automated detection of pavement distress based on enhanced YOLOv8 and synthetic data with textured background modeling. Transp. Geotech. 2024, 48, 101304. [Google Scholar] [CrossRef]
  30. Aung, Y.Y.; Lwin, M.M. Real-Time Object Distance Estimation Based on YOLOv8 Using Webcam. In Proceedings of the 2024 IEEE Conference on Computer Applications (ICCA), Yangon, Myanmar, 16 March 2024; pp. 1–6. [Google Scholar] [CrossRef]
  31. Tian, Z.; Yang, F.; Yang, L.; Wu, Y.; Chen, J.; Qian, P. An Optimized YOLOv11 Framework for the Efficient Multi-Category Defect Detection of Concrete Surface. Sensors 2025, 25, 1291. [Google Scholar] [CrossRef] [PubMed]
  32. He, Z.; Wang, K.; Fang, T.; Su, L.; Chen, R.; Fei, X. Comprehensive Performance Evaluation of YOLOv11, YOLOv10, YOLOv9, YOLOv8 and YOLOv5 on Object Detection of Power Equipment. In Proceedings of the 2025 37th Chinese Control and Decision Conference (CCDC), Xiamen, China, 16–19 May 2025; pp. 1281–1286. [Google Scholar]
  33. Li, Q.; Wu, T.; Xu, T.; Lei, J.; Liu, J. A Novel YOLO Algorithm Integrating Attention Mechanisms and Fuzzy Information for Pavement Crack Detection. Int. J. Comput. Intell. Syst. 2025, 18, 158. [Google Scholar] [CrossRef]
  34. Sabouri, M.; Mohammadi, M. A novel approach for automatic asphalt pavement crack length estimation. Road Mater. Pavement Des. 2024, 25, 2530–2548. [Google Scholar] [CrossRef]
  35. Yuan, Y.; Ge, Z.; Su, X.; Guo, X.; Suo, T.; Liu, Y.; Yu, Q. Crack Length Measurement Using Convolutional Neural Networks and Image Processing. Sensors 2021, 21, 5894. [Google Scholar] [CrossRef]
  36. Wang, S.; Dong, Q.; Chen, X.; Chu, Z.; Li, R.; Hu, J.; Gu, X. Measurement of Asphalt Pavement Crack Length Using YOLO V5-BiFPN. J. Infrastruct. Syst. 2024, 30, 04024005. [Google Scholar] [CrossRef]
  37. Ibragimov, E.; Kim, Y.; Lee, J.H.; Cho, J.; Lee, J.-J. Automated Pavement Condition Index Assessment with Deep Learning and Image Analysis: An End-to-End Approach. Sensors 2024, 24, 2333. [Google Scholar] [CrossRef] [PubMed]
  38. Cai, G.; Tian, H.; Liu, L.; Liu, X.; Liu, S. Research progress of intelligent testing technology and evaluation methods for subgrade engineering. J. Road Eng. 2025, 5, 164–183. [Google Scholar] [CrossRef]
  39. Yang, X.; Huang, R.; Meng, Y.; Liang, J.; Rong, H.; Liu, Y.; Tan, S.; He, X.; Feng, Y. Overview of the application of Ground-Penetrating Radar, Laser, infrared thermal Imaging, and ultrasonic in nondestructive testing of road surface. Measurement 2023, 224, 113927. [Google Scholar] [CrossRef]
  40. Yang, Z.; Lan, X.; Wang, H. Comparative Analysis of YOLO Series Algorithms for UAV-Based Highway Distress Inspection: Performance and Application Insights. Sensors 2025, 25, 1475. [Google Scholar] [CrossRef]
  41. Baka. Road Damage dét Object Detection Model by Baka. Available online: https://universe.roboflow.com/baka-1ravj/road-damage-det (accessed on 24 July 2025).
  42. Sensor Street CRACK. Pavement Image Dataset II Model > Overview. Available online: https://universe.roboflow.com/sensor-street-crack/pavement-image-dataset-ii (accessed on 23 July 2025).
  43. SPL Project. PAVEMENT Model > Overview. Available online: https://universe.roboflow.com/spl-project/pavement-gvib5 (accessed on 23 July 2025).
  44. Infrastructure. Ycroad Model > Overview. Available online: https://universe.roboflow.com/infrastructure/ycroad (accessed on 23 July 2025).
  45. Mcmaster. Pavement Crack Detection Object Detection Model by Mcmaster. Available online: https://universe.roboflow.com/mcmaster-vkq5k/pavement-crack-detection-r4n7n (accessed on 23 July 2025).
  46. Team. Crack Object Detection Model by Team. Available online: https://universe.roboflow.com/team-eukwb/crack-ypk4t (accessed on 23 July 2025).
  47. TUM. Road_Defect Model > Overview. Available online: https://universe.roboflow.com/tum-z9rop/road_defect/dataset/3 (accessed on 23 July 2025).
  48. Neil Gogte Institute of Technology. Road Health and Safety Object Detection Dataset by Neil Gogte Institute of Technology. Available online: https://universe.roboflow.com/neil-gogte-institute-of-technology/road-health-and-safety (accessed on 23 July 2025).
  49. RoadSurvey. Road_Detection Object Detection Model by RoadSurvey. Available online: https://universe.roboflow.com/roadsurvey/road_detection-twdhw (accessed on 23 July 2025).
  50. Amirkabir University of Technology. AV Model > Overview. Available online: https://universe.roboflow.com/amirkabir-university-of-technology-qazbm/uav-ghnuu (accessed on 23 July 2025).
  51. Salehsane Crop Shode. SaneSalehCropped Model > Overview. Available online: https://universe.roboflow.com/salehsane-crop-shode/sanesalehcropped (accessed on 23 July 2025).
  52. Pavement Distresses Detection. Asphalt-Road-Pavement-Distresses-Detection Model > Overview. Available online: https://universe.roboflow.com/pavement-distresses-detection/asphalt-road-pavement-distresses-detection (accessed on 23 July 2025).
  53. New Workspace. Patch Dataset > Overview. Available online: https://universe.roboflow.com/new-workspace-lhsm6/patch-amn4a (accessed on 23 July 2025).
  54. Wijaya, K. 4 Class Kerusakan Jalan Dataset > Overview. Available online: https://universe.roboflow.com/krisna-wijaya-sxuzy/4-class-kerusakan-jalan (accessed on 23 July 2025).
  55. Priyadarshini, S. Damage Classification Dataset > Overview. Available online: https://universe.roboflow.com/suprava-priyadarshini/damage-classification-wt2us (accessed on 23 July 2025).
  56. Pothole. Pothole Detection System Object Detection Dataset by Pothole. Available online: https://universe.roboflow.com/pothole-sa6sb/pothole-detection-system-qaqxu (accessed on 23 July 2025).
  57. 2333 Model > Overview. Available online: https://universe.roboflow.com/ii-atajc/2333 (accessed on 23 July 2025).
  58. Psjsila Workspace. Road Crack Dataset > Overview. Available online: https://universe.roboflow.com/psjsilaworkspace/road-crack-n2zbd (accessed on 23 July 2025).
  59. Skripsi. Road Damage Model > Overview. Available online: https://universe.roboflow.com/skripsi-4ywsf/road-damage-zxiub (accessed on 24 July 2025).
  60. Sohar, C. Developing Deep Vision-Based Advanced Defects Detection System for Roads in Oman Object Detection Model by Cas Sohar. Available online: https://universe.roboflow.com/cas-sohar/developing-deep-vision-based-advanced-defects-detection-system-for-roads-in-oman (accessed on 23 July 2025).
  61. Forest Road Distress. Distress Dataset > Overview. Available online: https://universe.roboflow.com/forest-road-distress/distress (accessed on 23 July 2025).
  62. Vishwesh, A.K. Pothole Dataset > Overview. Available online: https://universe.roboflow.com/vishwesh-ak/pothole-r4gd5 (accessed on 23 July 2025).
  63. The American University of the Middle East. Pothole Detection Dataset > Overview. Available online: https://universe.roboflow.com/the-american-university-of-the-middle-east/pothole-detection-3uuq2 (accessed on 23 July 2025).
  64. Khanam, R.; Hussain, M. YOLOv11: An Overview of the Key Architectural Enhancements. arXiv 2024, arXiv:2410.17725. [Google Scholar] [CrossRef]
  65. Department of the Army. Pavement Maintenance Management; Technical Manual TM 5-623; Headquarters, Department of the Army: Washington, DC, USA, 1982. Available online: https://www.wbdg.org/FFC/ARMYCOE/COETM/ARCHIVES/tm_5_623.pdf (accessed on 23 July 2025).
Figure 1. The framework for automated PCI computation.
Automation 06 00067 g001
Figure 2. Roboflow Distribution Dataset: (a) image count by view type, (b) dataset distribution by view type, (c) dataset size distribution [40,41,42,43,44,45,46,47,48,49,50,51,52,53,54,55,56,57,58,59,60,61,62].
Automation 06 00067 g002
Figure 3. Sampled images from the dataset, representing the diversity of road conditions, including varied distress types (e.g., potholes, cracking, weathering) and environmental conditions (e.g., shadows, lighting variations, water pooling, snow).
Automation 06 00067 g003
Figure 4. Research approach shows the two interconnected phases: Phase 1 (Studies Frames) identifies pavement defects and measures severity/density; Phase 2 (Studies Segments) processes deduct values to calculate the PCI.
Automation 06 00067 g004
Figure 5. (a) Trained classification models, (b) per-class mAP@50 accuracy for YOLOv11 (Model 4).
Automation 06 00067 g005
Figure 6. Sample frame-level classifications using yolov11: (a) alligator cracking and pothole, (b) transverse/longitudinal, (c) sliddage, (d) patch, and (e) weathering.
Automation 06 00067 g006
Figure 7. Comparative segmentation outputs across models along with soft voting heatmap.
Automation 06 00067 g007
Figure 8. Comparison of width measurements: (a) using point-to-point edge detection, (b) skeletonization.
Automation 06 00067 g008
Figure 9. Measurements: (a) depth Map and location, (b) diameter.
Automation 06 00067 g009
Figure 10. Preprocessing pipeline for iPhone video frames.
Automation 06 00067 g010
Figure 11. Classification result showing (a) bounding box dimensions and detected class, (b) ensemble segmentation, (c) final segmentation and diameter measurement.
Automation 06 00067 g011
Figure 12. Representative multi-distress detections in segment 2. (a) pothole detection (Frame 11) with diameter and depth estimation. (b) transverse–longitudinal crack (Frame 48) with measured length and width. (c) distribution of detected frames by distress class. (d) weathering–raveling (Frame 93) with severity classification and ensemble segmentation.
Automation 06 00067 g012
Figure 13. (a1) Classification and segmentation of detected distress types within Segment 1; (b1) analysis of detected distresses in Segment 1; (a2) classification and segmentation of detected distress types within Segment 2; (b2) analysis of detected distresses in Segment 2.
Automation 06 00067 g013
Figure 14. Manual PCI validation using digitized code curves: (a) weathering–raveling deduct-value chart; (b) corrected-deduct chart [63].
Automation 06 00067 g014
Figure 15. Manual PCI validation using digitized code curves for Segment 2: (a) weathering–raveling deduct-value charts for all valid frames; (b) corrected-deduct chart.
Automation 06 00067 g015
Disclaimer/Publisher’s Note: The statements, opinions and data contained in all publications are solely those of the individual author(s) and contributor(s) and not of MDPI and/or the editor(s). MDPI and/or the editor(s) disclaim responsibility for any injury to people or property resulting from any ideas, methods, instructions or products referred to in the content.