
Insurance Payor Status and Outcomes in Foot and Ankle Surgery
 , , , , , and
Abstract
1. Introduction
2. Materials and Methods
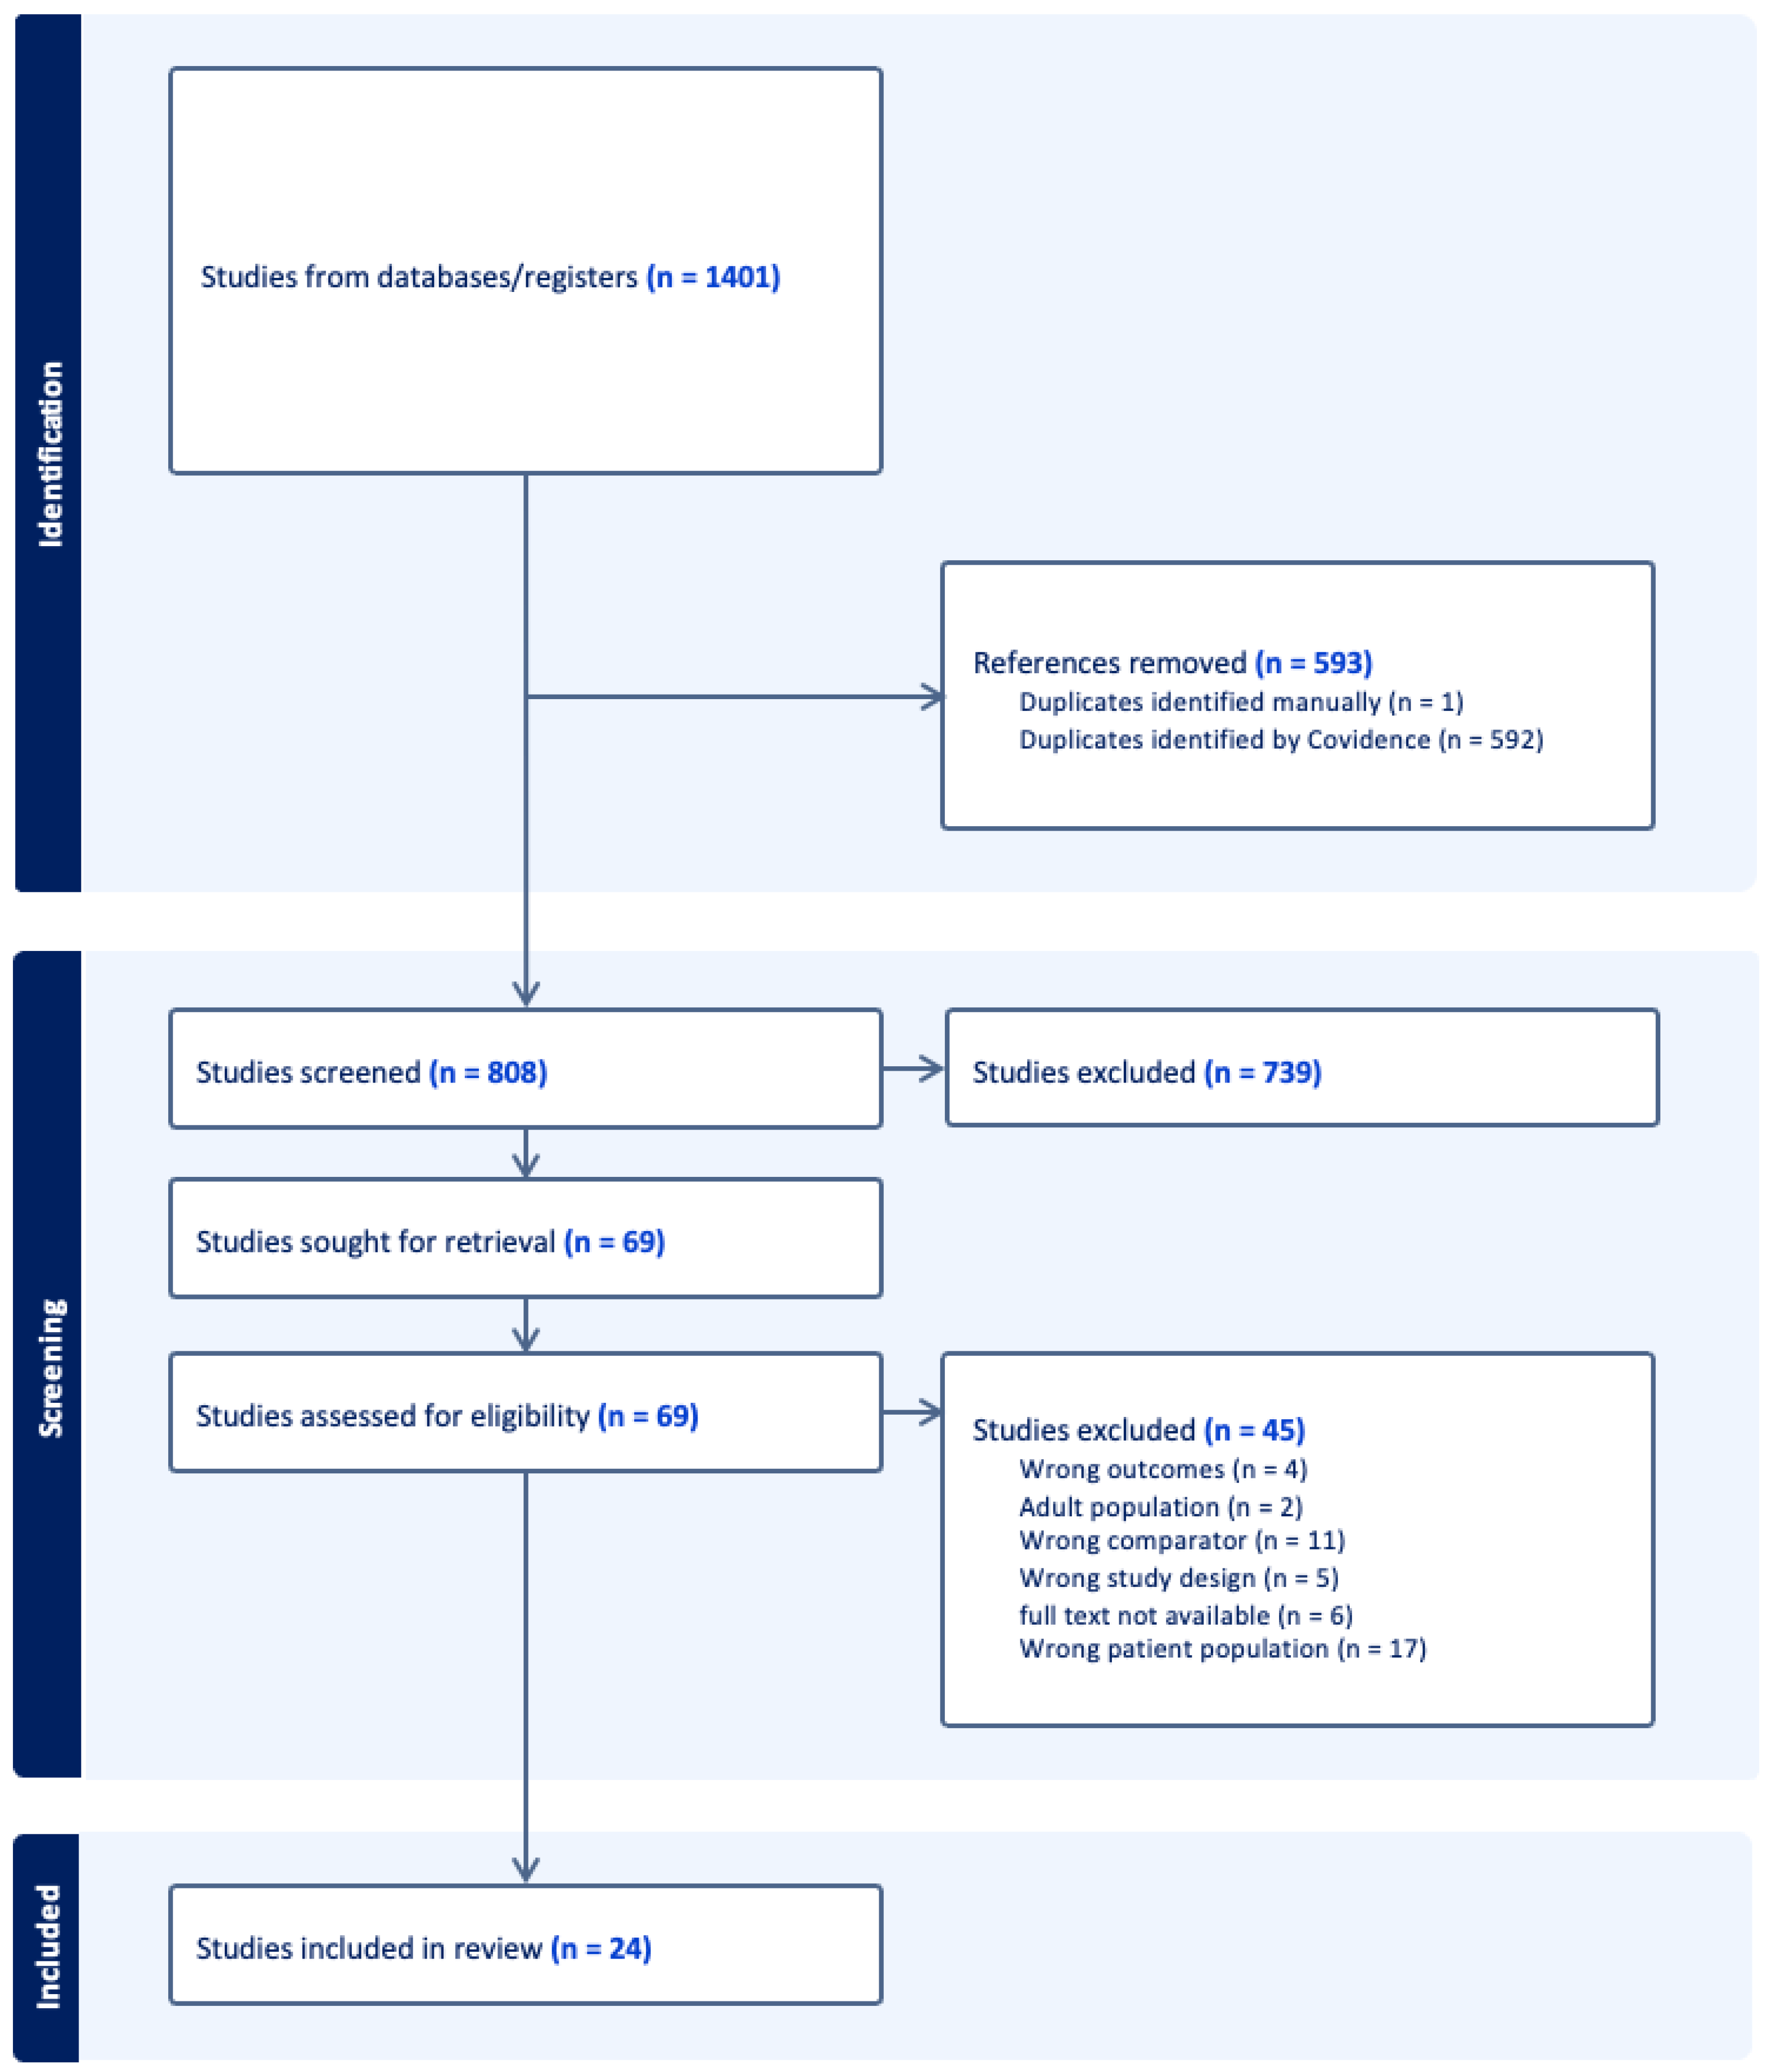
2.1. Literature Search and Screening
2.2. Meta-Analysis
2.3. Quality Appraisal and Risk of Bias
3. Results
3.1. Study and Cohort Characteristics
3.2. Descriptive Outcomes Analysis
3.2.1. Treatment Access
3.2.2. Treatment Course
3.2.3. Post-Operative Complications
3.2.4. Patient-Reported Outcomes
Pain
Functional Scores
Return to Work and Activity
Other Scoring
3.3. Meta-Analysis of Outcomes
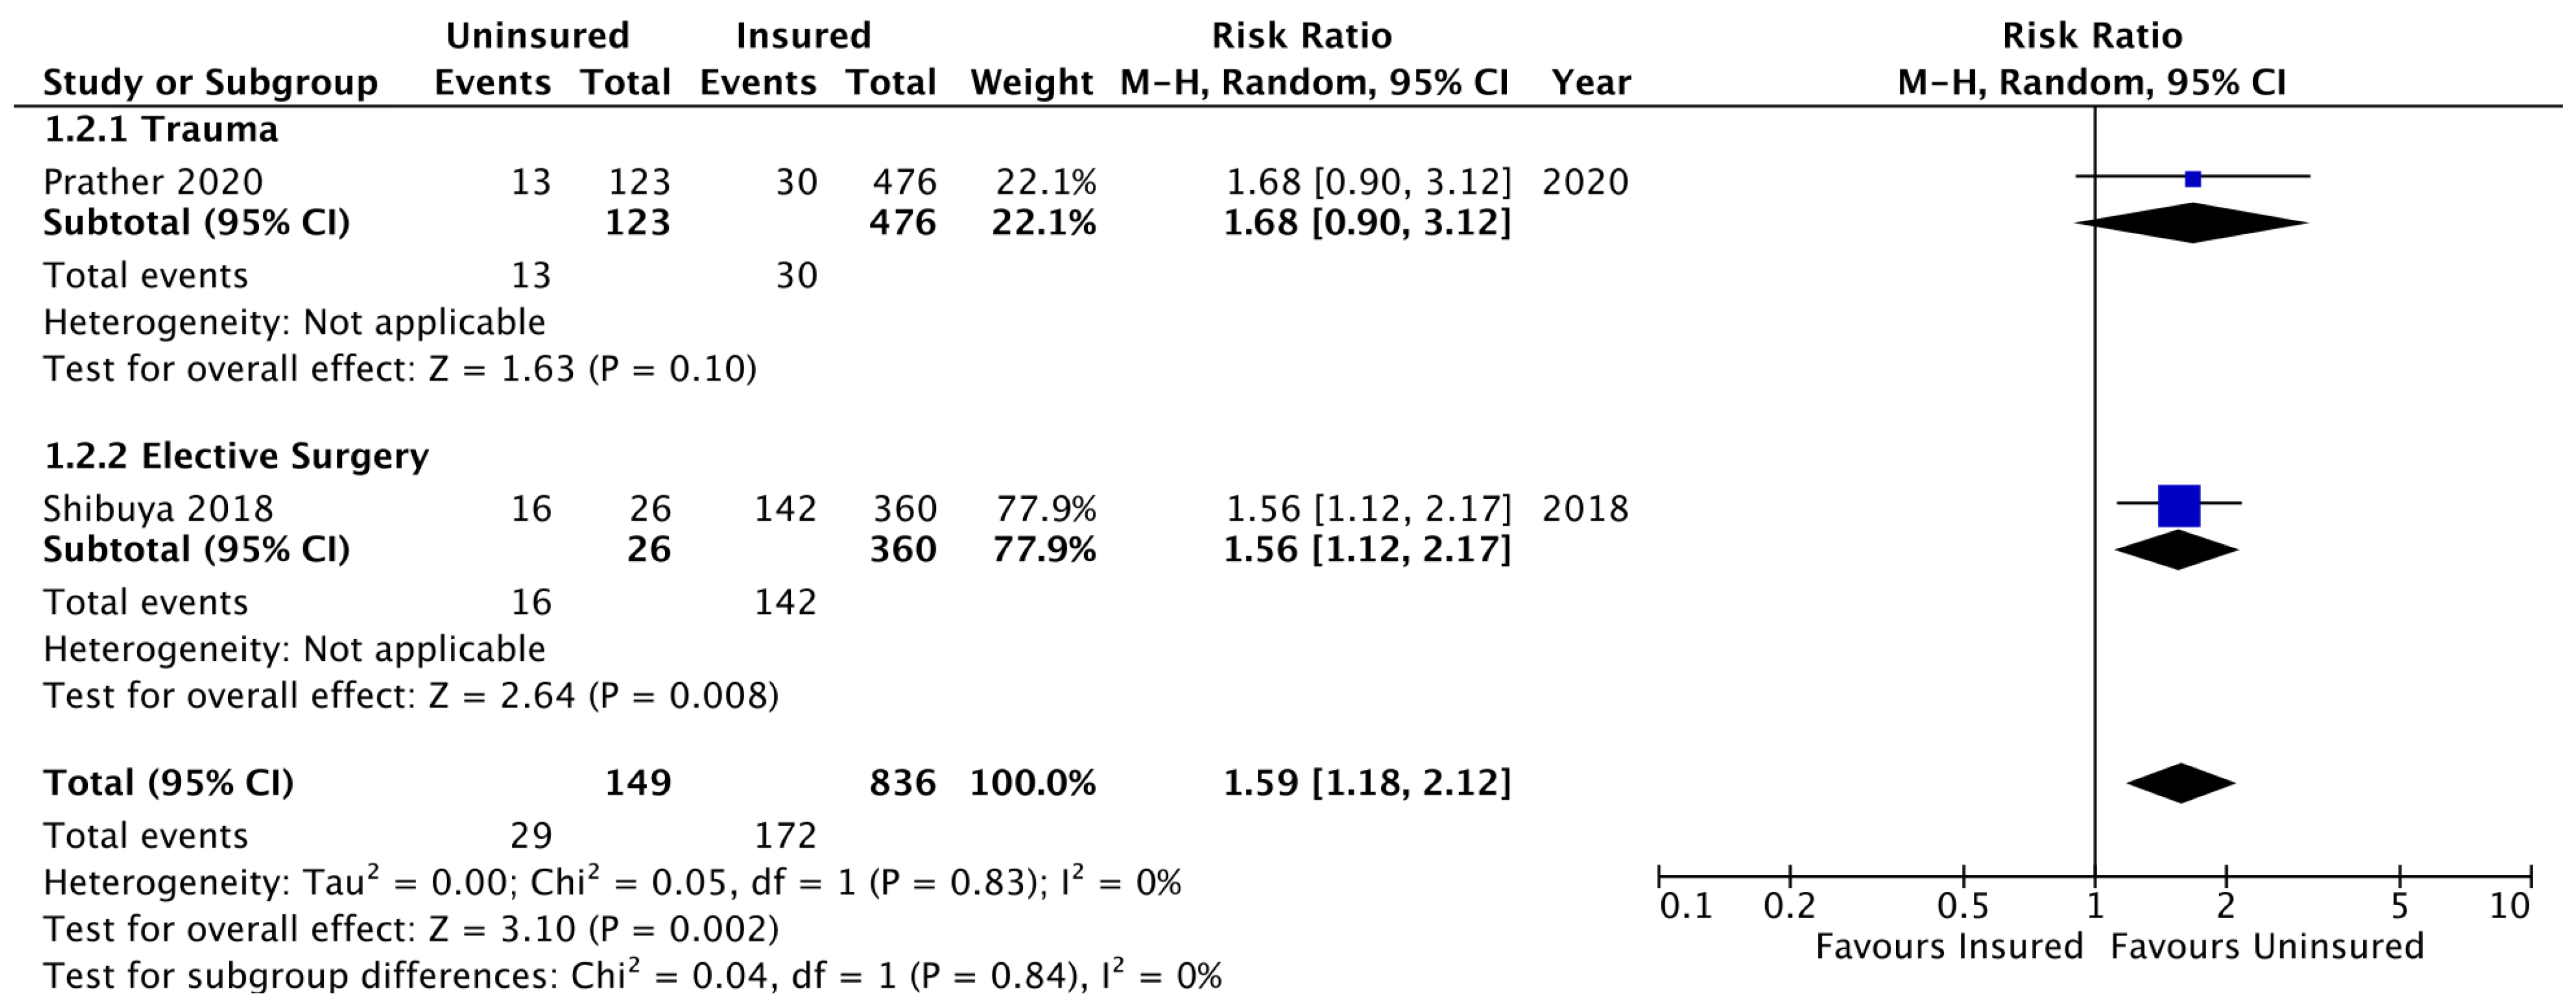
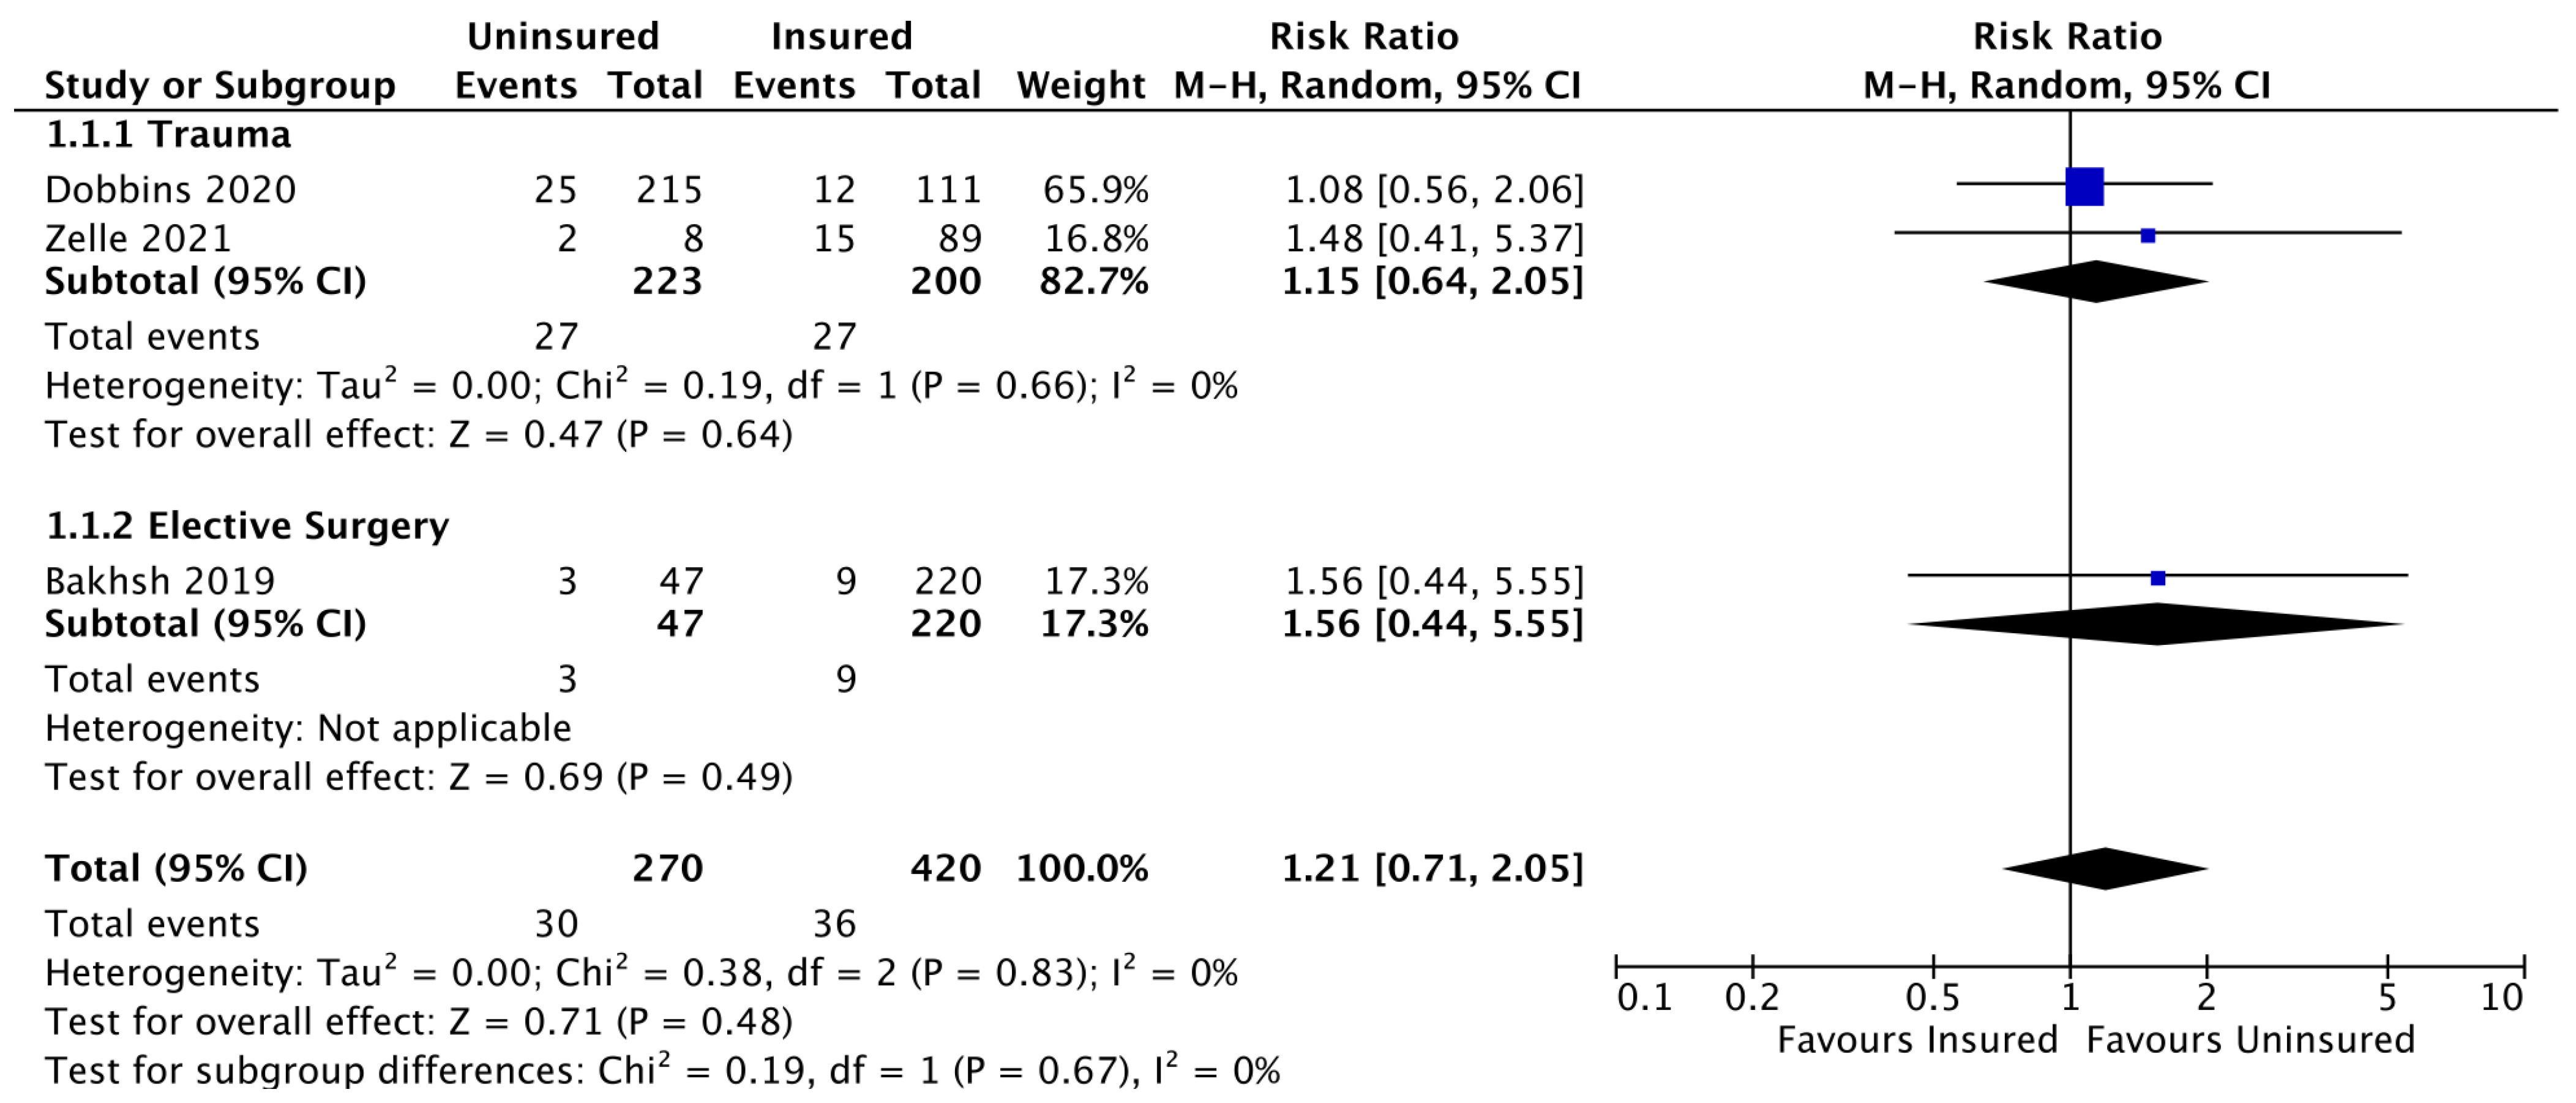
3.3.1. Insured vs. Uninsured
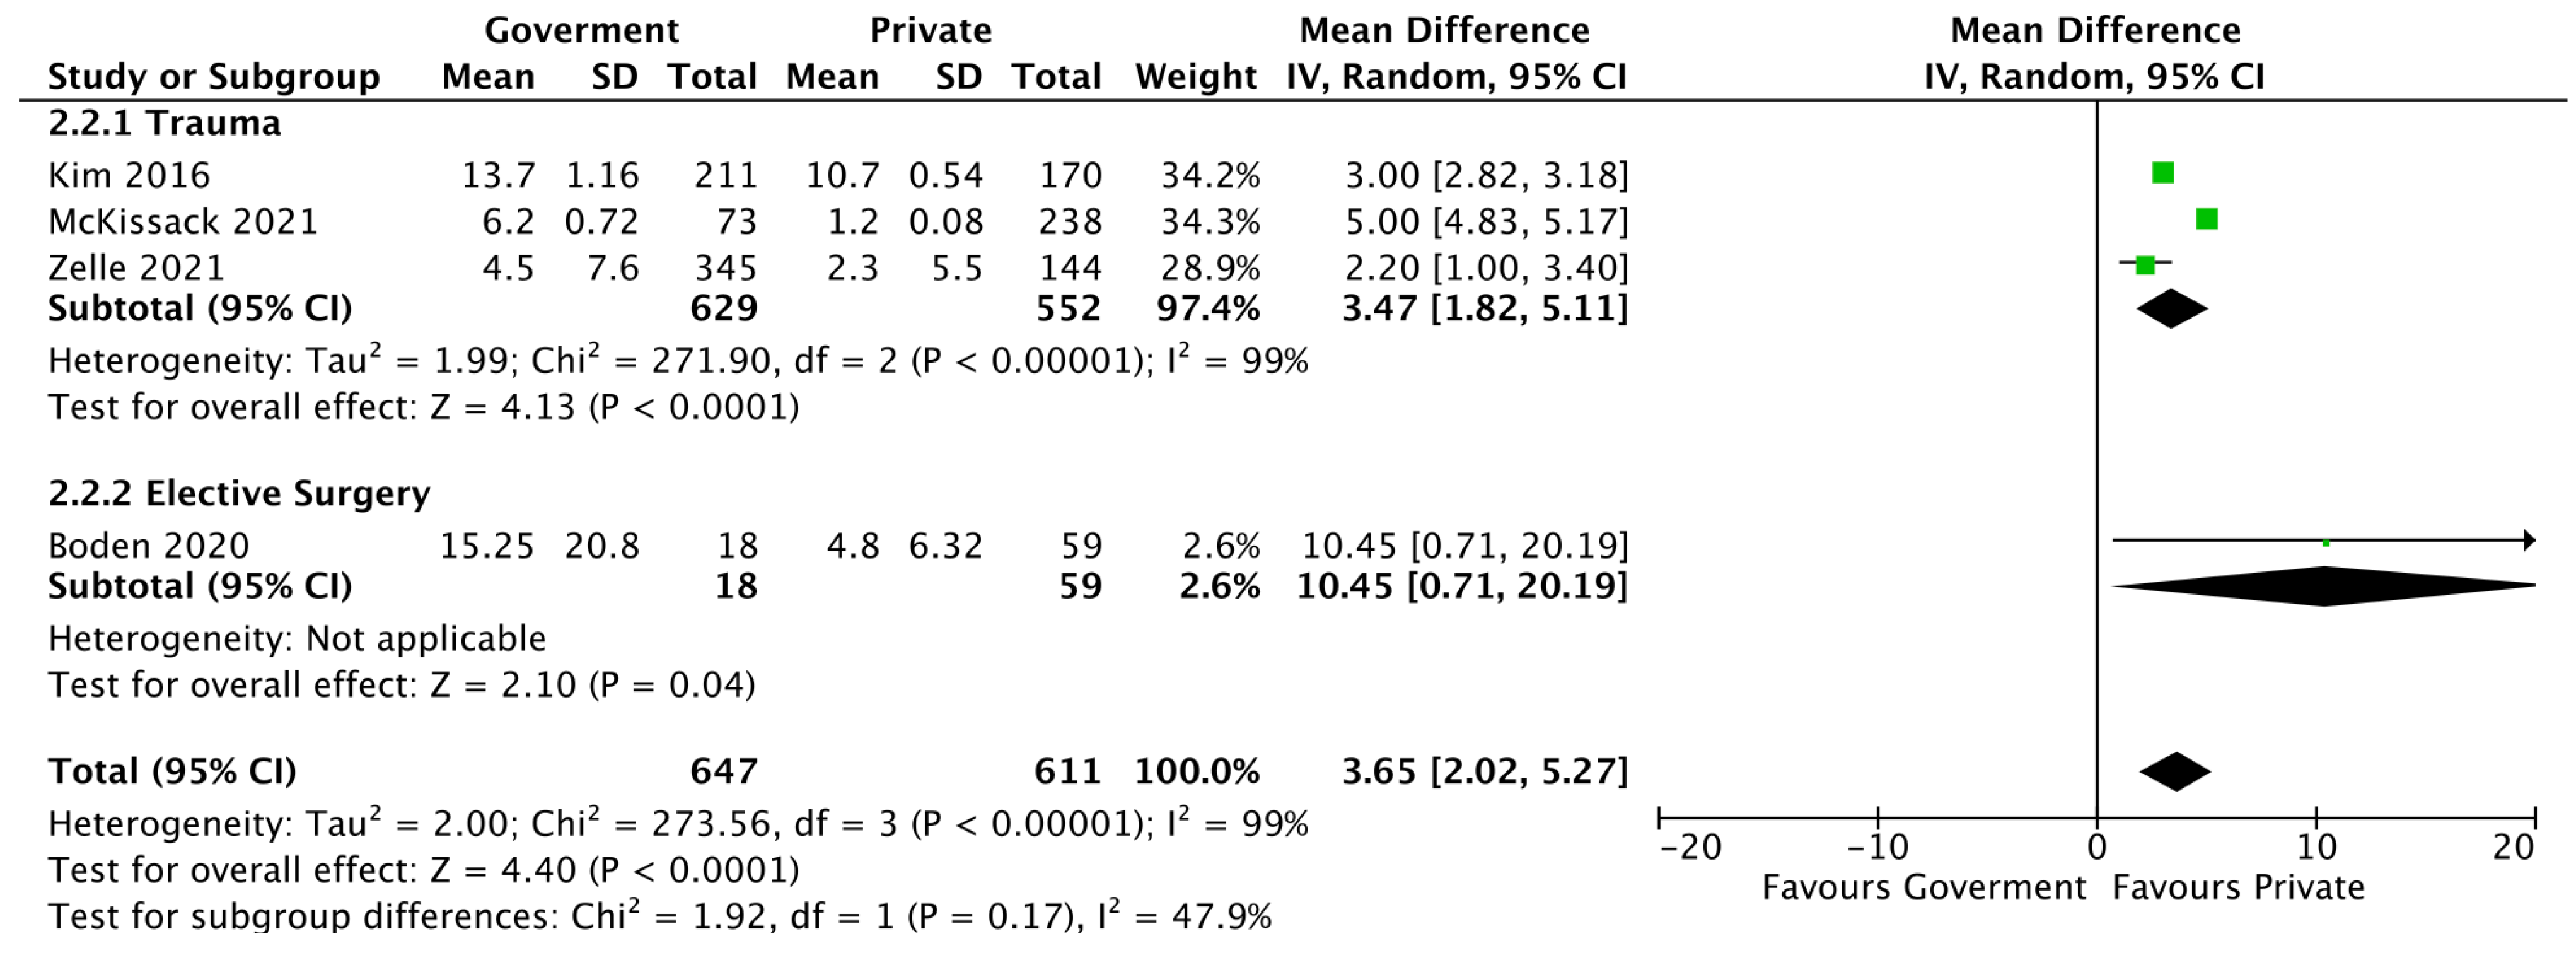
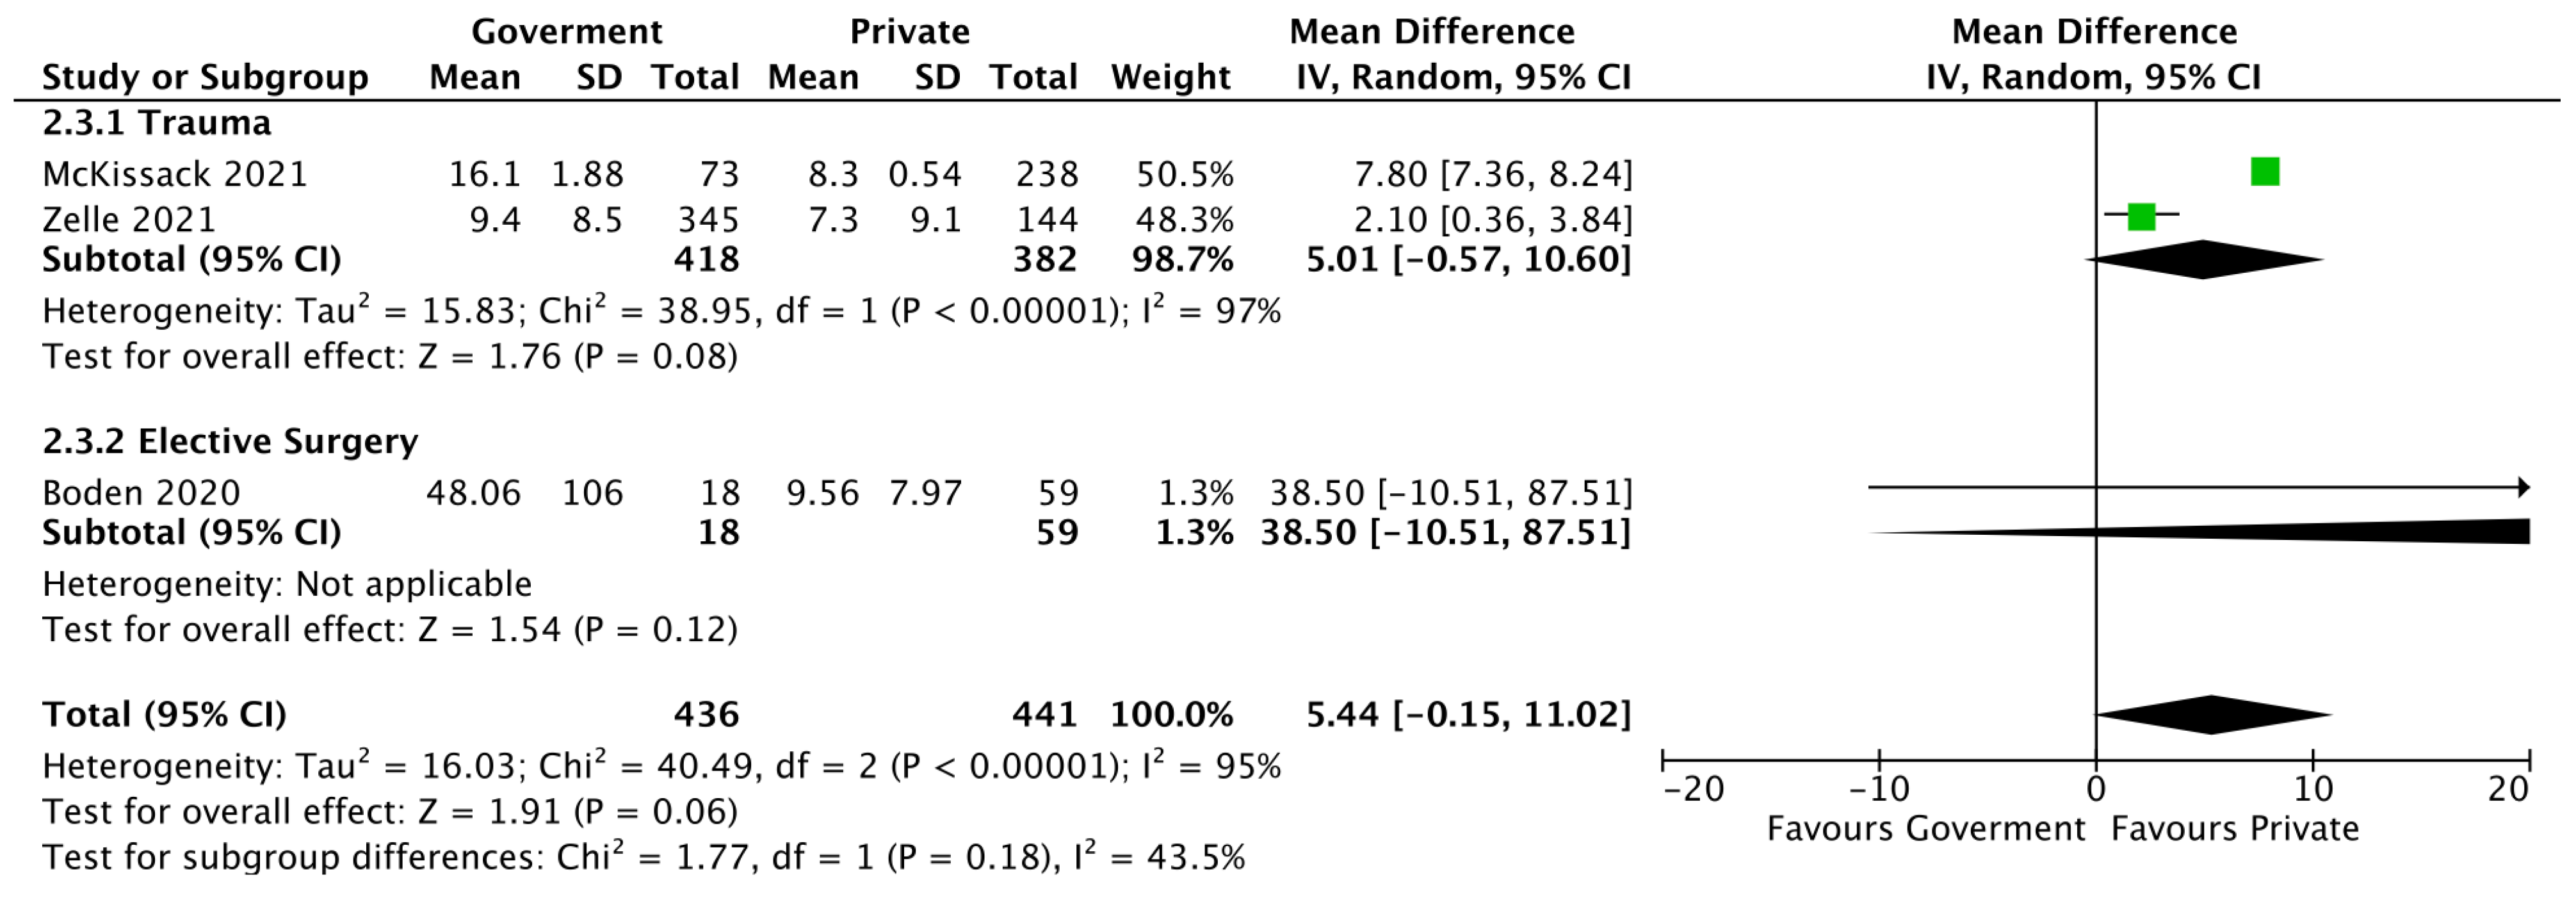
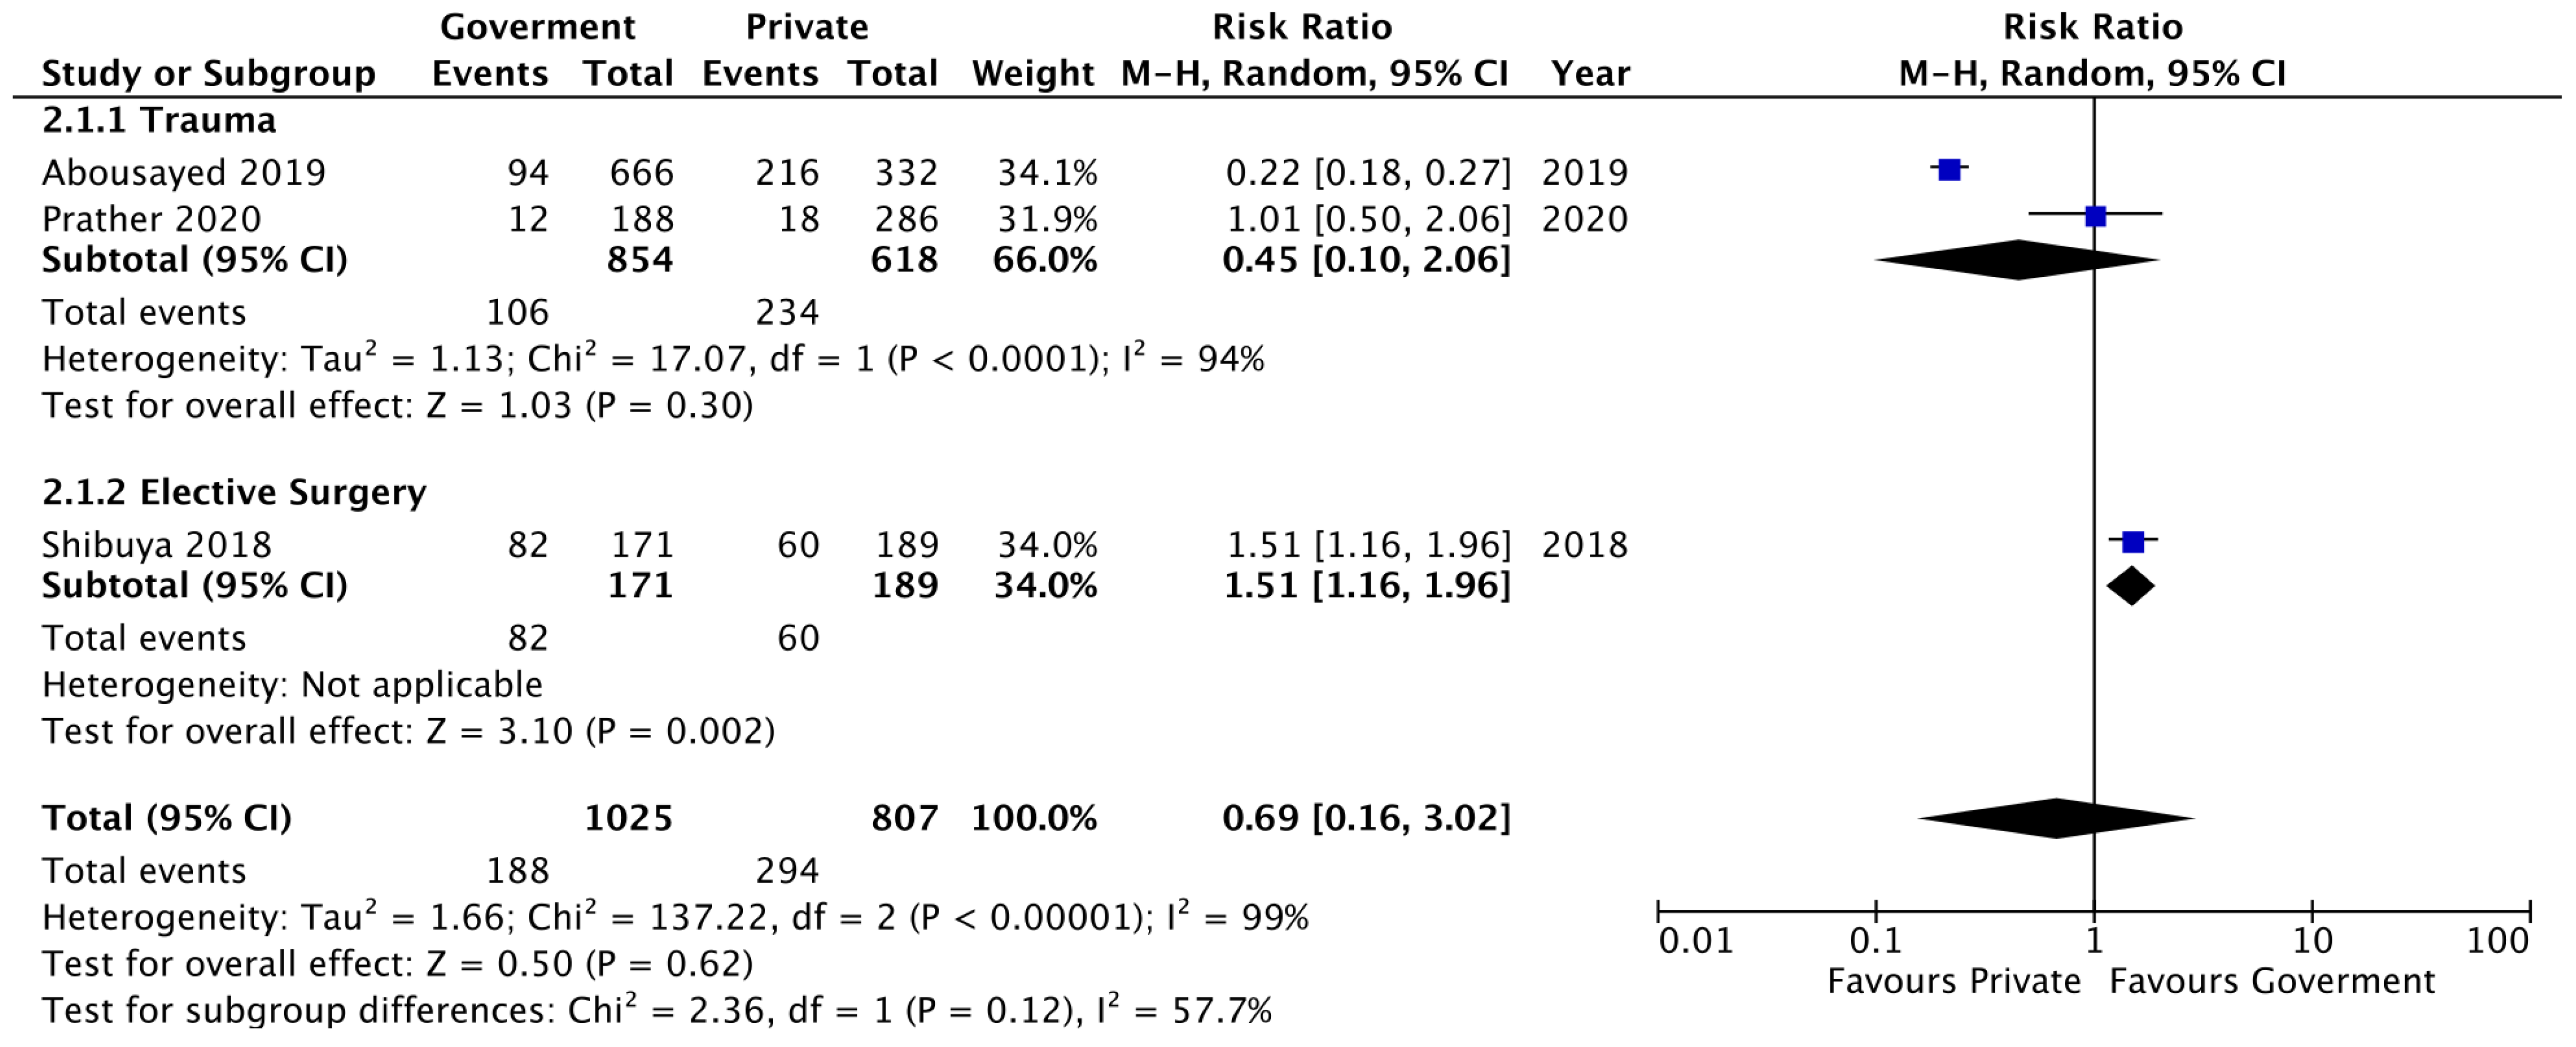
3.3.2. Government vs. Private Insurance
4. Discussion
4.1. Overview
4.2. Strengths and Limitations
5. Conclusions
Supplementary Materials
Author Contributions
Funding
Institutional Review Board Statement
Informed Consent Statement
Data Availability Statement
Conflicts of Interest
Appendix A
| Set # | Search Strategy | Results |
| #1 Insurance | “Insurance coverage”[Mesh] OR “Medicare”[Mesh] OR “Medicaid”[Mesh] OR “Insurance, Health”[Mesh] OR “Insurance”[Mesh] OR Medicaid[tiab] OR Medicare[tiab] OR insurance[tiab] OR insurances[tiab] OR insured[tiab] OR insurer[tiab] OR insurers[tiab] OR uninsured[tiab] OR underinsured[tiab] OR underinsurance[tiab] OR “workers comp”[tiab] OR “workers’ comp”[tiab] OR “Workers’ Compensation”[tiab] OR “Workers Compensation”[tiab] | 299,883 |
| #2 Ankle | ((“Ankle Fractures”[Mesh] OR “Ankle Joint”[Mesh] OR ankle[tiab] OR ankles[tiab] OR foot[tiab] OR feet[tiab]) AND (“Surgical Procedures, Operative”[mesh] OR “arthroplasty”[mesh] OR “surgery”[sh] OR surgery[tiab] OR surgeries[tiab] OR surgical[tiab] OR procedure[tiab] OR procedures[tiab] OR procedural[tiab] OR operation[tiab] OR operations[tiab] OR arthroplasty[tiab] OR arthroplasties[tiab] OR reoperate[tiab] OR reoperation[tiab])) OR “Arthroplasty, Replacement, Ankle”[Mesh] | 58,415 |
| #3 | #1 AND #2 | 360 |
| Validation string | 33546990 OR 27756868 OR 30628476 OR 31741131 OR 32769725 | 5/5 |
| Set # | Search Strategy | Results |
| #1 Insurance | ‘health insurance’/exp OR Medicaid:ti,ab OR Medicare:ti,ab OR insurance:ti,ab OR insurances:ti,ab OR insured:ti,ab OR insurer:ti,ab OR insurers:ti,ab OR uninsured:ti,ab OR underinsured:ti,ab OR underinsurance:ti,ab OR ‘workers comp’:ti,ab OR ‘Workers Compensation’:ti,ab | 416,521 |
| #2 Ankle | ((‘ankle fracture’/exp OR ‘ankle’/exp OR ankle:ti,ab OR ankles:ti,ab OR foot:ti,ab OR feet:ti,ab) AND (surgery:ti,ab OR surgeries:ti,ab OR surgical:ti,ab OR procedure:ti,ab OR procedures:ti,ab OR procedural:ti,ab OR operation:ti,ab OR operations:ti,ab OR arthroplasty:ti,ab OR arthroplasties:ti,ab)) OR ‘ankle arthroplasty’/exp | 57,858 |
| #3 | #1 AND #2 | 420 |
| Set # | Search Strategy | Results |
| #1 Insurance | TITLE-ABS-KEY(Medicaid OR Medicare OR insurance OR insurances OR insured OR insurer OR insurers OR uninsured OR underinsured OR underinsurance OR “workers comp” OR “workers’ comp” OR “Workers’ Compensation” OR “Workers Compensation”) | 41,9058 |
| #2 Ankle | TITLE-ABS-KEY((ankle OR ankles OR foot OR feet) AND (surgery OR surgeries OR surgical OR procedure OR procedures OR procedural OR operation OR operations OR arthroplasty OR arthroplasties)) | 95,384 |
| #3 | #1 AND #2 | 567 |
| Set # | Search Strategy | Results |
| #1 Insurance | DE “HEALTH insurance” OR (TI “Medicaid” OR AB “Medicaid”) OR (TI “Medicare” OR AB “Medicare”) OR (TI “insurance” OR AB “insurance”) OR (TI “insurances” OR AB “insurances”) OR (TI “insured” OR AB “insured”) OR (TI “insurer” OR AB “insurer”) OR (TI “insurers” OR AB “insurers”) OR (TI “uninsured” OR AB “uninsured”) OR (TI underinsured OR AB underinsured) OR (TI underinsurance OR AB underinsurance) OR (TI “workers comp” OR AB “workers comp”) OR (TI “workers’ comp” OR AB “workers’ comp”) OR (TI “Workers’ Compensation” OR AB “Workers’ Compensation”) OR (TI “Workers Compensation” OR AB “Workers Compensation”) | 11,617 |
| #2 Ankle | ((DE “ANKLE” OR DE “ANKLE fractures” OR (TI “ankle” OR AB “ankle”) OR (TI “ankles” OR AB “ankles”) OR (TI “foot” OR AB “foot”) OR (TI “feet” OR AB “feet”)) AND (DE “SURGERY” OR (TI “surgery” OR AB “surgery”) OR (TI “surgeries” OR AB “surgeries”) OR (TI “surgical” OR AB “surgical”) OR (TI “procedure” OR AB “procedure”) OR (TI “procedures” OR AB “procedures”) OR (TI “procedural” OR AB “procedural”) OR (TI “operation” OR AB “operation”) OR (TI “operations” OR AB “operations”) OR (TI “arthroplasty” OR AB “arthroplasty”) OR (TI “arthroplasties” OR AB “arthroplasties”))) | 6325 |
| #3 | S1 AND S2 | 54 |
References
- Brodeur, P.G.; Walsh, D.F.; Modest, J.M.; Salameh, M.; Licht, A.H.; Hartnett, D.A.; Gil, J.; Cruz, A.I., Jr.; Hsu, R.Y. Trends and Reported Complications in Ankle Arthroplasty and Ankle Arthrodesis in the State of New York, 2009-2018. Foot Ankle Orthop. 2022, 7, 24730114221117150. [Google Scholar] [CrossRef] [PubMed]
- Burton, A.; Aynardi, M.C.; Aydogan, U. Demographic Distribution of Foot and Ankle Surgeries Among Orthopaedic Surgeons and Podiatrists: A 10-Year Database Retrospective Study. Foot Ankle Spec. 2021, 14, 206–212. [Google Scholar] [CrossRef]
- Werner, B.C.; Burrus, M.T.; Park, J.S.; Perumal, V.; Gwathmey, F.W. Trends in Ankle Arthroscopy and Its Use in the Management of Pathologic Conditions of the Lateral Ankle in the United States: A National Database Study. Arthroscopy 2015, 31, 1330–1337. [Google Scholar] [CrossRef]
- Goldfarb, S.I.; Xu, A.L.; Gupta, A.; Mun, F.; Durand, W.M.; Gonzalez, T.A.; Aiyer, A.A. How Have Patient Out-of-pocket Costs for Common Outpatient Orthopaedic Foot and Ankle Surgical Procedures Changed Over Time? A Retrospective Study From 2010 to 2020. Clin. Orthop. Relat. Res. 2024, 482, 313–322. [Google Scholar] [CrossRef]
- Schmerler, J.; Dhanjani, S.A.; Wenzel, A.; Kurian, S.J.; Srikumaran, U.; Ficke, J.R. Racial, Socioeconomic, and Payer Status Disparities in Utilization of Total Ankle Arthroplasty Compared to Ankle Arthrodesis. J. Foot Ankle Surg. 2023, 62, 928–932. [Google Scholar] [CrossRef]
- Singh, J.A.; Ramachandran, R. Racial disparities in total ankle arthroplasty utilization and outcomes. Arthritis Res. Ther. 2015, 17, 70. [Google Scholar] [CrossRef]
- Smedley, B.D.; Stith, A.Y.; Nelson, A.R. (Eds.) Unequal Treatment: Confronting Racial and Ethnic Disparities in Health Care; National Academies Press: Washington, DC, USA, 2003. [Google Scholar]
- Alvarez, P.M.; McKeon, J.F.; Spitzer, A.I.; Krueger, C.A.; Pigott, M.; Li, M.; Vajapey, S.P. Socioeconomic factors affecting outcomes in total knee and hip arthroplasty: A systematic review on healthcare disparities. Arthroplasty 2022, 4, 36. [Google Scholar] [CrossRef]
- Haider, A.H.; Chang, D.C.; Efron, D.T.; Haut, E.R.; Crandall, M.; Cornwell, E.E., 3rd. Race and insurance status as risk factors for trauma mortality. Arch. Surg. 2008, 143, 945–949. [Google Scholar] [CrossRef] [PubMed]
- Nathens, A.B.; Maier, R.V.; Copass, M.K.; Jurkovich, G.J. Payer status: The unspoken triage criterion. J. Trauma 2001, 50, 776–783. [Google Scholar] [CrossRef]
- Rosen, H.; Saleh, F.; Lipsitz, S.; Rogers, S.O., Jr.; Gawande, A.A. Downwardly mobile: The accidental cost of being uninsured. Arch. Surg. 2009, 144, 1006–1011. [Google Scholar] [CrossRef] [PubMed]
- Resad Ferati, S.; Parisien, R.L.; Joslin, P.; Knapp, B.; Li, X.; Curry, E.J. Socioeconomic Status Impacts Access to Orthopaedic Specialty Care. JBJS Rev. 2022, 10, e21.00139. [Google Scholar] [CrossRef] [PubMed]
- Lakomkin, N.; Hutzler, L.; Bosco, J.A., 3rd. The Relationship Between Medicaid Coverage and Outcomes Following Total Knee Arthroplasty: A Systematic Review. JBJS Rev. 2020, 8, e0085. [Google Scholar] [CrossRef]
- Russo, F.; De Salvatore, S.; Ambrosio, L.; Vadala, G.; Fontana, L.; Papalia, R.; Rantanen, J.; Iavicoli, S.; Denaro, V. Does Workers’ Compensation Status Affect Outcomes after Lumbar Spine Surgery? A Systematic Review and Meta-Analysis. Int. J. Environ. Res. Public Health 2021, 18, 6165. [Google Scholar] [CrossRef] [PubMed]
- Ziedas, A.; Abed, V.; Swantek, A.; Cross, A.; Chaides, S.; Rahman, T.; Makhni, E.C. Social Determinants of Health Influence Access to Care and Outcomes in Patients Undergoing Anterior Cruciate Ligament Reconstruction: A Systematic Review. Arthroscopy 2022, 38, 583–594.e4. [Google Scholar] [CrossRef] [PubMed]
- Merrill, R.K.; Ferrandino, R.M.; Hoffman, R.; Ndu, A.; Shaffer, G.W. Identifying Risk Factors for 30-Day Readmissions After Triple Arthrodesis Surgery. J. Foot Ankle Surg. 2019, 58, 109–113. [Google Scholar] [CrossRef]
- Slim, K.; Nini, E.; Forestier, D.; Kwiatkowski, F.; Panis, Y.; Chipponi, J. Methodological index for non-randomized studies (minors): Development and validation of a new instrument. ANZ J. Surg. 2003, 73, 712–716. [Google Scholar] [CrossRef]
- Singh, J.A.; Cleveland, J.D. Age, race, comorbidity, and insurance payer type are associated with outcomes after total ankle arthroplasty. Clin. Rheumatol. 2020, 39, 881–890. [Google Scholar] [CrossRef]
- Zelle, B.A.; Johnson, T.R.; Ryan, J.C.; Martin, C.W.; Cabot, J.H.; Griffin, L.P.; Bullock, T.S.; Ahmad, F.; Brady, C.I.; Shah, K. Fate of the Uninsured Ankle Fracture: Significant Delays in Treatment Result in an Increased Risk of Surgical Site Infection. J. Orthop. Trauma 2021, 35, 154–159. [Google Scholar] [CrossRef]
- Prather, J.; Alexander, B.; Halstrom, J.; Sutherland, C.; Patel, A.; McGwin, G.; Shah, A. Factors affecting emergency department visits, readmissions, and reoperations within 30 days of ankle fracture surgery- an institutional retrospective study. Injury 2020, 51, 2698–2702. [Google Scholar] [CrossRef]
- Ogawa, B.K.; Thordarson, D.B.; Zalavras, C. Peroneal tendon subluxation repair with an indirect fibular groove deepening technique. Foot Ankle Int. 2007, 28, 1194–1197. [Google Scholar] [CrossRef]
- McKissack, H.M.; Viner, G.C.; McMurtrie, J.T.; Alexander, B.K.; Jha, A.J.; Wilson, J.T.; Shah, A.B. Does Insurance Status Affect Access to Care Among Ankle Fracture Patients? An Institutional Retrospective Study. J. Foot Ankle Surg. 2021, 60, 520–522. [Google Scholar] [CrossRef]
- Labrum, J.T.t.; Paziuk, T.; Rihn, T.C.; Hilibrand, A.S.; Vaccaro, A.R.; Maltenfort, M.G.; Rihn, J.A. Does Medicaid Insurance Confer Adequate Access to Adult Orthopaedic Care in the Era of the Patient Protection and Affordable Care Act? Clin. Orthop. Relat. Res. 2017, 475, 1527–1536. [Google Scholar] [CrossRef] [PubMed]
- Komenda, G.A.; Ferkel, R.D. Arthroscopic findings associated with the unstable ankle. Foot Ankle Int. 1999, 20, 708–713. [Google Scholar] [CrossRef]
- Kim, C.Y.; Wiznia, D.H.; Roth, A.S.; Walls, R.J.; Pelker, R.R. Survey of Patient Insurance Status on Access to Specialty Foot and Ankle Care Under the Affordable Care Act. Foot Ankle Int. 2016, 37, 776–781. [Google Scholar] [CrossRef]
- Hutchinson, F., 3rd; Huebner, M.K. Treatment of os calcis fractures by open reduction and internal fixation. Foot Ankle Int. 1994, 15, 225–232. [Google Scholar] [CrossRef]
- Gaedke, I.E.; Wiebking, U.; O’Loughlin, P.F.; Krettek, C.; Gaulke, R. Clinical and Radiological Mid- to Long-term Outcomes Following Ankle Fusion. In Vivo 2018, 32, 1463–1471. [Google Scholar] [CrossRef]
- Flemister, A.S., Jr.; Infante, A.F.; Sanders, R.W.; Walling, A.K. Subtalar arthrodesis for complications of intra-articular calcaneal fractures. Foot Ankle Int. 2000, 21, 392–399. [Google Scholar] [CrossRef]
- Dooley, P.; Buckley, R.; Tough, S.; McCormack, B.; Pate, G.; Leighton, R.; Petrie, D.; Galpin, B. Bilateral calcaneal fractures: Operative versus nonoperative treatment. Foot Ankle Int. 2004, 25, 47–52. [Google Scholar] [CrossRef] [PubMed]
- Dobbins, A.B.; Krumme, J.; Gaddis, M.; Park, S.H.; Varghese, M.; Brancato, M.R.; Shaw, C.M.; Wambach, K. Insurance Does Not Affect Adverse Events While Awaiting Surgery for Ankle Trauma in One System. West. J. Emerg. Med. 2020, 21, 1242–1248. [Google Scholar] [CrossRef] [PubMed]
- Deister, J.; Cothern, B.G.; Williams, C.; Froehle, A.W.; Laughlin, R.T. Factors Predicting Length of Hospital Stay and Extended Care Facility Admission After Hindfoot Arthrodesis Procedures. J. Foot Ankle Surg. 2017, 56, 805–812. [Google Scholar] [CrossRef]
- Csizy, M.; Buckley, R.; Tough, S.; Leighton, R.; Smith, J.; McCormack, R.; Pate, G.; Petrie, D.; Galpin, R. Displaced intra-articular calcaneal fractures: Variables predicting late subtalar fusion. J. Orthop. Trauma 2003, 17, 106–112. [Google Scholar] [CrossRef] [PubMed]
- Cherney, S.M.; Cosgrove, C.T.; Spraggs-Hughes, A.G.; McAndrew, C.M.; Ricci, W.M.; Gardner, M.J. Functional Outcomes of Syndesmotic Injuries Based on Objective Reduction Accuracy at a Minimum 1-Year Follow-Up. J. Orthop. Trauma 2018, 32, 43–51. [Google Scholar] [CrossRef]
- Bui, G.; Gao, Y.; Glass, N.; Cychosz, C.; Marsh, J.L.; Phisitkul, P. Subsequent Pain or Injury After Foot and Ankle Surgery in Patients Receiving Workers’ Compensation. Foot Ankle Int. 2020, 41, 17–24. [Google Scholar] [CrossRef]
- Boden, A.L.; Geller, J.S.; Granger, C.J.; Summers, S.H.; Kaplan, J.; Aiyer, A. Achilles Injury and Access to Care in South Florida. Foot Ankle Spec. 2022, 15, 105–112. [Google Scholar] [CrossRef]
- Shibuya, N.; Patel, H.; Graney, C.; Jupiter, D.C. Factors associated with emergency room visits within 30 days of outpatient foot and ankle surgeries. Bayl. Univ. Med. Cent. Proc. 2018, 31, 157–160. [Google Scholar] [CrossRef] [PubMed][Green Version]
- Bazaz, R.; Ferkel, R.D. Results of endoscopic plantar fascia release. Foot Ankle Int. 2007, 28, 549–556. [Google Scholar] [CrossRef] [PubMed]
- Bakhsh, W.; Childs, S.; Oh, I.; Flemister, S.; Baumhauer, J.; Ketz, J. Evaluating Patients for Elective Outpatient Foot and Ankle Surgery: Insurance as a Predictor of Patient Outcomes. Foot Ankle Spec. 2019, 12, 522–529. [Google Scholar] [CrossRef]
- Amendola, A.; Petrik, J.; Webster-Bogaert, S. Ankle arthroscopy: Outcome in 79 consecutive patients. Arthroscopy 1996, 12, 565–573. [Google Scholar] [CrossRef]
- Abdurrob, A.; Smith, J.T. The Effect of Health Insurance Coverage on Orthopaedic Patient-reported Outcome Measures. J. Am. Acad. Orthop. Surg. 2020, 28, e729–e734. [Google Scholar] [CrossRef]
- Abousayed, M.M.; Johnson, C.K.; Moral, M.; Sternbach, S.; Rosenbaum, A.J. Trends in Urgent Care Utilization Following Ankle Fracture Fixation. Foot Ankle Int. 2019, 40, 218–223. [Google Scholar] [CrossRef]
- Greene, B.D.; Lange, J.K.; Heng, M.; Melnic, C.M.; Smith, J.T. Correlation Between Patient-Reported Outcome Measures and Health Insurance Provider Types in Patients with Hip Osteoarthritis. J. Bone Jt. Surg. Am. 2021, 103, 1521–1530. [Google Scholar] [CrossRef]
- Koljonen, P.; Chong, C.; Yip, D. Difference in outcome of shoulder surgery between workers’ compensation and nonworkers’ compensation populations. Int. Orthop. 2009, 33, 315–320. [Google Scholar] [CrossRef]
- Martinazzi, B.J.; Kirchner, G.J.; Nam, H.H.; Mansfield, K.; Dopke, K.; Ptasinski, A.; Adeyemo, A.; Walley, K.C.; Aynardi, M.C. Improving Randomized-Controlled Trials in Foot and Ankle Orthopaedics: The Need to Include Sociodemographic Patient Data. Foot Ankle Spec. 2023, 18, 389–393. [Google Scholar] [CrossRef] [PubMed]
- Miles, D.T.; Goodwin, T.M.; Wilson, A.W.; Doty, J.F. Workers’ Compensation: The Burden on Healthcare Resource Utilization After Foot and Ankle Surgery. J. Am. Acad. Orthop. Surg. Glob. Res. Rev. 2023, 7, e23.00211. [Google Scholar] [CrossRef] [PubMed]
- Halawi, M.J.; Cote, M.P.; Savoy, L.; Williams, V.J.; Lieberman, J.R. The Effect of Payer Type on Patient-Reported Outcomes in Total Joint Arthroplasty Is Modulated by Baseline Patient Characteristics. J. Arthroplast. 2019, 34, 1072–1075. [Google Scholar] [CrossRef] [PubMed]
- Scott, M.T.; Boden, A.L.; Boden, S.A.; Boden, L.M.; Farley, K.X.; Gottschalk, M.B. Medicaid Payer Status Is a Predictor of Early Postoperative Pain Following Upper Extremity Procedures. Hand 2022, 17, 162–169. [Google Scholar] [CrossRef]
- Shau, D.; Shenvi, N.; Easley, K.; Smith, M.; Bradbury, T.; Guild, G., 3rd. Medicaid Payer Status Is Associated with Increased 90-Day Morbidity and Resource Utilization Following Primary Total Hip Arthroplasty: A Propensity-Score-Matched Analysis. J. Bone Jt. Surg. Am. 2018, 100, 2041–2049. [Google Scholar] [CrossRef]
- Dawes, A.M.; Farley, K.X.; Godfrey, W.S.; Karzon, A.L.; Gottschalk, M.B.; Wagner, E.R. Medicaid payer status is associated with increased 90-day morbidity and resource utilization following primary shoulder arthroplasty: A propensity score-matched analysis. J. Shoulder Elb. Surg. 2023, 32, 104–110. [Google Scholar] [CrossRef]
- Kutzer, K.M.; Kiwinda, L.V.; Yang, D.; Mitchell, J.K.; Luo, E.J.; Harman, E.J.; Hendren, S.; Bradley, K.E.; Lau, B.C. Insurance Payor Status and Outcomes in Pediatric Sports-Related Injuries: A Rapid Review. Clin. Pract. 2025, 15, 52. [Google Scholar] [CrossRef]
- Page, M.J.; McKenzie, J.E.; Bossuyt, P.M.; Boutron, I.; Hoffmann, T.C.; Mulrow, C.D.; Shamseer, L.; Tetzlaff, J.M.; Akl, E.A.; Brennan, S.E.; et al. The PRISMA 2020 statement: An updated guideline for reporting systematic reviews. BMJ 2021, 372, n71. [Google Scholar] [CrossRef]





| Author (Year) | Study Design | Insurance Type | Surgical Operation or Patient Cohort | Number of Subjects and/or Feet/Ankles | Age in Years: Mean (Range or SD) | Quality Assessment |
|---|---|---|---|---|---|---|
| Singh (2020) [18] | Retrospective | Medicaid, Medicare, Private, Self, Other | TAA | 6280 patients | 62 | 10 |
| Zelle (2021) [19] | Retrospective | Insured, Uninsured | Ankle ORIF | 619 patients | 40.7 | 12 |
| Prather (2020) [20] | Retrospective | Government, Private, Uninsured | Ankle ORIF | 596 patients | <45 versus >45 | 12 |
| Ogawa (2007) [21] | Prospective | Workers Compensation, Non-Workers Compensation | Repair of peroneal tendon subluxation | 15 patients | 33.7 (14–59) | 13 |
| McKissack (2021) [22] | Retrospective | Private Insurance, Medicaid | Ankle ORIF | 311 patients | Private Insurance: 41.7 (13.1), Medicaid: 38.1 (12.9) | 11 |
| Labrum (2017) [23] | Simulated Patient Survey | Medicaid, Private Insurance | NR | NR | NR | 14 |
| Komenda (1999) [24] | Retrospective | Workers Compensation, Non-Workers Compensation | Ankle arthroscopy | 54 patients, 55 ankles | 31 (14–64) | 10 |
| Kim (2016) [25] | Survey | Medicaid, Medicare, BlueCross | TAA | 240 foot and ankle surgeons | NR | 9 |
| Hutchinson (1994) [26] | Prospective | Workers Compensation, Non-Workers Compensation | Calcaneal ORIF | 43 patients, 47 fractures | 36.02 (17–66) | 11 |
| Gaedke (2018) [27] | Retrospective | Workers Compensation, Non-Workers Compensation | Ankle Fusion | 103 patients | 53 (23–80) | 12 |
| Flemister Jr (2000) [28] | Retrospective | Workers Compensation, Non-Workers Compensation | Subtalar Arthrodesis | 86 patients | 45 (23–66) | 11 |
| Dooley (2004) [29] | Prospective | Workers Compensation, Non-Workers Compensation | Calcaneal fractures-bilateral nonoperative, bilateral ORIF, unilateral total, bilateral total | 47 patients | NR | 14 |
| Dobbins (2020) [30] | Retrospective | Private, Medicare, Medicaid, Workers Compensation, Self/No pay, other | Acute, unstable ankle fracture | 192 patients | 43.63 (14.1) | 12 |
| Deister (2017) [31] | Retrospective | Private Insurance, Workers Compensation, Medicare/Medicaid | Ankle arthrodesis, triple arthrodesis, pantalar arthrodesis, subtalar arthrodesis | 198 patients | NR | 12 |
| Csizy (2003) [32] | Prospective | Workers Compensation, Non-Workers Compensation | Displaced intra-articular calcaneal fracture fusion | 461 patients | NR | 12 |
| Cherney (2018) [33] | Prospective | Medicaid, Medicare, Private Insurance, No insurance | Trans-syndesmotic stabilization | 69 patients | NR | 14 |
| Bui (2020) [34] | Retrospective | Workers Compensation, Non-Workers Compensation | Foot and Ankle Procedure | 221 patients | Workers Compensation: 43.25 (11.77) Non-Workers Compensation: 42.88 (13.22) | 14 |
| Boden (2020) [35] | Retrospective | Medicare, Medicaid, Private, Uninsured | Achilles Tendon Rupture Repair | 89 patients | Uninsured/Medicaid: 32.58 (12.43), Private/Medicare: 35.16 (13.31) | 12 |
| Shibuya (2018) [36] | Retrospective | Private, Government, Self-pay, None | Foot and Ankle Procedure | 513 patients | ED visit within 30 days: 53.9, No ED visit within 30 days: 53.2 | 12 |
| Bazaz (2007) [37] | Prospective | Workers Compensation, Non-Workers Compensation | Endoscopic plantar fasciitis release | 16 patients, 19 feet | 44.7 (28–70) | 14 |
| Bakhsh (2019) [38] | Retrospective | Under/Uninsured (Medicaid, Options plans) Fully insured | Elective foot and ankle surgeries | 267 patients | Insured: 52.1, Uninsured/Underinsured (46.9) | 13 |
| Amendola (1996) [39] | Prospective | Workers Compensation, Other | Ankle Arthroscopy | 79 patients | 30.8 (15–56) | 16 |
| Abdurrob (2020) [40] | Retrospective | Commercial, Free Care, Medicaid, Medicare, Workers Compensation | Foot and Ankle patients | 10,745 patients | 55.7 (17.3) | 12 |
| Abousayed (2019) [41] | Retrospective | Private, Medicare, Medicaid, Other | Ankle ORIF | 35 | 55.7 (17.3) | 12 |
| Author (Year) | Time to Treatment | Conclusion |
|---|---|---|
| Boden (2020) [35] | Time from injury to first clinic appointment (days) - Medicare: 9.75 - Medicaid: 16.86 - Private: 4.84 - Uninsured: 11.83 p = 0.004 | When compared to adequately insured patients (Private and Medicare), underinsured patients (uninsured, Medicaid) had significantly greater time from date of injury to first clinic visit, first clinic visit to surgery, injury to surgery date, and initial presentation to MRI |
| Time from first visit to surgery: - Medicare: 7.75 - Medicaid: 41.36 - Private: 4.64 - Uninsured: 26.67 p = 0.018 | ||
| Injury to surgery time: - Medicare: 13.75 - Medicaid: 57.86 - Private: 9.56 - Uninsured: 38.42 p = 0.007 | ||
| Presentation to MRI time: - Medicare: 2 - Medicaid: 56.43 - Private: 1.84 - Uninsured: 36.4 p = 0.021 | ||
| Zelle (2021) [19] | Time (days) from injury to presentation (mean ± SD): Insured: 2.3 ± 5.5, uninsured: 4.5 ± 7.6 p-value: <0.001 | Uninsured patients with ankle fractures requiring surgery experience significant barriers regarding access to healthcare |
| Time from presentation at our hospital to surgery in days (mean ± SD): - Insured: 5.0 ± 7.3 - Uninsured: 4.8 ± 4.3; p = 0.816 | ||
| Time (days) from injury to surgery (mean ± SD): - Insured: 7.3 ± 9.1 - Uninsured: 9.4 ± 8.5 p < 0.001 | ||
| Kim (2016) [25] | Rate for successfully obtaining an appt: - Medicaid: 38 (19.8%) - Medicare: 173 (92.0%) - BlueCross: 170 (90.4%) | Patients with Medicaid must wait longer for evaluation even when they obtain an appointment |
| Waiting period (days): - Medicaid: 22.6 (18.9–31.3) - Medicare: 11.7 (9.8–14.0), p = 0.004 - BlueCross: 10.7 (9.0–12.5), p = 0.001 | ||
| McKissack (2021) [22] | Average time from injury to first visit (days): - Private Insurance: 1.2 - Medicaid: 6.2 p < 0.001 | Medicaid patients have significantly delayed access to care compared to Private insurance |
| Average time from injury to surgery (days): - Private Insurance: 8.3 - Medicaid: 16.1 p < 0.001 | ||
| Labrum (2017) [23] | - Offices less likely to accept Medicaid (30/64 = 47%) than commercial insurance (62/64 = 97%) - Medicaid patients (23/64 = 36%) less likely to be offered appointment within 2 weeks compared to commercial insurance (59/64 = 89%), OR = 0.0154, 95% CI 0.00094–0.251, p < 0.001 | Medicaid patients are less likely to find an office that accepts insurance or get appointment within 2 weeks compared to commercial insurance |
| Author (Year) | Hospital Length of Stay (Days) | Discharge Location | Follow-Up | Conclusion |
|---|---|---|---|---|
| Singh (2020) [18] | Length of hospital stay >2 days, Odds ratio (95% CI) - Private: Reference - Medicaid: 0.97 (0.67, 1.41) - Medicare: 1.32 (1.12, 1.57) - Other: 1.48 (1.14, 1.93) - Self: 1.71 (0.79, 3.72) | Discharge to inpatient facility, Odds ratio (95% CI) - Private: Reference - Medicaid: 2.19 (1.17, 4.07) - Medicare: 2.52 (1.85, 3.44) - Other: 1.17 (0.63, 2.15) - Self: <0.01 (<0.01, <0.01) | NR | Medicare and other insurance patients had significantly increased length of hospital stay. Medicaid and Medicare patients had increased odds of discharge to inpatient facilities |
| Zelle (2021) [19] | NR | NR | Loss to post-operative outpatient follow-up at 3 months: - Insured: 34 (23.6%), - Uninsured: 137 (39.7%) p = 0.002 | Uninsured patients with ankle fractures had significant loss of follow-up care |
| McKissack (2021) [22] | NR | NR | Number of patients with at least 6 months follow-up - Private Insurance: 109 (46.2%) - Medicaid: 34 (47.2%) p = 0.877 | No significant differences in follow-up care between private and Medicaid insurance |
| Number of patients with at least 1 year follow-up - Private Insurance: 50 (21.2%) - Medicaid: 12 (16.7%) p = 0.403 | ||||
| Deister (2017) [31] | Longer length of hospital stay significantly related to Medicare/Medicaid insurance (standard regression coefficient = 0.153, p < 0.01) | Extended Care Facility (ECF) stay - ECF admission (n = 34): Private insurance or Workers Compensation = 0.21, Medicare and Medicaid = 0.79 - Non-ECF admission (n = 164): Private insurance or Workers Compensation = 0.60, Medicare and Medicaid = 0.40 p < 0.01 | NR | Longer length of hospital stay and extended care facility stay were significantly related to Medicare/Medicaid insurance |
| Bakhsh (2019) [38] | NR | NR | Number of missed appointments: - Insured: 0.13 - Under-/Uninsured: 0.61 p < 0.01 | Under-/uninsured patients were more at risk for loss to follow-up after elective foot and ankle surgery |
| Author (Year) | Complications | Revision Surgery | ED/UC Visit | Readmission | Conclusion |
|---|---|---|---|---|---|
| Abousayed (2019) [41] | NR | NR | Urgent Care Visit: # of patients (%) - Private: 216 (64.86%) - Medicare: 66 (19.82%) - Medicaid: 28 (8.41%) - Other: 23 (6.91%) p = 0.91 | NR | Insurance payer status was not statistically correlated with UC visits after ORIF |
| Shibuya (2018) [36] | NR | NR | ED visit within 30 days. - Government: Yes = 82 (48%), No = 89 (52%) - None: Yes = 16 (100%), No = 0 (0%) - Private: Yes = 60 (32%), No = 129 (68%) - Self: Yes = 0 (0%), No = 10 (100%) | NR | Having Private insurance was protective against ED visits after foot and ankle surgery |
| Singh (2020) [18] | Infection Odds ratio (95% CI): - Private: Reference - Medicaid: <0.01 (<0.01, <0.01) * - Medicare: 2.25 (0.63, 8.01) - Other: 2.25 (0.25, 20.07) - Self: <0.01 (<0.01, <0.01) * | Revision Odds ratio (95% CI) - Private: Reference - Medicaid: <0.01 (<0.01, <0.01) * - Medicare: 0.68 (0.40, 1.15) - Other: <0.01 (<0.01, <0.01) * - Self: <0.01 (<0.01, <0.01) * | NR | NR | No significant differences in post-operative infection or revision surgery |
| Zelle (2021) [19] | Surgical site infections: - Insured: 12 (10.8%) - Uninsured: 25 (11.6%) p = 0.83 | NR | NR | NR | No significant difference in surgical site infections when comparing insured versus uninsured patients |
| Ogawa (2007) [21] | Low grade complex regional pain syndrome - Workers Compensation: 4/5 patients | NR | NR | NR | Patients with Workers Compensation claims have poorer post-operative outcomes |
| Dobbins (2020) [30] | Patients with adverse events: N (%) - Private: 5 (15) - Medicare: 6 (25) - Medicaid: 4 (13) - Workers compensation: 2 (10) - Self/No-pay: 2 (15) - Other: 9 (12) | NR | NR | NR | Insurance was not associated with a difference in rates of adverse events |
| Patients without adverse events: N (%) - Private: 29 (85) - Medicare: 18 (75) - Medicaid: 27 (87) - Workers compensation: 19 (90) - Self/No-pay: 6 (75) - other: 65 (88) p > 0.05 | |||||
| Bakhsh (2019) [38] | Surgical Complications - Insured: 0.04 - Under-/Uninsured: 0.06 p = 0.36 | NR | NR | NR | No significant differences in surgical complications when comparing insured versus under-/uninsured patients |
| Prather (2020) [20] | NR | Reoperation within 30d: - Government Insurance: 3 (1.6) - Private Insurance: 4 (1.4) - No Insurance: 3 (2.4) p = 0.751 | ED visit within 30 days: N (%) - Government Insurance: 12 (6.4) - Private Insurance: 18 (6.3) - No Insurance: 13 (10.6) p = 0.272 | Readmission within 30 days: - Government Insurance: 9 (4.8) - Private Insurance: 13 (4.6) - No Insurance: 8 (6.5) p = 0.698 | Insurance status was not found to be significantly related to 30-day events |
| Author (Year) | Pain | Functional Score | Return to Work/Activity: | Other Outcomes | Conclusion |
|---|---|---|---|---|---|
| Ogawa (2007) [21] | NR | AOFAS - Average (Range) = 87.1 (74–100) - Workers Compensation: 80.6 - Non-Workers Compensation: 90.4 p = 0.07 | NR | NR | Patients with Workers Compensation claims have poorer functional outcomes |
| Komenda (1999) [24] | NR | Subjective Rating Scale: - Non-Workers Compensation: Excellent = 25 (76%), Good = 8 (24%), Fair = 0 (0%) Poor = 0 (0%) - Workers Compensation: Excellent = 5 (23%), Good = 15 (68%), Fair = 2 (9%), Poor = 0 (0%) | NR | NR | Workers Compensation patients had fewer excellent results, attributed to increased rate of subjective complaints of pain with activity |
| Hutchinson (1994) [26] | NR | NR | NR | Clinical Assessment Rating System: Number of feet satisfactory/total - Workers Compensation: 16/26 (61.5%) - Non-Workers Compensation: 19/21 (90.5%) p = 0.013 | Unsatisfactory clinical outcomes significantly correlated with Workers Compensation status |
| Gaedke (2018) [27] | VAS Pain Value: - Workers compensation: 4.1 - Non-workers compensation: 2.9 p = 0.018 | AOFAS Score: - Workers compensation: 53.5 - Non-workers compensation: 64.7 p = 0.017 | NR | NR | Workers compensation patients had significantly higher VAS pain scores and lower AOFAS scores |
| Flemister Jr. (2000) [28] | NR | AOFAS Score: - Workers Compensation: 73.5 - Non-Workers Compensation: 77.8 p > 0.05 | Return to Work: - Workers Compensation: 62% of patients (33/53) - Non-Workers compensation: 85% of patients (23/27) | NR | Workers Compensation patients tended to have poorer clinical outcomes |
| Dooley (2004) [29] | Non-Workers Compensation patients had significantly better outcomes on VAS compared to workers compensation patients (p < 0.01) | Non-Workers Compensation patients had significantly better outcomes on SF-36 compared to workers compensation patients (p < 0.01) | NR | NR | |
| Cherney (2018) [33] | Numeric Pain Rating Scale Score - Private (30 pts): 2.3 - Medicare (3): 1.0 - Medicaid (4): 8.0 - Uninsured (11): 3.9 p = 0.013 | SMFA-FI: - private (30 pts): 8.4 - Medicare (3): 3.2 - Medicaid (4): 41.9 - Uninsured (11): 27.3 p = 0.004 | NR | NR | Medicaid patients reported significantly worse SMFA-DI, SMFA-BI, OMAS, Numeric Pain Rating Score |
| SMFA-BI - Private (30 pts): 8.9 - Medicare (3): 2.8 - Medicaid (4): 57.9 - Uninsured (11): 31.1 p = 0.005 | |||||
| OMAS - Private (30 pts): 71.7 - Medicare (3): 86.7 - Medicaid (4): 21.3 - Uninsured (11): 52.7 p = 0.012 | |||||
| Bui (2020) [34] | Subsequent Pain or Injury: (SPI): - Workers Compensation: 13/56 (23.2%) - Non-Workers Compensation: 12/165 (7.3%) p = 0.001 | NR | NR | NR | Workers Compensation patients had higher rates of subsequent pain or injury than Non-Workers Compensation patients following foot and ankle procedures |
| Bazaz (2007) [37] | Workers Compensation: - No pain: 2/8 feet - Mild pain: 1/8 feet - Moderate pain: 5/8 feet | AOFAS Score: - Workers Compensation: Preoperative (63), Post-Operative (81) - Non-Workers Compensation: Preoperative (69), Post-Operativee (93) | NR | NR | Improvement after endoscopic plantar fascia release was noted in the Workers Compensation and Non-Workers Compensation groups. However, patients with Workers Compensation claims had inferior outcomes compared to Non-Workers Compensation patients using both assessment scales |
| Non-Workers Compensation - No pain: 7/11 feet - Mild pain: 3/11 feet - Severe pain: 1/11 feet | Maryland Score: - Workers Compensation: Preoperative (56), Post-Operative (72) - Non-Workers Compensation: Preoperative (68),Post-Operativee (92) | Patients with Workers Compensation claims also did not achieve pain relief to the same extent as the Non-Workers Compensation patients | |||
| Bakhsh (2019) [38] | Number of narcotic refills: - Insured: 0.72 - Under-/Uninsured: 1.74 p < 0.01 | PROMIS Function, Mean (SD), 1-year follow-up: - Insured: 45.2 (8.7) - Under-/Uninsured: 39.6 (9.1) p < 0.01 | NR | PROMIS Mood, Mean (SD), 1-year follow-up: - Insured: 44.2 (8.5) - Under-/Uninsured: 51.3 (10.3) p < 0.01 | Under-/uninsured patients have worse pain, patient-reported outcomes, and functional outcomes after elective foot and ankle surgery |
| VAS Pain Score: - Insured: 0.7 - Under-/Uninsured: 1.51 p < 0.01 | |||||
| PROMIS Pain, Mean (SD), 1-year follow-up: - Insured: 53.8 (8.6) - Under-/Uninsured: 60.2 (9.7) p < 0.01 | |||||
| Amendola (1996) [39] | VAS Pain, Mean (SD): - Workers Compensation: 2.7 (3.6) - Non-Workers Compensation: 6.9 (3.1) | NR | VAS Activities of Daily Living, Mean (SD): - Workers Compensation: 2.8 (3.7) - Non-Workers Compensation: 6.6 (3.2) p = 0.001 | VAS Swelling: - Workers Compensation: 3.1 (3.6) - Non-Workers Compensation: 6.2 (2.8) p = 0.002 | Patients under Workers Compensation had lower scores on VAS for pain, swelling, activities of daily living, and overall perception of benefit |
| Overall: - Workers Compensation: 4.3 (4.1) - Non-Workers Compensation: 6.9 (3.2) | |||||
| Abdurrob (2020) [40] | NR | Mean (SD) | NR | NR | PROMIS scores vary between the patients with different insurance types in an orthopaedic foot and ankle cohort. Patient insurance type may affect patient-reported outcomes |
| FAAM score: - Commercial: 70.0 (24.9) - Free Care: 65.3 (22.4) - Medicaid: 59.5 (26.4) - Medicare: 64.4 (25.3) - Workers Compensation: 47.9 (23.5) | |||||
| PROMIS Global-Physical: - Commercial: 46.7 (8.5) - Free Care: 43.8 (8.8) - Medicaid: 40.5 (9.7) - Medicare: 43.4 (8.9) - Workers Compensation: 40.1 (7.1) | |||||
| PROMIS Global-Mental: - Commercial: 52.6 (9.1) - Free Care: 50.6 (9.3) - Medicaid: 44.7 (11.3) - Medicare: 48.7 (9.6) - Workers Compensation: 47.9 (10.1) | |||||
| Physical Function Short Form 10a: - Commercial: 44.1 (8.9) - Free Care: 43.4 (10.4) - Medicaid: 40.0 (9.1) - Medicare: 40.6 (9.2) - Workers Compensation: 36.4 (6.9) |
Disclaimer/Publisher’s Note: The statements, opinions and data contained in all publications are solely those of the individual author(s) and contributor(s) and not of MDPI and/or the editor(s). MDPI and/or the editor(s) disclaim responsibility for any injury to people or property resulting from any ideas, methods, instructions or products referred to in the content. |
© 2026 by the authors. Licensee MDPI, Basel, Switzerland. This article is an open access article distributed under the terms and conditions of the Creative Commons Attribution (CC BY) license.
Share and Cite
Luo, E.J.; Rowe, D.G.; Wu, K.A.; Therien, A.D.; Bethell, M.; Adu-Kwarteng, K.; Lu, S.; Kaplan, S.; Adams, S.B.; Anastasio, A. Insurance Payor Status and Outcomes in Foot and Ankle Surgery. Osteology 2026, 6, 7. https://doi.org/10.3390/osteology6020007
Luo EJ, Rowe DG, Wu KA, Therien AD, Bethell M, Adu-Kwarteng K, Lu S, Kaplan S, Adams SB, Anastasio A. Insurance Payor Status and Outcomes in Foot and Ankle Surgery. Osteology. 2026; 6(2):7. https://doi.org/10.3390/osteology6020007
Chicago/Turabian StyleLuo, Emily J., Dana G. Rowe, Kevin A. Wu, Aaron D. Therien, Mikhail Bethell, Kwabena Adu-Kwarteng, Sarah Lu, Samantha Kaplan, Samuel B. Adams, and Albert Anastasio. 2026. "Insurance Payor Status and Outcomes in Foot and Ankle Surgery" Osteology 6, no. 2: 7. https://doi.org/10.3390/osteology6020007
APA StyleLuo, E. J., Rowe, D. G., Wu, K. A., Therien, A. D., Bethell, M., Adu-Kwarteng, K., Lu, S., Kaplan, S., Adams, S. B., & Anastasio, A. (2026). Insurance Payor Status and Outcomes in Foot and Ankle Surgery. Osteology, 6(2), 7. https://doi.org/10.3390/osteology6020007