Abstract
Nowadays, e-learning and web-based learning are the most integrated new learning methods in schools, colleges, and higher educational institutions. The recent web-search-based learning methodological approach has helped online users (learners) to search for the required topics from the available online resources. The learners extracted knowledge from textual, video, and image formats through web searching. This research analyzes the learner’s significant attention to searching for the required information online and develops a new recommendation system using machine learning (ML) to perform the web searching. The learner’s navigation and eye movements are recorded using sensors. The proposed model automatically analyzes the learners’ interests while performing online searches and the origin of the acquired and learned information. The ML model maps the text and video contents and obtains a better recommendation. The proposed model analyzes and tracks online resource usage and comprises the following steps: information logging, information processing, and word mapping operations. The learner’s knowledge of the captured online resources using the sensors is analyzed to enhance the response time, selectivity, and sensitivity. On average, the learners spent more hours accessing the video and the textual information and fewer hours accessing the images. The percentage of participants addressing the two different subject quizzes, Q1 and Q2, increased when the learners attempted the quiz after the web search; 43.67% of the learners addressed the quiz Q1 before completing the web search, and 75.92% addressed the quiz Q2 after the web search. The average word counts analysis corresponding to text, videos, overlapping text or video, and comprehensive resources indicates that the proposed model can also apply for a continuous multi sessions online search learning environment. The experimental analysis indicates that better measures are obtained for the proposed recommender using sensors and ML compared with other methods in terms of recall, ranking score, and precision. The proposed model achieves a precision of 27% when the recommendation size becomes 100. The root mean square error (RMSE) lies between 8% and 16% when the number of learners < 500, and the maximum value of RMSE is 21% when the number of learners reaches 1500. The proposed recommendation model achieves better results than the state-of-the-art methods.
1. Introduction
Nowadays, factors determining the quality of e-learning include learner satisfaction, cost, and the number of online accesses. Recently, many online resources have been available for learners’ online learning through web search methods that constitute the basic learning model. Search engines such as Google, Yahoo, Bing, CC Search, Search Encrypt, OneSearch, and Wiki.com are required for the learners to seek the required online resources or information [1,2,3]. The search engines provide quick access to the available online resources on any topic and retrieve the result in terms of textual information, video, and image formats. The learners can thus search for the required information in texts, videos, and image forms. Searching for information in any of these forms for online learning is also increasing yearly [4,5,6,7].
Some deep learning, AI, and ML methods are applied in toxicity classification [8] and predictive modeling [9]. Web-search based online learning is described using different theoretical models that involve the steps [10,11,12,13]:
- Setting the learning objectives and goals.
- Locating and searching for the information through search engines and accessing the required information in the desired forms such as text, image, and video.
- Resources or information evaluation from the online resources accessed.
- Information processing and knowledge integration with other online resources.
- Synthesis and knowledge representation after the learning phase.
The technology implemented in the eye tracker software measures the learners’ characteristics—pupil dilation, visual blinking, eye movements, gazing point, and visual attention of engaging and ignoring. The performance of the eye-tracking software also needs to be analyzed. The critical research in this area is to analyze how the formats of online resources such as text, video, and images will help to develop the knowledge-building stage while performing web searching. To perform this analysis, this research conducted the simulation for 1000 learners to search for a particular topic in the general science areas to access the required information as liked by the learners.
The significant contributions of the proposed model are as follows:
- To analyze the usage of these formats, some of the learner’s characteristics, such as the page or link navigations, learner eye movements, and language markup of traversed resources, are recorded during the simulation.
- To record the search time for the specific format. The proposed model automatically analyzes the learners’ interests while searching online and analyzes the origin of the acquired and the information learned online. This research performs text content mapping and video content.
- To analyze the efficiency of the eye tracker and to measure the characteristics of the learners—pupil dilation, visual blinking, eye movements, gazing point, visual attention of engaging and ignoring.
2. Literature Review
The recent advances in digital technology helped learners effectively during the COVID-19 epidemic. The most critical e-learning milestone is the preparation and delivery of the video content. The web activity survey shows that more than 60% of learners access YouTube videos daily, and more than 30% access Facebook, Twitter, and online news portals [4]. Hence, learning through web search increases the usage of videos. More than 70% of learners between 15 to 25 years use YouTube every month “at least once” or “frequently” to access the tutorials. The perception is more straightforward in online videos compared to accessing textual resources. Research has been conducted on learner characteristics to analyze how the learners organize, select and integrate image and textual information during web-search based learning [6,7]. Some researchers conclude that no differences are found between text-based resources and videos for the learning outcomes [10,11,12,13]. The information or resource format affects the processing strategies of the learners [13,14,15]. The research concludes that no differences are found between comprehension and cognitive calibration while web searching through textual or video blogs [10]. After several weeks of the learning phase, some research shows that the learners who have gone through the textual format perform better than those who have gone through the video format [15]. Even in controlled environments, however, one format may show no such advantage over the other formats, and the formats are affected by the learning resources content and the structured design of the online resources. Research has been conducted to analyze the characteristics of the learners during online searching that captures the learners’ interactions with the search results, and the logfiles information is collected for the corresponding web pages [15,16,17,18,19,20,21,22,23,24].
The recent technologies are combined logically in online learning to integrate video content [25,26,27]. The heterogeneous information of various topics is stored in the global repository online. The big concern is how to manage and index the large online global repository to respond quickly to the user’s query through the recent search engines that have applied technological and mathematical innovations in search. The recent search engines have been analyzed in terms of their characteristics [28,29]. Some contributions are focused on the requirements of the Internet, such as the use of YouTube video content creation for educational purposes. The social networks’ relationship with YouTube services, technical functionalities, and organizational aspects of educational video content requirements have been discussed [30].
Technological advances have made online education one of the core parts of the educational field. The contribution of the factors that enhance the academic performance using the online learning model can be explored from the online course log files information using data mining techniques such as clustering and decision trees [31]. The learner’s eye movements are recorded using eye-tracking software to analyze the access to information resources [32]. Artificial intelligence (AI) and machine learning (ML) techniques have recently played a role in searching online resources effectively in various job searching applications [33].
Hence, this research examines web searching using sensors with reliable online sources to analyze the better representation format for learning online. This research also explores how the learners access the resource’s format and how the knowledge originated and is acquired while web searching. The log files are analyzed using the ML strategy. This strategy predicts the learner’s prior information and the knowledge update from the different collection characteristics. The characteristics include query features, online session features, browsing and navigating features, search engine result features, eye tracking features, viewing characteristics, and mouse access features. The log files information can be designed as digital pedagogy and an online collaborative learning environment that allows the progress and monitoring of the learners through dashboards.
3. Materials and Methods
This section focuses on developing a model to analyze the learners’ interests while searching online. The model also analyzes the origin of the information acquired and learned online. The model is developed to perform text content mapping and video content. The sensors record the learner’s navigation and eye tasks or movements. This model analyzes and tracks online resource usage with the operations: data or information logging, processing, and defining the mapping operation.
3.1. Novelty of the Proposed Model
The novelty in the proposed model is based on the following steps:
- Evaluate and analyze the learner’s knowledge acquisition through the core operations, obtaining better measures using cluster-based recommendations.
- Store the complete track of online resources that are visited.
- Define the mapping between the information that has been newly learned to resources processing, using sensors.
- Store the sequence of words that the learners had learned online.
- Apply the video transcripts to keep track of the words visited through online videos.
- Analyze the overlapping between the traversed words and the recalled data.
3.2. Architecture of the Proposed Model
The architecture of the proposed model to analyze and track online resource usage is sketched in Figure 1 with the core operations—information logging, information processing, and word mapping [7,8,9,10,11,12,13,14,34,35,36,37,38]. The proposed model of resource processing is defined in Algorithm 1.
| Algorithm 1: Proposed Model—Resources Processing |
| 1: Data or information logging 1.1 Evaluate prior knowledge. 1.2 Perform online search learning. 1.3 Map online resources into log files and transcript information. 1.4 Evaluate the post-knowledge. 2: Processing the data or information. 2.1 Extract the words using the concept assessment. 2.2 Use the software to recognize the text, image, and video resources. 2.3 Extract the words using the post-knowledge assessment. 3: Define the mapping operation. 3.1 Remove the unnecessary words after preprocessing. 3.2 Perform the word match between video and webpages information. 3.3 Construct the word origin table with the resources. |
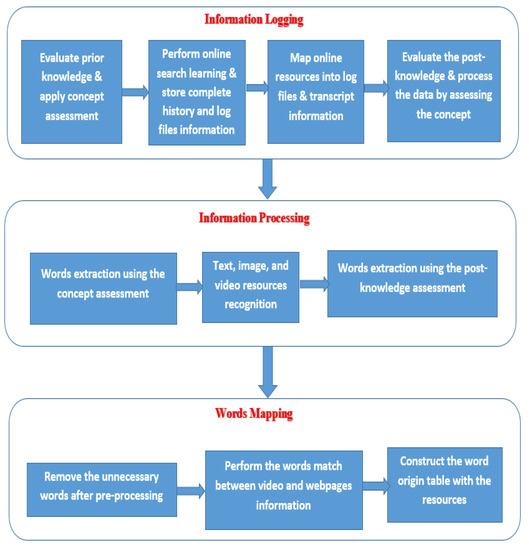
Figure 1.
The architecture of the proposed resources processing model [7,8,9,10,11,12,13,14,34,35,36,37,38].
The proposed model differs from the existing models by recording the complete log files, eye-tracking information, and the history of the visited resources, including date and time. This feature dramatically helps to map the knowledge that has been recently learned to the available resources. This information is read and processed through the proposed model to generate each learner’s complete history of phrases or words. The video transcripts help to trace the phrases searched in the videos. The overlapping between words is analyzed using the proposed resources processing model.
The proposed resources processing model is analyzed in several dimensions to answer the following queries:
Q1. How many web pages are visited by the learners?
That is, during the online search learning session, the learners access to different web pages should be analyzed, for example, the access to YouTube, Google search, and other searches from various search engines.
Q2. How many images are seen by the learners?
The sequences of images searched from the different search engines to the learner’s topics of interest in updating their knowledge should be analyzed for the period.
Q3. How many videos are accessed by the learners?
The searched and watched videos based on the learning topics and subtopics through several search engines should be analyzed.
Q4. Which of the web pages are visited most by the learners?
In this case, the primary interest of analysis is in searching and accessing the specific or the most frequently accessed webpage information for all learners.
Q5. How are the complete eye track and log file information stored for all learners?
To analyze the acquired knowledge of the learners during the simulation, the complete history of the eye tracker and the search should be saved in the system over the simulated period.
Q6. How do we find the mapping between the information that has been newly learned to resource processing?
The transcripts are generated for the accessed videos, and the searched words of the learners are extracted during the simulation to construct the retrace of word origins corresponding to the available information resources.
Q7. How do we identify the sequence of words the learners had learned online?
Based on the search history, the comparison should be performed by generating the list of original words and retracing the words to specific information resources.
Q8. How to keep track of the words encountered through online videos?
The learners are asked to write a detailed report about the learning topics before and after completing the learning phase to analyze the words encountered through the videos.
Q9. How to analyze the overlapping between the traversed words and the recalled data?
The information about the learning topics is analyzed based on the number of written phrases and the concepts learned.
Q10. How do we analyze the outcomes for learners who learned a particular topic through web searching?
The percentage of this measure should be analyzed before and after the completion of the learning phase. The match between the stemmed words before and after the learning phase is analyzed to infer the learning rate of the learners.
Q11. What is the total session time of the individual group of learners?
Every session’s beginning and completion times is recorded for all the individual groups of learners.
Q12. Analyze the efficiency of the SMI eye tracker software.
Q13. Analyze the usefulness of the eye tracking method in response time, selectivity, and sensitivity.
Q14. What percentage of eye tracking or other eye movement (e.g., being collaborative) relates to effective web search?
3.3. Datasets and Learners’ Information
The online datasets are collected to conduct the simulation of the proposed model. 1500 learners from all over the world participated through the Google Meet application. The structure of this learner population with subjects and learner group size is tabulated in Table 1, and the and standard deviation in the different groups are given in Table 2. The final dataset with sufficient data consists of 1500 learners with 60% male (: 22.5 age and : 2.37) and 40% female (: 20.3 age and : 2.16).

Table 1.
Structure of the learner population [7,8,9,10,11,12,13,14,18,19,20].

Table 2.
and in different groups [7,8,9,10,11,12,13,14,18,19,20].
On average, the learners are requested to use the internet for 30 h per week. The learner’s familiarity with the search engines is also evaluated during the simulation on a scale from 1 to 5 (in the direction of increasing usage performance). The learner’s prior information knowledge is also analyzed during the web searching (: 1.52, : 1.96, already learned concepts: 27).
3.4. Learner’s Task and Information Processing
The learners were asked to study the complete fundamentals of the CORONA virus and to answer the quizzes at the end of the simulation. The participants are also instructed to write a detailed report about the learning topics before and after completing the learning phase. The performance of the learners is also analyzed after the learning period. The learner’s eye movements are recorded using SMI eye tracking software that records the gaze information and page navigation files for n number of downloads. The infrared light is sent from the eye tracker software, and the light is reflected by the learners. Then the eye-tracking camera picks up the reflections. The predefined filtering methods are applied to find out the looking positions of the learners by the eye tracker. The reading protocol software analyzes the gaze and resource data, including the equivalent HTML files. Every online search of the learners through the browser is recorded. The complete eye tracking data, search, and time spent for each resource searching and downloading in terms of video, images, and text web page information is analyzed.
3.5. Mapping Operation
The concepts learned by the learners are mapped to the texts, videos, and images viewed by the learners. The stop words and the words with few characters are removed from the database to implement the mapping process. Then the contents read protocol creates a list of all words that the learner had traversed during the web search. The transcripts are generated for the videos. The searched words are extracted for every learner during the simulation to construct the retrace of word origins corresponding to the available information resources. Finally, the comparison was performed by generating the list of original words and retracing the words to specific information resources.
3.6. New Recommendation Model
The new recommendation model uses new clustered intelligent collaborative filtering (CF). This model splits the knowledge requirements into some clusters, linear clustering is applied for every partition, and the better requirements are stored in the database [25,26,27,28,29,38,39,40,41,42,43]. The flowchart of the new clustered intelligent CF recommendation model is sketched in Figure 2, and its algorithm is defined in algorithm 2. This algorithm is based on linear clusters and explores the knowledge requirements for each cluster. For every pair of learners x and y, is calculated to separate elements from the list. Then the is computed such that j . Then the list gets updated for all partitions to select the better recommendation. The top suggestions are selected using this algorithm.
| Algorithm 2: New clustered intelligent CF |
| Inputs: learner dataset, learner x, S, 1: Input the learner’s rating information from the learner’s dataset and items. 2: Split the knowledge requirements of the learners from the datasets. 3: Evaluate linear cluster operation to find out the knowledge requirements for every partition and bring better requirements from the table. 4: Apply every learner y available in the learner dataset with y ≠ x in every cluster partition: 5: Evaluate using items separation for the learners x and y. 6: Calculate r using (1) 7: Sort the learners reversely based on Equation (1). 8: Separate elements from List and update S. 9: Update the learner’s similar requirements in every partition. 10: Calculate such that j using (2) 11: Sort from Equation (2) in every partition, find the overall prediction rating for all items not rated. 12: Update the list from all partitions and select a better choice from the database evaluation. 13: Separate entries and update L. |
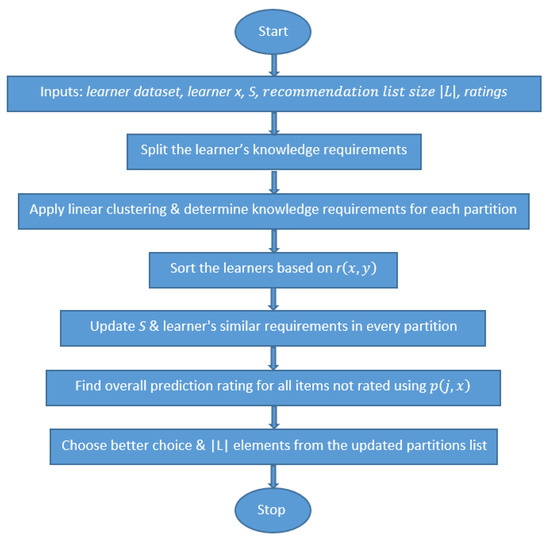
Figure 2.
Flowchart of the proposed recommender [7,8,9,10,11,12,34,35,36,37,38].
4. Results and Discussion
This section focuses on the experimental results and analysis of the proposed model. The simulation of the proposed model was conducted for 1500 learners using sensors in different subject areas, and the learner’s performance was also evaluated using the quizzes. The experimental outcomes are analyzed as follows:
4.1. Access to Online Resources
It has been experimentally found that, on average, 38.25 h are spent per week with : 8.25 for web search. The weekly access count of the learning resources is sketched in Figure 3. It has been experimentally found that most learners accessed images as the most accessed resource and then accessed the text pages.
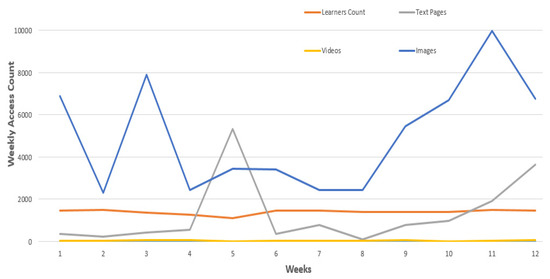
Figure 3.
Weekly access count of learning resources.
The number of users who access videos every week is plotted in Figure 4. The graph is plotted for significant access to video resources through different channels such as Google, YouTube, and other videos. The chart concludes that the learners mainly accessed the videos through Google and YouTube channels. The users did not prefer to use other learning access channels.
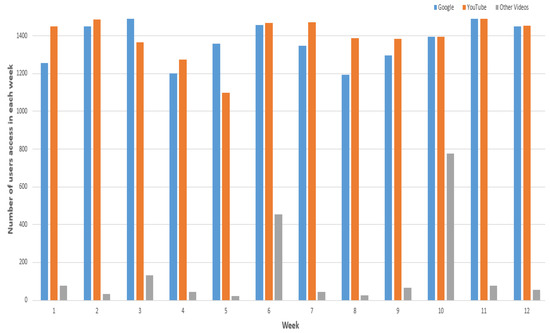
Figure 4.
Number of users accessing videos each week.
For each learning resource, the weekly accessing hours are measured and plotted in Figure 5. On average, the learners spent 23.67 h accessing the textual information, 29.25 h accessing the video resources, and 5.5 h accessing the images.
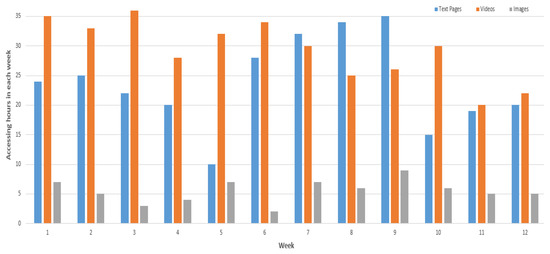
Figure 5.
Accessing hours each week for the learning resources.
The participants are instructed to write a detailed report about the learning topics before and after completing the learning phase. The detailed report of the learning topics is analyzed based on the number of written phrases and the concepts learned. The percentage of these measures increases after the learning phase is completed. The match between the stemmed words after the learning phase results in more phrases. For the set of learners, two quizzes, Q1 and Q2, are conducted through simulation, with quiz Q1 completed before the web search and quiz Q2 completed after the web search. The counting scores—the number of not stemmed words, the number of scored concepts, and the number of concept groups were increased when the learners attempted the quiz after the web searching. Figure 6 shows the count of not stemmed words, scored concepts and scored concept groups. The percentage of participants addressing the quizzes Q1 and Q2 based on the 12 defined concept groups is shown in Table 3. The analysis concludes that the percentage of participants addressing the quiz increased when the learners attempted the quiz after the web search. It was found that 43.67% of the learners addressed the quiz Q1 before completing the web search, and 75.92% addressed the quiz Q2 after the web search. The expected word count from quiz Q2 retraced to specific text, or video transcripts are shown in Table 4. The analysis concludes that the average word count corresponding to text, videos, overlapping text or video, and overall resources is obtained as 13, 12.33, 4.16, 15.25, respectively.
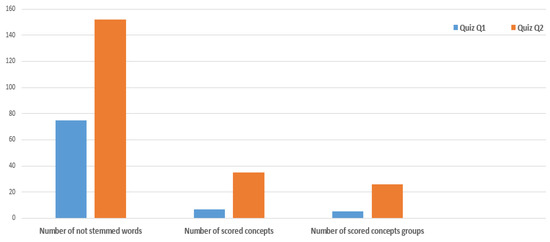
Figure 6.
Count of not stemmed words, scored concepts and scored concept groups.

Table 3.
Percentage of participants addressing the quizzes based on concept groups [7,12,13,14,17,18,19,20].

Table 4.
Mean number of words from Q2 retraced to specific text, or video transcripts [7,12,13,14,17,18,19,20].
4.2. Recommender Model Analysis
The core operations of information logging, information processing, and word mapping, as defined in algorithm 1, played a role in understanding the learner’s knowledge acquisition through the simulation and providing better measures. The percentage of the measures increases after the learning phase is completed, as defined in Algorithm 1. The cluster-based recommender model, as defined in Algorithm 2, suggests the top N better suggestions for the learners after the information has been processed using Algorithm 1.
The proposed recommender is analyzed based on the following metrics:
The proposed recommender resource processing is evaluated, and the metrics precision, ranking score, and recall are calculated using Equations (3)–(6) for mean and standard deviation ; these are tabulated in Table 5 and Table 6, respectively. The proposed recommender is compared with other methods, such as CF, MDHS, and UPOD [23,24,25,26,27]. It has been found that better measures are obtained using the proposed recommender compared to other methods. The RMSE measures for different learner group sizes = 250, 300, 350, 400, 450, and 500 are sketched in Figure 7. The RMSE lies between (8%, 16%) when the learner group size is less than 500, and the maximum value of RMSE is 21% when the learner group size reaches 1500.

Table 5.
comparison with other methods [23,24,25,26,27,32,33].

Table 6.
comparison with other methods [23,24,25,26,27,32,33].
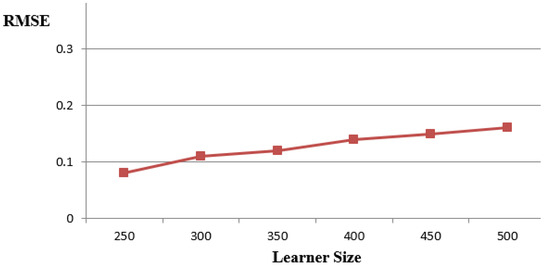
Figure 7.
RMSE for different learner group sizes.
The size of the recommendation list versus the precision measure is plotted in Figure 8. The proposed model achieves a precision of 27% when the size of L becomes 100. The precision and recall measures for different learner sizes = 250, 500, 750, 1000, 1250, and 1500 are plotted in Figure 9, and the proposed recommender obtains better results.
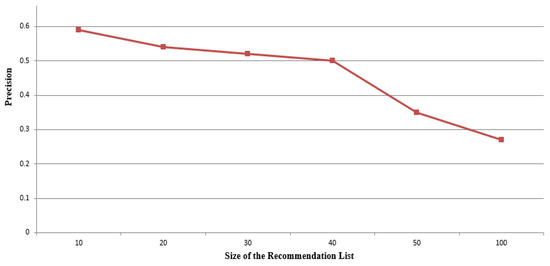
Figure 8.
Size of the recommendation list versus precision.
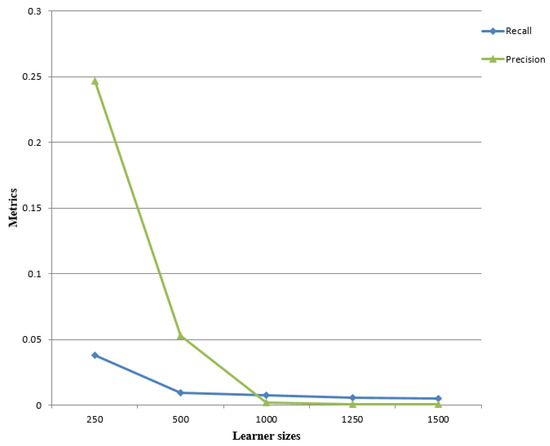
Figure 9.
Precision and recall for different learner group sizes.
4.3. Eye Tracker Efficiency Analysis
- The technology implemented in the eye tracker software measures the learners’ characteristics—pupil dilation, visual blinking, eye movements, gazing point, and visual attention of engaging and ignoring.
- The accuracy of the eye tracker is less than 0.5° in the controlled environments, with the actual gaze point offset frequently by at least 1°. The gazing point is sampled at different rates.
- The standard frame rate lies (60 Hz, 500 Hz) images per second. The frame rate of the web camera lies (5 Hz, 30 Hz).
- The learner’s performance in answering the questions is also analyzed. The repetition of gazing in choosing some options is a wavering characteristic of the learners when they are confused about choosing the option. The system predicted that 12% of the learners had the wavering characteristic, in which 7% of the learners failed to choose the correct option, and 5% chose the right option.
- The learner’s knowledge acquisition is evaluated as 88% ground truth responses and 12% underperformance.
- The learner’s engagement and findability characteristics in solving quizzes are analyzed as follows: 84% of the quick response learners, 16% of the learners are gazed or uninterested.
- The average response times of the simulation are observed as follows: choosing correct options (selectivity) 2.5 min, and choosing incorrect options lies 3 to 5 min. Sensitivity: 87% of the learners sensed the suitable options, 8% showed inattentional blindness, and 5% of the learners with had wavering gaze characteristics.
- The proposed model’s overall expected eye tracking or eye movement percentage in web-search learning is 88%.
5. Conclusions and Future Work
This research investigated how the learning resources—textual information, videos, and image—contribute to constructing information or knowledge in an online web environment using sensors. To analyze the usage of these formats, some of the learner’s characteristics, such as the page or link navigations, learner eye movements, and language markup of traversed resources, are considered here, to construct efficient knowledge representation. The search time for the specific format is also recorded for analysis. It has been experimentally found that most learners accessed images as the most accessed resource and then accessed the text pages. The learners mainly accessed the videos through Google and YouTube channels. The users did not prefer to use other learning access channels. On average, the learners spent 23.67 h accessing the textual information, 29.25 h accessing the video resources, and 5.5 h accessing the images. Mostly the learners preferred to access video resources. The counting scores—the number of not stemmed words, the number of scored concepts, and the number of concept groups —were increased when the learners attempted the quiz after the web searching. The analysis concludes that the percentage of participants addressing the quiz increased when the learners attempted the quiz after the web searching. The results show that 43.67% of the learners addressed the quiz Q1 before completing the web search, and 75.92% addressed the quiz Q2 after the web search. The analysis concludes that the average word count corresponding to text, videos, overlapping text or video, and overall resources is obtained as 13, 12.33, 4.16, 15.25, respectively.
The proposed model is also applied for a continuous multi sessions online search learning environment. The evolution of web-search based learning sessions from various online resources is explored and analyzed. The proposed model’s overall expected eye tracking or eye movement percentage in web-search learning is 88%. The core operations—information logging, processing, and word mapping as defined in the proposed model—played a role in understanding the learner’s knowledge acquisition through the simulation and providing better measures. The percentage of the measures increases only after the learning phase is completed, as defined in the model. The proposed recommender obtained better measures compared to other methods. The RMSE lies in the range of 8% to 16% when the learner group size is less than 500, and the maximum value of RMSE is 21% when the learner group size reaches 1500. This research provides a better recommendation tool for weak learners to identify the necessary resources for online learning in different learning environments.
This research will be extended in the future by improving the learner’s knowledge acquisition and optimizing the number of matched words using cloud computing, hybrid strategies, and evolutionary computation models [30,31,32,33,34]. This approach can be extended by combining image and traditional video analysis methods to analyze procedural information [39,40,41,42,43].
Author Contributions
Conceptualization, V.M.R.M. and C.R.; methodology, C.N.D.; software, U.R.C.; validation, B.P.; formal analysis, R.S.K.; investigation, R.M.; resources, R.M.; data curation, V.M.R.M. and C.R.; writing—original draft preparation, R.M.; writing—review and editing, R.M.; visualization, C.N.D.; supervision, U.R.C.; project administration, B.P. All authors have read and agreed to the published version of the manuscript.
Funding
This research received no external funding.
Institutional Review Board Statement
Not applicable.
Informed Consent Statement
Not applicable.
Data Availability Statement
Not applicable.
Conflicts of Interest
The authors declare no conflict of interest.
References
- Brand-Gruwel, S.; Kammerer, Y.; van Meeuwen, L.; van Gog, T. Source evaluation of domain experts and novices during Web search. J. Comput. Assist. Learn. 2017, 33, 234–251. [Google Scholar] [CrossRef]
- Brand-Gruwel, S.; Wopereis, I.; Vermetten, Y. Information problem solving by experts and novices: Analysis of a complex cognitive skill. Comput. Hum. Behav. 2005, 21, 487–508. [Google Scholar] [CrossRef]
- Brand-Gruwel, S.; Wopereis, I.; Walraven, A. A descriptive model of information problem solving while using internet. Comput. Educ. 2009, 53, 1207–1217. [Google Scholar] [CrossRef]
- Feierabend, S.; Rathgeb, T.; Kheredmand, H.; Glöckler, S. JIM-Studie 2020: Jugend, Information, Medien: Basisuntersuchung zum Medienumgang 12- bis 19-Jähriger in Deutschland [JIM-Study 2020: Youth, Information, Media: Basic Study on Media Use by 12- to 19-Year-Olds in Germany]. Medienpädagogischer Forschungsverbund Südwest. 2020. Available online: https://www.mpfs.de/fileadmin/files/Studien/JIM/2020/JIM-Studie-2020_Web_final.pdf (accessed on 1 December 2022).
- Koch, W.; Beisch, N. Ergebnisse der ARD/ZDF-Onlinestudie 2020: Erneut Starke Zuwächse bei Onlinevideo [Results of the ARD/ZDF Online Study 2020: Again Large Growth in Online Video]. Media Perspektiven, 9/2020, 482–500. Available online: https://www.ardwerbung.de/fileadmin/user_upload/media-perspektiven/pdf/2020/0920_Koch_Beisch_Korr_30-11-20.pdf (accessed on 1 December 2022).
- Singh, P.; Ahuja, S.; Jaitly, V.; Jain, S. A framework to alleviate common problems from recommender system: A case study for technical course recommendation. J. Discret. Math. Sci. Cryptogr. 2020, 23, 451–460. [Google Scholar] [CrossRef]
- Gupta, R.D.; Madhukar, M. Operational Challenges in Online Self-Learning Education Adoption. In Proceedings of the 2021 6th International Conference on Signal Processing, Computing and Control (ISPCC), Solan, India, 7–9 October 2021; pp. 51–55. [Google Scholar] [CrossRef]
- Fan, H.; Du, W.; Dahou, A.; Ewees, A.; Yousri, D.; Elaziz, M.; Elsheikh, A.; Abualigah, L.; Al-Qaness, M. Social Media Toxicity Classification Using Deep Learning: Real-World Application UK Brexit. Electronics 2021, 10, 1332. [Google Scholar] [CrossRef]
- Khoshaim, A.B.; Moustafa, E.B.; Bafakeeh, O.T.; Elsheikh, A.H. An Optimized Multilayer Perceptrons Model Using Grey Wolf Optimizer to Predict Mechanical and Microstructural Properties of Friction Stir Processed Aluminum Alloy Reinforced by Nanoparticles. Coatings 2021, 11, 1476. [Google Scholar] [CrossRef]
- Delgado, P.; Anmarkrud, Ø.; Avila, V.; Altamura, L.; Chireac, S.M.; Pérez, A.; Salmerón, L. Learning from text and video blogs: Comprehension effects on secondary school students. Educ. Inf. Technol. 2021, 27, 5249–5275. [Google Scholar] [CrossRef]
- Gerjets, P.; Kammerer, Y.; Werner, B. Measuring spontaneous and instructed evaluation processes during web search: Integrating concurrent thinking-aloud protocols and eye-tracking data. Learn. Instr. 2011, 21, 220–231. [Google Scholar] [CrossRef]
- Gerjets, P.; Scheiter, K.; Opfermann, M.; Hesse, F.W.; Eysink, T.H. Learning with hypermedia: The influence of representational formats and different levels of learner control on performance and learning behavior. Comput. Hum. Behav. 2009, 25, 360–370. [Google Scholar] [CrossRef]
- List, A. Strategies for comprehending and integrating texts and videos. Learn. Instr. 2018, 57, 34–46. [Google Scholar] [CrossRef]
- List, A.; Ballenger, E.E. Comprehension across mediums: The case of text and video. J. Comput. High. Educ. 2019, 31, 514–535. [Google Scholar] [CrossRef]
- Tarchi, C.; Zaccoletti, S.; Mason, L. Learning from Text, Video, or Subtitles: A Comparative Analysis. Comput. Educ. 2020, 160, 104034. [Google Scholar] [CrossRef]
- Câmara, A.; Roy, N.; Maxwell, D.; Hauff, C. Searching to Learn with Instructional Scaffolding. In Proceedings of the 2021 Conference on Human Information Interaction and Retrieval, Canberra, Australia, 14’19 March 2021; Scholer, F., Thomas, P., Elsweiler, D., Joho, H., Kando, N., Smith, C., Eds.; ACM: New York, NY, USA, 2021; pp. 209–218. [Google Scholar] [CrossRef]
- Kalyani, R.; Gadiraju, U. Understanding user search behavior across varying cognitive levels. In Proceedings of the 30th ACM Conference on Hypertext and Social Media, New York, NY, USA, 17–20 September 2019; ACM: New York, NY, USA, 2019; pp. 123–132. [Google Scholar] [CrossRef]
- Kammerer, Y.; Brand-Gruwel, S.; Jarodzka, H. The Future of Learning by Searching the Web: Mobile, Social, and Multimodal. Front. Learn. Res. 2018, 6, 81–91. [Google Scholar] [CrossRef]
- Knight, S.; Rienties, B.; Littleton, K.; Mitsui, M.; Tempelaar, D.; Shah, C. The relationship of (perceived) epistemic cognition to interaction with resources on the internet. Comput. Hum. Behav. 2017, 73, 507–518. [Google Scholar] [CrossRef]
- Liu, J.; Cole, M.J.; Liu, C.; Bierig, R.; Gwizdka, J.; Belkin, N.J.; Zhang, J.; Zhang, X. Search behaviors in different task types. In Proceedings of the ACM International Conference on Digital Libraries, New York, NY, USA, 21–25 June 2010; Hunter, J., Lagoze, C., Giles, L., Li, Y.-F., Gwizdka, J., Belkin, N.J., Eds.; ACM: New York, NY, USA; pp. 69–78. [Google Scholar] [CrossRef]
- Marenzi, I.; Zerr, S. Multiliteracies and Active Learning in CLIL—The Development of LearnWeb2.0. IEEE Trans. Learn. Technol. 2012, 5, 336–348. [Google Scholar] [CrossRef]
- Roy, N.; Moraes, F.; Hauff, C. Exploring users’ learning gains within search sessions. In Proceedings of the 2020 Conference on Human Information Interaction and Retrieval; ACM: New York, NY, USA, March, 2020; pp. 432–436. [Google Scholar] [CrossRef]
- Tibau, M.; Siqueira, S.W.; Nunes, B.P.; Bortoluzzi, M.; Marenzi, I.; Kemkes, P. Investigating Users’ Decision-Making Process While Searching Online and Their Shortcuts towards Understanding, Proceedings of the 2018 International Conference on Web-Based Learning; Hancke, G., Spaniol, M., Osathanunkul, K., Unankard, S., Klamma, R., Eds.; Springer: Berlin/Heidelberg, Germany, 2018; pp. 54–64. [Google Scholar] [CrossRef]
- Yu, R.; Gadiraju, U.; Holtz, P.; Rokicki, M.; Kemkes, P.; Dietze, S. Predicting user knowledge gain in informational search sessions. In Proceedings of the 41st International ACM SIGIR Conference on Research & Development in Information Retrieval; ACM: New York, NY, USA, June, 2018; pp. 75–84. [Google Scholar] [CrossRef]
- Muhasin, H.J.; Jabar, M.A.; Abdullah, S.; Kasim, S. Managing Sensitive Data in Cloud Computing For Effective Information Systems’ Decisions. Acta Inform. Malays. 2017, 1, 1–2. [Google Scholar] [CrossRef]
- Zlatkin-Troitschanskaia, O.; Hartig, J.; Goldhammer, F.; Krstev, J. Students’ online information use and learning progress in higher education—A critical literature review. Stud. High. Educ. 2021, 46, 1996–2021. [Google Scholar] [CrossRef]
- Whitelock-Wainwright, A.; Laan, N.; Wen, D.; Gašević, D. Exploring student information problem solving behaviour using fine-grained concept map and search tool data. Comput. Educ. 2019, 145, 103731. [Google Scholar] [CrossRef]
- Salmerón, L.; Sampietro, A.; Delgado, P. Using Internet videos to learn about controversies: Evaluation and integration of multiple and multimodal documents by primary school students. Comput. Educ. 2020, 148, 103796. [Google Scholar] [CrossRef]
- Sverdlyka, Z.; Klynina, T.; Fedushko, S.; Bratus, I. Youtube Web-Projects: Path from Entertainment Web Content to Online Educational Tools. In Developments in Information & Knowledge Management for Business Applications; Studies in Systems, Decision and Control; Kryvinska, N., Greguš, M., Eds.; Springer: Cham, Switzerland, 2022; Volume 421, pp. 491–512. [Google Scholar] [CrossRef]
- Kathuria, M.; Nagpal, C.K.; Duhan, N. Journey of Web Search Engines: Milestones, Challenges & Innovations. Int. J. Inf. Technol. Comput. Sci. 2016, 8, 47–58. [Google Scholar] [CrossRef]
- Ahuja, S.; Kaur, P.; Panda, S.N. Identification of Influencing Factors for Enhancing Online Learning Usage Model: Evidence from an Indian University. Int. J. Educ. Manag. Eng. 2019, 9, 15–24. [Google Scholar] [CrossRef]
- Strzelecki, A. Eye-Tracking Studies of Web Search Engines: A Systematic Literature Review. Information 2020, 11, 300. [Google Scholar] [CrossRef]
- Ullal, M.S.; Nayak, P.M.; Dais, R.T.; Spulbar, C.; Birau, R. Investigating the Nexus Between Artificial Intelligence and Machine Learning Technologies in the Case of Indian Services Industry. Business: Theory Pract. 2022, 23, 323–333. [Google Scholar] [CrossRef]
- Bhaskaran, S.; Marappan, R.; Santhi, B. Design and Comparative Analysis of New Personalized Recommender Algorithms with Specific Features for Large Scale Datasets. Mathematics 2020, 8, 1106. [Google Scholar] [CrossRef]
- Bhaskaran, S.; Marappan, R.; Santhi, B. Design and Analysis of a Cluster-Based Intelligent Hybrid Recommendation System for E-Learning Applications. Mathematics 2021, 9, 197. [Google Scholar] [CrossRef]
- Bhaskaran, S.; Marappan, R. Design and analysis of an efficient machine learning based hybrid recommendation system with enhanced density-based spatial clustering for digital e-learning applications. Complex Intell. Syst. 2021, 1, 1–17. [Google Scholar] [CrossRef]
- Marappan, R.; Bhaskaran, S. Analysis of Recent Trends in E-Learning Personalization Techniques. Educ. Rev. USA 2022, 6, 167–170. [Google Scholar] [CrossRef]
- Marappan, R.; Bhaskaran, S. Analysis of Collaborative, Content & Session Based and Multi-Criteria Recommendation Systems. Educ. Rev. USA 2022, 6, 387–390. [Google Scholar] [CrossRef]
- Marappan, R.; Sethumadhavan, G. Solution to Graph Coloring Using Genetic and Tabu Search Procedures. Arab. J. Sci. Eng. 2017, 43, 525–542. [Google Scholar] [CrossRef]
- Marappan, R.; Sethumadhavan, G. Complexity Analysis and Stochastic Convergence of Some Well-known Evolutionary Operators for Solving Graph Coloring Problem. Mathematics 2020, 8, 303. [Google Scholar] [CrossRef]
- Marappan, R.; Sethumadhavan, G. Solving Graph Coloring Problem Using Divide and Conquer-Based Turbulent Particle Swarm Optimization. Arab. J. Sci. Eng. 2021, 47, 9695–9712. [Google Scholar] [CrossRef]
- Sethumadhavan, G.; Marappan, R. A genetic algorithm for graph coloring using single parent conflict gene crossover and mutation with conflict gene removal procedure. In Proceedings of the 2013 IEEE International Conference on Computational Intelligence and Computing Research, Enathi, India, 26–28 December 2013; pp. 1–6. [Google Scholar] [CrossRef]
- Marappan, R.; Sethumadhavan, G. A New Genetic Algorithm for Graph Coloring. In Proceedings of the 2013 Fifth International Conference on Computational Intelligence, Modelling and Simulation, Seoul, Republic of Korea, 24–25 September 2013; pp. 49–54. [Google Scholar] [CrossRef]
Disclaimer/Publisher’s Note: The statements, opinions and data contained in all publications are solely those of the individual author(s) and contributor(s) and not of MDPI and/or the editor(s). MDPI and/or the editor(s) disclaim responsibility for any injury to people or property resulting from any ideas, methods, instructions or products referred to in the content. |
© 2023 by the authors. Licensee MDPI, Basel, Switzerland. This article is an open access article distributed under the terms and conditions of the Creative Commons Attribution (CC BY) license (https://creativecommons.org/licenses/by/4.0/).