1. Introduction
The composition of automotive fuels has changed considerably over recent decades, primarily due to the introduction of oxygenated components such as ethanol in gasoline and fatty acid methyl esters (FAME) in diesel fuel, as specified by current fuel standards [
1,
2,
3]. These components can influence fuel stability during storage and operation by promoting oxidation and degradation processes, which may lead to the formation of organic acids, peroxides, water-related reaction products, or other chemically reactive species [
4,
5]. Such changes in fuel chemistry can affect interactions between fuels and materials used in fuel systems, particularly metallic components, potentially contributing to corrosion or other forms of material degradation [
6,
7,
8,
9,
10,
11].
As a result, fuels that comply with the same nominal specifications may exhibit different corrosion-related behavior depending on factors such as composition, storage history, or conditions of use [
12,
13]. These differences may be subtle and not necessarily associated with pronounced corrosion damage, making them difficult to detect using conventional assessment approaches. This highlights the need for sensitive and objective methods capable of capturing small variations in corrosion-related effects of automotive fuels.
One of the established approaches for evaluating the corrosive potential of automotive fuels is the copper strip corrosion test specified in standardized methods for both gasoline and diesel fuels (EN ISO 2160) [
14]. The test is based on exposing a polished copper strip to a fuel sample under controlled conditions, followed by visual classification of surface discoloration using reference standards or descriptive criteria. While practical and widely applied, this method provides primarily categorical information and relies on visual assessment, which may limit its sensitivity to subtle differences between fuels.
Consequently, subtle corrosion-related changes may remain undetected if they do not result in a change of the assigned classification category, even though they may indicate differences in corrosion-related effects [
15]. The extent to which visual classification captures such subtle effects in modern automotive fuels remains subject to ongoing discussion. Given these limitations, there is increasing interest in evaluation approaches that provide greater objectivity and quantitative resolution. In this context, colorimetric techniques offer the potential to translate surface discoloration into numerical parameters, enabling the detection of subtle changes that may not be distinguishable by visual inspection alone.
Although the copper strip corrosion test is widely used in fuel quality assessment, its visual evaluation is inherently subjective and provides only categorical results. Such approaches may not capture subtle differences in surface condition, particularly within the same classification category.
Various analytical approaches have been explored to improve the evaluation of fuel–material interactions. These include electrochemical techniques, spectroscopic methods, and image-based approaches that enable more objective assessment of copper strip corrosion [
16,
17,
18].
While various methods have been applied to study fuel-induced corrosion, quantitative evaluation of copper strip discoloration using colorimetric techniques has received limited attention. In this context, colorimetric analysis represents a promising approach for extending the interpretative capability of the standardized copper corrosion test.
The aim of this study is to evaluate the applicability of a colorimetric approach for the assessment of copper corrosion in automotive gasoline and diesel fuels and to compare its performance with conventional visual evaluation according to the standardized test method.
2. Materials and Methods
Copper corrosion tests were performed using fresh gasoline and diesel fuel samples, as well as aged gasoline and diesel fuel samples (i.e., fuels stored in vehicle fuel systems for periods exceeding the recommended storage duration of 3 months specified in ČSN 65 6500 [
19]). The tests were carried out in accordance with EN ISO 2160, with modifications introduced to improve the reproducibility of copper strip surface preparation. Corrosion-related surface changes were evaluated using conventional visual classification and complemented by a colorimetric approach.
2.1. Fuel Samples
A total of eight automotive fuel samples were used in this study, comprising both commercially available fresh fuels and aged fuels obtained from the fuel systems of vehicles that had been out of regular operation. The set included gasoline and diesel fuels with and without oxygenated bio-components, enabling comparison of their corrosion-related behavior.
Fresh gasoline samples consisted of three E10 fuels: an E10 gasoline obtained from a filling station supplying fuels declared to be free of bio-components (i.e., without intentional addition of ethanol or other oxygenated compounds), and two commercially available E10 gasoline fuels, one containing up to 10% v/v ethanol and the other containing up to 22% ethyl tert-butyl ether (ETBE) as the oxygenated component. The designation E10 refers to the maximum permitted ethanol content (up to 10% v/v) or an equivalent oxygen content, and does not necessarily indicate the actual composition of the fuel. In addition, an aged gasoline sample was obtained from the fuel tank of a vehicle that had been out of regular operation for an extended period. The sample originated from a period when E5 gasoline was commonly used; therefore, the presence of ethanol (up to 5% v/v) is possible, although the exact composition was not analytically determined.
Fresh diesel samples comprised two B7 fuels: a B7 diesel fuel obtained from a filling station and declared as free of bio-components (i.e., without intentional addition of fatty acid methyl esters or other oxygenated compounds), and a commercially available B7 diesel fuel containing up to 7% FAME. To extend the comparison, two aged diesel fuel samples corresponding to fuel types commonly containing FAME were included. These fuels were collected from the fuel systems of vehicles that had been out of regular operation and originated approximately from the years 2020 and 2022, respectively.
In the case of the aged gasoline sample and the aged diesel fuel originating from approximately 2020, prolonged storage in the vehicle fuel system was associated with reduced fuel system performance. Detailed information on the operational history of the vehicles and previously used fuels was not available; therefore, the possible influence of residual components cannot be excluded.
All fresh commercial fuel samples were stored in closed containers suitable for hydrocarbon fuels, protected from light and air, at a temperature of 10–20 °C, in accordance with ČSN 65 6500. The storage duration did not exceed the specified limit of 24 months prior to testing.
The presence of oxygenated bio-components in fresh fuel samples was qualitatively verified by Fourier-transform infrared (FTIR) spectroscopy performed on a Nicolet Impact 400 spectrometer (Thermo Nicolet, Madison, WI, USA). FTIR spectra of E10 gasoline without bio-components were compared with those of E10 gasoline containing ethanol, revealing differences in characteristic spectral regions associated with ethanol. A similar comparative approach was applied to B7 diesel fuels, where differences between fuels with and without bio-components indicated the presence of fatty acid methyl esters (FAME). For E10 gasoline containing ethyl tert-butyl ether (ETBE), the measured FTIR spectrum was qualitatively compared with a publicly available reference spectrum of ETBE [
20], supporting the presence of this oxygenated component.
FTIR analysis was employed solely as a qualitative confirmation tool and was not intended for quantitative determination of bio-component content. The exact concentration of bio-components in the fuel samples was therefore not determined. The study focuses on comparative corrosion behavior of different fuel samples rather than on detailed compositional characterization.
2.2. Copper Corrosion Test and Strip Preparation
The copper corrosion test was performed in accordance with EN ISO 2160, with specific modifications to the copper strip surface preparation as described below.
Copper strips were prepared from copper material in compliance with the requirements of the standard and cut to the specified dimensions. The strips contained a small drilled hole at the edge, which originated from their original intended use; this feature did not affect the exposed surface evaluated for corrosion and was identical for all specimens.
Surface preparation of the copper strips was carried out using a cloth-covered polishing wheel. Although EN ISO 2160 specifies manual polishing as the final surface treatment, mechanical polishing using a polishing wheel was applied to achieve a uniform and reproducible surface finish. This approach is consistent with the alternative surface preparation options permitted in the standard.
Immediately after polishing, the copper strips were cleaned with isooctane (2,2,4-trimethylpentane; Penta Chemicals Unlimited, Prague, Czech Republic) as a rinse solvent to remove any residues and placed into glass test tubes containing the respective fuel samples. The test tubes were sealed with stoppers and maintained at 50 °C for 3 h, in accordance with the standard procedure. After exposure, the copper strips were removed, rinsed with isooctane to remove residual fuel, and evaluated for corrosion, as described in the following sections.
2.3. Visual Evaluation Procedure
Visual evaluation of copper corrosion was performed in accordance with EN ISO 2160. In the standardized procedure, the degree of corrosion is assessed by visual evaluation of the exposed copper strip and classified into predefined corrosion grades based either on comparison with reference corrosion standards (etalons) or, where such standards are not available, according to descriptive criteria provided in the standard. In the present study, classification was carried out using these descriptive criteria.
For both automotive gasoline and diesel fuels, the fuel specifications require that the corrosion result corresponds to corrosion Class 1. According to EN ISO 2160, corrosion Class 1 represents an acceptance criterion rather than a maximum corrosion level, as no further satisfactory classification grades are defined within this class. The standard further states that the descriptive classifications associated with the reference standards are provided for informational purposes only and do not represent transitional stages of corrosion. Consequently, these visual descriptions cannot be assigned defining numerical values, and the classification does not describe a continuous progression of surface degradation.
The standard also specifies decision rules for borderline cases. If the appearance of a copper strip falls between two reference corrosion grades, the strip is assigned to the darker (more severe) grade. Within corrosion Class 1, copper strips exhibiting darker orange discoloration than reference grade 1b are still considered acceptable. However, the appearance of any reddish coloration results in classification as corrosion Class 2. These rules illustrate that the visual evaluation is based on discrete appearance thresholds rather than on a continuous description of surface changes.
Furthermore, EN ISO 2160 acknowledges that the copper corrosion test is essentially a pass/fail procedure and that no generally accepted method for determining agreement between visual assessments is currently available. As a result, visual evaluation is inherently subjective, particularly when corrosion effects are weak and visual differences between reference grades are subtle.
In the present study, visual evaluation was therefore performed as an indicative assessment only, aimed at approximate classification of corrosion behavior according to the standard. The limitations associated with visual inspection motivated the use of colorimetric analysis as a complementary and more objective method for assessing surface discoloration, as described in the following section.
2.4. Colorimetric Measurement
Colorimetric analysis was used to provide a quantitative description of surface discoloration of the copper strips following the copper corrosion test. Colorimetric measurements were performed using a colorimeter (3nh, model NR200, Guangzhou, China) under standard illumination conditions (D65, corresponding to standard daylight).
Color measurements were conducted in the CIE L*a*b* color space [
21], where L* represents lightness, a* the red–green axis, and b* the yellow–blue axis. The instrument provided L*, a*, and b* coordinates, as well as derived color parameters including chroma (C*, representing color saturation) and hue angle (h*, representing the hue). Color differences were calculated automatically by the instrument and reported as ΔL*, Δa*, Δb*, ΔC*, ΔH*, and the total color difference ΔE*.
The total color difference (ΔE*
ab) was used as the primary parameter for quantitative evaluation of surface discoloration and was calculated according to the CIE definition:
where ΔL*, Δa*, and Δb* represent differences in the respective color coordinates between the tested copper strip and the reference sample. The applied colorimetric procedure is based on standard CIE L*a*b* color space evaluation. The instrument automatically calculates color differences (ΔE*
ab) from measured L*, a*, and b* coordinates.
A single polished copper strip was prepared and used as a reference sample. This reference strip was not exposed to fuel and served as the baseline for color difference evaluation. All tested copper strips were measured after completion of the copper corrosion test, and color differences were calculated relative to the reference strip.
For each copper strip, color measurements were performed at two locations on visually homogeneous areas of the exposed surface to minimize the influence of local surface irregularities. Each fuel sample was tested once, and one copper strip was used per sample. This procedure was applied consistently to all samples.
3. Results
The results of the copper corrosion tests are presented below. Visual inspection and standardized classification according to EN ISO 2160 were compared with quantitative colorimetric evaluation to assess the sensitivity of both approaches in distinguishing corrosion-related surface changes.
3.1. Visual Evaluation Results
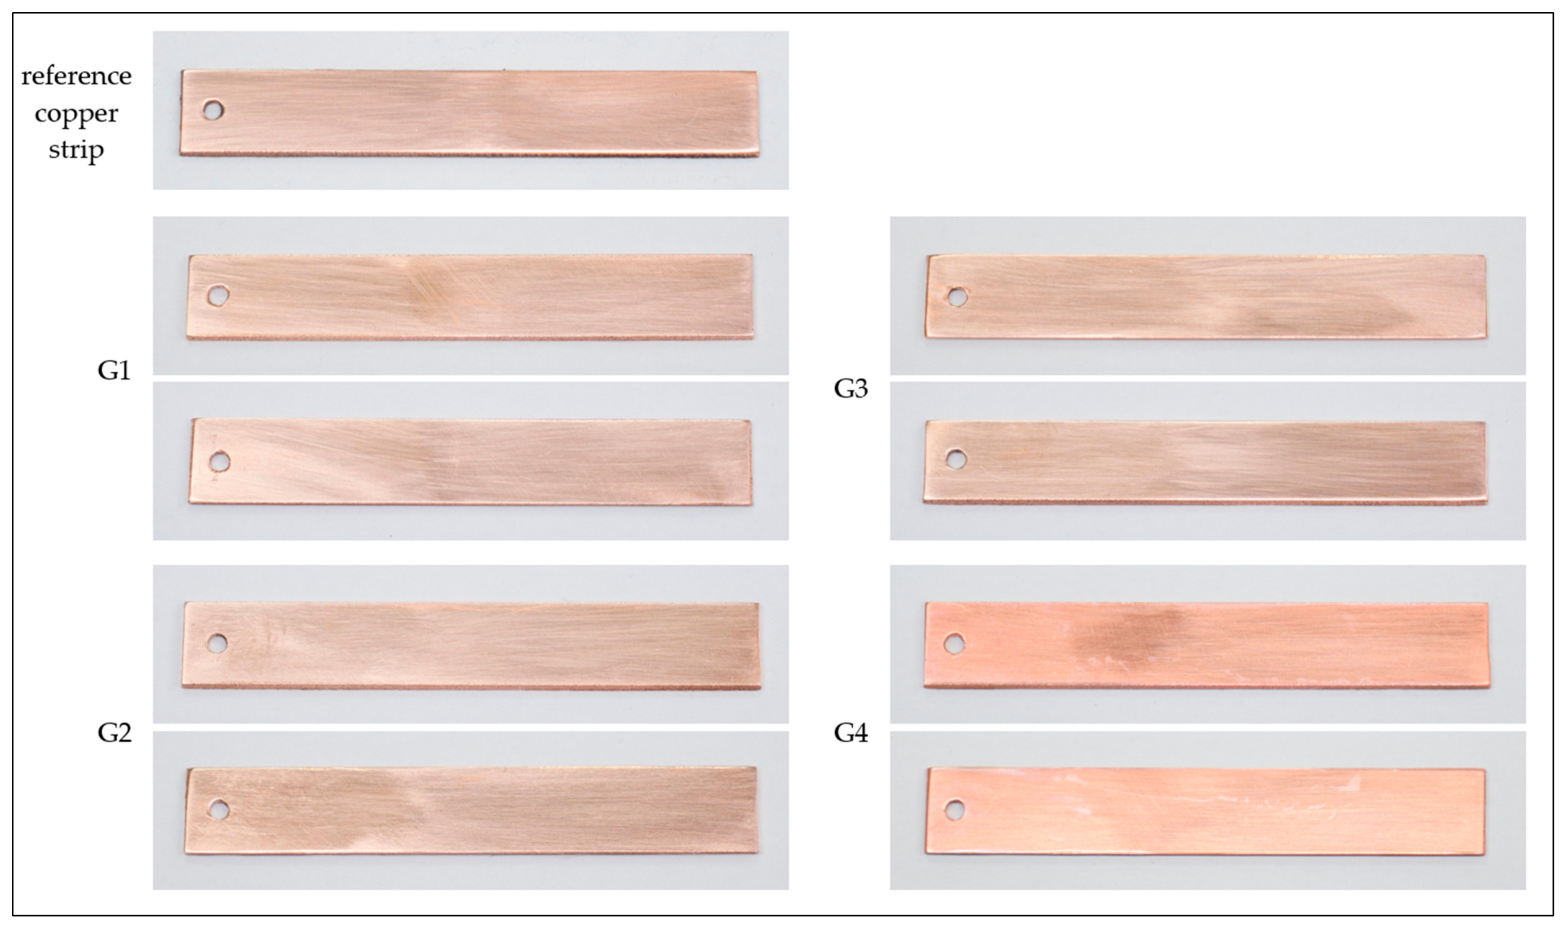
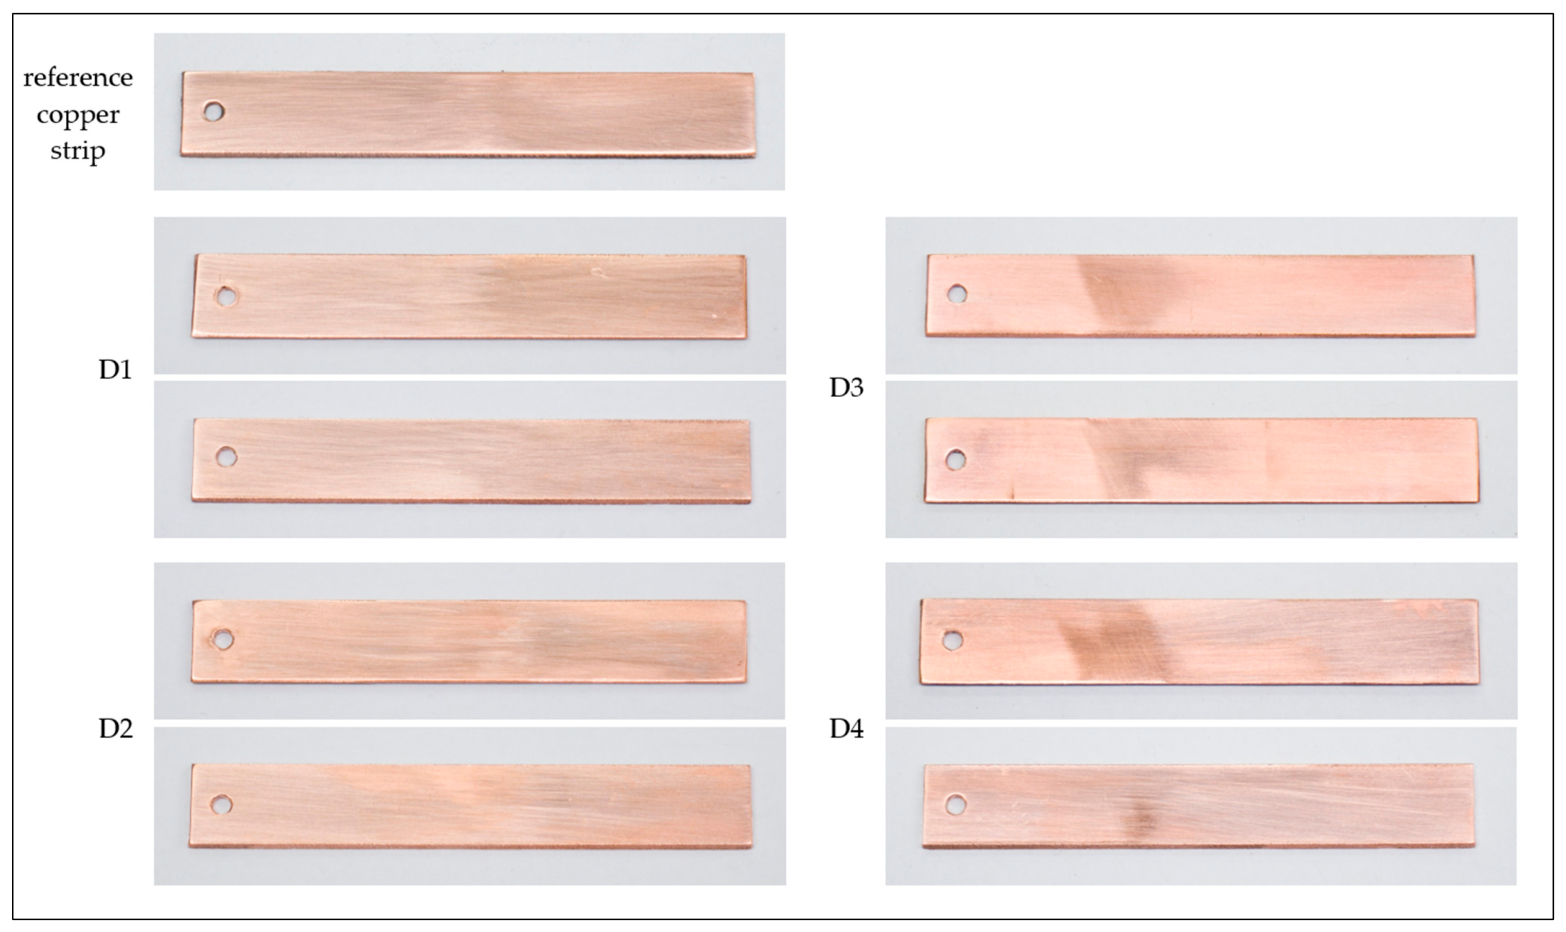
Visual evaluation of copper strips after exposure to the tested fuels was carried out in accordance with EN ISO 2160. Representative photographs of the exposed copper strips shown from both sides, together with a non-exposed reference copper strip, are presented in
Figure 1 and
Figure 2.
Overall, only minor visible changes in surface appearance were observed for all tested fuel samples. No pronounced corrosion features, such as reddish discoloration or surface pitting, were detected by visual inspection. According to the standardized classification criteria, all fuel samples were visually classified as corrosion Class 1, which fulfills the requirements specified for both automotive gasoline and diesel fuels.
Most copper strips exhibited surface appearances corresponding to reference grade 1 a, characterized by very slight or negligible discoloration. One aged gasoline sample showed slightly darker surface coloration approaching the appearance of reference grade 1 b. However, as no reddish coloration was observed, this sample remained within corrosion Class 1 in accordance with the standard classification rules.
The results of the visual classification for all tested fuel samples are summarized in
Table 1. Overall, the standardized visual evaluation classified all tested fuels within corrosion Class 1 and did not reveal systematic differences related to fuel composition, including fuel age or the presence of bio-components.
To ensure visual consistency across the photographic documentation, images were captured under as similar lighting conditions as possible. Minor uniform exposure adjustments were applied to all photographs using Zoner Photo Studio X (Zoner a.s., Brno, Czech Republic) to achieve a consistent background appearance. No selective image enhancement or color correction of the copper strips was performed.
3.2. Colorimetric Results
Colorimetric evaluation enabled a quantitative assessment of surface discoloration of copper strips after exposure to the tested fuels. The total color difference ΔE*
ab was used as the primary parameter for comparison. For each copper strip, ΔE*
ab values were determined relative to the non-exposed reference copper strip, as described in
Section 2.4.
Color measurements were performed at two locations on the exposed surface of each copper strip. For each fuel sample, two ΔE*ab values relative to the reference strip were obtained, and the reported mean ΔE*ab value represents the arithmetic mean of these two measurements. This approach was applied to reduce the influence of local surface inhomogeneities on the evaluation of surface discoloration.
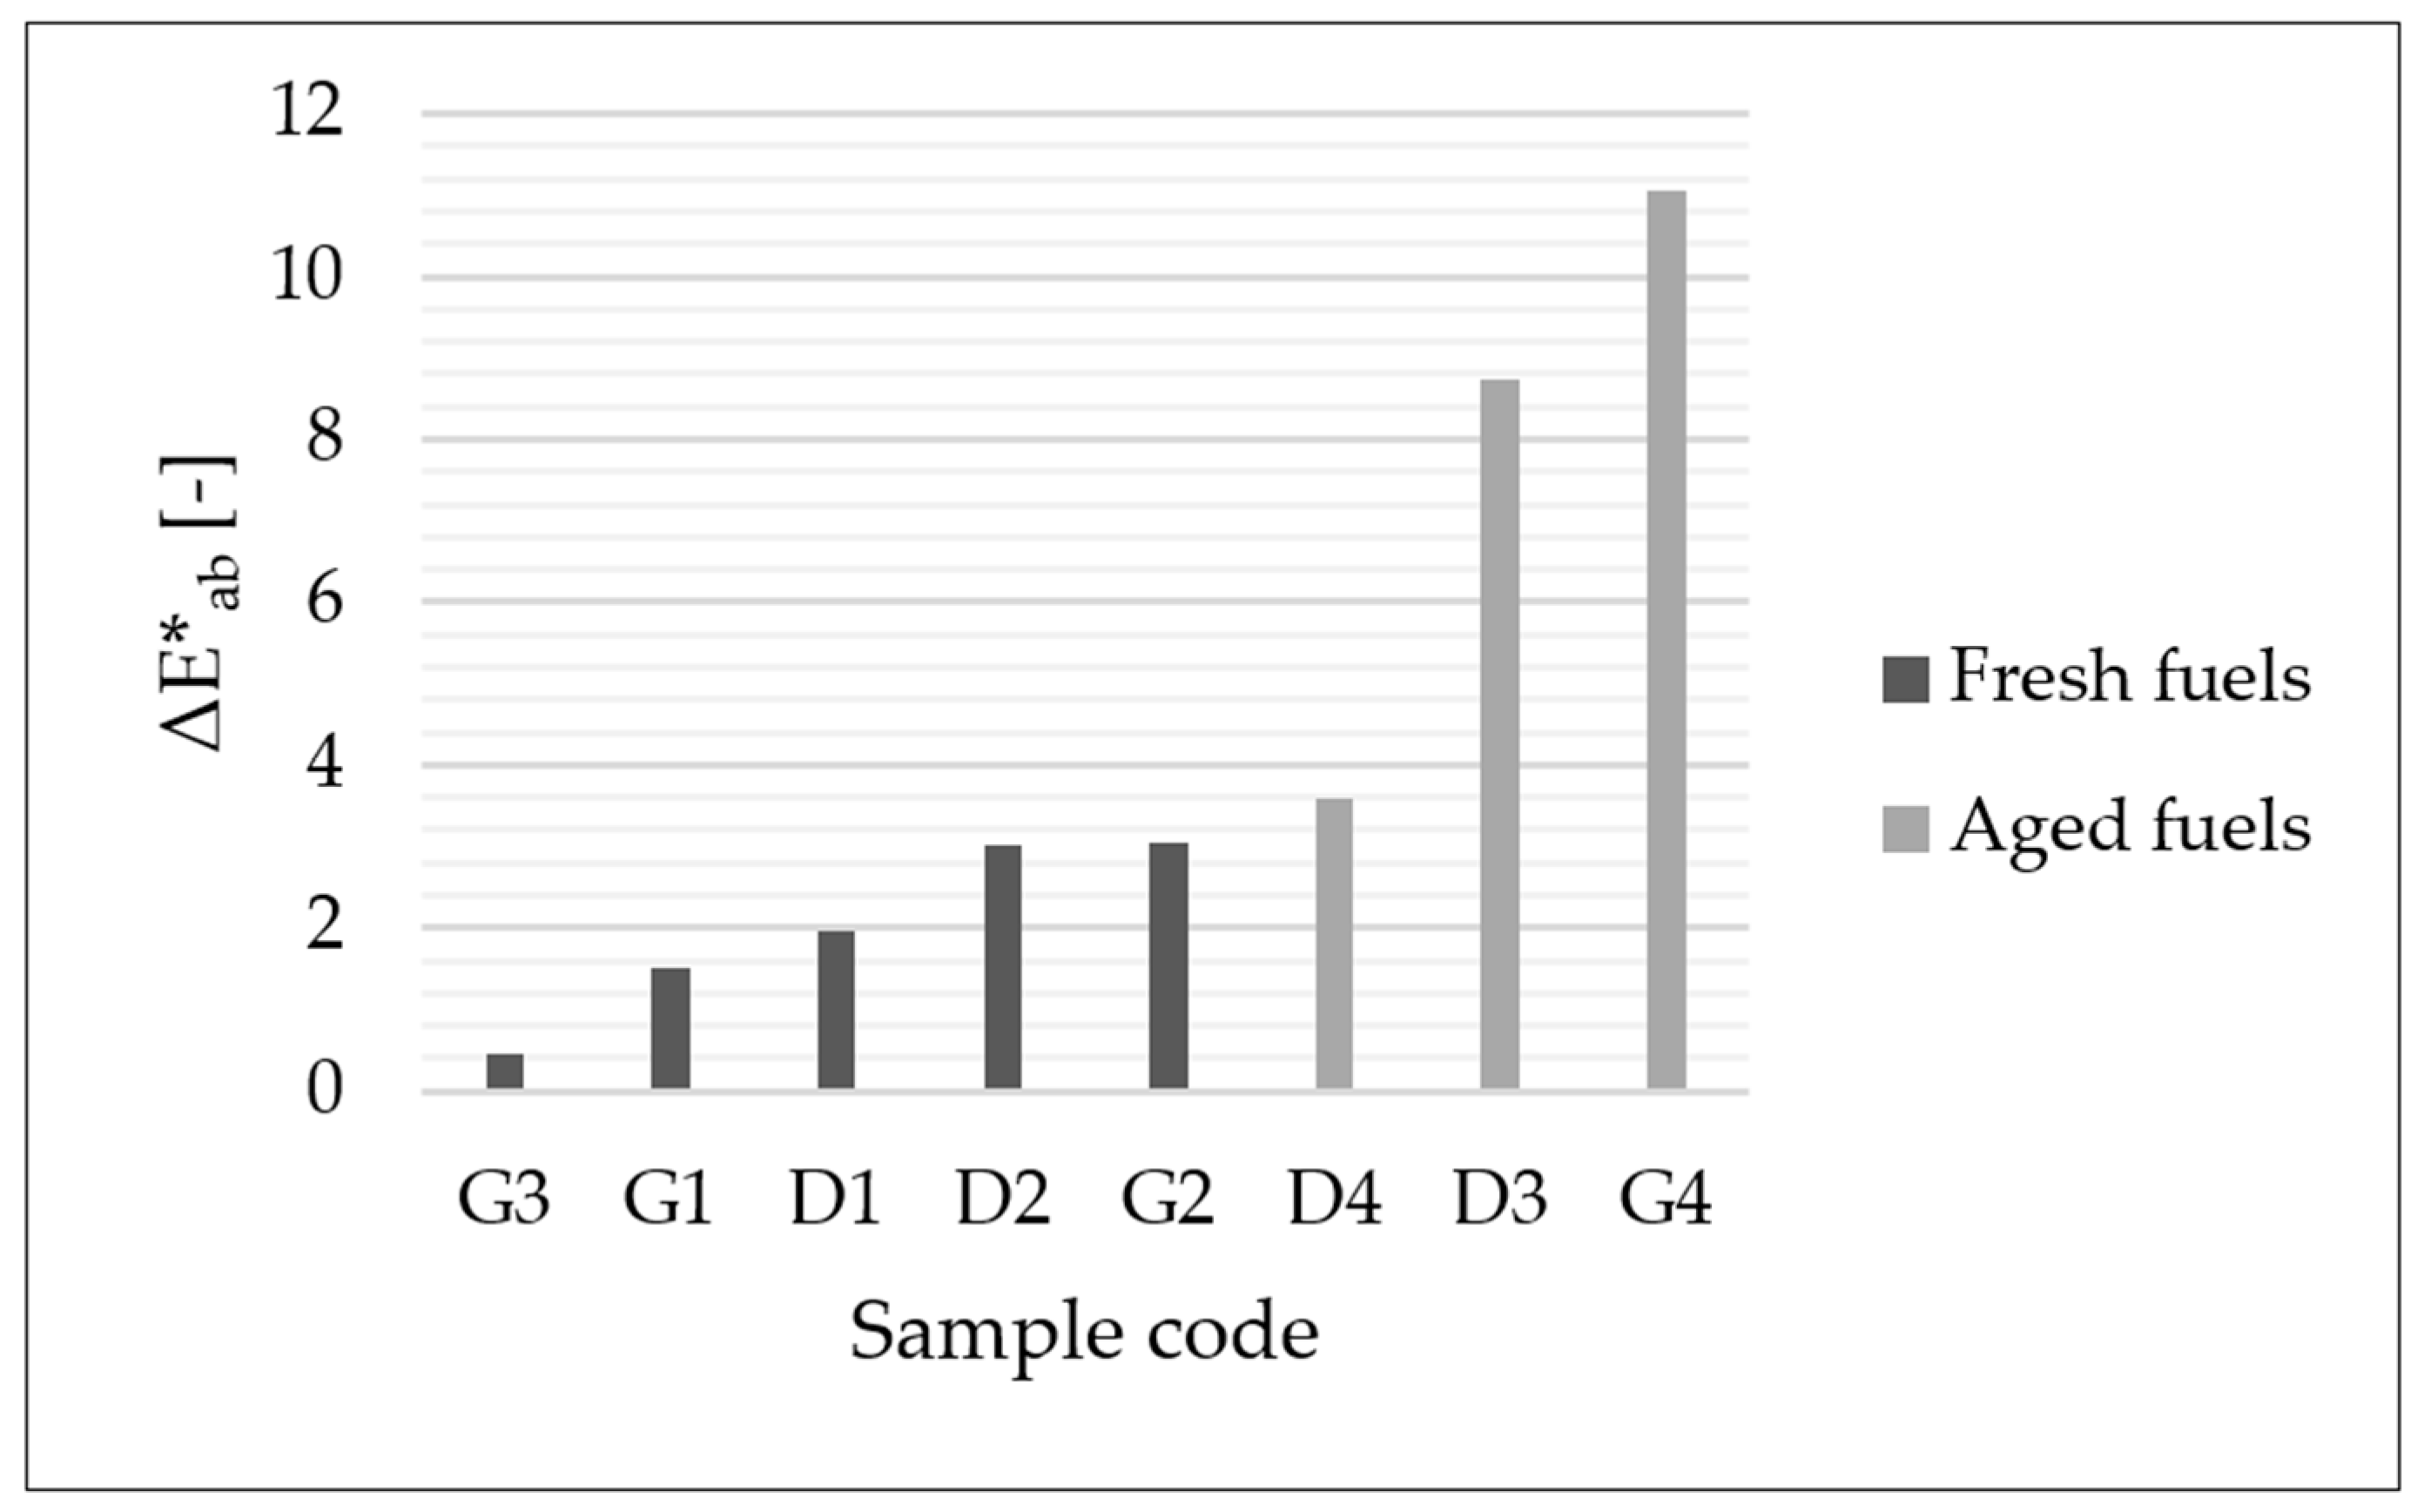
The mean ΔE*
ab values obtained for all tested fuel samples are summarized in
Table 2 and graphically presented in
Figure 3. The results show that, despite identical visual classification within corrosion Class 1 according to EN ISO 2160, measurable differences in surface discoloration were detected by colorimetric analysis.
The mean ΔE*ab values were generally higher for aged fuel samples compared to fresh fuels. Among the tested samples, the gasoline containing ETBE exhibited the lowest mean ΔE*ab value. Fuels containing ethanol or FAME showed slightly higher mean ΔE*ab values than fuels without oxygenated components. However, based on the limited number of individual samples tested, no clear relationship between the presence of bio-components and the magnitude of ΔE*ab values can be established. Although all samples were visually classified within Class 1, colorimetric analysis revealed measurable differences in surface discoloration between individual fuels.
4. Discussion
The copper strip corrosion test according to EN ISO 2160 is based on discrete visual grades intended for classification of fuel corrosivity. In the present study, fuels assigned to the same class produced different colorimetric responses, indicating variations in surface discoloration not distinguished within the standardized visual scale. The colorimetric evaluation is therefore considered a complementary approach providing supplementary descriptive information. The following sections discuss the relation of these observations to fuel aging, the presence of bio-components, and the limitations of the applied approach.
4.1. Interpretation of Visual and Colorimetric Copper Corrosion Assessment
Visual evaluation of copper corrosion according to EN ISO 2160 classified all tested fuel samples within Class 1. Most samples were assigned to Class 1 a, while one sample exhibited surface characteristics considered borderline between Class 1 a and Class 1 b. Based on this test result, all fuels met the acceptance limits specified in fuel standards (e.g., EN 228 and EN 590).
In contrast to the visual classification of all samples within the same acceptance category, colorimetric evaluation revealed measurable differences in surface discoloration between individual copper strips. The majority of samples exhibited relatively small total color differences (mean ΔE*ab values up to approximately 4), indicating similar levels of discoloration within the tested set of samples. However, the sample classified as borderline Class 1 b showed a higher mean ΔE*ab value (11.06), while one additional sample exhibited an intermediate mean ΔE*ab value (8.73). These results demonstrate that, even within a single visual classification category, quantitative differences in surface appearance can be detected by colorimetric analysis.
The apparent discrepancy between the visual and colorimetric results does not represent a contradiction but rather reflects the different purposes and sensitivities of the two approaches. The copper corrosion test according to EN ISO 2160 provides a visual rating scale, which is used in fuel specifications as a pass/fail acceptance criterion, where Class 1 represents compliance with the fuel specification rather than a continuous corrosion scale [
1,
2]. Consequently, the standard does not aim to resolve subtle differences in surface discoloration within the acceptance range, and such differences are not expected to be reflected in the visual classification.
Visual assessment and colorimetric analysis therefore provide complementary information. Visual evaluation is intended to identify macroscopic features such as local discoloration, surface heterogeneity, or changes in reflectivity, which may be relevant for practical inspection [
14]. In contrast, colorimetric measurement quantifies average color changes within selected homogeneous areas of the copper surface and enables consistent numerical comparison between samples.
The observed colorimetric differences within Class 1 may reflect subtle surface variations not readily detectable by visual inspection under the test conditions and not necessarily developing into visible corrosion during the duration of the standardized test. These findings provide a basis for further discussion of factors that may contribute to such variability, including fuel aging and the presence of oxygenated bio-components, which are addressed in the following sections. Previous studies have shown that corrosion-related behavior can be influenced by fuel composition and aging processes [
7,
22,
23,
24], which may lead to differences not readily captured by standardized evaluation approaches.
4.2. Influence of Fuel Aging
Fuel aging is a complex process primarily driven by oxidation reactions occurring during storage and handling of automotive fuels [
25]. These processes may lead to the formation of oxygen-containing species, weak acids, and other reactive compounds that can influence fuel–material interactions even when standard fuel quality parameters remain within specification limits [
22,
26].
In the present study, aged fuel samples exhibited higher mean ΔE*
ab values compared to fresh fuels. Although chemical aging markers were not directly quantified, this trend suggests that compositional changes occurring during fuel storage may influence fuel–metal interactions. Oxidation processes have been reported to modify the chemical environment at the metal–fuel interface without necessarily resulting in visually distinguishable corrosion under standardized test conditions [
23].
Previous studies further indicate that aging-related changes in fuels can increase the tendency for surface discoloration of copper and copper-containing alloys, even when corrosion remains within acceptable limits defined by standardized tests [
7,
22]. Such effects may remain subtle and therefore may not be detected by categorical visual assessment, particularly when the degree of corrosion does not exceed the acceptance threshold.
The observed variability in colorimetric parameters among visually compliant samples is therefore consistent with the notion that fuel aging may contribute to minor differences in surface appearance that are not resolved by pass/fail evaluation. The present results do not establish a causal relationship but indicate a possible association between fuel aging and the observed colorimetric variability. Colorimetric analysis may therefore be sensitive to surface changes potentially associated with early stages of fuel aging.
These considerations emphasize the importance of considering fuel aging when interpreting copper corrosion test results and provide a basis for examining compositional factors, including oxygenated bio-components, that may affect aging behavior, as discussed in the following section. The possible presence of ethanol or other oxygenated components in the aged gasoline sample may have influenced the observed colorimetric response; however, this effect cannot be evaluated within the scope of the present study.
4.3. Role of Bio-Components
Given that oxygenated bio-components such as ethanol and FAME may influence fuel stability and oxidation processes [
23,
27], their potential contribution to the observed differences in surface discoloration was considered. Previous studies indicate that corrosion-related behavior in oxygenated fuel blends can depend not only on the nominal bio-component content but also on storage conditions and fuel history [
28,
29,
30].
In the present study, fuels containing bio-components showed slightly higher mean ΔE*ab values than fuels without oxygenated components; however, these differences were not uniform across all tested samples. Given the limited number of individual fuels examined, the results do not allow for establishing a direct relationship between the presence of bio-components and the extent of surface discoloration under the applied test conditions.
The influence of bio-components on corrosion-related processes may be mediated through their contribution to aging processes, including oxidation and the formation of trace reactive compounds [
31]. Consequently, fuels with similar nominal composition may exhibit different behavior depending on their storage history, while fuels differing in bio-component content may produce comparable outcomes in short-term standardized tests.
These findings indicate that bio-components should be regarded as one of several factors potentially affecting fuel degradation behavior rather than as independent predictors of copper surface alteration. The absence of a clear relationship in the present study is therefore consistent with the multifactorial nature of fuel degradation processes and does not exclude the possibility that bio-components may influence material interactions under different exposure conditions [
32,
33].
4.4. Implications and Limitations
The results of this study indicate that colorimetric evaluation can provide additional quantitative information on copper surface discoloration beyond the categorical outcome of the standardized copper corrosion test. While the visual method remains suitable for determining compliance with fuel specifications, the colorimetric approach enables differentiation between samples that meet the same acceptance criterion. This may be useful in comparative studies, monitoring of fuel quality changes, or research focused on early-stage fuel–material interactions.
At the same time, the present work does not propose replacing the standardized visual evaluation. The copper corrosion test defined by EN ISO 2160 serves a specific purpose as an acceptance test, and the colorimetric method should be regarded as a complementary analytical tool rather than an alternative compliance procedure.
Several limitations should be considered when interpreting the results. The study was performed under controlled laboratory conditions using a limited number of individual fuel samples and a single measurement device. Color measurements were conducted at selected homogeneous surface locations, and the results therefore represent localized average color changes rather than a comprehensive spatial characterization of the copper surface. Furthermore, the study did not directly quantify oxidation products or chemical markers of fuel aging; thus, the relationship between colorimetric changes and specific chemical processes remains indirect. Due to the limited number of individual samples and the exploratory nature of this study, statistical analysis was not considered appropriate. A larger number of samples could further improve the robustness of the results and represents a direction for future research. The absence of complementary physicochemical parameters limits the possibility of direct comparison with other studies and should be addressed in future research.
Future research may also focus on correlating colorimetric parameters with chemical indicators of fuel degradation, extending the analysis to longer storage periods, increasing the number of tested fuel formulations, and evaluating reproducibility across different instruments and operators. Such investigations would help clarify the practical applicability of colorimetric evaluation in fuel quality assessment and material compatibility studies.
5. Conclusions
This study compared conventional visual evaluation of copper corrosion with colorimetric assessment of copper strips following the standardized corrosion test for automotive fuels. All tested samples met the acceptance criterion of EN ISO 2160 and were visually classified within Class 1; however, colorimetric analysis revealed measurable differences in surface discoloration between individual fuels, with ΔE*ab values ranging from 0.4 to 11.1. Higher ΔE*ab values were observed for aged fuels, whereas no clear relationship between bio-component presence and colorimetric differences could be established based on the limited number of tested samples.
The results indicate that the standardized visual method remains suitable for compliance assessment, whereas colorimetric evaluation provides additional quantitative information within the acceptance range of the test. While visual evaluation considers the overall surface appearance, including local heterogeneities, colorimetric measurement quantifies color changes within selected homogeneous areas of the copper surface. Colorimetry may therefore serve as a complementary analytical tool in comparative studies and in the monitoring of subtle fuel–material interactions.
Based on the obtained results, a combined evaluation approach is recommended. Visual classification according to EN ISO 2160 can be used for standard compliance assessment, while colorimetric analysis may serve as a complementary tool for detecting subtle differences within the same classification category. This approach can improve the sensitivity of fuel quality evaluation, particularly for samples meeting the acceptance criteria of EN ISO 2160. This study demonstrates that colorimetric evaluation enables quantitative differentiation between fuels within the same standardized corrosion classification, providing additional insight beyond conventional visual assessment.