
Natural Gas Conversion and Organic Waste Gasification by Detonation-Born Ultra-Superheated Steam: Effect of Reactor Volume

 ,
,  , , and
Abstract
:
1. Introduction
C + CO2 = 2CO
C + 2H2 = CH4
2C + 2H2O = CH4 + CO2
CO + 3H2 = CH4 + H2O
CO2 + 4H2 = CH4 + 2H2O
2CO + 2H2 = CH4 + CO2
CnHm + nH2O = nCO + (n + 0.5 m) H2
CnHm + nCO2 = 2nCO + 0.5 mH2
2. Methods and Materials
2.1. Technology
2.2. Gasifier
2.3. Materials
3. Results
3.1. Natural Gas Conversion
3.2. Liquid/Solid Waste Gasification
3.2.1. Liquid Waste
3.2.2. Solid Waste
4. Discussion
5. Conclusions
- (1)
- Complete conversion of natural gas to product syngas was obtained with H2/CO and CO2/CO ratios equal to 1.25 and 0.25, irrespective of the reactor volume. As compared to the mature syngas production process via natural gas reforming by high-temperature steam (1000–1300 K), the PD gun technology has several advantages: 100% conversion, lack of catalysts, normal operation pressure, and conventional construction materials.
- (2)
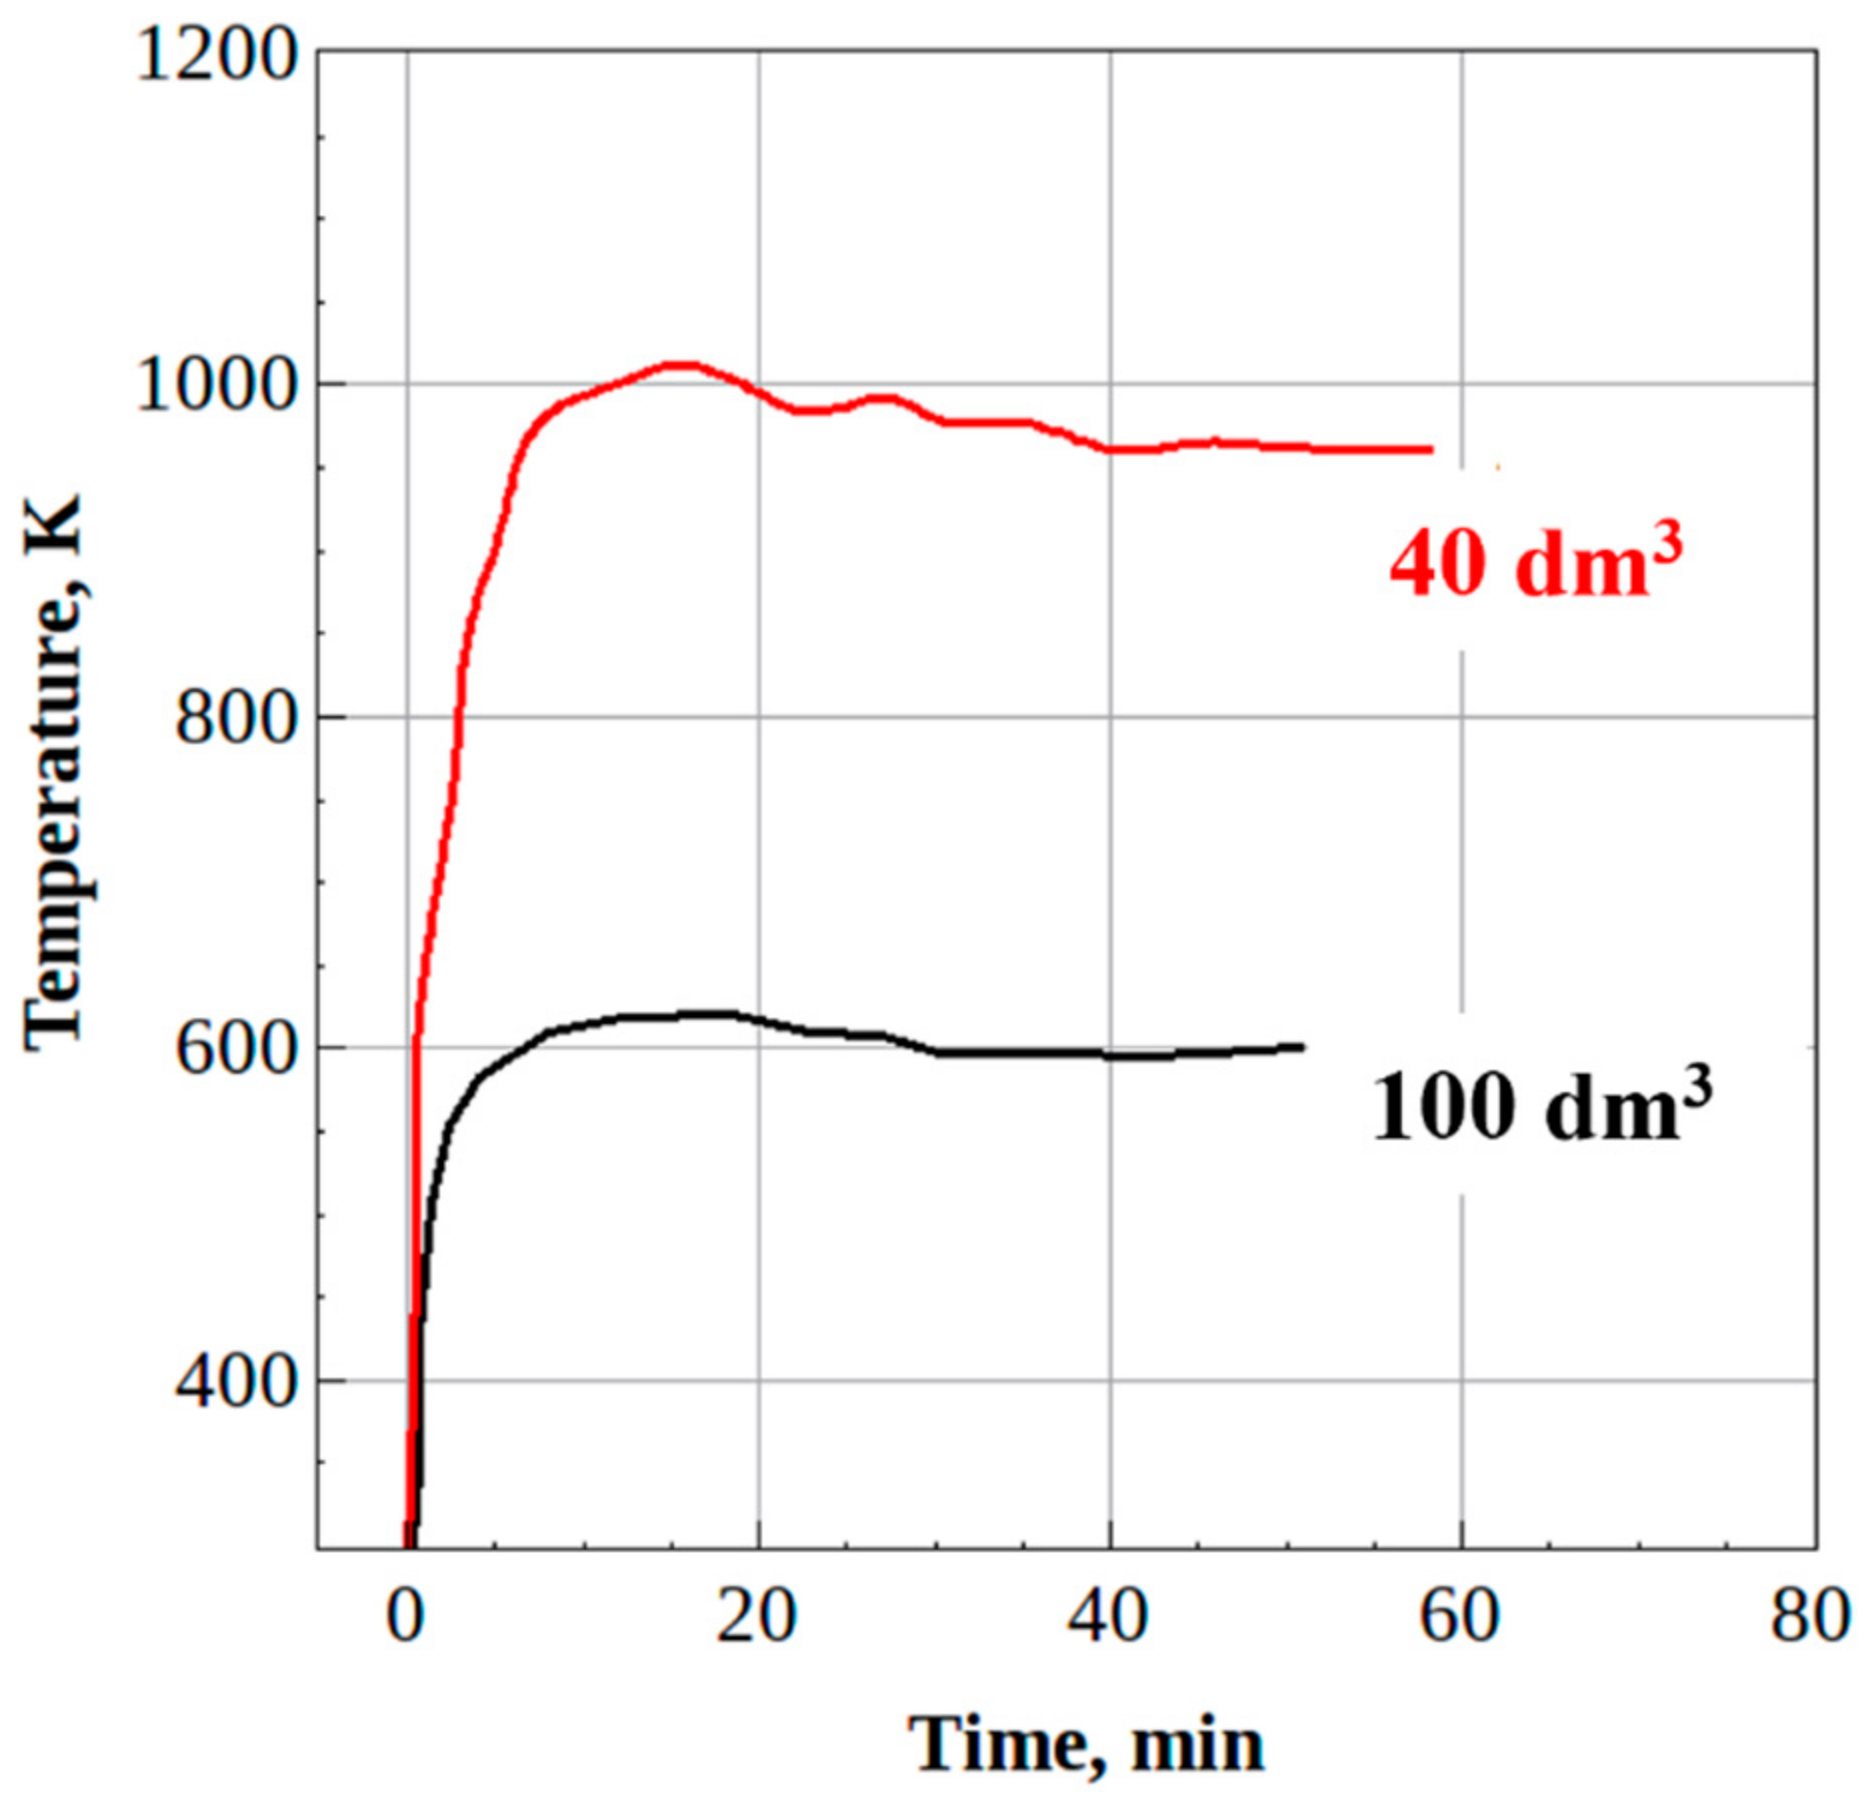
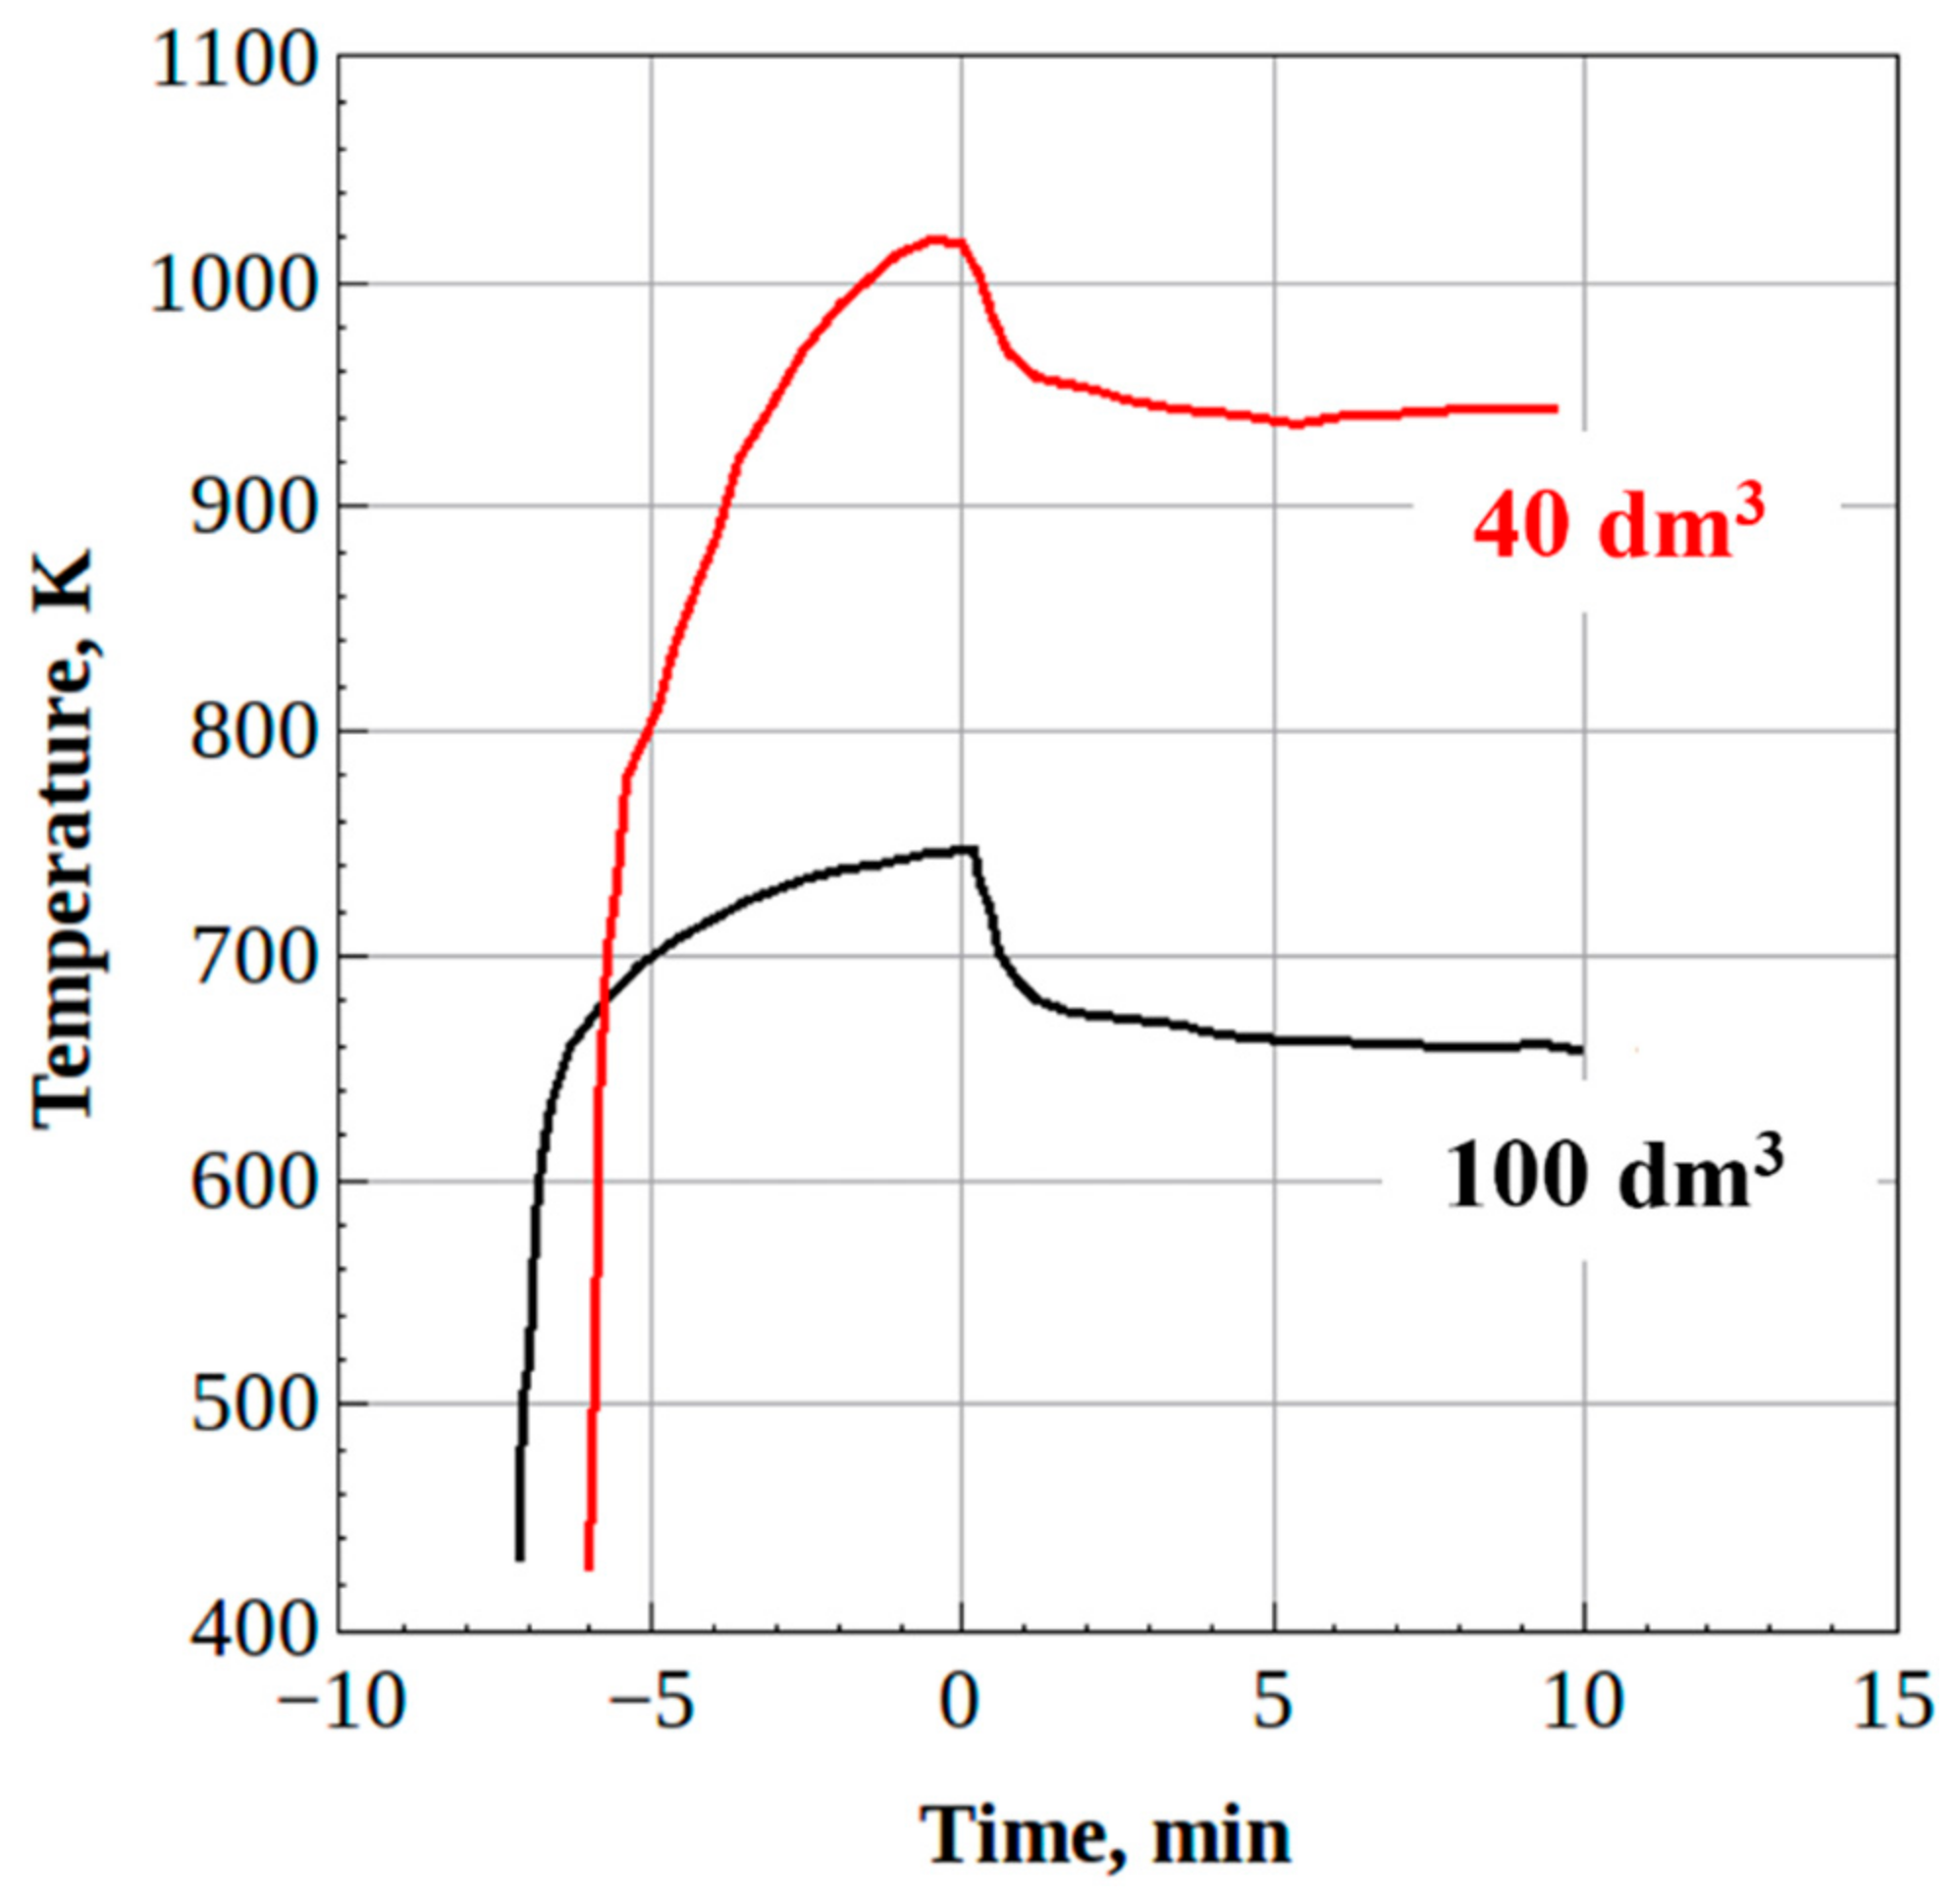
- The steady-state H2/CO and CO2/CO ratios in the syngas produced from waste machine oil were 0.8 and 0.5 for the 100-dm3 reactor and 0.9 and 0.2 for the 40-dm3 reactor, respectively, thus indicating the improvement in syngas quality. Moreover, the mass flow rate of feedstock in the 40-dm3 reactor was increased by a factor of over 4, as compared to the 100-dm3 reactor.
- (3)
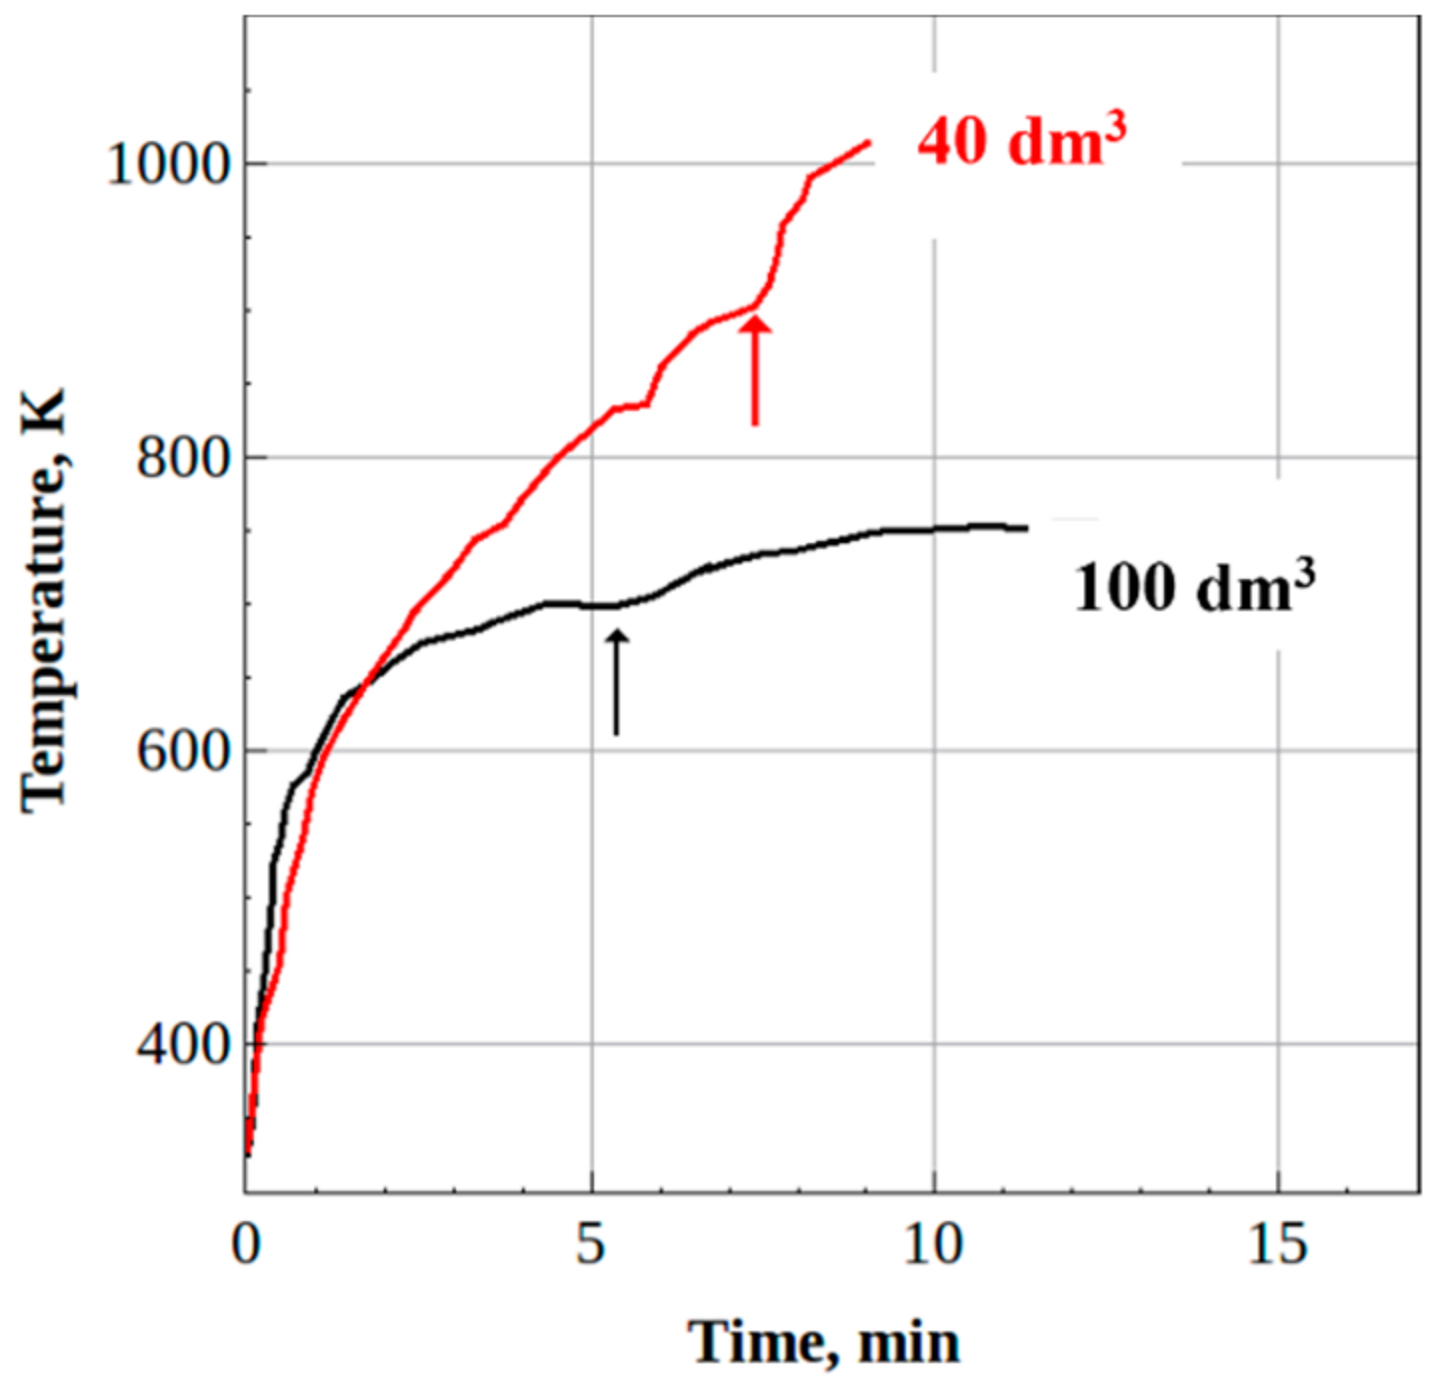
- The steady-state H2/CO and CO2/CO ratios in the syngas produced from the fixed weight (2 kg) batches of wood sawdust were 0.5 and 0.8 for both reactors, while the gasification time of the batches was nearly the same.
- (4)
- Wood sawdust properties such as moisture and particle size distribution appeared to be less significant compared to other gasification technologies presumably because strong shock waves and supersonic USS jets facilitated rapid primary fragmentation of the packed piles of wet sawdust particles, secondary fragmentation of particles, fast moisture vaporization, and short residence times of gases in the reactors.
- (5)
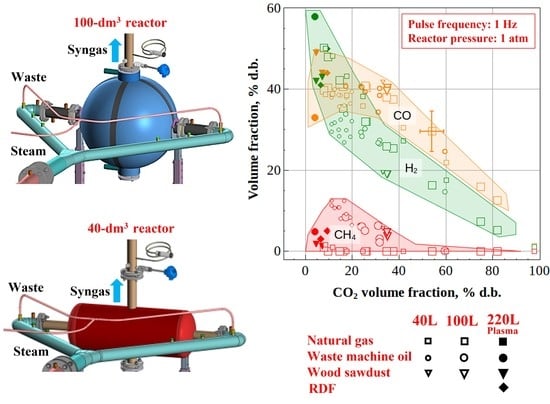
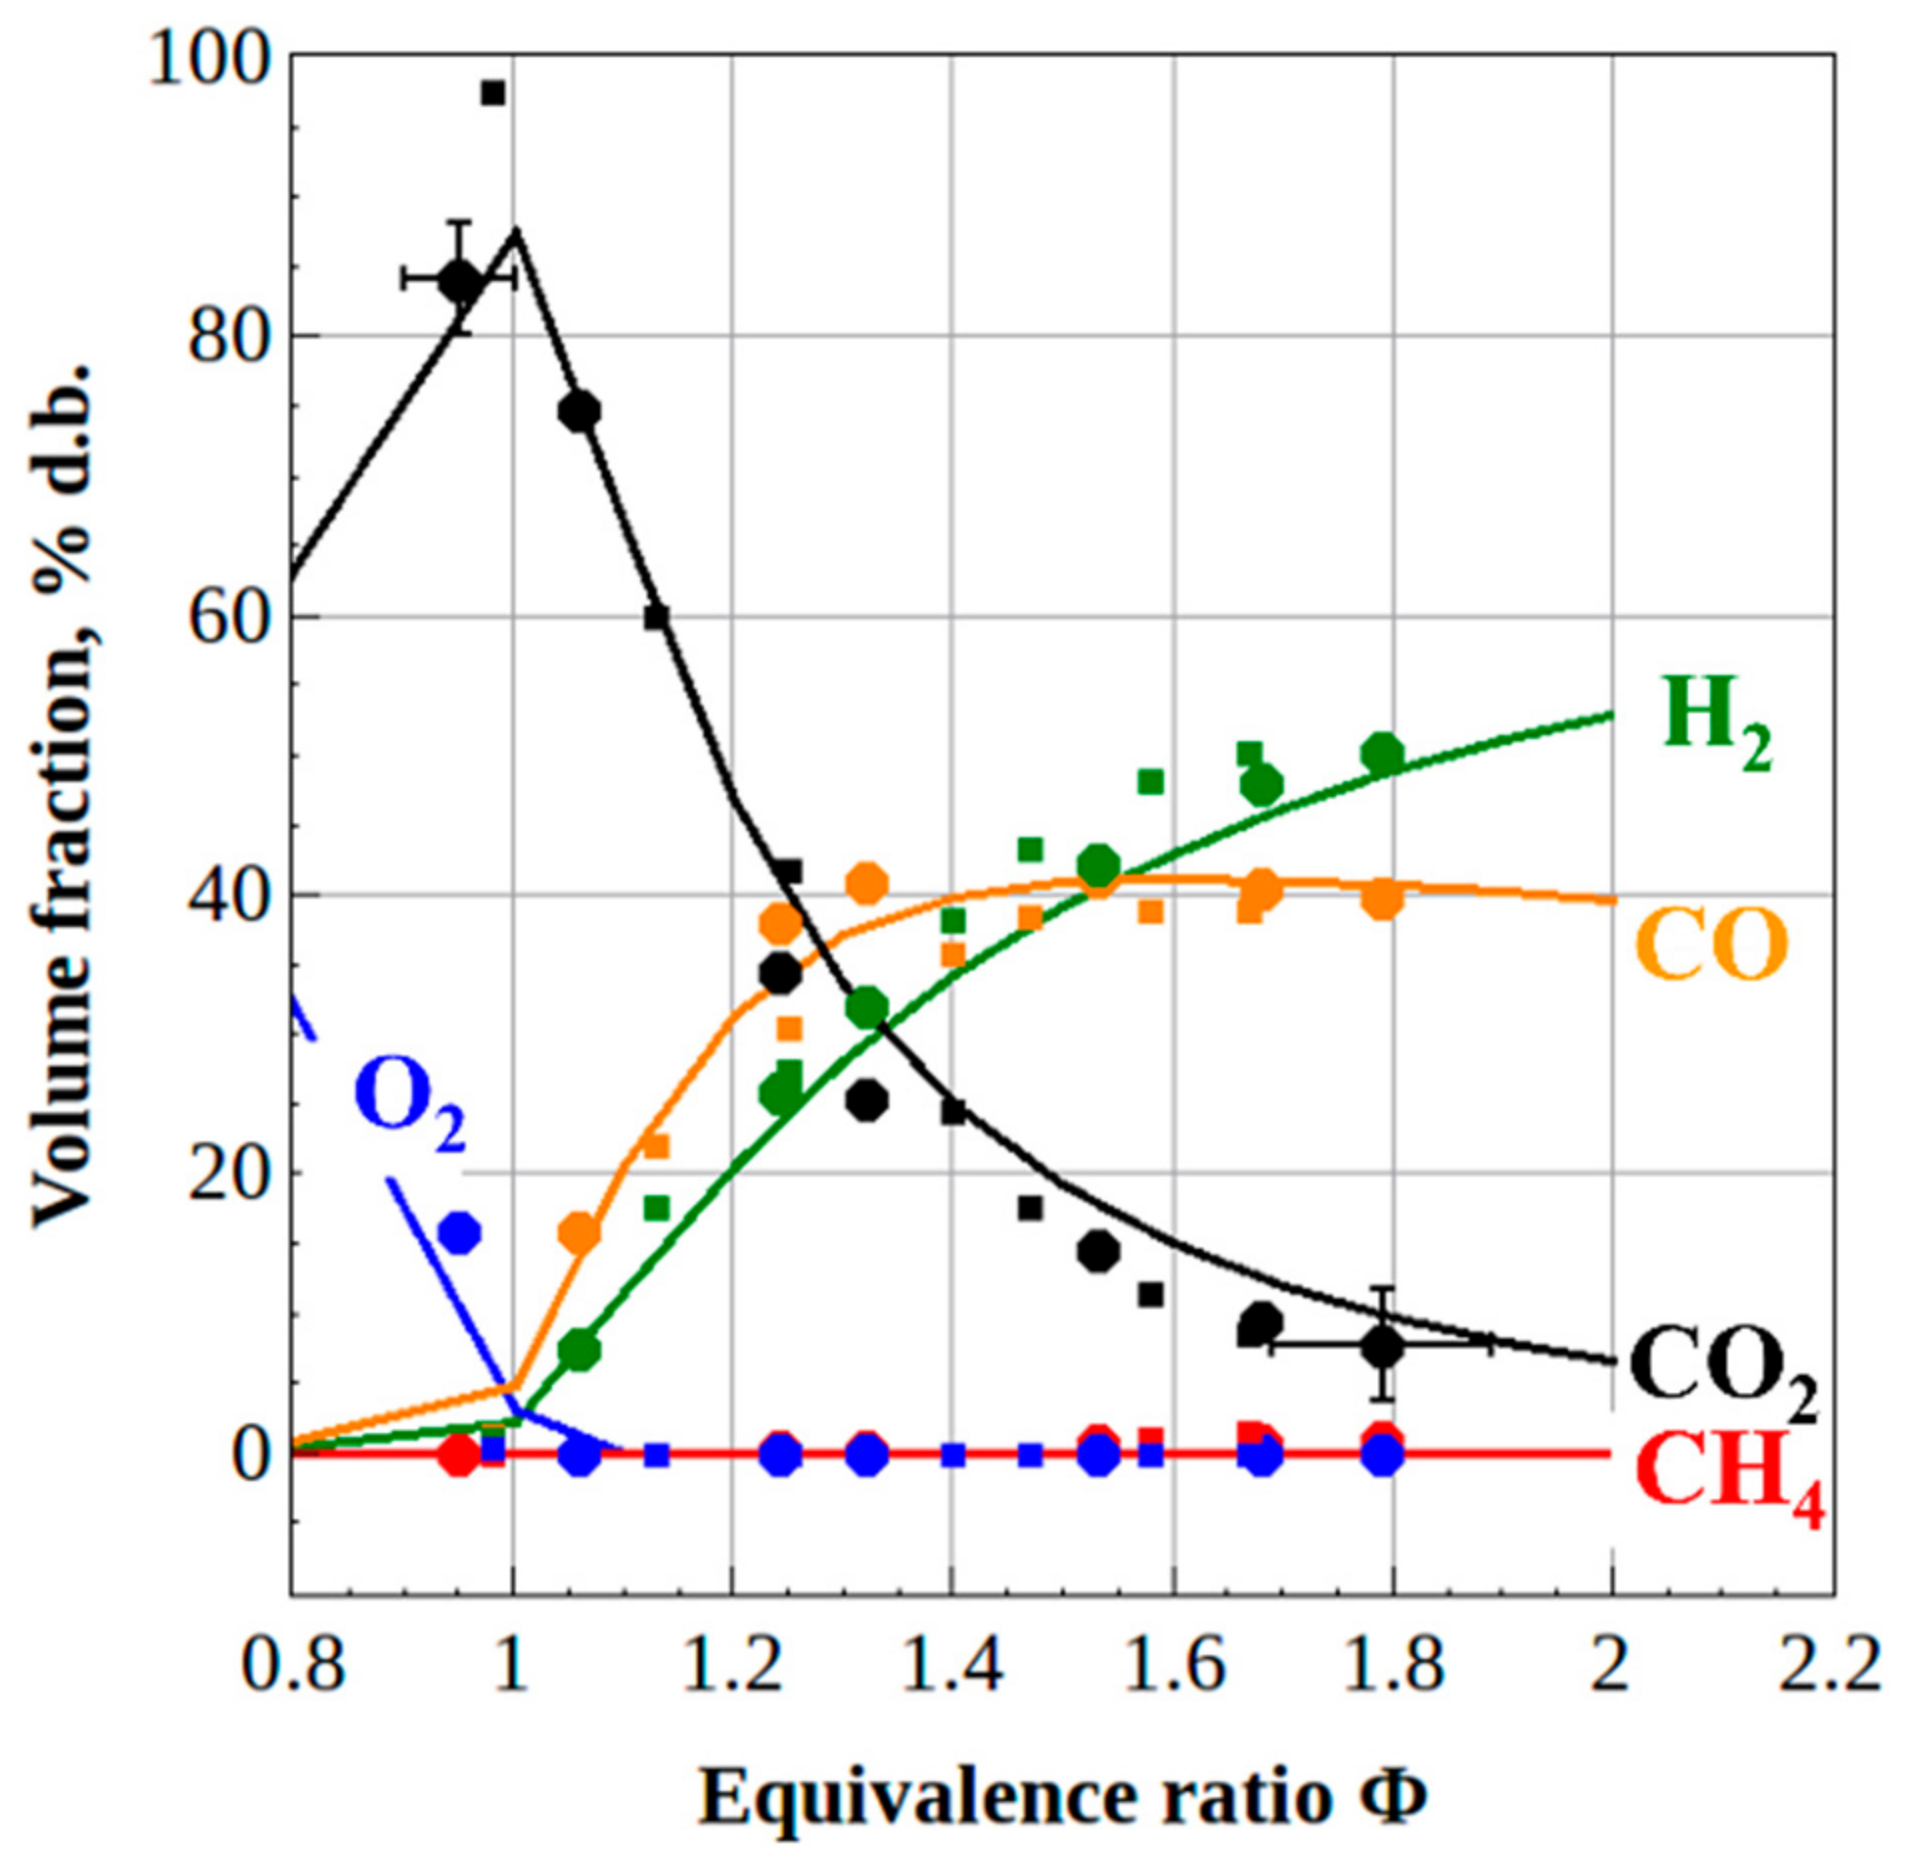
- The measured H2 vs. CO2 and CO vs. CO2 dependences for the syngas produced by the autothermal high-temperature conversion of natural gas and atmospheric-pressure oxygen-free allothermal gasification of liquid/solid organic wastes by detonation-born ultra-superheated steam were shown to be almost independent of the feedstock and reactor volume, which was caused by high local instantaneous gasification temperatures in the reactors.
- (6)
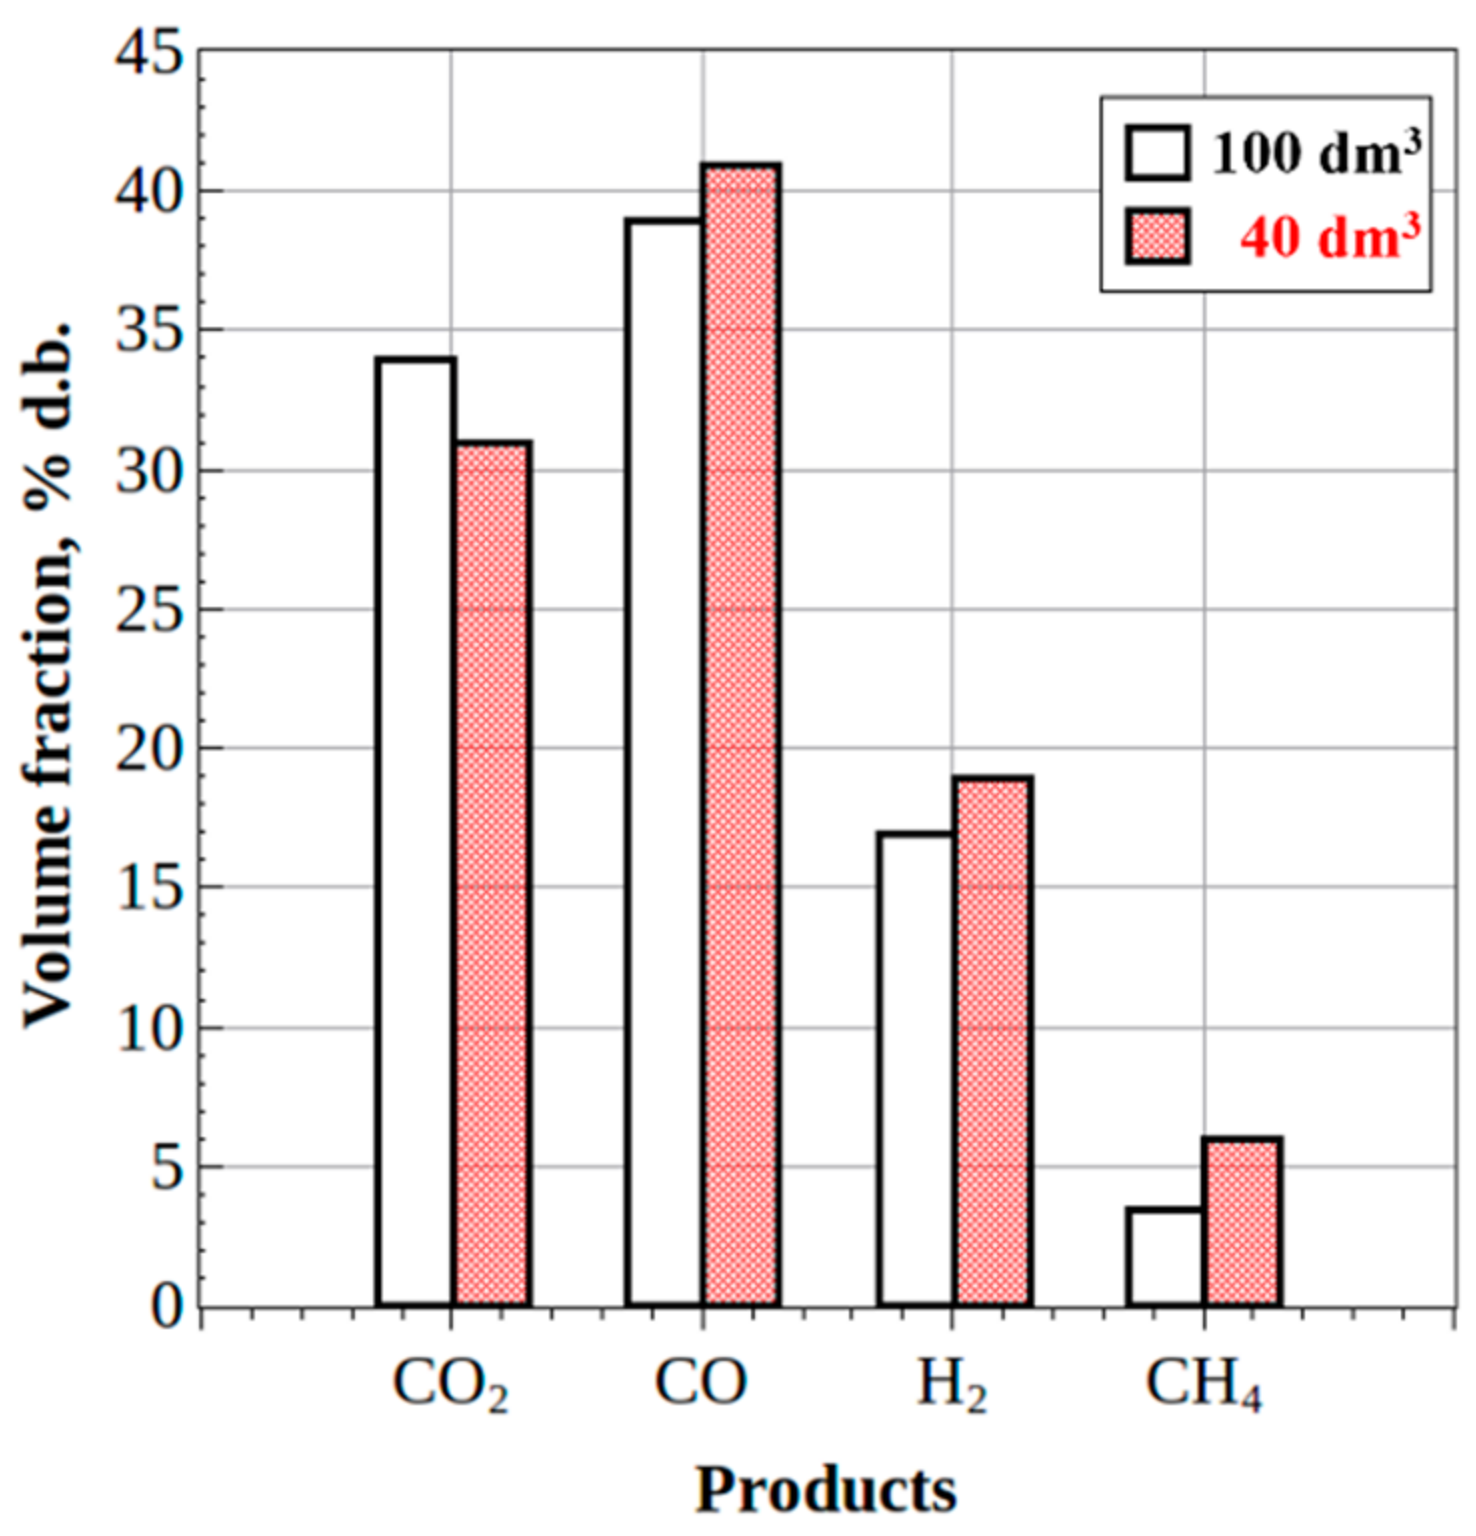
- The increase in the operation frequency of the pulsed detonation gun from 1 to 5 Hz, other conditions being equal, is expected to lead to a drastic increase in the mean rates of gasification reactions, while the fractions of H2 and CO in the product syngas must tend to ~60 and ~40%vol, respectively, and the contents of CH4 and CO2 must tend to zero.
Author Contributions
Funding
Institutional Review Board Statement
Informed Consent Statement
Data Availability Statement
Conflicts of Interest
References
- Hu, J.; Shekhawat, D. Direct Natural Gas Conversion to Value-Added Chemicals; CRC Press: Boca Raton, FL, USA, 2022. [Google Scholar]
- Base, P. Biomass Gasification and Pyrolysis; Practical Design, Burlington: London, UK, 2010. [Google Scholar]
- Bain, R.L.; Broer, K. Gasification, 1st ed.; John Wiley & Sons: Hoboken, NJ, USA, 2011. [Google Scholar]
- Frolov, S.M. Organic waste gasification: A selective review. Fuels 2021, 2, 556–651. [Google Scholar] [CrossRef]
- Portofino, S.; Donatelli, A.; Iovane, P.; Innella, C.; Civita, R.; Martino, M.; Matera, D.A.; Russo, A.; Cornacchia, G.; Galvagno, S. Steam gasification of waste tyre: Influence of process temperature on yield and product composition. Waste Manag. 2013, 33, 672–678. [Google Scholar] [CrossRef] [PubMed] [Green Version]
- Wilk, V.; Hofbauer, H. Conversion of mixed plastic wastes in a dual fluidized bed steam gasifier. Fuel 2013, 107, 787–799. [Google Scholar] [CrossRef]
- Pilon, G.; Lavoie, J.-M. Pyrolysis of switchgrass (Panicum virgatum L.) at low temperatures within N2 and CO2 environments: Product yield study. ACS Sustain. Chem. Eng. 2013, 1, 198–204. [Google Scholar] [CrossRef]
- Sadhwani, N.; Adhikari, S.; Eden, M.R. Biomass gasification using carbon dioxide: Effect of temperature, CO2/C ratio, and the study of reactions influencing the process. Ind. Eng. Chem. Res. 2016, 55, 2883–2891. [Google Scholar] [CrossRef]
- Galvagno, S.; Casciaro, G.; Casu, S.; Martino, M.; Mingazzini, C.; Russo, A.; Portofino, S. Steam gasification of tire waste, poplar, and refuse-derived fuel: A comparative analysis. Waste Manag. 2009, 29, 678–689. [Google Scholar] [CrossRef]
- Soni, C.G.; Dalai, A.K.; Pugsley, T.; Fonstad, T. Steam gasification of meat and bone meal in a two-stage fixed-bed reactor system. Asia Pac. J. Chem. Eng. 2011, 6, 71–77. [Google Scholar] [CrossRef]
- Eshun, J.; Wang, L.; Ansah, E.; Shahbazi, A.; Schimmel, K.; Kabadi, V.; Aravamudhan, S. Characterization of the physicochemical and structural evolution of biomass particles during combined pyrolysis and CO2 gasification. J. Energy Inst. 2017, 92, 32–93. [Google Scholar] [CrossRef]
- Minkova, V.; Marinov, S.P.; Zanzi, R.; Bjornbom, E.; Budinova, T.; Stefanova, M.; Lakov, L. Thermochemical treatment of biomass in a flow of steam or in a mixture of steam and carbon dioxide. Fuel Process. Technol. 2000, 61, 45–52. [Google Scholar] [CrossRef]
- Galvagno, S.; Casu, S.; Casciaro, G.; Martino, M.; Russo, A.; Portofino, S. Steam gasification of Refuse-Derived Fuel (RDF): Influence of process temperature on yield and product composition. Energy Fuel 2006, 20, 2284–2288. [Google Scholar] [CrossRef]
- Umeki, K.; Yamamoto, K.; Namioka, T.; Yoshikawa, K. High temperature steam-only gasification of woody biomass. Appl. Energy 2010, 87, 791–798. [Google Scholar] [CrossRef]
- Guizani, C.; Escudero Sanz, F.J.; Salvador, S. Effects of CO2 on biomass fast pyrolysis: Reaction rate, gas yields and char reactive properties. Fuel 2014, 116, 310–320. [Google Scholar] [CrossRef]
- Billaud, J.; Valin, S.; Peyrot, M.; Salvador, S. Influence of H2O, CO2 and O2 addition on biomass gasification in entrained flow reactor conditions: Experiments and modelling. Fuel 2016, 166, 166–178. [Google Scholar] [CrossRef] [Green Version]
- Hlina, M.; Hrabovsky, M.; Kavka, T.; Konrad, M. Production of high quality syngas from argon/water plasma gasification of biomass and waste. Waste Manag. 2014, 34, 63–66. [Google Scholar] [CrossRef] [PubMed]
- Agon, N.; Hrabovsky, M.; Chumak, O.; Hlina, M.; Kopecky, V.; Masláni, A.; Bosmans, A.; Helsen, L.; Skoblja, S.; Van Oost, G.; et al. Plasma gasification or refuse derived fuel in a single-stage system using different gasifying agents. Waste Manag. 2016, 47, 246–255. [Google Scholar] [CrossRef]
- Hrabovsky, M.; Hlina, M.; Kopecky, V.; Maslani, A.; Zivny, O.; Krenek, P.; Hurba, O. Steam plasma treatment of organic substances for hydrogen and syngas production. Plasma Chem. Plasma Process 2017, 37, 739–762. [Google Scholar] [CrossRef]
- Wang, M.; Mao, M.; Zhang, M.; Wen, G.; Yang, Q.; Su, B.; Ren, Q. Highly efficient treatment of textile dyeing sludge by CO2 thermal plasma gasification. Waste Manag. 2019, 90, 29–36. [Google Scholar] [CrossRef]
- Shie, J.L.; Tsou, F.J.; Lin, K.L.; Chang, C.Y. Bioenergy and products from thermal pyrolysis of rice straw using plasma torch. Bioresour. Technol. 2010, 101, 761–768. [Google Scholar] [CrossRef]
- Hrabovsky, M. Plasma Aided Gasification of Biomass, Organic Waste and Plastics. In Proceedings of the 30th ICPIG, Belfast, UK, 28 August–2 September 2011. [Google Scholar]
- Vecten, S.; Wilkinson, M.; Bimbo, N.; Dawson, R.; Herbert, B.M.J. Hydrogen-rich syngas production from biomass in a steam microwave-induced plasma gasification reactor. Bioresour. Technol. 2021, 337, 125324. [Google Scholar] [CrossRef]
- Bebelin, I.N.; Volkov, A.G.; Gryaznov, A.N.; Malyshenko, S.P. Development and research of an experimental hydrogen–oxygen steam generator with a capacity of 10 MW(t). Therm. Eng. 1997, 8, 48–52. [Google Scholar]
- Lewis, F.M. Generation of an Ultra-Superheated Steam Composition and Gasification Therewith. U.S. Patent US20030233788A1, 12 June 2007. [Google Scholar]
- Sariev, V.N.; Veretennikov, V.A.; Troyachenko, V.V. System of Complex Recycling of Solid Domestic and Industrial Waste. Patent of Russian Federation No. 2648737, 28 March 2016. [Google Scholar]
- Pierce, T.H.; Afify, E.M.; Zickefoose, R.T. Detonation-Induced Coal Gasification; Final Report (No. DOE/ET/10451-T1); Department of Mechanical and Aerospace Engineering, North Carolina State University: Raleigh, NC, USA, 1979. [Google Scholar]
- Pierce, T.H. Detonation-Induced Coal Gasification. Int. J. Energy Res. 1987, 11, 203–231. [Google Scholar] [CrossRef]
- Hunter, L.G. Pulse Detonation Device for Coal Gasification. U.S. Patent 5,672,184, 30 September 1997. [Google Scholar]
- Frolov, S.M.; Smetanyuk, V.A.; Gusev, P.A.; Koval, A.S.; Nabatnikov, S.A. How to utilize the kinetic energy of pulsed detonation products? Appl. Therm. Eng. 2019, 147, 728–734. [Google Scholar] [CrossRef]
- Frolov, S.M.; Smetanyuk, V.A.; Sadykov, I.A.; Silantiev, A.S.; Shamshin, I.O.; Aksenov, V.S.; Avdeev, K.A.; Frolov, F.S. Natural gas conversion and liquid/solid organic waste gasification by ultra-superheated steam. Energies 2022, 15, 3616. [Google Scholar] [CrossRef]
- Frolov, S.M.; Smetanyuk, V.A.; Avdeev, K.A.; Nabatnikov, S.A. Method for Obtaining Highly Overheated Steam and Detonation Steam Generator Device (Options). Patent of Russian Federation No. 2686138, 24 May 2019. [Google Scholar]
- Frolov, S.M.; Smetanyuk, V.A.; Nabatnikov, S.A. Method of Gasification of Coal in a Highly Overheated Water Vapor and Device for Its Implementation. Patent of Russian Federation No. 2683751, 1 April 2019. WO2019/226074 A1, 28 November 2019. [Google Scholar]
- Frolov, S.M.; Nabatnikov, S.A.; Diesperov, K.V.; Achildiev, E.R. Method for Decontamination of a Fly Ash Formed during Burning of Wastes and a Device for Its Implementation. Patent of Russian Federation No. 2739241, 22 December 2020. [Google Scholar]
- Frolov, S.M.; Smetanyuk, V.A.; Shamshin, I.O.; Koval’, A.S.; Frolov, F.S.; Nabatnikov, S.A. Generation of highly superheated steam by pulsed detonation of the ternary gas “propane–oxygen–steam” mixture. Combust. Explos. 2019, 12, 95–103. [Google Scholar] [CrossRef]
- Frolov, S.M.; Smetanyuk, V.A.; Sergeev, S.S. Reactor for waste gasification with highly superheated steam. Dokl. Phys. Chem. 2020, 495, 191–195. [Google Scholar] [CrossRef]
- Frolov, S.M.; Smetanyuk, V.A.; Shamshin, I.O.; Sadykov, I.A.; Koval’, A.S.; Frolov, F.S. Production of highly superheated steam by cyclic detonations of propane and methane-steam mixtures with oxygen for waste gasification. Appl. Therm. Eng. 2021, 183, 116195. [Google Scholar] [CrossRef]
- Frolov, S.M. Gasification of organic wastes by ultra-superheated steam and carbon dioxide. Combust. Explos. 2021, 14, 74–97. [Google Scholar] [CrossRef]
- Frolov, S.M.; Basevich, V.Y.; Aksenov, V.S.; Polikhov, S.A. Optimization study of spray detonation initiation by electric discharge. Shock Waves 2005, 14, 175–186. [Google Scholar] [CrossRef]
- Ferreira, S.; Monteiro, E.; Brito, P.; Vilarinho, C. A Holistic review on biomass gasification modified equilibrium models. Energies 2019, 12, 160. [Google Scholar] [CrossRef] [Green Version]


| Species | %vol |
|---|---|
| CH4 | 96.1 |
| C2H6 | 2.1 |
| C3H8 | 0.6 |
| C4H10 | 0.2 |
| N2 | 1.0 |
| Proximate Analysis | Moisture | Volatiles * | Fixed Carbon | Ash |
|---|---|---|---|---|
| Waste machine oil, wt% | 5% | - | - | 0.7% |
| Birch wood, wt% | 10–30% | 78.0% | 21.5% | 0.5% |
| Ultimate analysis | C | H | N | O |
| Waste machine oil, wt% | 85.3 | 10.9 | 0.1 | 0.4 |
| Birch wood, wt% | 48.7 | 6.4 | 0.1 | 44.5 |
Publisher’s Note: MDPI stays neutral with regard to jurisdictional claims in published maps and institutional affiliations. |
© 2022 by the authors. Licensee MDPI, Basel, Switzerland. This article is an open access article distributed under the terms and conditions of the Creative Commons Attribution (CC BY) license (https://creativecommons.org/licenses/by/4.0/).
Share and Cite
Frolov, S.M.; Smetanyuk, V.A.; Sadykov, I.A.; Silantiev, A.S.; Shamshin, I.O.; Aksenov, V.S.; Avdeev, K.A.; Frolov, F.S. Natural Gas Conversion and Organic Waste Gasification by Detonation-Born Ultra-Superheated Steam: Effect of Reactor Volume. Fuels 2022, 3, 375-391. https://doi.org/10.3390/fuels3030024
Frolov SM, Smetanyuk VA, Sadykov IA, Silantiev AS, Shamshin IO, Aksenov VS, Avdeev KA, Frolov FS. Natural Gas Conversion and Organic Waste Gasification by Detonation-Born Ultra-Superheated Steam: Effect of Reactor Volume. Fuels. 2022; 3(3):375-391. https://doi.org/10.3390/fuels3030024
Chicago/Turabian StyleFrolov, Sergey M., Viktor A. Smetanyuk, Ilias A. Sadykov, Anton S. Silantiev, Igor O. Shamshin, Viktor S. Aksenov, Konstantin A. Avdeev, and Fedor S. Frolov. 2022. "Natural Gas Conversion and Organic Waste Gasification by Detonation-Born Ultra-Superheated Steam: Effect of Reactor Volume" Fuels 3, no. 3: 375-391. https://doi.org/10.3390/fuels3030024
APA StyleFrolov, S. M., Smetanyuk, V. A., Sadykov, I. A., Silantiev, A. S., Shamshin, I. O., Aksenov, V. S., Avdeev, K. A., & Frolov, F. S. (2022). Natural Gas Conversion and Organic Waste Gasification by Detonation-Born Ultra-Superheated Steam: Effect of Reactor Volume. Fuels, 3(3), 375-391. https://doi.org/10.3390/fuels3030024