Abstract
The viscosity of slag from an operating integrated gasification combined cycle (IGCC) plant utilising petroleum coke and a synthetic petcoke slag with the same composition made from chemical grade oxides in a reducing environment for gasification application were investigated in this study. A high temperature rotating bob-type viscometer was used to measure viscosity between temperatures of 1250–1375 °C. Natural and synthetic ash had similar viscosities above 1300 °C in this study. The viscosity was predicted by using FactSage, a thermodynamic modelling software, in conjunction with different viscosity models, available in the open literature. Percentage deviations of predicted viscosities from different models with experimentally measured values ranged from about 41 to 151%. Crystallisation of the slag was noted in SEM-EDS (scanning electron microscopy– energy dispersive spectroscopy) and FactSage results. Solid phases from FactSage predictions were used to modify the Kalmanovitch–Frank model with the Roscoe method. It predicted the viscosity of the slag accurately between 1250 and 1375 °C. Average percentage deviation from measured natural ash viscosity was about 11%.
1. Introduction
Gasification is the process of converting carbonaceous materials, such as coal, petroleum coke, biomass, or blends, into a gas product, suitable for production of power, fuels, consumer products, chemicals, and fertilisers. In gasification, the feedstock reacts with oxygen and steam at a high temperature to produce carbon monoxide and hydrogen gas, known as syngas [1].
Petroleum coke, also known as petcoke, is a solid carbonaceous by-product from the oil refining industry. Petcoke use in gasification has been gaining more attraction in recent years due to a larger quantity of heavier crudes being processed than previously. It is in increasingly high demand as it has a lower ash content compared to coal (often less than 1%) [2]. It has a higher heating value (30.25–34.91 MJ/kg [3]) and lower cost (25% less than coal [4]) as it is a by-product of petroleum-refining. According to Kerester [5], more than 90% of the carbon from syngas is able to be obtained as carbon dioxide and is either used or stored. Carbon dioxide capture is necessary due to increasing environmental restrictions on coal-fired power generating units [6]. Carbon dioxide capture and usage in downstream operation is very common in gasification-based ammonia plants. Carbon dioxide obtained from syngas is used to produce urea [7]. Coal gasification plants also sell carbon dioxide for enhanced oil recovery [7]. Therefore, if more industries turn to gasification, they can reduce their carbon footprint, making it a burgeoning technology.
Murthy et al. [3] stated that petcoke has low reactivity and can have as high as about 7.5 wt % sulphur. To account for the low reactivity, entrained flow gasification is used, in which, unlike other gasifiers, high temperatures are attained (1200–1600 °C). At these temperatures, mineral matter is converted to slag. Sulphur is converted to H2S and COS which are removed from the produced syngas. The slag layer flows down the inside wall of the gasifier, on the refractory, exiting from the bottom through a slag tap. The ideal slag viscosity is between 15–25 Pa-s, where successful slagging will occur. Krishnamoorthy and Pisupati [8] discussed problems that occur if the ideal viscosity is not maintained. At viscosities greater than 25 Pa-s, the slag will solidify and block the slag tap. For less viscous slags, it can seep into the refractory wall, causing rapid deterioration due to chemical and structural spalling. This will require the entire refractory wall to be replaced, which is an arduous and expensive process. Therefore, accurately predicting petcoke slag viscosity will allow corrective actions to be implemented to avoid these mentioned problems.
As measuring slag viscosity is a time-consuming process, the ability to accurately predict it through modelling tools is becoming more popular. Petcoke has a significantly low ash content, in fact often less than 1%, and thus generating enough petcoke ash for research purposes is an arduous process. Therefore, if synthetic petcoke can be used in place of natural petcoke, this would be helpful to the scientific community for laboratory-scale research.
In addition, predicting the viscosity of petcoke slag can be more complex than for coal slag due to the presence of vanadium. Its behaviour at different oxidations states and interactions with other slag constituents is not completely understood in the literature. Oxidation states of all transition elements (V, Ni, and Fe) in petcoke ash significantly affect their slag viscosity [9]. Numerous studies, such as those performed by Duchesne et al. [10], Van Dyk et al. [11], Zhao et al. [12], and Zhu et al. [13], have been conducted to measure and predict the viscosity of slag using a thermodynamic software known as FactSage, in conjunction with viscosity prediction tools, such as the Modified Urbain model. Duchesne et al. [10] developed tools for calculating slag viscosity on the basis of slag composition and conditions. On the basis of this study, researchers can select from 24 slag viscosity models in the developed toolbox and evaluate the models’ performance too. To take account of solid phases in slags, the viscosity models were modified using the Roscoe–Einstein (RE) model and FactSage phase predictions. The two-step method of Duchesne et al. [10] was also used by Zhao et al. [12] and Zhu et al. [13]. FactSage was used to calculate slag’s solid–liquid proportions, which was combined with liquid viscosity to obtain viscosity of slag with solid particles. In a very novel way, Van Dyk et al. [11] used FactSage to calculate slag–liquid composition at several temperatures above 1000 °C and used it in the Urbain equation to calculate a viscosity. Coal ash composition was also used in the Urbain equation to calculate a viscosity, which differed significantly from the slag–liquid composition-based viscosity. Molten slag viscosity is better represented by the slag–liquid composition-based viscosity.
Most existing models have been developed for coal, and thus the majority of these studies have been conducted using coal and/or coal-petcoke blends. Therefore, the literature lacks an in-depth understanding of petcoke slag predictive tools.
With this motivation, this study aimed to account for this gap in literature to work towards a reliable model to predict petcoke slag viscosity for natural and synthetic petcoke. To meet this objective, a petcoke char obtained from an operating gasification plant in the USA was used to make natural petcoke ash and perform slag viscosity experiments.
2. Experimental Materials and Methods
2.1. Slag Preparation
In this study, a petcoke char sample (referred here as Petcoke A) from an integrated gasification combined cycle (IGCC) plant in the USA was heated in a muffle furnace in increments of 50 °C every 10 min until the temperature increased to 650 °C. At this point, an oxygen feed stream was introduced for 6–8 h to accelerate the ashing process. The petcoke ash was then fused in a high temperature furnace to produce petcoke slag. This was done to remove gases from the molten slag. It was ground into a fine powder, placing 40 g into an alumina crucible in preparation for the viscometer. Synthetic ash samples were prepared according to the major ash oxide analysis performed on the natural sample (pre-fusion composition), shown in Table 1. The ash compositions were obtained by inductively coupled plasma atomic emission spectrometry (ICP-AES) technique at the Pennsylvania State University. ICP-AES technique reports the ash composition as oxides with highest oxidation state, whereas under reducing conditions used during viscosity measurement, the oxidation state can change.

Table 1.
Ash oxide composition of petcoke.
2.2. Viscosity Measurement
A THETA brand high-temperature bob-type viscometer (Figure 1) was employed for viscosity measurements. The Standard Reference Material 717a borosilicate glass supplied by the National Institute of Standards and Technology (NIST) was used to calibrate (twice for repeatability) at 4 temperatures between 1200 °C and 1390 °C [14]. Gas entered at the bottom of the measuring head. From the measuring head, gas entered the alumina protection tube and flowed out from the top of the protection tube. Slag was contained in the alumina crucible. It was purged thrice after filling with CO–CO2 mixture (70% CO and the rest CO2). This gas is similar to real gasifier conditions. Accumulated gas after end of the last purge was used in the experiment. The furnace temperature was controlled at a steady heating rate of 3.2 °C/min, until it reached 1500 °C, where it was held for 1 h to equilibrate. Viscosity measurements began at 1375 °C and were taken at decreasing 25 °C intervals, where the temperature was held for 30 min at each interval to equilibrate first.
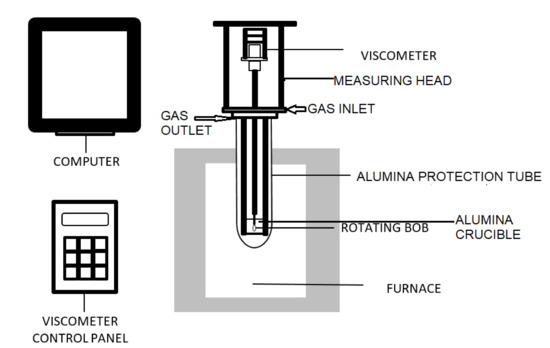
Figure 1.
Schematic diagram of THETA viscometer.
2.3. Analytical
Post-viscometer slag was cooled overnight before being cut in half and then cross-sectioned. Phase changes in the slag may occur during solidification. Scanning electron microscopy (SEM) and energy-dispersive spectroscopy (EDS) were used to analyse both natural and synthetic samples on top and bottom layers to understand the micromorphology and elemental composition. Top and bottom layers refer to the top and bottom surfaces of the solidified slag column in the crucible. X-ray diffraction (XRD) was then used to identify crystalline phases in the samples.
3. Modelling
3.1. FactSage
The Equilib module in FactSage 8 was used at a temperature range of 1250–1375 °C and a pressure of 1 atm in a reducing environment. SLAGA in the FToxid database was selected, where the mass fractions of liquid slag phases at each temperature interval were recorded, as well as the solid phases. FactPS database was also selected. It is based on the Gibbs free energy minimisation. The ratio of CO/CO2 used was 70:30, which was also used in the experiments. The amounts of gases were tested (1, 10, and 100 g) to ensure that the PO2 was 10−8 atm or less (to emulate gasifier conditions) at all temperatures. This constraint was maintained in the results of calculations using 100 g gas.
3.2. Viscosity Prediction Models
Several models were implemented and compared against the experimental viscosity curves to identify which was the best prediction. The slag compositions predicted with FactSage were normalised depending on the components required in the respective slag viscosity model before being used in the given model. Three versions of the modified Urbain model: Kalmanovitch–Frank, Streeter–Diehl–Schobert, and Kondratiev and Jak, were used, followed by the Watt–Fereday and S2 models. The total average percentage deviation between each model and the experimental natural sample at each temperature interval was determined.
4. Results and Discussion
FactSage results were used to quantify the liquid slag composition and mass of petcoke A from 1250 to 1375 °C in a reducing environment. Predicted viscosities can be seen in Figure 2, over the given temperature range. Experimental viscosities for both natural and synthetic samples are shown against predicted models from Kalmanovitch–Frank, Streeter–Diehl–Schobert, Kondratiev and Jak, Watt–Fereday, and S2. The species considered to have a greater influence on slag viscosity in this study were Mg2+ (network modifier), Al3+ (amphoteric), Fe3+ (amphoteric), and Si4+ (network former). The classification was based on the network theory for silicate melts [15]. As there was little change in the masses of each oxide throughout the given temperature range, the predicted viscosity had a slight exponential trend, but was more linearly inclined than the experimental results. The natural and synthetic petcoke samples followed a similar viscosity trend, where crystalline phases may have formed more prominently below 1325 °C in the natural sample, explaining the steeper increase in viscosity for natural petcoke A than for synthetic.
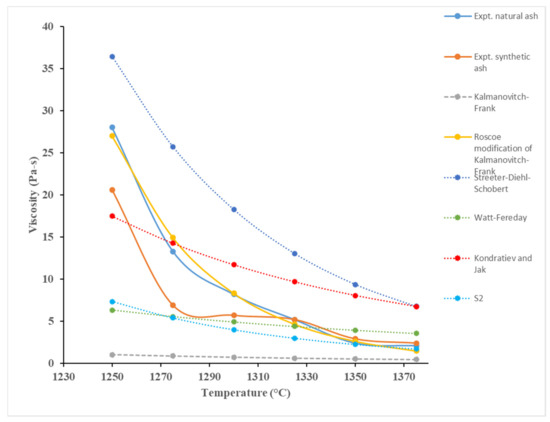
Figure 2.
Predicted viscosity model comparison.
The Streeter–Diehl–Schobert, Watt–Fereday, and S2 models provided promising results above 1370 °C according to Zhao et al. [12]. Watt–Fereday model is suitable for petcoke samples with greater than 80% SiO2 in the ash. Petcoke A ash has a significantly lower amount at 17%, and is thus not suitable. Becerra et al. [16] reported that the Watt–Fereday model produced very poor estimates, confirming this notion. The Kondratiev and Jak model relies on network modifiers but as there is uncertainty in whether Fe and Al behaved as network modifiers or network formers, full confidence cannot be placed in the accuracy of the model. Hercynite (FeAl2O4) was identified to be a major phase in synthetic and natural petcoke A, as seen in Figure 3. Nowok [17] acknowledged its formation under reducing environments where no other specific cases have been reported in the literature regarding this. However, Kaneko et al. [18] also reported hercynite as a major crystalline phase for synthetic coal/petcoke blends. FeAl2O4 belongs to the spinel group minerals that have the formula A2+B23+O4. However, Jastrzębska et al. have reported the presence of both Fe2+ and Fe3+ in their study [19]. Fe3+ and Al3+ are amphoteric and Fe2+ is a network modifier [15].
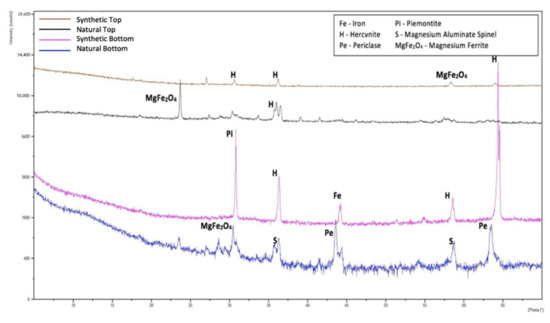
Figure 3.
Peak phases for natural and synthetic petcoke A ash.
The Kalmanovitch–Frank model was reported by Vargas et al. [16] to be more suitable for slags with greater than 50% SiO2. As this is the lowest reported limit for Si in the given models, petcoke A ash aligns more closely with this than Kondratiev and Jak, which require greater than 80% SiO2 content. Duchesne et al. [10] and Vargas et al. [16] reported accurate predictions using Kalmanovitch–Frank, where Browning et al. [20] stated that it performed the best out of all other tested models. It had a percentage deviation of 87.6%, with the highest being Streeter–Diehl–Schobert at 151.7% (Watt–Fereday: 54.2%; S2: 41.8%). The S2 method is considered to be more accurate for slags with iron oxide content less than 5% [20]. Therefore, further viscosity modelling work was carried out on the basis of the Kalmanovitch–Frank model.
ηm = η(1 − cϕ)−5/2
ηeff = (1 − ϕ/ϕm)−5/2
ϕm = 5.3/rp
ηm = 5.248e − 81 × ηe(214.5ϕ/ϕm)
The Kalmanovitch–Frank model predicted a linear trend in the studied temperature range of 1250–1375 °C (see Figure 4. Vargas et al. [15] compiled the studies that can be used to model the viscosity of slags with suspended solids. Among those studies, the Roscoe model Equation (1) [21] was found to be most appropriate to modify the viscosity prediction from the Kalmanovitch–Frank equation. Here, ηm is the mixture viscosity of a solution containing solids, η is the pure solvent viscosity, ϕ is the volume fraction of particles, and c is a constant. If the solution contains uniform spheres, then c has a value of 1.35 [21]. For non-spherical particles a generic (modified) form, shown in Equation (2), was considered by He et al. [22] to predict viscosity of coal ash slag with anorthite crystals. In Equation (2), ηeff is the ratio of ηm and η, and ϕm is the maximum packing fraction related to the shape of the solid phase. He et al. used Equation (3) to relate ϕm to the aspect ratio (rp). The aspect ratio (ratio of length to width) is used to quantify crystal shape. Equation (2) cannot be directly applied to slag with solid phases. He et al. correlated ηeff with ϕ/ϕm to obtain an exponential equation. A similar approach was used in this study. The mixture viscosity data were based on the measured viscosities of natural ash, the pure solvent viscosity was based on the Kalmanovitch–Frank model predictions, and the solid phase volume fractions were obtained from the masses in FactSage simulation results (see Table 2). Density of the slag was calculated using the work of Mills et al. [23]. Regression was performed between ηeff and ϕ/ϕm at the six temperatures at which viscosity was measured (see Figure 5). The obtained correlation Equation (4) is shown graphically (R2 = 0.979) in Figure 4. He et al. used the values of 10 and 20 on the basis of their measurements on SEM images of quenched slags. In our work, the values of rp considered were 1, 5, 10, 15, 20, 25, and 30. Results shown in Figure 4 correspond to a rp value of 25. The solid fractions calculated from FactSage results varied from 0.1859 to 0.1838 at the six temperatures. ϕm was lowest (0.1767) at rp = 30. Thus, rp value of 25 was selected for the comparisons in Figure 5. Maximum deviation of mixture viscosities (calculated at all values of rp at the respective temperatures) from that at rp = 25 was found to be 0.0004%. Percentage deviation from the measured viscosity of natural ash was calculated at the six temperatures, and the average deviation was 11.1%.
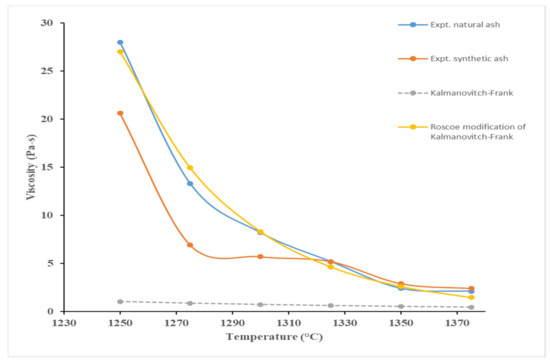
Figure 4.
Experimental and Kalmanovitch–Frank viscosity model.

Table 2.
Predicted liquid and solid phases of petcoke A ash at temperature intervals (°C).
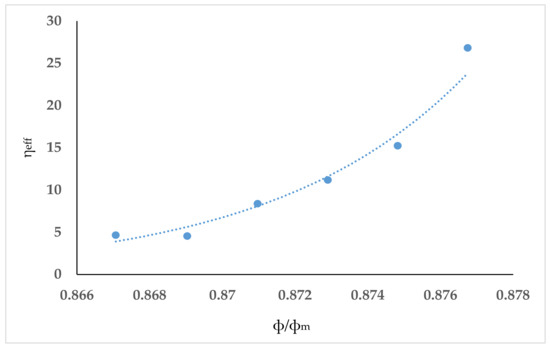
Figure 5.
Correlation of ηeff and relative solid content at the temperatures from the viscosity experiments.
At temperatures below 1275 °C, it is obvious from Figure 5 that the experimental curves have a sudden increase in viscosity, which is not replicated in the Kalmanovitch–Frank model. In fact, no predictive models were able to simulate this effect because it is likely that this is the point where the slag transformed from a Newtonian to a non-Newtonian fluid. The slag will begin to crystallise at lower temperatures as it cools, which can attributed to the non-Newtonian behaviour due to a solid and liquid phase mixture, as confirmed by Park and Oh [24]. This has a corresponding effect whereby a small change in temperature has a large change in viscosity, which the models are unable to account for.
A similar study conducted by Zhu et al. [13] on the viscosity of synthetic coal slags, from 1300 to 1500 °C, reported that the Kalmanovitch–Frank model was agreeable above a temperature limit of 1350 °C, below which, crystallisation occurred to a significant amount, such that the fluid transitioned from a Newtonian to a non-Newtonian fluid. It was reported that the alumina crucible in which the slag was kept in interacted with the slag, which can be attributed to the increased precipitation of crystals. Similar conclusions can be drawn in this study, where the temperature limit (of possible transition) for petcoke was 1275 °C. Moreover, it is possible that the alumina wall of the crucible may behave as or instigate a nucleation site, promoting the formation of crystals below 1275 °C, causing the fluid to transition to non-Newtonian behaviour.
The mass of solid phases that FactSage predicted for petcoke A over the entire temperature range remained fairly constant (see Table 2). Coulsonite (FeV2O4) formed in a reducing environment with a low V2O5 content, as reported by Li et al. [25]. Although it was not identified via XRD analysis, it was noted to be a possible spinel species from EDS analysis for synthetic samples (see Figure 6c), which can be confirmed via its prediction from FactSage. Solid Ni was identified to be a prominent phase via SEM and EDS analysis for both samples. See Figure 6 for an example of elemental analysis showing solid Ni as a prominent phase. It was confirmed via FactSage that solid Ni formed under reducing conditions, whereas Wang et al. [26] confirmed this phenomena occurs between 1100 °C and 1400 °C.
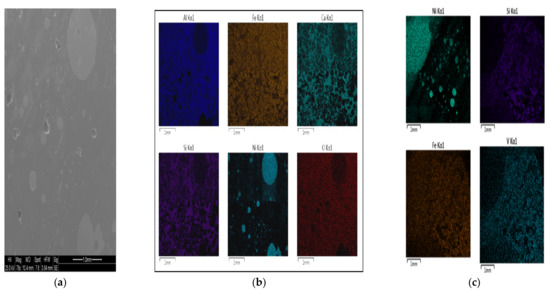
Figure 6.
Nickel in synthetic petcoke A: (a) SEM (bottom), (b) energy-dispersive spectroscopy (EDS) (bottom), (c) EDS (top).
The predicted phases from FactSage were different to those observed from XRD analysis, which is a finding similar to what Duchesne et al. [27] experienced. XRD analysis was performed on cooled slag (at ambient temperature) that had some dissolution from the alumina crucible and the bob. The FactSage phase predictions are based on thermodynamics of an ideal system that consists of the solid ash (oxides) and gases as the initial components. The phases were predicted at the temperatures at which the viscosity experiments were performed.
5. Conclusions
Viscosity experiments performed with natural and synthetic ash of a petcoke showed that viscosity of both was quite close (or almost identical) above 1300 °C. At lower temperatures, viscosity of synthetic ash was lower than natural ash. At temperatures below 1275 °C, the experimental results had a spike in viscosity that no predictive model replicated, as the fluid transformed from a Newtonian to a non-Newtonian fluid. This was likely due to the increased crystallisation that occurred at lower temperature. The crystallisation process was identified using EDS and FactSage results that showed Ni, Fe, and V elements/phases. The Kalmanovitch–Frank model with the Roscoe modification resulted in an exponential relation of mixture viscosity with liquid viscosity and relative solid content. This accurately predicted the viscosity of petcoke A between the temperature range of 1250–1375 °C with a roughly 11% average deviation from measured viscosity of natural ash. In the Roscoe modification, the relative solid content calculated from FactSage corresponded to the non-Newtonian behaviour seen in the viscosity experiments.
Author Contributions
S.A.D.—performed experiments, FactSage simulations, and viscosity modelling; prepared samples for experiments; analysed post-experiment samples; prepared manuscript draft. S.B.—performed initial experiments, provided viscometer training, assisted in FactSage, analyzed sample before experiment, performed FactSage calculations and viscosity modelling, edited manuscript. H.B.V.—conceived the presented idea, supervised manuscript preparation. S.V.P.—conceived the presented idea, guided and supervised experiments, edited manuscript. All authors have read and agreed to the published version of the manuscript.
Funding
This research received no external funding.
Institutional Review Board Statement
Not applicable.
Informed Consent Statement
Not applicable.
Data Availability Statement
Not applicable.
Conflicts of Interest
The authors declare no competing financial interest.
References
- Santos, A.R.; da Silva, R.J.; Reno, M.L.G. Analysis of Petroleum Coke Consumption in Some Industrial Sectors. J. Pet. Sci. Res. 2015, 4, 1–7. [Google Scholar] [CrossRef]
- Nakano, J.; Kwong, K.-S.; Bennett, J.; Lam, T.; Fernandez, L.; Komolwit, P.; Sridhar, S. Phase Equilibria in Synthetic Coal–Petcoke Slags (Al2O3–CaO–FeO–SiO2–V2O3) under Simulated Gasification Conditions. Energy Fuels 2011, 25, 3298–3306. [Google Scholar] [CrossRef]
- Murthy, B.N.; Sawarkar, A.N.; Deshmukh, N.A.; Mathew, T.; Joshi, J.B. Petroleum Coke Gasification: A Review. Can. J. Chem. Eng. 2014, 92, 441–468. [Google Scholar] [CrossRef]
- Stockman, L. Petroleum Coke: The Coal Hiding in the Tar Sands. Available online: http://priceofoil.org/2013/01/17/petroleum-coke-the-coal-hiding-in-the-tar-sands/ (accessed on 16 November 2020).
- Kerester, A. Gasification Can Help Meet the World’s Growing Demand for Cleaner Energy and Products. Available online: https://www.worldcoal.org/file_validate.php?file=cornerstone_v2i3_wca(29_09_2014).pdf (accessed on 16 November 2020).
- Carpenter, S.M.; Long III, H.A. Integration of carbon capture in IGCC systems. In Integrated Gasification Combined Cycle (IGCC) Technologies; Elsevier: Amsterdam, The Netherlands, 2017; pp. 445–460. ISBN 978-0-08-100167-7. [Google Scholar]
- Higman, C.; van der Burgt, M. Economics, Environmental, and Safety Issues. In Gasification; Elsevier/Gulf Professional Pub: Boston, MA, USA, 2003; pp. 329–354. ISBN 978-0-7506-7707-3. [Google Scholar]
- Krishnamoorthy, V.; Pisupati, S. A Critical Review of Mineral Matter Related Issues during Gasification of Coal in Fixed, Fluidized, and Entrained Flow Gasifiers. Energies 2015, 8, 10430–10463. [Google Scholar] [CrossRef]
- Banik, S.; Pisupati, S.V. Effects of Pressure and CO Concentration on Vanadium, Nickel and Iron Phase Transformations for Petcoke Slag Viscosity Correlation Development. Fuel 2019, 253, 238–248. [Google Scholar] [CrossRef]
- Duchesne, M.A.; Bronsch, A.M.; Hughes, R.W.; Masset, P.J. Slag Viscosity Modeling Toolbox. Fuel 2013, 114, 38–43. [Google Scholar] [CrossRef]
- van Dyk, J.C.; Waanders, F.B.; Benson, S.A.; Laumb, M.L.; Hack, K. Viscosity Predictions of the Slag Composition of Gasified Coal, Utilizing FactSage Equilibrium Modelling. Fuel 2009, 88, 67–74. [Google Scholar] [CrossRef]
- Zhao, F.; Xu, J.; Huo, W.; Wang, F.; Yu, G. Rheology and Viscosity Prediction of Bituminous Coal Slag in Reducing Atmosphere. J. Chem. Eng. Process Technol. 2015, 6, 1. [Google Scholar] [CrossRef]
- Zhu, J.; Kaneko, T.K.; Mu, H.; Bennett, J.P.; Sridhar, S. Effects of Measurement Materials and Oxygen Partial Pressure on the Viscosity of Synthetic Eastern and Western United States Coal Slags. Energy Fuels 2012, 26, 4465–4474. [Google Scholar] [CrossRef]
- Gills, T. National Institute of Standards & Technology Certificate Standard Reference Material 717a; NIST: Gaithersburg, MD, USA, 1996. [Google Scholar]
- Vargas, S.; Frandsen, F.J.; Dam-Johansen, K. Rheological Properties of High-Temperature Melts of Coal Ashes and Other Silicates. Progress Energy Combust. Sci. 2001, 27, 237–429. [Google Scholar] [CrossRef]
- Becerra, S.V.; Frandsen, F.; Dam-Johansen, K. Performance of Viscosity Models for High-Temperature Coal Ashes; Elsam-Idemitsu Kosan Cooperative Research Project; Department of Chemical Engineering, Technical University of Denmark: Kongens Lyngby, Denmark, 1997. [Google Scholar]
- Nowok, J.W. Viscosity and Structural State of Iron in Coal Ash Slags under Gasification Conditions. Energy Fuels 1995, 9, 534–539. [Google Scholar] [CrossRef]
- Kenneth Kaneko, T.; Zhu, J.; Howell, N.; Rozelle, P.; Sridhar, S. The Effects of Gasification Feedstock Chemistries on the Infiltration of Slag into the Porous High Chromia Refractory and Their Reaction Products. Fuel 2014, 115, 248–263. [Google Scholar] [CrossRef]
- Jastrzębska, I.; Szczerba, J.; Stoch, P.; Błachowski, A.; Ruebenbauer, K.; Prorok, R.; Śnieżek, E. Crystal Structure and Mössbauer Study of FeAl2O4. Nukleonika 2015, 60, 47–49. [Google Scholar] [CrossRef]
- Browning, G.J.; Bryant, G.W.; Hurst, H.J.; Lucas, J.A.; Wall, T.F. An Empirical Method for the Prediction of Coal Ash Slag Viscosity. Energy Fuels 2003, 17, 731–737. [Google Scholar] [CrossRef]
- Roscoe, R. The Viscosity of Suspensions of Rigid Spheres. Br. J. Appl. Phys. 1952, 3, 267–269. [Google Scholar] [CrossRef]
- He, C.; Ilyushechkin, A.; Bai, J.; Hla, S.S.; Kong, L.-X.; Li, W. Viscosity and Crystallisation Behaviour of Coal Ash Slag from the Primary Phase of Anorthite. Fuel Process. Technol. 2020, 213, 106680. [Google Scholar] [CrossRef]
- Mills, K.C.; Rhine, J.M. The Measurement and Estimation of the Physical Properties of Slags Formed during Coal Gasification: 1. Properties Relevant to Fluid Flow. Fuel 1989, 68, 193–200. [Google Scholar] [CrossRef]
- Park, W.; Oh, M.S. Slagging of Petroleum Coke Ash Using Korean Anthracites. J. Ind. Eng. Chem. 2008, 14, 350–356. [Google Scholar] [CrossRef]
- Li, J.; Zhao, J.; Dai, X.; Bai, J.; Fang, Y. Effect of Vanadium on the Petroleum Coke Ash Fusibility. Energy Fuels 2017, 31, 2530–2537. [Google Scholar] [CrossRef]
- Wang, Z.; Bai, J.; Kong, L.; Bai, Z.; Li, W. Effect of V and Ni on Ash Fusion Temperatures. Energy Fuels 2013, 27, 7303–7313. [Google Scholar] [CrossRef]
- Duchesne, M.A.; Ilyushechkin, A.Y.; Hughes, R.W.; Lu, D.Y.; McCalden, D.J.; Macchi, A.; Anthony, E.J. Flow Behaviour of Slags from Coal and Petroleum Coke Blends. Fuel 2012, 97, 321–328. [Google Scholar] [CrossRef]
Publisher’s Note: MDPI stays neutral with regard to jurisdictional claims in published maps and institutional affiliations. |
© 2021 by the authors. Licensee MDPI, Basel, Switzerland. This article is an open access article distributed under the terms and conditions of the Creative Commons Attribution (CC BY) license (http://creativecommons.org/licenses/by/4.0/).