


Abstract
Sustainable machining of composite materials requires optimizing conflicting responses influenced by limited experimental datasets, trade-offs, nonlinear process variables, and response variability. This study proposes a hybrid framework (Gaussian Process Regression—Method based on the Removal Effects of Criteria—Criteria Reliability—Momentum-Based Optimization Algorithm: GPR–MEREC-CR–MOA) to address these challenges in turning composite materials (PA66, PA66 + GF30, and PA66 + MoS2). The GPR model learns from small datasets to capture nonlinear relationships between machining variables (workpiece material, tool approach angle, tool nose radius, cutting speed, feed rate, depth of cut) and performance characteristics (surface roughness, cutting force, vibration, tool wear rate, temperature, sound pressure level, specific cutting energy, and material removal rate). The MEREC-CR method considers experimental dispersion and response variability to enhance the robustness of the multi-response aggregation model. The weighted responses determined by MEREC were optimized by exploring the operating ranges of machining variables using MOA. The GPR model accurately predicts eight performance characteristics (R2 ≥ 0.973). The GPR–MEREC-CR–MOA model identified optimal conditions for PA66 + MoS2 and composite material (tool angle = 93°, nose radius = 0.40 mm, cutting speed = 200 m/min, feed rate = 0.300 mm/rev, depth of cut = 1.08 mm), resulting in a composite performance index (CPI) of 0.9265 and a 30.2% improvement over the best experimental datasets from Taguchi L27 design. The tool wear rate, specific cutting energy, and vibration have a significant impact on overall machining performance. Feed rate has the strongest influence on CPI, as confirmed by Partial Rank Correlation Coefficients analysis. Monte Carlo-driven uncertainty analysis validates the optimal solution with a 95% confidence level for CPI between 0.8859 and 0.9451. External validation with nine independent cases confirmed the GPR model’s strong generalizability (R2 = 0.811–0.998). Benchmarking showed that MOA achieves solution quality comparable to GA, PSO, and GWO while reducing computational time by 66–86%, making it suitable for real-time optimization. The proposed hybrid framework provides an alternative data-driven decision support approach for evaluating sustainable machining parameters using limited experimental datasets of polymer composites.
1. Introduction
Modern industries demand sustainable machining that reduces energy consumption and environmental impact, while ensuring high-quality parts (dimensional accuracy and surface integrity) and extended tool life [1,2,3,4]. Simultaneous optimization of multiple conflicting outputs ensures achieving sustainability, as opposed to enhancing single machining quality characteristics [3,5,6,7]. Optimizing a single output results in compromising other performance characteristics. Optimizing the machining variables (combination of higher feed rate, cutting speed, and depth of cut) for higher productivity must compromise surface integrity, tool wear, and dimensional accuracy [8,9,10]. This trend is inherent in multiple-objective optimization, which introduces complex trade-offs (assigning importance or weight fractions to individual outputs), rendering optimal solutions sensitive to model reliability in determining a single parametric condition that balances productivity, quality, and sustainability.
In recent years, composite materials widely used in aerospace, automotive, and energy applications pose machining challenges (ensuring better productivity, quality, and sustainability) due to their superior strength-to-weight ratio and tailor-made functional properties [11,12,13]. The heterogeneous material behavior of composites arises from complex interactions (fiber–matrix and tool–workpiece), anisotropic nature and strong nonlinearity, and high-order parametric interactions on machining quality characteristics [14,15]. Tool wear, vibration, and acoustic emissions result in high dispersion and measurement noise during machining operations, complicating prediction and optimization [16,17]. Conventional deterministic optimization methods (such as the Taguchi method, response surface methodology, grey relational analysis, VIKOR method, and so on) yield solutions that lack robustness and industrial reliability beyond the controlled or limited experimental conditions [18,19].
In the last two decades, researchers across the globe have used surrogate and hybrid optimization frameworks to address machining complexities in the literature. Statistical surrogate models (regression and RSM) are popular for their simplicity and interpretability, but their ability to capture strong nonlinearities and uncertainties is often limited [20,21]. Monte Carlo simulations have been performed to handle uncertainties, robustness, and prediction stability of the optimized models [21,22]. On the other hand, machine learning-driven surrogate models (artificial neural networks, support vector regressions, random forests, Gaussian process regressions, Extreme Gradient Boosting, etc.) have demonstrated superior prediction performance and addressed the limitations of statistical surrogate models applied to complex machining processes [23,24,25]. Applying metaheuristic algorithms (genetic algorithms, particle swarm optimization, grey wolf optimization, teaching–learning-based optimization, JAYA, artificial bee colony, hybrid spider monkey optimization, etc.) enables researchers to search for solutions in a continuous parameter space beyond discrete experimental designs [26,27,28,29,30,31].
The accuracy of all meta-heuristic algorithms relies on tuning algorithm-specific and common parameters [28,29,31]. The optimal solutions depend on the response aggregation strategy (integrating weights from data-driven models and random weights) [27,28,29]. Leveraging metaheuristic algorithms with machine learning surrogate models enhances global search capability, offering the best solutions and reducing computation costs [32,33]. The literature confirms that predictive performance is sensitive to surrogate reliability, response aggregation strategy, and handling uncertainty within the optimization domain.
Recent studies have demonstrated the effectiveness of hybrid approaches in various machining applications. For example, a hybrid optimization technique reduced the surface roughness of spark EDM-machined Mg/TiC metal matrix composites to 2.89 µm [34]. A hybrid framework (combining Taguchi, RSM, and MOPSO) optimized cutting parameters and reduced overall energy consumption by 6–40% [26]. The surrogate-aided grey prediction evolutionary algorithm was able to solve computationally expensive optimization problems with improved convergence speed and prediction accuracy [35]. The hybrid RSM-PSO approach enhanced machining performance by finding optimal solutions in continuous parameter spaces that balanced surface quality and productivity [36]. Another hybrid framework (RSM-ANNs-GWO-DFA) determined milling parameters that optimized conflicting machining responses of composite materials [37]. Machine learning techniques such as linear regression, support vector machine regression, extreme gradient boosting, and ANN combined with NSGA-II optimized turning parameters, resulting in reduced surface roughness and tool wear to 1.439 µm and 0.100 mm, respectively [38]. Integrating machine learning techniques (such as extreme gradient boosting, CatBoost, gradient boosting, and light gradient boosting) with NSGA-II optimized multiple conflicting outputs (surface roughness, tool wear, cutting force, and material removal rate) for milling AISI4140 steel parts [39]. Similarly, combining machine learning (specifically extreme gradient boosting) with NSGA-II determined optimal turning conditions for improved machining performance in SUS430C stainless steel parts [40]. Hybrid optimization approaches have also been extended to precision and finishing operations, such as using ANN-GA to reduce burr size in micro-milling of hardened AISI H13 parts [41], and employing RSM-NSGA-II to improve surface finish to 0.2795 μm with reduced energy consumption in the grinding process [42]. Overall, the literature highlights the significance of metaheuristic algorithms in enhancing the predictive capabilities of surrogate models.
Despite the advancements in advanced models, many methodological limitations still exist. First, most surrogate models follow deterministic procedures for predictions, assuming uniform confidence and neglecting predictive uncertainty [43,44,45]. These limitations increase complexity in composite machining due to response-reliant experimental designs, material heterogeneity, anisotropic nature, and fiber–matrix interactions [46,47]. Second, multi-response aggregation (transforming two or more individual objective functions into a single multiple objective formulation) using weighting methods (such as equal weights, expert-reliant weights, or subjective techniques: analytic hierarchy process, analytic network process, Delphi, best–worst method, step-wise weight assessment ratio analysis, DEMATEL, and fuzzy) is commonly preferred for optimization [27,48,49]. The objective weighting methods (entropy, criteria importance through inter-criteria correlation, principal component analysis, standard deviation, method based on the removal effects of criteria, statistical variance, mean) reduce subjectivity. Still, these models do not include response reliability (coefficient of variation or measurement noise) in the weighting process [50,51,52,53,54]. The derived weights might not produce a global solution for each response, shifting the optimization toward solutions that reflect optimal performance under noise and compromising the model’s robustness [55,56]. Third, most hybrid methods (combining the strengths of subjective and objective weighting methods) have been highlighted for determining optimal parametric conditions. Still, limited attention has been given to post-optimality analysis, sensitivity, robustness, and uncertainty evaluation [56,57]. The methods discussed above limit interpretability and restrict the deployment of optimal solutions in industries.
The present work developed a hybrid GPR–MEREC-CR–MOA framework for the prediction and optimization of multiple responses of the turning process machined composite materials (PA66, PA66 + GF30, and PA66 + MoS2). The probabilistic surrogate GPR models the nonlinear machining behavior and quantifies prediction uncertainty across the design space [58]. GPR is a fully probabilistic model (considering predictive mean and variance) known for robust decision-making by handling uncertainty under limited experimental datasets. The non-parametric flexibility and strong generalizability of GPR allowed researchers to predict the drill rate and tool wear rate of the EDM process [59], surface roughness in milling [60], specific cutting forces and tool temperature [61], tool wear [62] in the turning process, and residual stress in the milling process [63] with limited datasets. The momentum-based optimization algorithm (MOA) mimics the heavy-ball method. It accelerates convergence through iterative gradient-based search by incorporating a momentum term that updates the current search directions utilizing a fraction of the previous update [64,65]. Metaheuristic algorithms (GWO, PSO, GA, TLBO, JAYA, and so on) rely on stochastic population exploration and require more computational time. However, MOA uses gradient-driven updates from previous iterations to enable rapid convergence and smooth search trajectories with reduced oscillations in the search space [66]. MOA is particularly advantageous for problems requiring rapid convergence and stable optimization, particularly for continuous, differentiable objective functions [65]. The limitations of multi-response aggregation strategies were addressed by integrating MEREC weighting and the CR index (evaluating the selected criteria signifying actual output performance) to quantify stability through a variability-sensitive metric. MEREC offers reliable weighting (compared to CRITIC, Entropy, standard deviation) by evaluating each criterion or objective function in accordance with the change in composite performance caused by its removal or exclusion [67]. This reflects the actual contribution of criteria towards the decision outcome without relying on correlation structure or statistical dispersion alone. Furthermore, MEREC limits dispersed or noise-prone outputs influencing multi-response aggregation, resulting in enhanced decision robustness.
The present work addresses these gaps by developing a novel hybrid GPR–MEREC-CR–MOA framework. The key methodological novelty lies in the synergistic integration of strengths of individual models, such as (1) probabilistic GPR for uncertainty-aware surrogate modeling with limited data (most design of experiments derive limited practical experimental trials used to establish process insights resulting in data scarcity), (2) reliability-driven MEREC-CR weighting that considers contribution for both removal effects and response variability (coefficient of variation: CV), and (3) momentum-based optimization for rapid and stable convergence in continuous parameter space. To date, GPR models have primarily been used for predictions, limiting comprehensive post-optimality analysis. However, the proposed framework combines surrogate modeling, reliability-aware aggregation (computed weights and impact analysis provide deeper insights to derive optimal solutions, complementing sensitivity analysis), optimization with a meta-heuristic algorithm, and uncertainty quantification in a single robust, interpretable decision support system tailored for sustainable machining polymer composites under small datasets.
In addition to the hybrid (GPR–MEREC-CR–MOA) optimization framework, comprehensive post-optimality analyses (global sensitivity, response contribution, and Monte Carlo-driven uncertainty quantification) and validation experiments were conducted. These components enable better interpretation of optimization behavior and allow quantitative assessment of solution reliability. To date, most researchers treat surrogate modeling, objective weighting, and uncertainty analysis as independent stages. The present work combines probabilistic modeling, reliability-driven multi-response aggregation, and robustness assessments within a unified GPR–MEREC–CR decision framework with meta-heuristic algorithms (MOA, GA, PSO, and GWO). The major contributions of this study are explained with a fourfold strategy:
- Establishing a surrogate-aided optimization architecture that handles uncertainty in composite machining (composed of six input variables: workpiece material, tool approach angle, tool nose radius, cutting speed, feed rate, and depth of cut, and eight responses: surface roughness (Ra), cutting force (Fc), cutting temperature (Temp), vibration (Vib), tool wear rate (TWR), sound pressure level (SPL), material removal rate (MRR), and specific cutting energy (SCE)).
- Mathematical formulation of a multiple-response aggregation strategy using a reliability-driven MEREC–CR method (incorporating both weighting and response dispersion).
- Integrating post-optimality analysis that quantifies robustness, sensitivity, and uncertainty propagation within the framework.
- Experimentally validating the machining performance, ensuring decision reliability relative to hybrid optimization frameworks.
Overall, the proposed hybrid framework ensures sustainable machining by developing a robust, interpretable, and industry-applicable decision support system tailored to small datasets of composite material machining. The overall framework of the present work is illustrated in Figure 1.
Figure 1.
The workflow of the GPR–MEREC-CR–MOA framework.
2. Materials and Methods
This study developed a structured framework to investigate the multi-response turning of three polyamide-based materials (PA66, PA66 + GF30, and PA66 + MoS2) under dry machining conditions. The methodology included material-dependent Taguchi L27 machining experimental trials, accurate measurement of multiple responses, development of a surrogate modeling and optimization framework, and post-optimality analysis.
Taguchi L27 experiments were conducted for six machining variables (workpiece material: PA66, PA66 + GF30, and PA66 + MoS2, tool approach angle, tool nose radius, cutting speed, feed rate, and depth of cut) and collected eight machining responses (surface roughness, cutting force, cutting temperature, vibration, tool wear rate, sound pressure level, material removal rate, and specific cutting energy).
2.1. Materials, Machine Setup, and Tooling
Three polyamide materials have been selected for investigation. The materials used in this study are polyamide 66 (PA66) and its composites such as PA66 with 30% glass fiber (PA66 + GF30) and PA66 with molybdenum disulfide (PA66 + MoS2). The mechanical properties and widespread use of these materials in various industries, such as automotive and aerospace products, led to their selection. PA66 is a thermoplastic and semi-crystalline material obtained from hexamethylenediamine and adipic acid by condensation polymerization. PA66 material is popularly known for its wear resistance, chemical stability, and toughness [68,69]. PA66 reinforced with 30% glass fibers (in weight) (PA66 + GF30) resulted in a significant enhancement in tensile strength and thermal stability [68]. These properties render the material suitable for load-bearing applications, while introducing machining challenges due to higher tool wear. The PA66 + MoS2 composite has molybdenum disulfide (as the solid lubricant) additive, which contributes to the tribological characteristics of PA66 by lowering the coefficient of friction and increasing the wear resistance compared to pure PA66 [70]. All three materials were supplied as cylindrical rods (diameter 45 mm, length 400 mm) from commercial sources (SEONTEC, Zibo, China). Each workpiece was divided into nine machining zones of 30 mm length, separated by 10 mm relief grooves to minimize thermal interference during turning. Experiments were performed on an AJEV-310 Evolution CNC lathe (AJAX Machine Tools, Lymington, UK) using ISO standard tool holders EDGEV Hardmetal Tools, Dalian, China) equipped with TiCN/Al2O3—coated carbide inserts (LIFENG Precision Tools Co., Ltd., Taizhou, China). Key mechanical and thermal properties are summarized in Table 1 [68,69,70,71].
Table 1.
Mechanical and thermal properties of materials [68,69,70,71].
2.2. Experimental Design
The eight machining performances, including surface roughness, cutting force, cutting temperature, vibration, tool wear rate, sound pressure level, material removal rate, and specific cutting energy, are influenced by six machining variables: workpiece material (PA66, PA66 + GF30, and PA66 + MoS2), tool approach angle, tool nose radius, cutting speed, feed rate, and depth of cut. To conduct experiments, a Taguchi L27 orthogonal array was chosen for the six parameters operating at three respective levels as shown in Table 2.
Table 2.
Control factors and levels for Taguchi L27 design.
The present work used a Taguchi L27 orthogonal array experiment to model and establish input–output relationships (comprising six machining input variables operating at three levels and eight machining performance measures) with fewer experimental trials. Compared to a full-factorial design requiring 729 experiments, the Taguchi L27 method achieves balance across the design space (covering the entire range of operating variables), enabling the investigator to significantly reduce machining trials, time, energy, material consumption, tool wear, and cost. Many multi-factor machining experiments used the Taguchi L27 method for CNC turning optimization of machining variables for aluminum alloys, Inconel 800H, and brass [72,73,74]. The machining performances under optimal conditions confirmed the efficacy of the Taguchi method. The Taguchi method demonstrated machining performance comparable to full-factorial designs, reducing experimental trials by 88.9% [75]. The trained GPR model with limited datasets (say 25) demonstrated better exploration of welding process parameters by predicting the welding quality across 15 random experimental cases [76]. Therefore, the Taguchi L27 design achieves balance across the parameter space, while the probabilistic GPR model captures the inherent nonlinear relationships and quantifies uncertainties with limited datasets. The statistical adequacy of the L27 experimental datasets was validated with 5-fold cross-validation and Monte Carlo uncertainty analysis (Section 3.1). Therefore, the Taguchi L27 method offers a better trade-off that effectively balances the experimental efficiency, predictive accuracy, and computationally intensive optimization required for intelligent machining of composite applications. Tool approach angles of 75°, 93°, and 105° were chosen based on available ISO standard tool holders (Edgev Hardmetal Tools, Dalian, China) and literature covering the practical range influencing effective cutting geometry and chip formation [68]. The experimental set-up used for the present work is presented in Figure 2.
Figure 2.
Experimental set-up of turning process.
2.3. Measurement Strategy and Multi-Response Optimization
Machining experiments were conducted on three materials (PA66, PA66 + GF30, PA66 + MoS2) in accordance with the Taguchi L27 matrix. Each experimental trial was repeated three times, and the 8 machining responses were recorded. Eight machining performances were selected to conduct a comprehensive examination of the sustainability of turning operations, representing productivity (MRR), surface quality (Ra), tool condition (TWR), cutting mechanics (Fc), process stability (Vib and SPL), thermal behavior (Temp), and energy efficiency (SCE). These responses capture the detailed insights into machining performance, process stability, and sustainability aspects relevant to the proposed objectives of the present study. The mean values of all machining responses corresponding to each machining trial used for model development are presented. Individual output measurements were recorded using calibrated sensors under steady-state machining conditions. Details of the equipment, specifications, and accuracy of all response measurements are presented in Table 3. Note that responses such as TWR, SCE, and MRR were obtained from the data derived from physical equipment and relationships.
Table 3.
Machining response measurement instruments and specifications.
2.4. Experimental Dataset
Table 4 presents the experimental input–output datasets corresponding to the Taguchi L27 method. The workpiece materials (coded as Material 1: PA66, Material 2: PA66 + GF30, and Material 3: PA66 + MoS2) serve as material-dependent inputs. In contrast, other inputs (θ, rn, Vc, f, and ap) are represented in physical units for interpretability. The derived datasets lay the foundation for GPR, MEREC-CR, MOA, and post-optimality analysis, providing detailed insights into model reliability with small composite machining datasets.
Table 4.
Experimental Dataset from Taguchi L27 Design.
2.5. Surrogate Modeling and Optimization Framework
Figure 1 presents the GPR–MEREC-CR–MOA framework proposed for modeling, prediction, and optimization of composite machining. Three composite material-driven experimental machining datasets are used to train the GPR surrogate model to capture and establish non-linear input–output relationships and predictive uncertainty. The mathematical formulation corresponds to multi-response aggregation using the reliability-aware MEREC-CR strategy, which accounts for variability without subjective weighting. MOA determines the optimal parameter setting for all three materials that satisfy multiple conflicting outputs (maximize: MRR, and minimize: SPL, Temp, Vib., Fc, SCE, TWR, and Ra). Finally, post-optimality analysis (global sensitivity, contribution ranking, Monte Carlo uncertainty propagation) and validation experiments ensure the practicality, robustness, and interpretability of the GPR–MEREC-CR–MOA framework.
2.6. GPR Surrogate Modeling
The non-parametric nature of GPR enables the modeling of complex nonlinear relationships with limited datasets without assuming a predefined functional form [77]. GPR was selected because it provides high prediction accuracy while simultaneously quantifying predictive uncertainty, making it particularly suitable for small datasets. Comparative studies have shown that although ANN, SVR, Random Forest, and XGBoost are effective predictive models, GPR often demonstrates superior performance under limited data conditions owing to its Bayesian non-parametric formulation and inherent uncertainty estimation. These characteristics make GPR well suited for surrogate modeling and optimization in machining applications [58,59,77]. Furthermore, the trained GPR model inherently captures the non-linear relationships that quantify uncertainties with limited datasets and predict accurately across 15 random experimental cases [76].
The GPR model provides built-in uncertainty quantification by predicting confidence intervals that offer higher prediction accuracy and robustness, useful for reliable decision-making. The probabilistic nature and flexibility ensure the GPR model is ideal for capturing process insights such as nonlinearities and material-dependent effects and performing multi-response optimization. GPR is used as a surrogate model for the machining process to overcome the discrete nature of Taguchi L27 datasets and ensure a continuous function necessary for multiple-response optimization.
where represent the material 1: PA66, Material 2: PA66 + 30GF, and Material 3: PA66 + MoS2. , , and denote cutting speed, feed rate, and depth of cut, respectively; and represent the tool approach angle and nose radius.
For the ith response, the GPR model is expressed as shown in Equation (2). The latent function f(x) is modeled as a Gaussian process using an ARD-squared exponential kernel as defined in Equation (3).
where is the signal variance and represents the length-scale hyperparameters controlling input relevance. Given the training data D, the posterior predictive distribution at a new point x∗ is Gaussian, adopting the formulation in Equations (4) and (5).
In these expressions, k and k∗ are the kernel matrices and the covariance vector between training and test inputs, respectively. The kernel hyperparameters and noise variance Sare determined by maximizing the marginal log-likelihood.
This probabilistic formulation provides both the predictive mean and the associated uncertainty, enabling uncertainty-aware weighting, sensitivity analysis, and robust momentum-based optimization in subsequent stages.
2.7. Hybrid MEREC–CR Objective Weighting
The literature review confirms that optimal solutions in multi-response optimization rely on the selection of appropriate weights for individual responses [27,28,29]. Hybrid MEREC-CR ensures the relative importance (i.e., weighted fraction for each response) of individual outputs with a reliability component (CR) as a sustainable indicator denotes the normalized value of the th response for the th experiment. The total performance score of the system is first computed as
The effect of removing the th criterion is evaluated by recalculating the performance score as
The MEREC-driven contribution of the th response is then quantified as
While the MEREC component captures the structural influence of each response on the overall system, it does not explicitly account for data consistency. Therefore, a reliability measure is introduced based on the coefficient of variation (CV):
where and are the mean and standard deviation of the original (non-normalized) response data, respectively. The reliability index is defined as
Finally, the hybrid MEREC–CR weight for the th response is obtained by combining both components and normalizing them to unity:
This hybrid formulation ensures that responses with strong influence on system performance and low statistical variability are assigned greater importance. The resulting weights are subsequently used to construct the composite sustainability objective optimized in the following stage.
2.8. Composite Sustainability Objective Function
Penalty-Free Composite Performance Index (CPI)
To enable unified evaluation and optimization of multiple responses, a composite objective function is mathematically formulated by integrating GPR-based surrogate predictions with hybrid MEREC–CR weighting. For a candidate solution and material , the predicted response vector is first obtained from the trained GPR models as
where denotes the GPR-predicted value of the th sustainability response.
To limit the numerical fluctuations in large and small output values (which differ in scale and units), the predicted values are normalized using the global minimum and maximum values derived from the experimental dataset.
The composite sustainability objective, also referred to as the penalty-free composite performance index (CPI), is then defined as
where represents the hybrid MEREC–CR weight of the th response.
Because , the objective function is inherently bounded as , eliminating the need for artificial penalty terms for constraint handling. The mathematical formulation balances sustainable indicators (cost, environment, and quality) that ensure numerical stability during optimization. The task optimization is solved solely for each material as
The term x represents the feasible levels of machining parameters and tool geometry limits. MOA conducts an optimal search by exploring the design space (parameter bounds or levels), targeting rapid convergence to a globally sustainable machining solution.
2.9. Momentum-Based Optimization Algorithm (MOA)
MOA is applied to optimize the mathematically formulated composite sustainability objective . MOA combines the desirable features of finite-difference gradient estimation with the inclusion of a momentum parameter that accelerates convergence and reduces the risk of stagnation and trapping at local minima [78]. The position and velocity vectors of candidate or population solutions are updated at iteration t using Equations (16) and (17).
where is the momentum vector, is the momentum coefficient, is the learning coefficient, and represents the estimated gradient of the composite performance index. The gradient of CPI is approximated using a finite-difference scheme to improve the numerical stability and robustness. This allows MOA to work efficiently without requiring analytical derivatives of GPR models.
The updated solution is projected onto the constrained design space that ensures feasibility.
The term depicts the projection operator (composed of machining variables and tool geometry bounds). The parameter (designated as a decaying step size) ensures balance between exploration and exploitation during the search space.
MOA is initialized with the best solutions of the Taguchi L27 run for each material class to ensure a potential starting point and accelerate convergence. The optimization task is terminated when the predefined goal is reached (when there are no significant improvements in ) or when the maximum iteration (say, 80) is reached.
2.10. Post-Optimality Analysis
Post-optimality analysis (sensitivity, contribution, and uncertainty evaluation) is essential to ensure the model’s robustness and practical utility of optimized solutions.
2.10.1. Global Sensitivity Analysis Using PRCC
Partial Rank Correlation Coefficients (PRCC) are computed to determine the highest contribution or global influence on the composite sustainability objective. PRCC quantifies the relationships between each decision variable and the objective function (after controlling for the effects of other variables). The PRCC between the parameter and the objective for the sample dataset is given in Equation (19).
2.10.2. Parameter Contribution Analysis
The relative contribution (or weight fraction) of each variable ( towards composite sustainability outcome is determined by solving the contribution index using Equation (20).
Here, the term d refers to a decision variable. The allows investigators to rank variables (cutting parameters and tool geometry) based on their impact on the optimized solution.
2.10.3. Robustness Assessment Using Uncertainty Propagation
The probabilistic nature of GPR allows investigators to propagate uncertainty at the optimal point. The variance of the composite objective (multiple-response aggregation) is approximated as
Here, the term represents the GPR-predicted standard deviation of the th response. A low determined value indicates the highest robustness of the optimized solution under model uncertainty.
2.10.4. Contribution Index Analysis
The contribution of each output or objective response function to CPI at the optimum was calculated using Equation (21).
where is the weight determined using MEREC-CR and is the normalized response value.
2.10.5. Confirmatory Experimental Validation
The determined optimized machining settings were validated by conducting confirmation turning experiments. The actual experimental outputs were compared with the GPR model predicted values; the error was estimated using Equation (23).
The experimental responses were compared with the GPR-predicted values using percentage deviation. A lower error ensures close agreement between the model-predicted and experimental values, which justifies the model’s reliability and the practical usefulness of the proposed optimization framework.
3. Results and Discussion
3.1. Surrogate Model Validation
The proposed GPR–MEREC-CR–MOA optimization framework was developed for eight GPR surrogate models representing the machining responses (MRR, SPL, Temp, Vib., Fc, SCE, TWR, and Ra). The model’s statistical adequacy was evaluated for the L27 experimental dataset (refer to Table 4). Table 5 demonstrates strong predictive capability, with a coefficient of determination exceeding 0.97 for most responses. The GPR models for responses (Fc, Vib, and MRR) exhibit very strong agreement (R2 value approaching 1) with experimental data. The responses (Ra, TWR, SCE, Temp, SPL) produced slightly lower R2 values (ranging between 0.9721 and 0.9949) than Fc, Vib, and MRR responses, indicating the model’s higher reliability in capturing nonlinear parameter interactions.
Table 5.
The performance metrics of the GPR model for eight responses.
Figure 3 and Figure 4 show scatter plots of model-predicted and experimental values across three material classes (Material 1: PA66, Material 2: PA66 + GF30, and Material 3: PA66 + MoS2) of training and testing datasets (experimental cases). The data points lie close to the best-fit line for all three materials, indicating high predictive capability within the investigated range for both training and testing cases. Figure 5 and Figure 6 present the residual distribution (predicted deviation from the experimental value for all responses) for all three materials across training and testing cases. The residual distributions reveal no systematic patterns, indicating the model’s reliability and lack of bias. The model-predicted data points lie on both the positive and negative sides of the zero-reference line, indicating the model’s reliability and generalizability across different material classes. The trained GPR model is tested for nine random experimental cases (not combinations of the input variable set in Table 4), and model predictions are presented in Table 6. The R2 values for eight responses (Ra, Fc, Temp, Vib, TWR, SPL, MRR, and SCE) were found to vary in the ranges of 0.9729 to 1.000 for training datasets, and 0.8114 to 0.9985 for testing datasets. The results showed comparable R2 values, indicating that the GPR model ensures strong prediction accuracy with better generalizability across new experimental cases. The RMSE values were comparable for most responses (excluding MRR), indicating no evidence of overfitting. The mean absolute percent error was less than 6% for all nine experimental cases (excluding the responses TWR and SCE, where small magnitude values (0.01 gm/min for TWR and 0.01 J/mm3 for SCE) result in higher percent error despite a low value of RMSE and higher R2) presented in Table 5. The predictive analysis confirms the GPR surrogate model efficacy, ensuring generalizability across the design space or within the parameter bounds, and can be further extended for optimization and post-sensitivity analysis.
Figure 3.
Scatter plots showing GPR predictions versus experimental response values for three material classes across L27 training datasets (refer to Table 4): (a) Ra, (b) Fc, (c) TWR, (d) SCE, (e) vibration, (f) temperature, (g) sound pressure level, & (h) material removal rate.
Figure 4.
Scatter plots showing GPR predictions versus experimental response values for three material classes across 9 test cases (refer to Table 6): (a) Ra, (b) Fc, (c) TWR, (d) SCE, (e) vibration, (f) temperature, (g) sound pressure level, and (h) material removal rate.
Figure 5.
Residual plots representing GPR predictions against experimental response values for three material classes across L27 training datasets: (a) Ra, (b) Fc, (c) TWR, (d) SCE, (e) vibration, (f) temperature, (g) sound pressure level, and (h) material removal rate.
Figure 6.
Residual plots representing GPR predictions against experimental response values for three material classes across 9 test cases: (a) Ra, (b) Fc, (c) TWR, (d) SCE, (e) vibration, (f) temperature, (g) sound pressure level, and (h) material removal rate.
Table 6.
Testing experimental dataset for validation.
Cross-Validation and Generalization Analysis
To assess the generalization capability and potential risk of overfitting of the GPR surrogate models with the limited dataset (n = 27), a 5-fold cross-validation was performed. The results are summarized in Table 7. As shown in Table 7, the GPR models exhibited strong predictive performance for most responses, with mean CV-R2 values exceeding 0.90 for Ra, Fc, Vib, and Temp. However, higher variability and lower CV-R2 were observed for TWR, SCE, and MRR. Overfitting diagnostics (Train vs. CV gap) revealed small gaps for Ra, Fc, and Vib (<0.03), indicating good generalization for these responses. On the other hand, for TWR (Δ = 0.1995), SCE (Δ = 2.1518), and MRR (Δ = 0.2841), larger gaps were noted, suggesting that these low-magnitude or highly nonlinear responses are more sensitive to data partitioning.
Table 7.
Five-fold cross-validation performance of the GPR Models.
These findings highlight that while the GPR models with ARD kernel effectively capture the dominant trends even with limited data, responses such as TWR, SCE, and MRR may benefit from additional experimental points or enhanced regularization techniques in future studies. Nevertheless, the combination of residual analysis (Figure 5 and Figure 6), Monte Carlo uncertainty propagation, and the overall high R2 on the full dataset supports the practical reliability of the developed surrogates for optimization purposes within the explored design space.
3.2. Results of Multi-Objective Optimization (MOO)
The MOO was conducted independently on three materials using the GPR–MEREC-CR–MOA framework (refer to Table 8). The hybrid framework determined the optimal parameter settings for each material class. The CPI corresponding to all three optimal conditions was evaluated. Material 3 (PA66 + MoS2) exhibited the highest CPI value of 0.9261 compared to Material 2 (PA66 +GF30) and Material 1 (PA66). The results indicate that the predictive model has a pronounced impact on material optimization behavior. Therefore, Material 3 was identified as the preferred operating condition (θ = 93.0°, rn = 0.4 mm, Vc = 200 m/min, f = 0.3 mm/rev and ap = 1.08 mm) for turning composite materials that satisfy all outputs (Ra, Fc, TWR, vibration, temperature, SCE, SPL, and MRR). The best parameter setting of Taguchi design (Run 24 of Table 4) was reassessed with the MEREC-CR weights, resulting in a CPI value of 0.7111. Notably, under identical weight fraction conditions, the proposed method improved composite performance by 30.2% relative to the best experimental conditions. The CPI performance of 0.6013 (corresponding to 54.3% improvement) was obtained relative to the average dataset performance. The GPR–MEREC-CR–MOA model converged to a maximum CPI value (0.9265) at iteration 15, depicting stable and efficient search dynamics of weights with CV for different responses (refer to Figure 7a–c).
Table 8.
Optimal parameters and CPI comparison.
Figure 7.
Convergence and MEREC weights: (a) convergence plot, (b) final MEREC weights, and (c) CV plot.
Figure 8 shows the radar plot illustrating the balanced enhancement (cost category criteria values exceeded the normalized value of 0.9) across all responses, while MRR (a benefit criterion) remained competitive (0.679), depicting the management of the trade-offs without constraint penalization. Mean values with standard deviations and the CV were calculated from the experimental data presented in Table 4, and data reliability was evaluated. These metrics are incorporated to compute the MEREC-CR weights for each response. Figure 7b presents the final MEREC-CR weights with error bars (±1 S.D.) derived from three replicate experiments. Figure 7c shows the CV (%) for each response. Higher CV values (e.g., for MRR and SCE) depict higher variability and are appropriately down-weighted in the hybrid MEREC-CR weighting scheme to enhance decision robustness.
Figure 8.
Radar plot of normalized responses.
Benchmarking of MOA with GA, PSO, and GWO
The MOA effectiveness in terms of solution accuracy and computation time was compared with widely used meta-heuristic algorithms such as Particle Swarm Optimization (PSO), Grey Wolf Optimizer (GWO), and Genetic Algorithm (GA). All the algorithms (MOA, GA, PSO, and GWO) were tested under the same conditions used for the surrogate GPR model and MEREC-CR weights. Each algorithm was tested 30 times with different random initial conditions to assess reliability and search capabilities (maximum of 80 iterations). Computation efficiency of all four algorithms (GA, PSO, MOA, and GWO) was evaluated with a unified constraint: (a) Identical convergence-based stopping criterion for all four methods. (b) Each run terminated when the best CPI was achieved, with no significant improvement >1 × 10⁻⁶ over 20 consecutive iterations (maximum iterations maintained fixed at 80). (c) The actual number of function evaluations required for each run was computed from execution rather than its iteration count. (d) Three population-based algorithms (GA, PSO, and GWO) evaluate the entire population (50, 30, and 30) for each iteration, while MOA evaluates function evaluations based on 7 (1 base + 5 finite-difference perturbations or variable: 5 + 1 trial-step) per iteration.
The benchmarking results of four models (GPR+MEREC-CR+GA, GPR+MEREC-CR+MOA, GPR+MEREC-CR+PSO, and GPR+MEREC-CR+GWO) were evaluated in terms of best composite performance index (CPI), mean CPI, standard deviation, coefficient of variation (CV), mean number of function evaluations, computational time, average or mean iterations to convergence averaged over 30 trials, and are presented in Table 9. Population-based algorithms (GA, GWO, PSO) obtained slightly higher mean CPI values of 0.92714. In contrast, MOA obtained the closest comparable value of 0.92898 (a trivial reduction of <0.20%), ensuring consistent performance across the runs. Three population-driven algorithms require more function evaluations (1232 ± 285 for PSO, 1687 ± 564 for GWO, and 2753 ± 494 for GA) to achieve a comparable best CPI value. MOA required only 1.65 s of computational time and outperformed competing algorithms such as GA, GWO, and PSO (11.53 s, 6.21 s, and 4.82 s, respectively). MOA converged to the best CPI in 1.65 s, making the algorithm 7× faster than GA, 3.8× faster than GWO, and 2.9× faster than PSO. Note that although the MOA exhibited a relatively negligible higher standard deviation and CV (0.01286 and 1.41%), it offers a significant improvement in computation time (MOA reduces computational time relative to GA, PSO, and GWO by 85.7%, 65.8%, and 73.4%, respectively). The reduced computational time of MOA is particularly advantageous for advanced machining processes (including CNC turning, milling, and drilling operations), where optimization-based machine learning algorithms are integrated with digital twins, adaptive process control, and Industry 4.0 machining systems [79,80,81,82]. Recent studies demonstrated that integrating digital twin machining technologies relies on real-time process monitoring systems, digital twin-driven machining, chatter or vibration prediction, tool-condition assessment, and adaptive or real-time monitoring and optimization to continuously adjust cutting parameters through feedback from sensors [79,81,82,83]. Such applications require rapid response, enabling reduced-computation algorithms that are practical for closed-loop decision-making [80,81]. Therefore, the substantially lower computational time of MOA enables faster decision-making by predicting a near-optimal solution, facilitating real-time optimization of cutting parameters, supporting predictive maintenance, intelligent process monitoring, and closed-loop machine control. The results demonstrated that MOA achieves a consistent trade-off that balances both solution accuracy and computational efficiency, making it a highly suitable tool for the proposed GPR+MEREC-CR framework. The results of GPR+MEREC-CR-MOA can be applied for developing intelligent machining through real-time adaptive optimization (where decisions are made within the machine control system).
Table 9.
Benchmarking of optimization algorithms with GPR+MEREC-CR framework.
3.3. Evaluation of Post-Optimality Analysis
The efficacy of the developed hybrid framework was interpreted and validated through structured post-optimality analysis, including local sensitivity, global sensitivity (in terms of PRCC), contribution index evaluation, and uncertainty propagation.
3.3.1. Global Sensitivity Analysis
Multiple input–output variables influence the machining process. Machining was conducted under one parametric condition, and multiple responses (eight in the present work) were recorded. Therefore, the machining responses are strongly interdependent, which affects the optimal solutions. Global sensitivity analysis was conducted to determine the influence of machining variables on CPI (accounting for inter-parameter dependencies) using the Partial Rank Correlation Coefficient (PRCC). PRCC analysis was performed on the Taguchi experimental dataset (refer to Table 5).
Figure 9 presents the PRCC analysis of machining parameters by evaluating the CPI. The feed rate exhibits the strongest parametric influence on CPI (PRCC = +0.189). Therefore, variations in feed rate within the operating levels between 0.1 and 0.3 mm/rev improve the composite performance (balanced solutions to all conflicting responses). The feed rate enhances MRR, which outweighs slight degradation in surface integrity (surface roughness) and dynamic responses (TWR, Fc, SPL, and Vib.) under the MEREC-CR weighting scheme. The depth of cut parameter confirmed its negative influence through analysis (PRCC = −0.131), depicting increased Fc, TWR, and SCE at higher levels (refer to Figure 9). The other parameters (PRCC values of nose radius, tool angle, and cutting speed are +0.096, +0.042, and −0.012) within their tested operating levels showed a negligible influence on composite performance. The above results confirm that the variables influencing productivity, particularly feed rate and depth of cut, strongly influenced CPI within the investigated parameter range and demonstrated the hybrid framework’s capability to reveal data-driven sensitivity relationships.
Figure 9.
Global sensitivity analysis of machining parameters based on PRCC accounting for CPI.
3.3.2. Response Contribution Analysis
Table 10 summarizes the contribution of individual responses determined through MEREC-CR towards CPI. TWR is the most dominant contributing factor (16.04%) due to its highest normalized performance and a reliability-driven weight of 0.1486. It is noteworthy that the other responses (SCE, Vib, Fc, Ra, Temp, and SPL) show appropriate impact (greater than 10%) on CPI. Despite the lowest weight contribution recorded with MRR (4.44%), it still has a positive influence on CPI. This demonstrates the advantage of a penalty-free composite mathematical formulation, where outputs with lower reliability-adjusted weights can still contribute significantly when the performance is favorable. This analysis of weight importance and computed impact provides insights into the drivers of the optimal solution, complementing sensitivity analysis.
Table 10.
Response contribution to optimal CPI.
3.3.3. Uncertainty Quantification (UQ) Analysis at the Optimal Solution
The GPR-data-driven Monte Carlo propagation framework was evaluated for UQ to examine the robustness of optimal solutions. GPR provides the predictive mean and posterior variance for each output at the optimum. However, Monte Carlo simulation (with 1000 realizations) extends these uncertainties through output normalization and weighting (MEREC-CR) to determine CPI. Table 11 presents the predicted response-wise validation (including mean estimates, standard deviation, and confidence levels) corresponding to the optimal setting. The responses (MRR, SPL, and Vibration) exhibit narrow confidence ranges, indicating the model’s higher predictive reliability. The cutting force and temperature exhibit moderate uncertainty attributed to thermo-mechanical sensitivity. The negative lower confidence bounds obtained for TWR and SCE arise due to uncertainty propagation associated with low-magnitude responses and surrogate model variance. These negative lower bounds are purely statistical artifacts arising from uncertainty propagation in the surrogate-based Monte Carlo simulation for very low-magnitude responses, and they do not represent physically meaningful negative values of wear or energy.
Table 11.
Predicted responses at optimal parameters.
Figure 10 depicts the Monte Carlo distribution of CPI values (mean and 95% confidence level). Low dispersion was recorded, with a mean CPI of 0.9174 and a standard deviation of 0.0153. The statistical reliability of the optimum (CPI = 0.9265) solution is confirmed through a deterministic approach with a preset 95% confidence level [0.8859, 0.9451]. Figure 10 illustrates the narrow distribution of CPI, indicating that the higher composite performance is consistent despite GPR prediction uncertainty. This validates the reliability and stability of the GPR–MEREC-CR–MOA framework. The graph shows the probability distribution of CPI at the optimum, based on 1000 Monte Carlo simulations. The red dashed lines represent the 95% confidence interval [0.8859, 0.9451], and the red triangle indicates the mean CPI of 0.9174.
Figure 10.
Monte Carlo probability distribution of optimal CPI (n = 1000; mean = 0.9174; 95% CI: 0.8859–0.9451).
3.3.4. Confirmatory Experiment and Validation
The GPR–MEREC-CR–MOA framework determined that the optimal conditions corresponding to Material 3 (PA66 + MoS2) are validated by conducting confirmatory experiments. Table 12 presents the GPR-predicted and experimental values of all responses. The model predicted responses such as Ra, Fc, SPL, MRR, vibration, and temperature with excellent accuracy (ranging between 0 and 5%). Slightly higher percent deviation was recorded for TWR and SCE, attributed to the stochastic nature of these lower-magnitude values. It is important to note that minor absolute deviations from experimental values fall within the 95% confidence levels obtained from GPR-driven UQ. The GPR model predicted with a narrow CPI uncertainty boundary, confirming that the optimized solution is experimentally reliable, robust, and sustainable for deployment in industries.
Table 12.
Experimental validation of optimal machining solution.
3.3.5. Ablation Study
An ablation analysis was conducted to quantify the contribution of the proposed GPR–MEREC-CR–MOA framework. The GPR–MEREC-CR–MOA framework resulted in the highest CPI value equal to 0.9265 (refer to Table 13). Replacing MOA with random search resulted in negligible performance loss (−0.41%), indicating that the surrogate model is relatively smooth near the optimum. Substituting GPR with a linear regression model resulted in a substantial loss (−25.4%) in CPI value, emphasizing the critical role of the nonlinear surrogate model in capturing complex machining responses. Substituting MEREC-CR weights with equal weights decreased the CPI value by 0.97%, confirming that objective reliability enhances robustness when performance gains are uncertain. The model with MEREC weights without CR refinement demonstrated a cross-reliability adjustment with a slight reduction (−0.27%) that stabilizes the multi-response aggregation. Finally, the results confirm that the individual modules contribute meaningfully, but their hybridization ensures maximum and reliable composite performance.
Table 13.
Ablation study results for various models.
3.4. Limitations of the Work
The GPR–MEREC-CR–MOA paradigm shows high predictive performance, as evidenced by statistics (R2 = 0.973) and mathematical correlation or multi-response optimization criteria. However, some limitations remain that need to be addressed.
Material and Geometrical Boundaries: The obtained optimal parametric values are confined to the properties of the studied polymer-based matrices (PA66, PA66 + GF30, and PA66 + MoS2). Their application to metals or other materials may require further investigation.
Boundary Conditions for Lubrication System: The framework is designed for dry turning operations only. It does not account for alternative cooling methods such as MQL or flooding.
Significant Dependency on Dispersion: The objective weights estimated via the MEREC-CR method strongly depend on the dispersion of the empirical results. Thus, excessive measurement noise in the data can lead to inaccurate weight estimation.
The physics-informed Johnson–Cook formulation models explain the material deformation mechanisms (dynamic recrystallization, grain growth, phase transformation, or microstructural evolution) during machining [84]. Integrating a hybrid physics-informed machine learning framework provides physical interpretability of machining learning predictions, which is considered a limitation.
In the GPR–MEREC-CR–MOA framework, the surrogate GPR model can be replaced with other models (ANN, SVR, Random Forest, or XGBoost) for possibly better predictions of machining performance (if any). Additionally, this study did not measure residual stress. Future work could incorporate residual stress measurement using XRD for a more complete surface integrity assessment.
4. Conclusions
Sustainable composite machining performance, including improved surface integrity and productivity and reduced energy consumption, is of industrial relevance. The Taguchi L27 matrix was used to test different combinations of six variables, resulting in eight performance datasets (MRR, SPL, Temp, Vib., Fc, SCE, TWR, and Ra). We established a hybrid GPR–MEREC-CR–MOA framework for sustainable multi-response turning of composite materials (PA66, PA66 + GF30, and PA66 + MoS2). The framework included probabilistic GPR surrogate modeling, reliability-aware response weighting (MEREC-CR), and MOA to capture nonlinear machining behavior, experimental variability, and conflicting performance objectives (Maximize: MRR; Minimize: SPL, Temp, Vib., Fc, SCE, TWR, and Ra).
The GPR surrogate models developed for the eight responses showed strong predictive capability (R2 ≥ 0.973) for all responses, with no obvious systematic bias in the residual distributions, indicating the suitability of probabilistic surrogate modeling for machining process optimization within the investigated parameter domain. The framework, integrated with a reliability-aware weighting method (MEREC–CR) and MOA, identified the preferred machining conditions for Material 3 (PA66 + MoS2) as tool approach angle = 93.0°, nose radius = 0.40 mm, cutting speed = 200 m/min, feed rate = 0.300 mm/rev, and depth of cut = 1.08 mm.
The resulting optimal condition achieved the highest CPI of 0.9265, indicating a 30.2% improvement over the best experimental condition (CPI: 0.7111) among the Taguchi L27 experiments, demonstrating the effectiveness of the proposed surrogate-assisted optimization framework. The contribution of individual responses towards the optimal solution was computed based on CPI, with TWR showing the highest influence (16.04%), followed by SCE, vibration, Fc, Ra, temperature, SPL, and MRR with contributions of 14.59%, 13.97%, 13.50%, 13.4%, 12.08%, 11.98%, and 4.44%, respectively. MRR contributed the least because of its lower reliability-adjusted weight and favorable normalized performance, allowing it to contribute positively to the overall objective functions. These results indicate that the MEREC–CR weighting mechanism can capture response importance and contribution within the optimization framework. Global sensitivity analysis using PRCC (+0.189) showed that the feed rate has the strongest positive impact on CPI, indicating its significant role in controlling overall machining performance while balancing with other responses. Validation with nine independent experimental cases confirmed the strong generalizability of the GPR models (R2 = 0.811–0.998). Benchmarking showed that MOA achieves solution quality nearly equivalent to GA, PSO, and GWO while reducing computational time by up to 86%, making the framework suitable for both offline and real-time adaptive machining applications.
By integrating the GPR probabilistic model, MEREC-CR, and the MOA methodology, the framework provides an optimal decision-making tool for selecting and optimizing the parameters that characterize machining performance. The GPR–MEREC-CR–MOA framework provides the mathematical foundation for decision-making in investigating the relationship between productivity, energy efficiency, tool durability, and machining stability at the boundaries of the tested composites. The proposed methodological framework is best suited for large-scale industrial machining because of its computational efficiency and ability to learn from small data. MOA’s rapid convergence supports real-time engineering applications. At the same time, the overall approach (GPR+MEREC-CR+MOA) can be extended to other processes (such as milling and drilling), provided the models are retrained with domain-specific data.
Author Contributions
Conceptualization, E.I., F.I.A., I.E., D.C. and O.D.S.; methodology, O.D.S., M.P.G.C., G.R.C. and D.C.; software, E.I., F.I.A., I.E., M.P.G.C., G.R.C. and O.D.S.; validation, M.P.G.C., D.C. and O.D.S.; formal analysis, F.I.A., I.E., G.R.C., D.C. and O.D.S.; investigation, O.D.S., M.P.G.C., and D.C.; data curation, O.D.S., M.P.G.C., G.R.C. and D.C.; writing—original draft preparation, E.I., F.I.A., I.E., M.P.G.C., G.R.C., D.C. and O.D.S.; writing—review and editing, M.P.G.C., G.R.C., D.C. and O.D.S.; supervision, O.D.S. and M.P.G.C. All authors have read and agreed to the published version of the manuscript.
Funding
This research received no external funding.
Data Availability Statement
The original contributions presented in this study are included in the article.
Acknowledgments
During the preparation of this manuscript/study, the author(s) used Grammarly Pro Software (v1.2.286.1939) for English Correction and language polishing. The authors have reviewed and edited the output and take full responsibility for the content of this publication. The authors gratefully acknowledge the support of the National Research Fund (NRF) under grant number TETF/ES/DR&D-CE/NRF2021.
Conflicts of Interest
The authors declare no conflicts of interest.
References
- Iqbal, A.; Zhao, G.; Cheok, Q.; He, N.; Nauman, M.M. Sustainable machining: Tool life criterion based on work surface quality. Processes 2022, 10, 1087. [Google Scholar] [CrossRef] [Scilit]
- Pimenov, D.Y.; Der, O.; Patel, G.M.; Giasin, K.; Ercetin, A. State-of-the-art review of energy consumption in machining operations: Challenges and trends. Renew. Sustain. Energy Rev. 2025, 224, 116073. [Google Scholar] [CrossRef] [Scilit]
- Saeed, M.A.; Junejo, F.; Amin, I.; Tanoli, I.K.; Ahmad, S.; Alluhaidan, A.S.D.; Ateya, A.A. Optimizing economic and environmental objectives in sustainable machining processes. Clean. Eng. Technol. 2025, 28, 101067. [Google Scholar] [CrossRef] [Scilit]
- Schneider, F.; Das, J.; Kirsch, B.; Linke, B.; Aurich, J.C. Sustainability in ultra precision and micro machining: A review. Int. J. Precis. Eng. Manuf.-Green. Technol. 2019, 6, 601–610. [Google Scholar] [CrossRef] [Scilit]
- Sivam, S.P.S.S.; Thejasree, P.; Manikandan, N.; Olaiya, B.C. Sustainable and cost-efficient machining of ZE41 magnesium alloy through optimization with Intuitionistic Fuzzy TOPSIS. Sci. Rep. 2025, 15, 35875. [Google Scholar] [CrossRef] [Scilit] [PubMed]
- Sen, B.; Kantheti, P.; Rathore, S.; Kanabar, B.; Thulasiram, R.; Kumar, M.; Bhowmik, A.; Santhosh, A.J. A multi-objective optimization framework for the sustainable machining of Monel 400. Sci. Rep. 2025, 15, 24868. [Google Scholar] [CrossRef] [Scilit] [PubMed]
- Jia, S.; Wang, S.; Li, S.; Cai, W.; Liu, Y.; Bai, S.; Li, Z.S. Integrated multi-objective optimization of rough and finish cutting parameters in plane milling for sustainable machining considering efficiency, energy, and quality. J. Clean. Prod. 2024, 471, 143406. [Google Scholar] [CrossRef] [Scilit]
- Natesh, C.P.; Siddeshkumar, N.G.; Srinivasa, G.; Shivaramakrishna, A.; Pruthvi, H.M.; Prasad, C.D.; Shashidhara, Y.M.; Amarendra, H.J.; Tiwari, A.; Aden, A.A. Multi-objective optimization of surface roughness and MRR in AISI 316L stainless steel processed by MQL end milling using taguchi, RSM, ANN, and RFR methods. Sci. Rep. 2025, 15, 36583. [Google Scholar] [CrossRef] [Scilit] [PubMed]
- Bağcı, E.; Aykut, Ş. The effects of tool position, coating and cutting parameters on forces, power, MRR and wear in face milling of Stellite 6. Arab. J. Sci. Eng. 2014, 39, 8135–8146. [Google Scholar] [CrossRef] [Scilit]
- Yousefi, S.; Zohoor, M. Effect of cutting parameters on the dimensional accuracy and surface finish in the hard turning of MDN250 steel with cubic boron nitride tool, for developing a knowledged base expert system. Int. J. Mech. Mater. Eng. 2019, 14, 1. [Google Scholar] [CrossRef] [Scilit]
- Saharudin, M.S.; Hasbi, S.; Younas, M.; Ullah, A. Machining of composite materials: Challenges, advances and AI-driven solutions. J. Teknol. 2026, 88, 135–154. [Google Scholar] [CrossRef] [Scilit]
- Shelare, S.; Aglawe, K.; Giri, S.; Waghmare, S. Additive manufacturing of polymer composites: Applications, challenges and opportunities. Indian J. Eng. Mater. Sci. 2023, 30, 872. [Google Scholar] [CrossRef] [Scilit]
- Alarifi, I.M. Revolutionising fabrication advances and applications of 3D printing with composite materials: A review. Virtual Phys. Prototyp. 2024, 19, e2390504. [Google Scholar] [CrossRef] [Scilit]
- Slamani, M.; Chatelain, J.-F. A review on the machining of polymer composites reinforced with carbon (CFRP), glass (GFRP), and natural fibers (NFRP). Discov. Mech. Eng. 2023, 2, 4. [Google Scholar] [CrossRef] [Scilit]
- Markopoulos, A.P.; Pressas, I.S.; Papantoniou, I.G.; Karkalos, N.E.; Davim, J.P. Machining and machining modeling of metal matrix composites—A review. In Modern Manufacturing Engineering; Springer: Berlin/Heidelberg, Germany, 2015; pp. 99–141. [Google Scholar]
- Mpoyi, D.K.; Ekuakille, A.L.; Ugwiri, M.A.; Casavola, C.; Pappalettera, G. Wear monitoring based on vibration measurement during machining: An application of FDM and EMD. Meas. Sens. 2024, 32, 101051. [Google Scholar] [CrossRef] [Scilit]
- Maia, L.H.A.; Abrão, A.M.; Vasconcelos, W.L.; Júnior, J.L.; Fernandes, G.H.N.; Machado, Á.R. Enhancing machining efficiency: Real-time monitoring of tool wear with acoustic emission and STFT techniques. Lubricants 2024, 12, 380. [Google Scholar] [CrossRef] [Scilit]
- Abdullahu, F.; Zhujani, F.; Todorov, G.; Kamberov, K. An experimental analysis of Taguchi-based gray relational analysis, weighted gray relational analysis, and data envelopment analysis ranking method multi-criteria decision-making approaches to multiple-quality characteristic optimization in the CNC drilling process. Processes 2024, 12, 1212. [Google Scholar] [CrossRef] [Scilit]
- Mukherjee, I.; Ray, P.K. A review of optimization techniques in metal cutting processes. Comput. Ind. Eng. 2006, 50, 15–34. [Google Scholar] [CrossRef] [Scilit]
- Baum, M.; Anders, D.; Reinicke, T. Optimizing injection molding simulations: Comparative performance of Kriging and RSM surrogate models for process efficiency. Discov. Mech. Eng. 2025, 4, 31. [Google Scholar] [CrossRef] [Scilit]
- Kudela, J.; Matousek, R. Recent advances and applications of surrogate models for finite element method computations: A review. Soft Comput. 2022, 26, 13709–13733. [Google Scholar] [CrossRef] [Scilit]
- Öztürk, S.; Kahraman, M.F. Modeling and optimization of machining parameters during grinding of flat glass using response surface methodology and probabilistic uncertainty analysis based on Monte Carlo simulation. Measurement 2019, 145, 274–291. [Google Scholar] [CrossRef] [Scilit]
- Ramesha, K.; Santhosh, N.; Praveena, B.A.; Nagaraj, B.; Naik, N.C.K.; Naveed, Q.N.; Lasisi, A.; Wodajo, A.W. ANN and machine learning based predictions of MRR in AWSJ machining of CFRP composites. Sci. Rep. 2025, 15, 14218. [Google Scholar] [CrossRef] [Scilit] [PubMed]
- Touati, S.; Boumediri, H.; Karmi, Y.; Chitour, M.; Boumediri, K.; Zemmouri, A.; Moussa, A.; Fernandes, F. Performance analysis of steel W18CR4V grinding using RSM, DNN-GA, KNN, LM, DT, SVM models, and optimization via desirability function and MOGWO. Heliyon 2025, 11, e42640. [Google Scholar] [CrossRef] [Scilit] [PubMed]
- Almomani, O.; Venkatesh, B.; Chaudhary, S.P.; Mishra, A.; Sujai, S.; Juneja, S.; Pradhan, P.; Venkatesan, S.P.; Bhowmik, A.; Tamene, Y. Intelligent tool wear monitoring using XGBoost, SVR, and DNN models in NMQL environment. Sci. Rep. 2026, 16, 10030. [Google Scholar] [CrossRef] [Scilit] [PubMed]
- Li, C.; Xiao, Q.; Tang, Y.; Li, L. A method integrating Taguchi, RSM and MOPSO to CNC machining parameters optimization for energy saving. J. Clean. Prod. 2016, 135, 263–275. [Google Scholar] [CrossRef] [Scilit]
- Jagadish; Patel, G.M.; Sibalija, T.V.; Mumtaz, J.; Li, Z. Abrasive water jet machining for a high-quality green composite: The soft computing strategy for modeling and optimization. J. Braz. Soc. Mech. Sci. Eng. 2022, 44, 83. [Google Scholar] [CrossRef] [Scilit]
- Patel, G.C.M.; Jagadish. Experimental modeling and optimization of surface quality and thrust forces in drilling of high-strength Al 7075 alloy: CRITIC and meta-heuristic algorithms. J. Braz. Soc. Mech. Sci. Eng. 2021, 43, 244. [Google Scholar] [CrossRef] [Scilit]
- Patel, G.M.; Lokare, D.; Chate, G.R.; Parappagoudar, M.B.; Nikhil, R.; Gupta, K. Analysis and optimization of surface quality while machining high strength aluminium alloy. Measurement 2020, 152, 107337. [Google Scholar] [CrossRef] [Scilit]
- Sibalija, T.V.; Kumar, S.; Patel, G.C.M.; Jagadish. A soft computing-based study on WEDM optimization in processing Inconel 625. Neural Comput. Appl. 2021, 33, 11985–12006. [Google Scholar] [CrossRef] [Scilit]
- Thomas, L.; Patel, G.M. Modeling and Optimization of Abrasive Water Jet Machining Process on Surface Quality of Green Composite Using Nature-Inspired Techniques Methods: Comparative Study of Teaching Learning-Based Optimization (TLBO), Artificial Bee Colony (ABC), and Particle Swarm Optimization (PSO). In Process Modeling and Optimization in Modern Man-ufacturing; CRC Press: Boca Raton, FL, USA, 2025; pp. 40–60. [Google Scholar]
- Bolufé-Röhler, A.; Tamayo-Vera, D. Machine learning for enhancing metaheuristics in global optimization: A comprehensive review. Mathematics 2025, 13, 2909. [Google Scholar] [CrossRef] [Scilit]
- Talbi, E.G. Machine learning into metaheuristics: A survey and taxonomy. ACM Comput. Surv. 2021, 54, 1–32. [Google Scholar] [CrossRef] [Scilit]
- Dash, D.; Devarajaiah, D.; Dash, S.K.; Samanta, S.; Rai, R.N.; Barik, D.; Paramasivam, P.; Ayanie, A.G. Investigation on hybrid optimization approach for minimizing surface roughness in the machining of Mg/TiC metal matrix composites using spark EDM. Sci. Rep. 2025, 15, 33679. [Google Scholar] [CrossRef] [Scilit] [PubMed]
- Huang, X.; Liu, H.; Zhou, Q.; Su, Q. A surrogate-assisted gray prediction evolution algorithm for high-dimensional expensive optimization problems. Mathematics 2025, 13, 1007. [Google Scholar] [CrossRef] [Scilit]
- Thi, M.H.P.; Nguyen, Q.M.; Nguyen, A.T.; Nguyen, V.T.; Vu, M.H.; Do, T.V. A hybrid RSM–PSO approach for enhancing machining performance in nanofluid-assisted hard turning. Math. Model. Eng. Probl. 2025, 12, 2681–2689. [Google Scholar] [CrossRef] [Scilit]
- Ajagol, P.; Marigoudar, R.N.; Anjan, B.N.; Manjunath Patel, G.C.; Shettar, M.; Lakshmikanthan, A. Multiobjective optimization of milling performance characteristics of Al 1200 SiC metal matrix composites using statistical and artificial intelligence tools. Discov. Mater. 2026, 6, 146. [Google Scholar] [CrossRef] [Scilit]
- Nguyen, V.-H.; Le, T.-T.; Le, M.V.; Minh, H.D.; Nguyen, A.-T. Multi-objective optimization based on machine learning and non-dominated sorting genetic algorithm for surface roughness and tool wear in Ti6Al4V turning. Mach. Sci. Technol. 2023, 27, 380–421. [Google Scholar] [CrossRef] [Scilit]
- Nguyen, V.-H.; Le, T.-T.; Nguyen, A.-T.; Hoang, X.-T.; Nguyen, N.-T.; Nguyen, N.-K. Optimization of milling conditions for AISI 4140 steel using an integrated machine learning-multi objective optimization-multi criteria decision making framework. Measurement 2025, 242, 115837. [Google Scholar] [CrossRef] [Scilit]
- Van-Canh, N.; Anh-Thang, N.; Ngoc-Linh, P.; Thuy-Duong, N. Multi-objective optimization of SUS430C steel turning process using hybrid machine learning and evolutionary algorithm approach. Results Eng. 2025, 25, 104233. [Google Scholar] [CrossRef] [Scilit]
- Elly, O.I.; Takács, M.; Balázs, B.Z. Burr size minimization using a surrogate artificial neural network (ANN) assisted multi-objective genetic algorithm (MOGA) in micromilling hardened AISI H13. Int. J. Adv. Manuf. Technol. 2026, 142, 3479–3498. [Google Scholar] [CrossRef] [Scilit]
- Patil, S.S.; Gadakh, V.S.; Shinde, V.B.; Khemnar, N.S.; Uyala, S.B. Grinding process parameter optimization to enhance surface finish using NSGA-II algorithm: An integrated experimental and evolutionary approach. J. Eng. Appl. Sci. 2026, 73, 61. [Google Scholar] [CrossRef] [Scilit]
- Wang, C.; Qiang, X.; Xu, M.; Wu, T. Recent advances in surrogate modeling methods for uncertainty quantification and propagation. Symmetry 2022, 14, 1219. [Google Scholar] [CrossRef] [Scilit]
- Gopakumar, V.; Gray, A.; Oskarsson, J.; Giles, D.; Zanisi, L.; Kusner, M.; Pamela, S.; Deisenroth, M. Uncertainty quantification of surrogate models using conformal prediction. Mach. Learn. Sci. Technol. 2026, 7, 015025. [Google Scholar] [CrossRef] [Scilit]
- Razavi, S.; Tolson, B.A.; Burn, D.H. Review of surrogate modeling in water resources. Water Resour. Res. 2012, 48, W07401. [Google Scholar] [CrossRef] [Scilit]
- Davim, J.P. Machining Composite Materials; John Wiley & Sons: Chichester, UK, 2013. [Google Scholar]
- Raj, S.S.R.; Dhas, J.E.R.; Jesuthanam, C. Challenges on machining characteristics of natural fiber-reinforced composites—A review. J. Reinf. Plast. Compos. 2021, 40, 41–69. [Google Scholar] [CrossRef] [Scilit]
- Kizielewicz, B.; Tomczyk, T.; Gandor, M.; Sałabun, W. Subjective weight determination methods in multi-criteria decision-making: A systematic review. Procedia Comput. Sci. 2024, 246, 5396–5407. [Google Scholar] [CrossRef] [Scilit]
- Singh, M.; Pant, M. A review of selected weighing methods in MCDM with a case study. Int. J. Syst. Assur. Eng. Manag. 2021, 12, 126–144. [Google Scholar] [CrossRef] [Scilit]
- Zhang, B.; Hu, X.; Li, B.; Wu, P.; Cai, X.; Luo, Y.; Deng, X.; Jiang, M. A groundwater quality assessment model for water quality index: Combining principal component analysis, entropy weight method, and coefficient of variation method for dimensionality reduction and weight optimization, and its application. Water Environ. Res. 2024, 96, e11155. [Google Scholar] [CrossRef] [Scilit] [PubMed]
- Sheret, M. The coefficient of variation: Weighting considerations. Soc. Indic. Res. 1984, 15, 289–295. [Google Scholar] [CrossRef] [Scilit]
- Ren, W.; Jian, H. The comprehensive evaluation of “five aspects” based on coefficient-of-variation-modified G1 combination weighting. In Proceedings of the 2nd Sensor Networks and Signal Processing (SNSP 2019), Hualien, Taiwan, 19–22 November 2019; pp. 253–268. [Google Scholar]
- Odu, G. Weighting methods for multi-criteria decision making technique. J. Appl. Sci. Environ. Manag. 2019, 23, 1449. [Google Scholar] [CrossRef] [Scilit]
- Mukhametzyanov, I. Specific character of objective methods for determining weights of criteria in MCDM problems: Entropy, CRITIC and SD. Decis. Mak. Appl. Manag. Eng. 2021, 4, 76–105. [Google Scholar] [CrossRef] [Scilit]
- Zaman, K.; McDonald, M.; Mahadevan, S.; Green, L. Robustness-based design optimization under data uncertainty. Struct. Multidiscip. Optim. 2011, 44, 183–197. [Google Scholar] [CrossRef] [Scilit]
- Erbey, A.; Fidan, Ü.; Gündüz, C. A robust hybrid weighting scheme based on IQRBOW and entropy for MCDM: Stability and advantage criteria in the VIKOR framework. Entropy 2025, 27, 867. [Google Scholar] [CrossRef] [Scilit] [PubMed]
- Xun, C.; Wu, P. A generic multi-objective optimization of machining processes using an end-to-end evolutionary algorithm. Machines 2024, 12, 635. [Google Scholar] [CrossRef] [Scilit]
- Wang, Z.; Zhou, G.; Zhang, C.; Xiao, Q.; Zio, E. Physics-informed Gaussian process regression for tool wear monitoring with uncertainty quantification. Reliab. Eng. Syst. Saf. 2025, 268, 111984. [Google Scholar] [CrossRef] [Scilit]
- Singh, S.K.; Mali, H.S.; Unune, D.R.; Wojciechowski, S.; Wilczyński, D. Application of generalized regression neural network and gaussian process regression for modelling hybrid micro-electric discharge machining: A comparative study. Processes 2022, 10, 755. [Google Scholar] [CrossRef] [Scilit]
- Lu, J.; Zhang, Z.; Yuan, X.; Ma, J.; Hu, S.; Xue, B.; Liao, X. Effect of machining parameters on surface roughness for compacted graphite cast iron by analyzing covariance function of Gaussian process regression. Measurement 2020, 157, 107578. [Google Scholar] [CrossRef] [Scilit]
- Hashemitaheri, M.; Mekarthy, S.M.R.; Cherukuri, H. Prediction of specific cutting forces and maximum tool temperatures in orthogonal machining by support vector and gaussian process regression methods. Procedia Manuf. 2020, 48, 1000–1008. [Google Scholar] [CrossRef] [Scilit]
- Kong, D.; Chen, Y.; Li, N. Gaussian process regression for tool wear prediction. Mech. Syst. Signal Process. 2018, 104, 556–574. [Google Scholar] [CrossRef] [Scilit]
- Cheng, M.; Jiao, L.; Yan, P.; Feng, L.; Qiu, T.; Wang, X.; Zhang, B. Prediction of surface residual stress in end milling with Gaussian process regression. Measurement 2021, 178, 109333. [Google Scholar] [CrossRef] [Scilit]
- Vidyasagar, M. Convergence of momentum-based optimization algorithms with time-varying parameters. arXiv 2025, arXiv:11904. [Google Scholar]
- Oikonomou, D.; Loizou, N. Stochastic Polyak step-sizes and momentum: Convergence guarantees and practical performance. arXiv 2024, arXiv:04142. [Google Scholar]
- Sun, H.; Cai, Y.; Tao, R.; Shao, Y.; Xing, L.; Zhang, C.; Zhao, Q. An improved reacceleration optimization algorithm based on the momentum method for image recognition. Mathematics 2024, 12, 1759. [Google Scholar] [CrossRef] [Scilit]
- Keshavarz-Ghorabaee, M.; Amiri, M.; Zavadskas, E.K.; Turskis, Z.; Antucheviciene, J. Determination of objective weights using a new method based on the removal effects of criteria (MEREC). Symmetry 2021, 13, 525. [Google Scholar] [CrossRef] [Scilit]
- Davim, J.P.; Silva, L.R.; Festas, A.; Abrão, A. Machinability study on precision turning of PA66 polyamide with and without glass fiber reinforcing. Mater. Des. 2009, 30, 228–234. [Google Scholar] [CrossRef] [Scilit]
- Luo, K.; Liu, J.; Abbay, K.; Mei, Y.; Guo, X.; Song, Y.; Guan, Q.; You, Z. The relationships between the structure and properties of PA56 and PA66 and their fibers. Polymers 2023, 15, 2877. [Google Scholar] [CrossRef] [Scilit] [PubMed]
- Kumar, R.; Mishra, S.K.; Jayapalan, S. Experimental analysis on the microstructural, mechanical, thermal and tribological properties of graphene nanoplatelets and molybdenum disulfide filled polyamide-6,6 novel hybrid composite. Polym. Compos. 2025, 46, 4703–4728. [Google Scholar] [CrossRef] [Scilit]
- Ensinger. PA66 (TECAMID 66) Product Search and Technical Information. Available online: https://www.ensingerplastics.com/en/search?term=PA66 (accessed on 15 June 2026).
- Angappan, P.; Thangiah, S.; Subbarayan, S. Taguchi-based grey relational analysis for modeling and optimizing machining parameters through dry turning of Incoloy 800H. J. Mech. Sci. Technol. 2017, 31, 4159–4165. [Google Scholar] [CrossRef] [Scilit]
- Akhtar, M.N.; Sathish, T.; Mohanavel, V.; Afzal, A.; Arul, K.; Ravichandran, M.; Rahim, I.A.; Alhady, S.S.N.; Abu Bakar, E.; Saleh, B. Optimization of process parameters in CNC turning of aluminum 7075 alloy using L27 array-based Taguchi method. Materials 2021, 14, 4470. [Google Scholar] [CrossRef] [Scilit] [PubMed]
- Singh, R. Application of Taguchi method to optimize CNC parameters on Brass 63/37 (C27400). Mater. Today Proc. 2021, 45, 4424–4430. [Google Scholar] [CrossRef] [Scilit]
- Islam, M.N.; Pramanik, A. Comparison of design of experiments via traditional and Taguchi method. J. Adv. Manuf. Syst. 2016, 15, 151–160. [Google Scholar] [CrossRef] [Scilit]
- Prabhu, S.; Kumar, P.A.; Selwinston, A.; Taduvai, P.; Bairi, S.; Batra, R. Enhancing experimental efficiency in materials design: A comparative study of Taguchi and machine learning methods. arXiv 2025, arXiv:2506.03910. [Google Scholar]
- Hai, T.; Basem, A.; Alizadeh, A.; Sharma, K.; Jasim, D.J.; Rajab, H.; Ahmed, M.; Kassim, M.; Singh, N.S.S.; Maleki, H. Optimizing Gaussian process regression (GPR) hyperparameters with three metaheuristic algorithms for viscosity prediction of suspensions containing microencapsulated PCMs. Sci. Rep. 2024, 14, 20271. [Google Scholar] [CrossRef] [Scilit] [PubMed]
- Cao, Y.; Li, X.; Song, Z. Grams: Gradient descent with adaptive momentum scaling. arXiv 2024, arXiv:17107. [Google Scholar]
- da Silva, L.R.R.; Pimenov, D.Y.; da Silva, R.B.; Ercetin, A.; Giasin, K. Review of applications of digital twins and Industry 4.0 for machining. J. Manuf. Mater. Process. 2025, 9, 211. [Google Scholar] [CrossRef] [Scilit]
- Afif, M.F.; Sarhan, A.A.D. Computer-aided process planning, digital twin, and smart manufacturing: Interconnections and integration in CNC machining processes. Int. J. Prod. Res. 2025, 63, 9593–9632. [Google Scholar] [CrossRef] [Scilit]
- Ward, R.; Sun, C.; Dominguez-Caballero, J.; Ojo, S.; Ayvar-Soberanis, S.; Curtis, D.; Ozturk, E. Machining digital twin using real-time model-based simulations and lookahead function for closed loop machining control. Int. J. Adv. Manuf. Technol. 2021, 117, 3615–3629. [Google Scholar] [CrossRef] [Scilit]
- Fu, X.; Song, H.; Li, S.; Lu, Y. Digital twin technology in modern machining: A comprehensive review of research on machining errors. J. Manuf. Syst. 2025, 79, 134–161. [Google Scholar] [CrossRef] [Scilit]
- Abaza, B.F.; Gheorghita, V. Artificial neural network framework for hybrid control and monitoring in turning operations. Appl. Sci. 2025, 15, 3499. [Google Scholar] [CrossRef] [Scilit]
- Pan, Z.; Feng, Y.; Ji, X.; Liang, S.Y. Turning induced residual stress prediction of AISI 4130 considering dynamic recrystallization. Mach. Sci. Technol. 2018, 22, 507–521. [Google Scholar] [CrossRef] [Scilit]
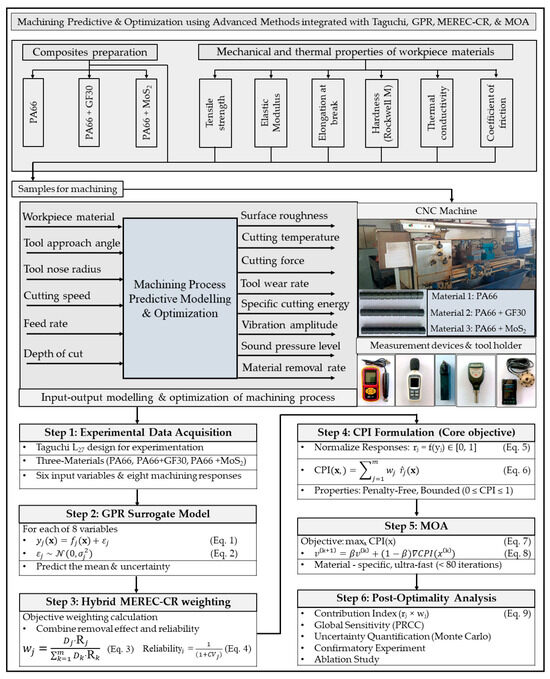
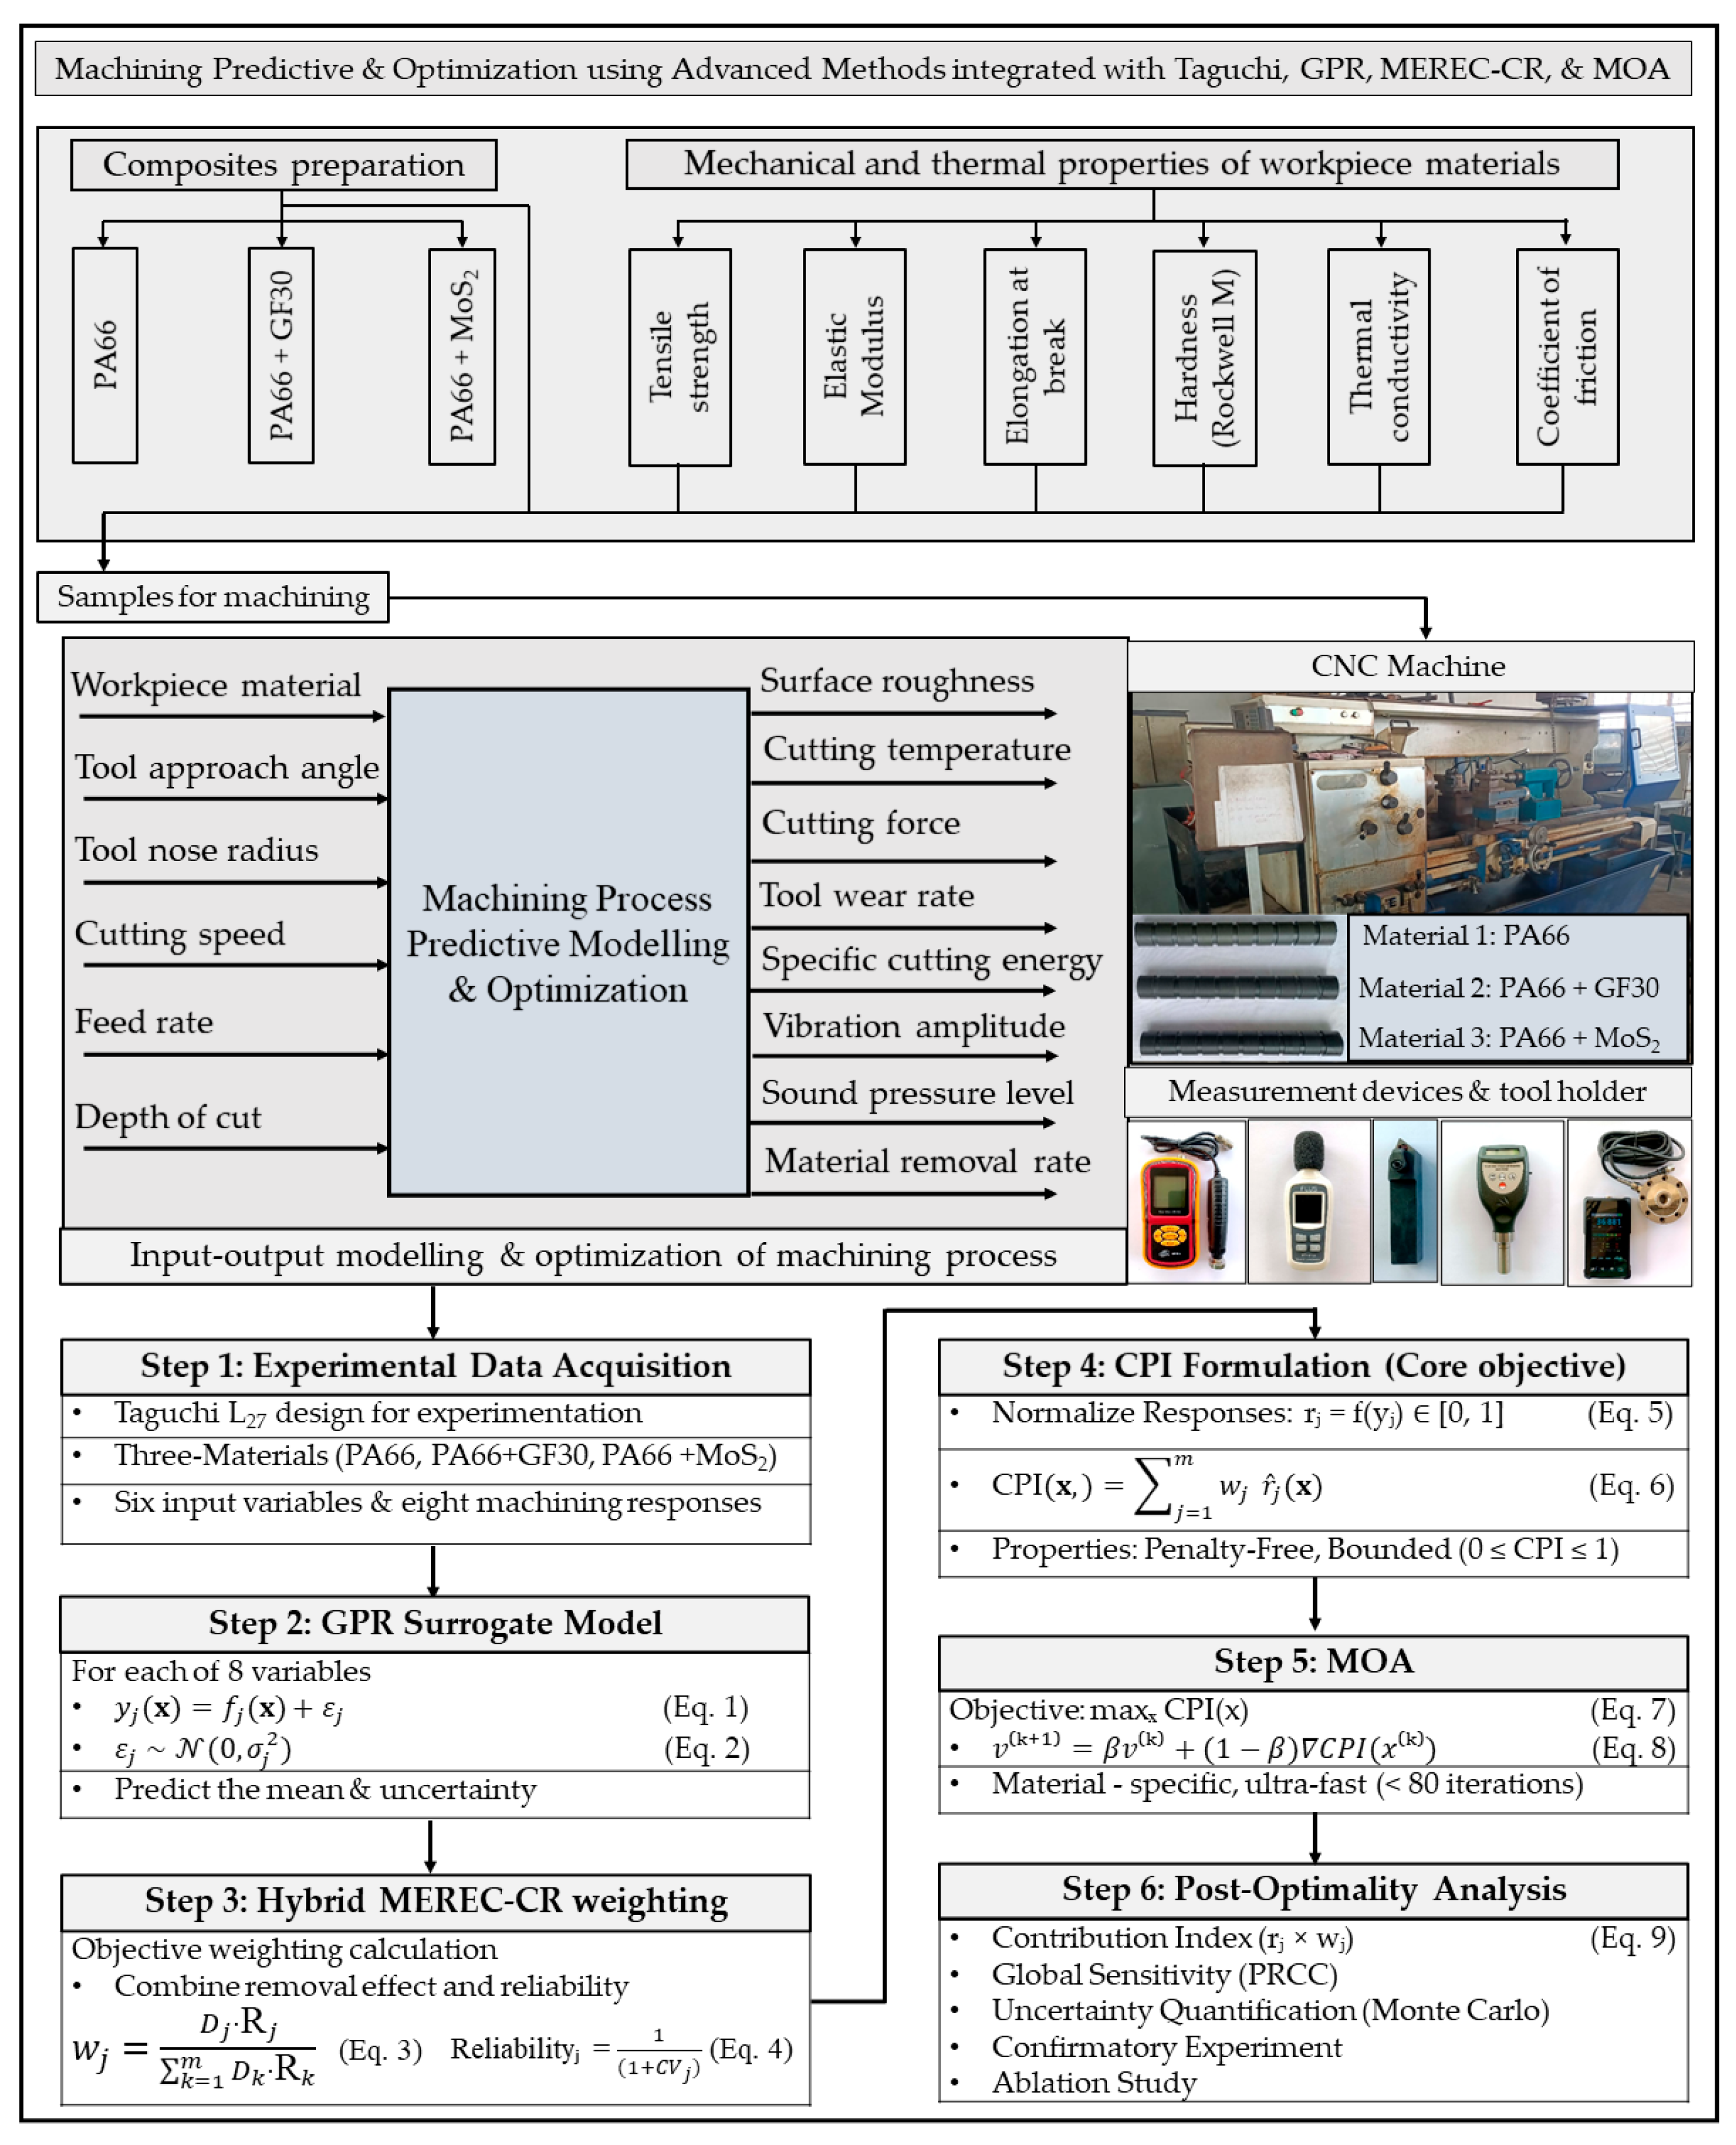
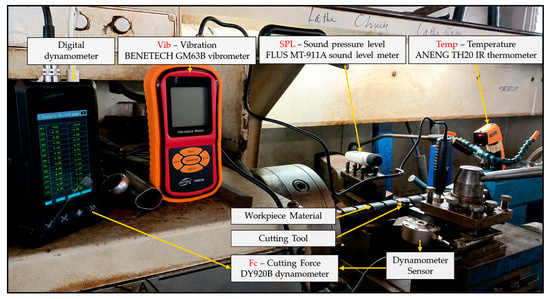
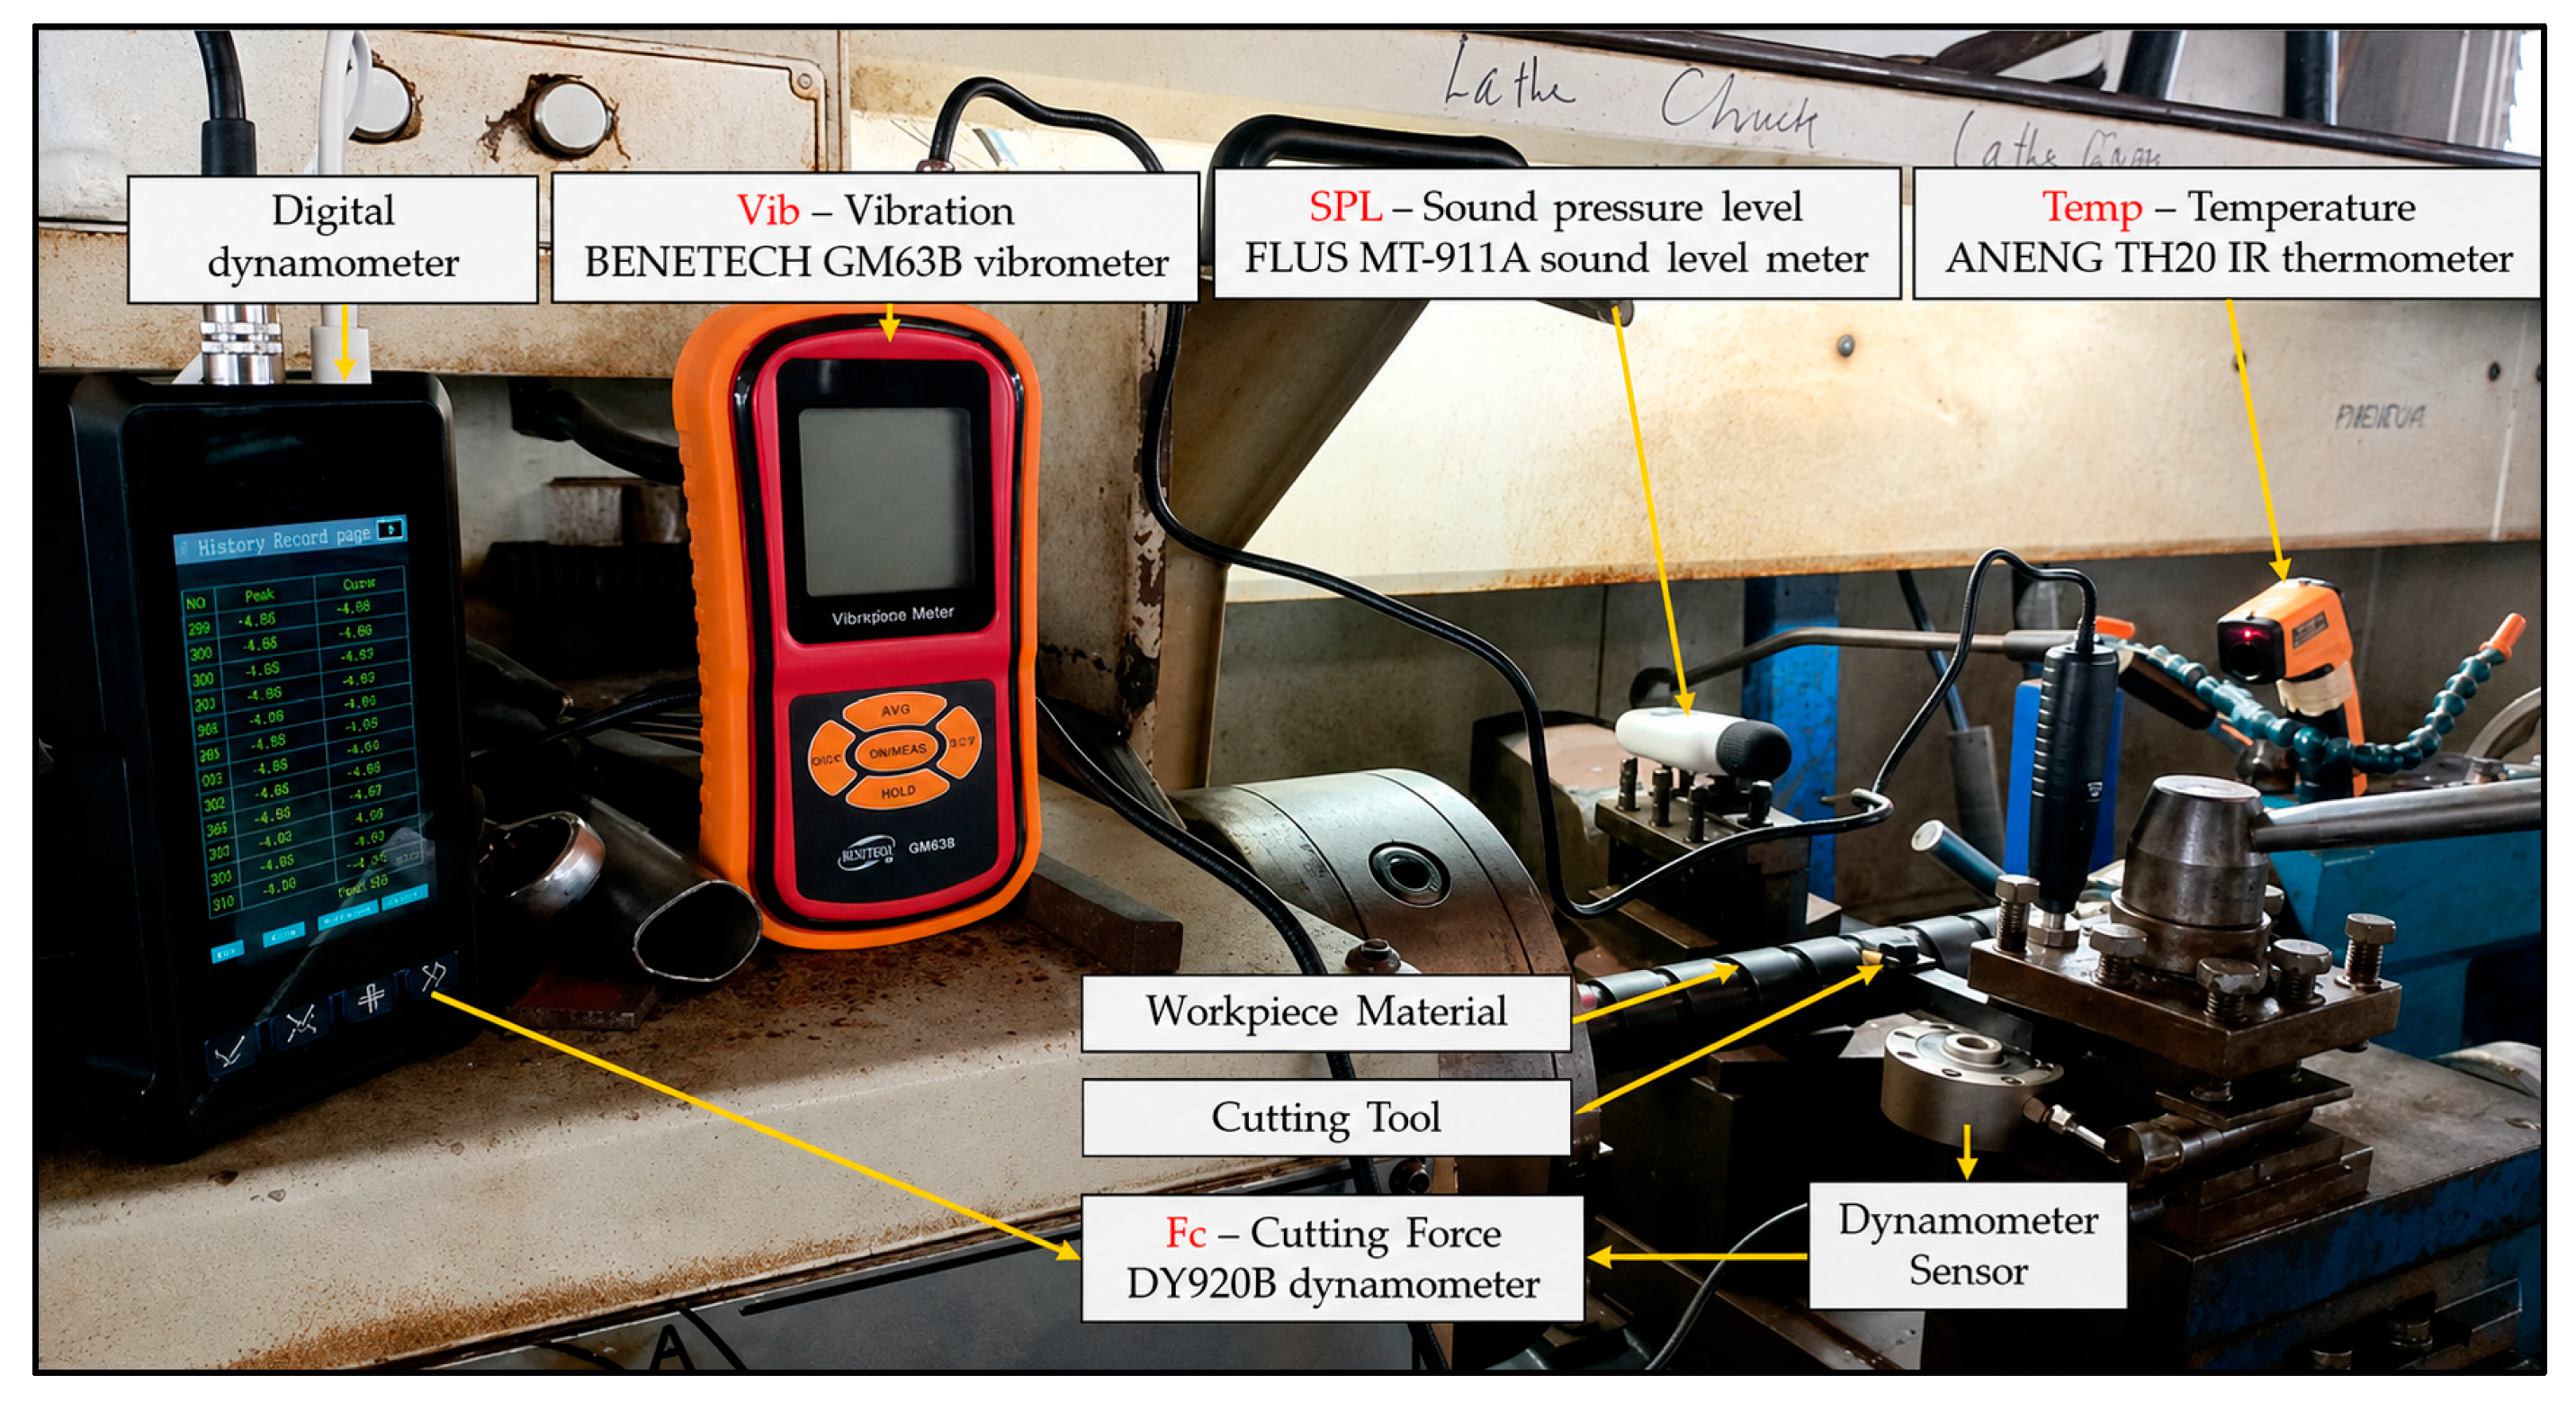
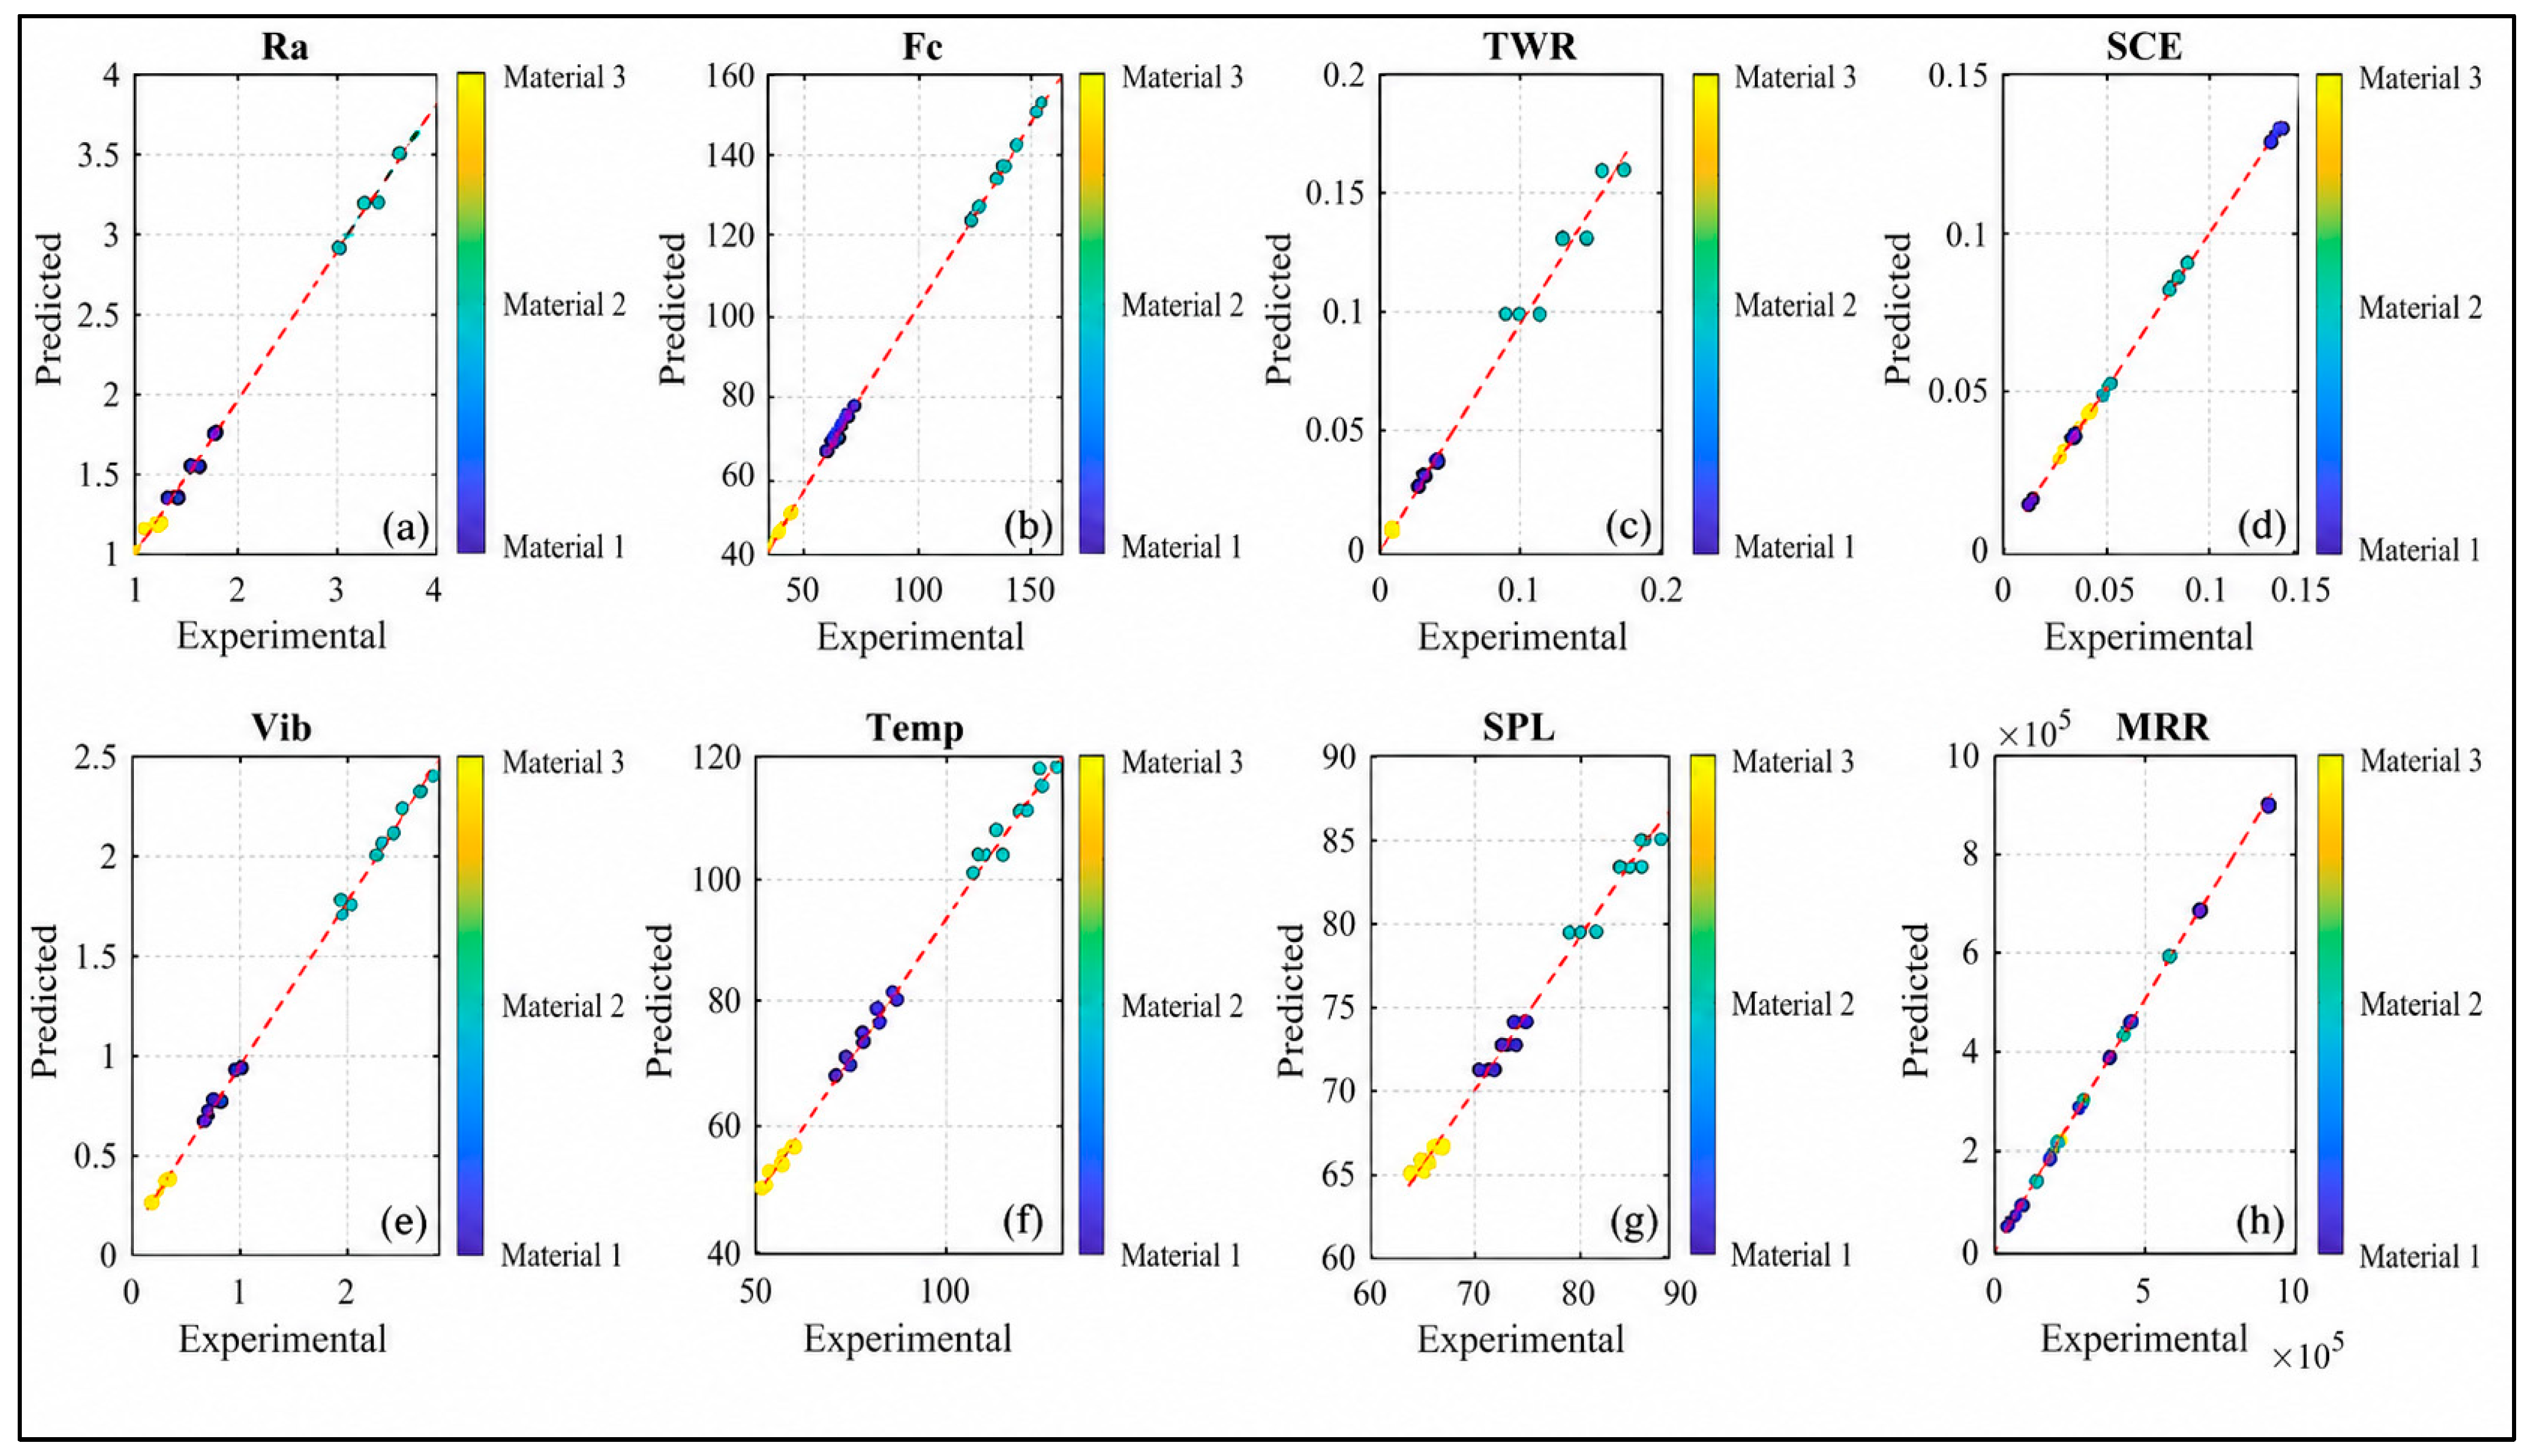
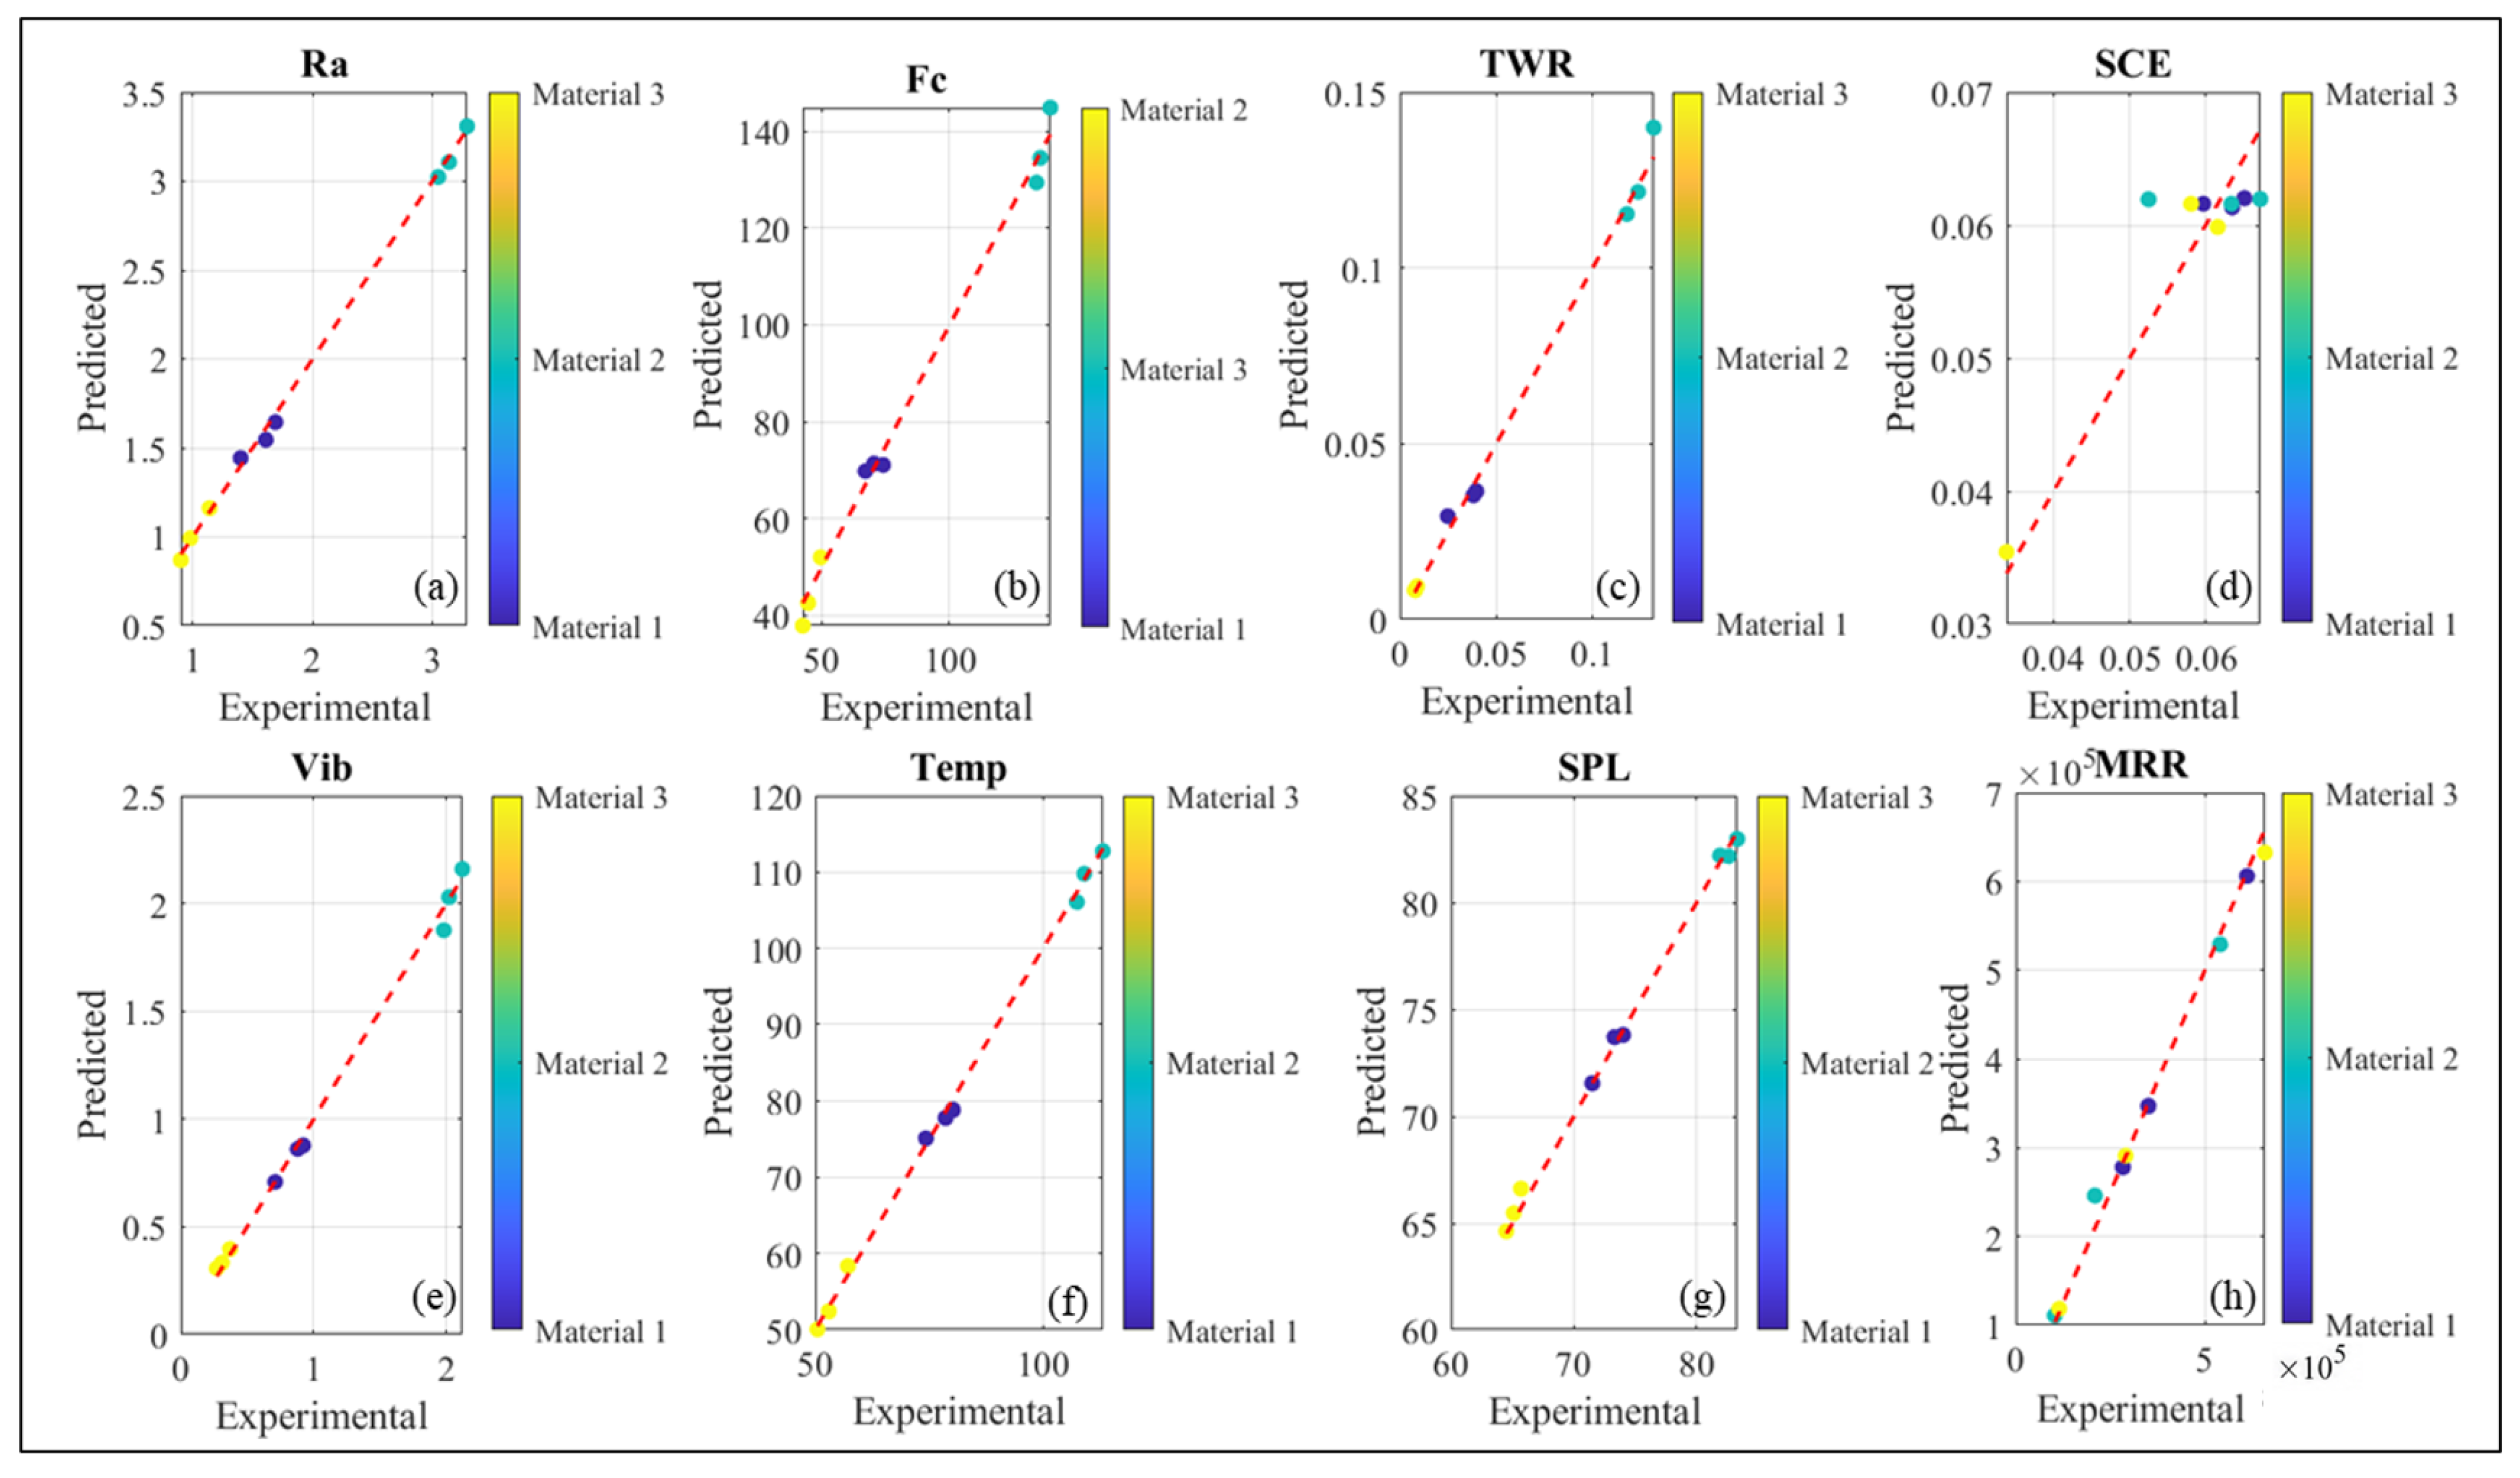
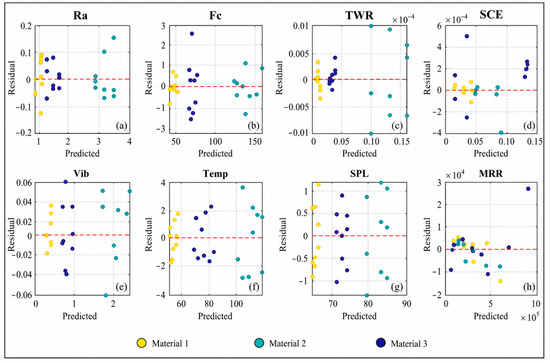
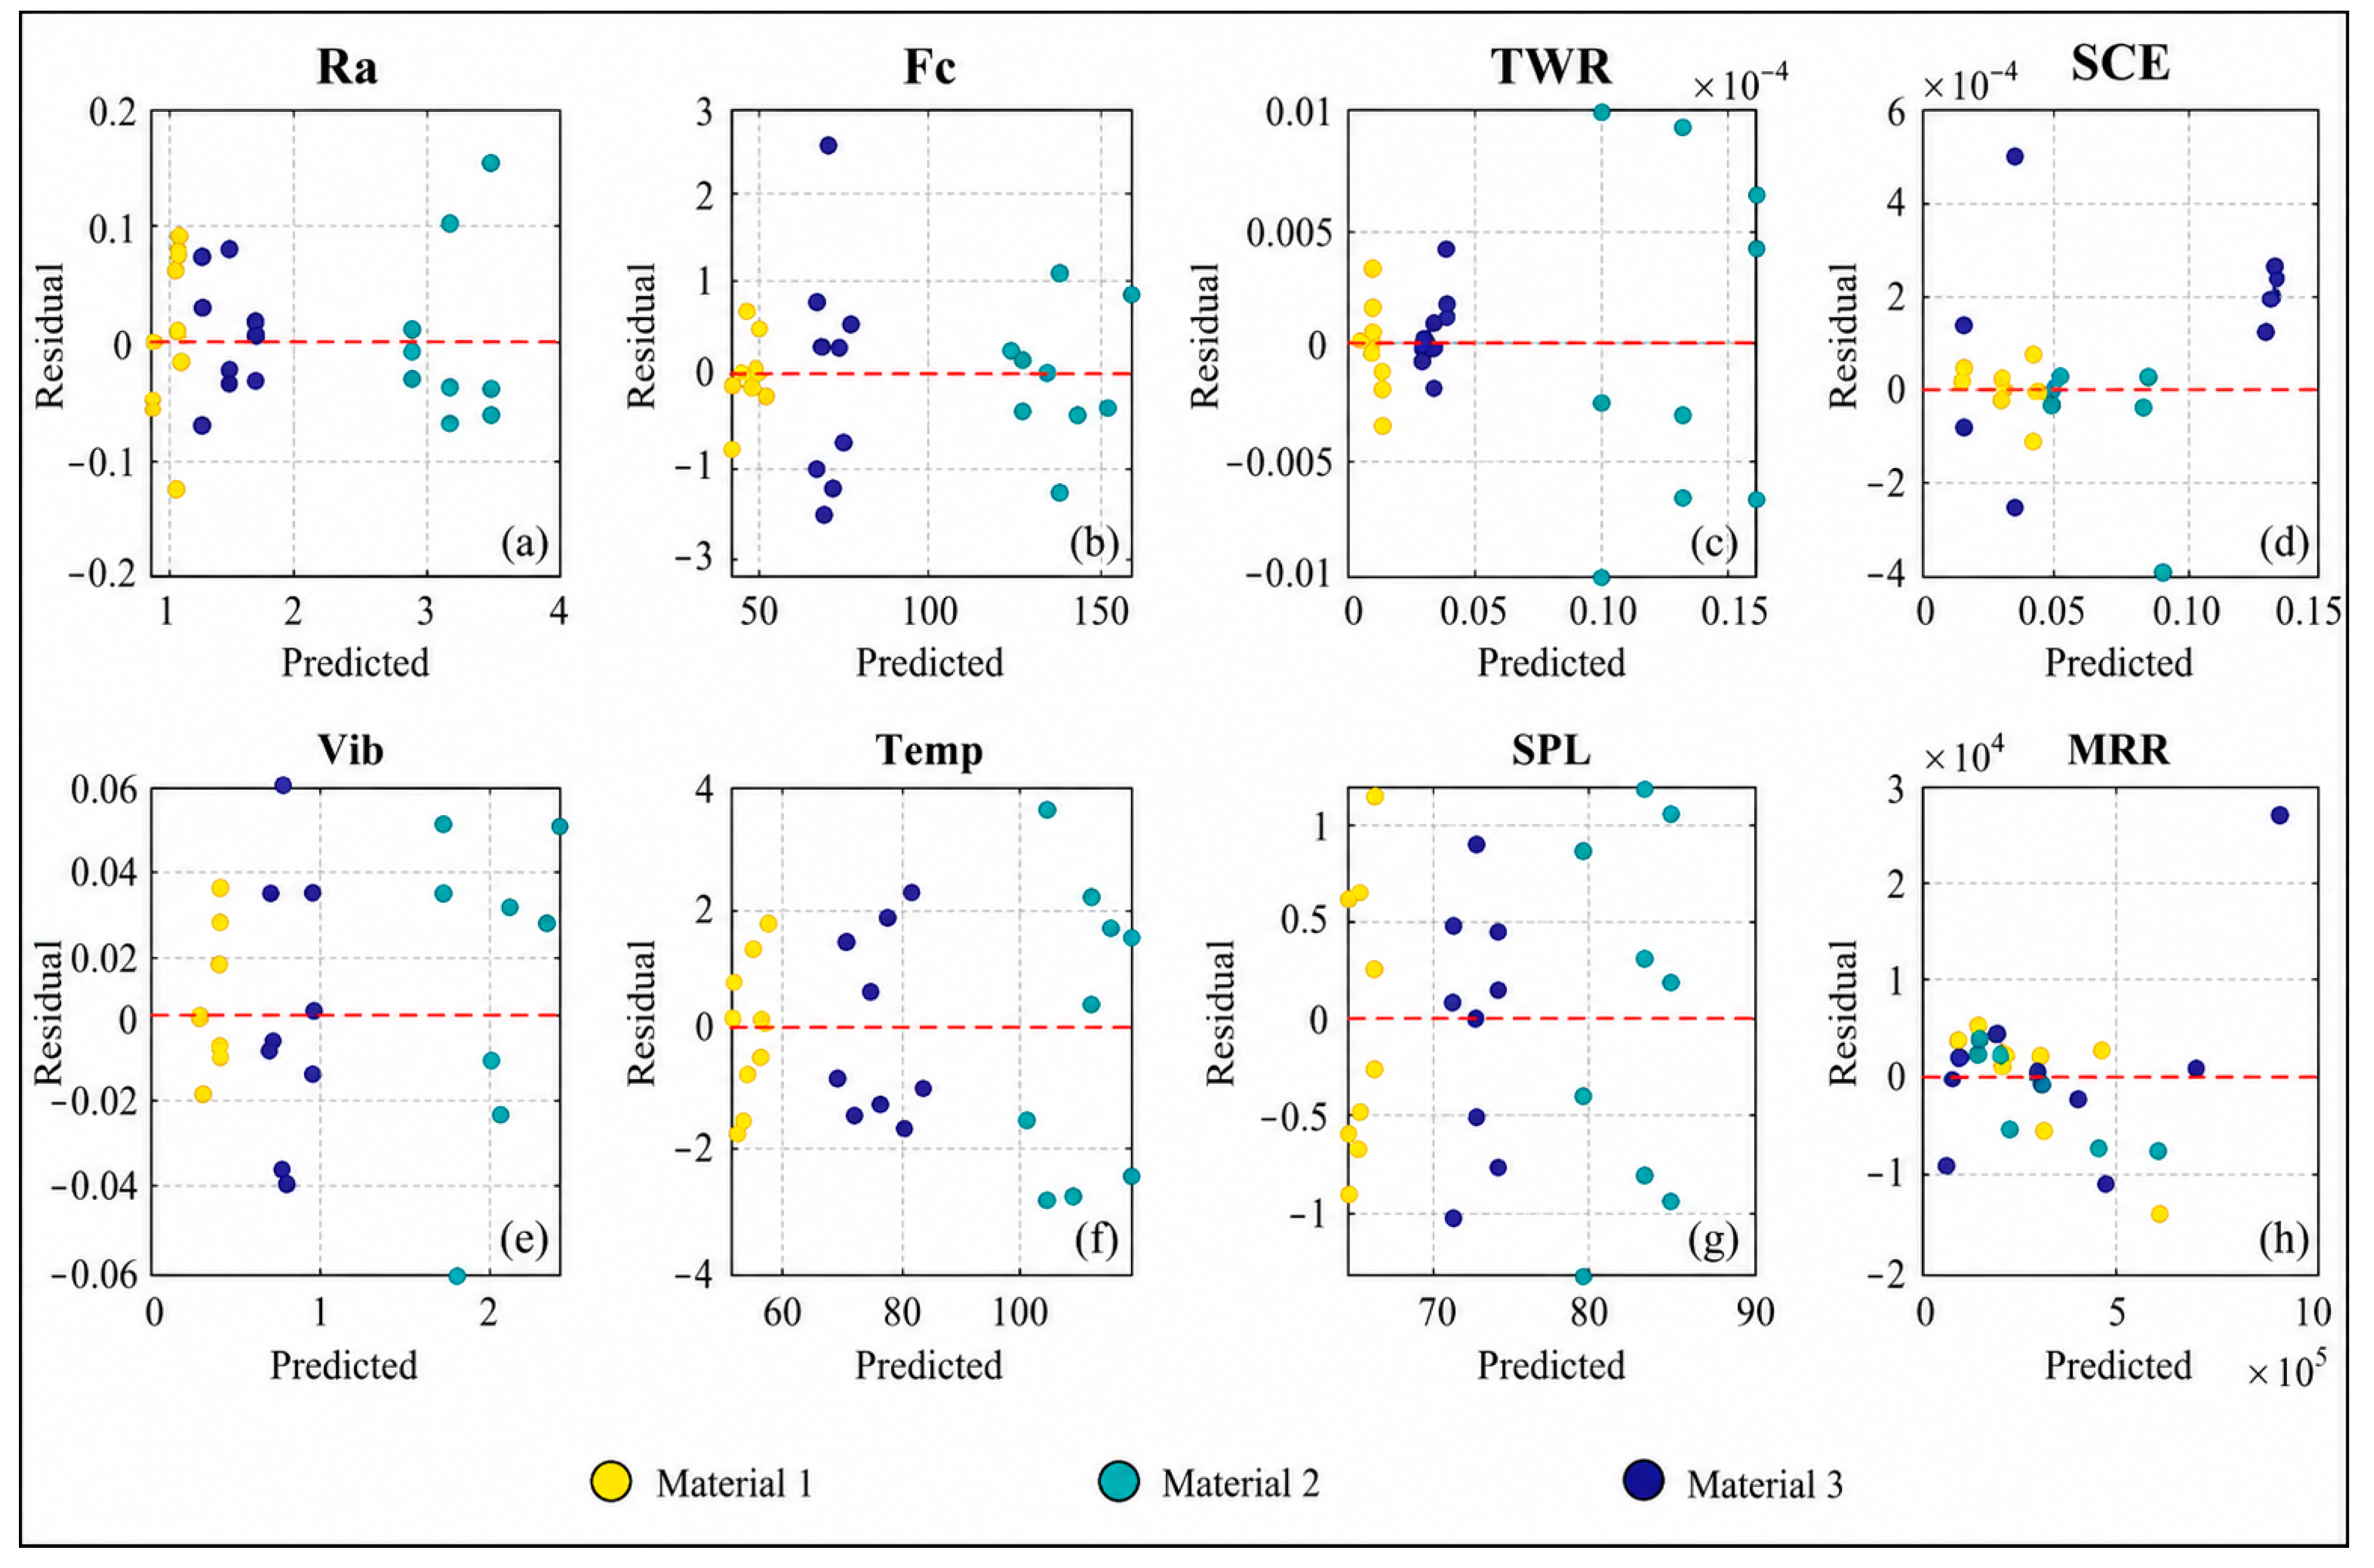
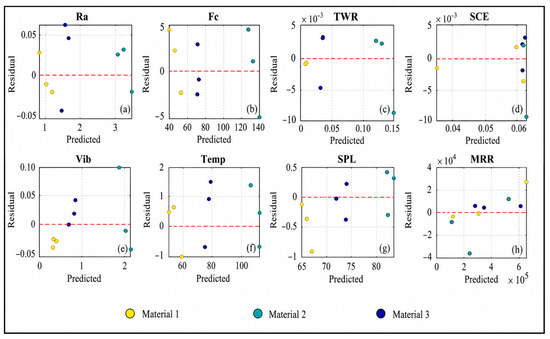
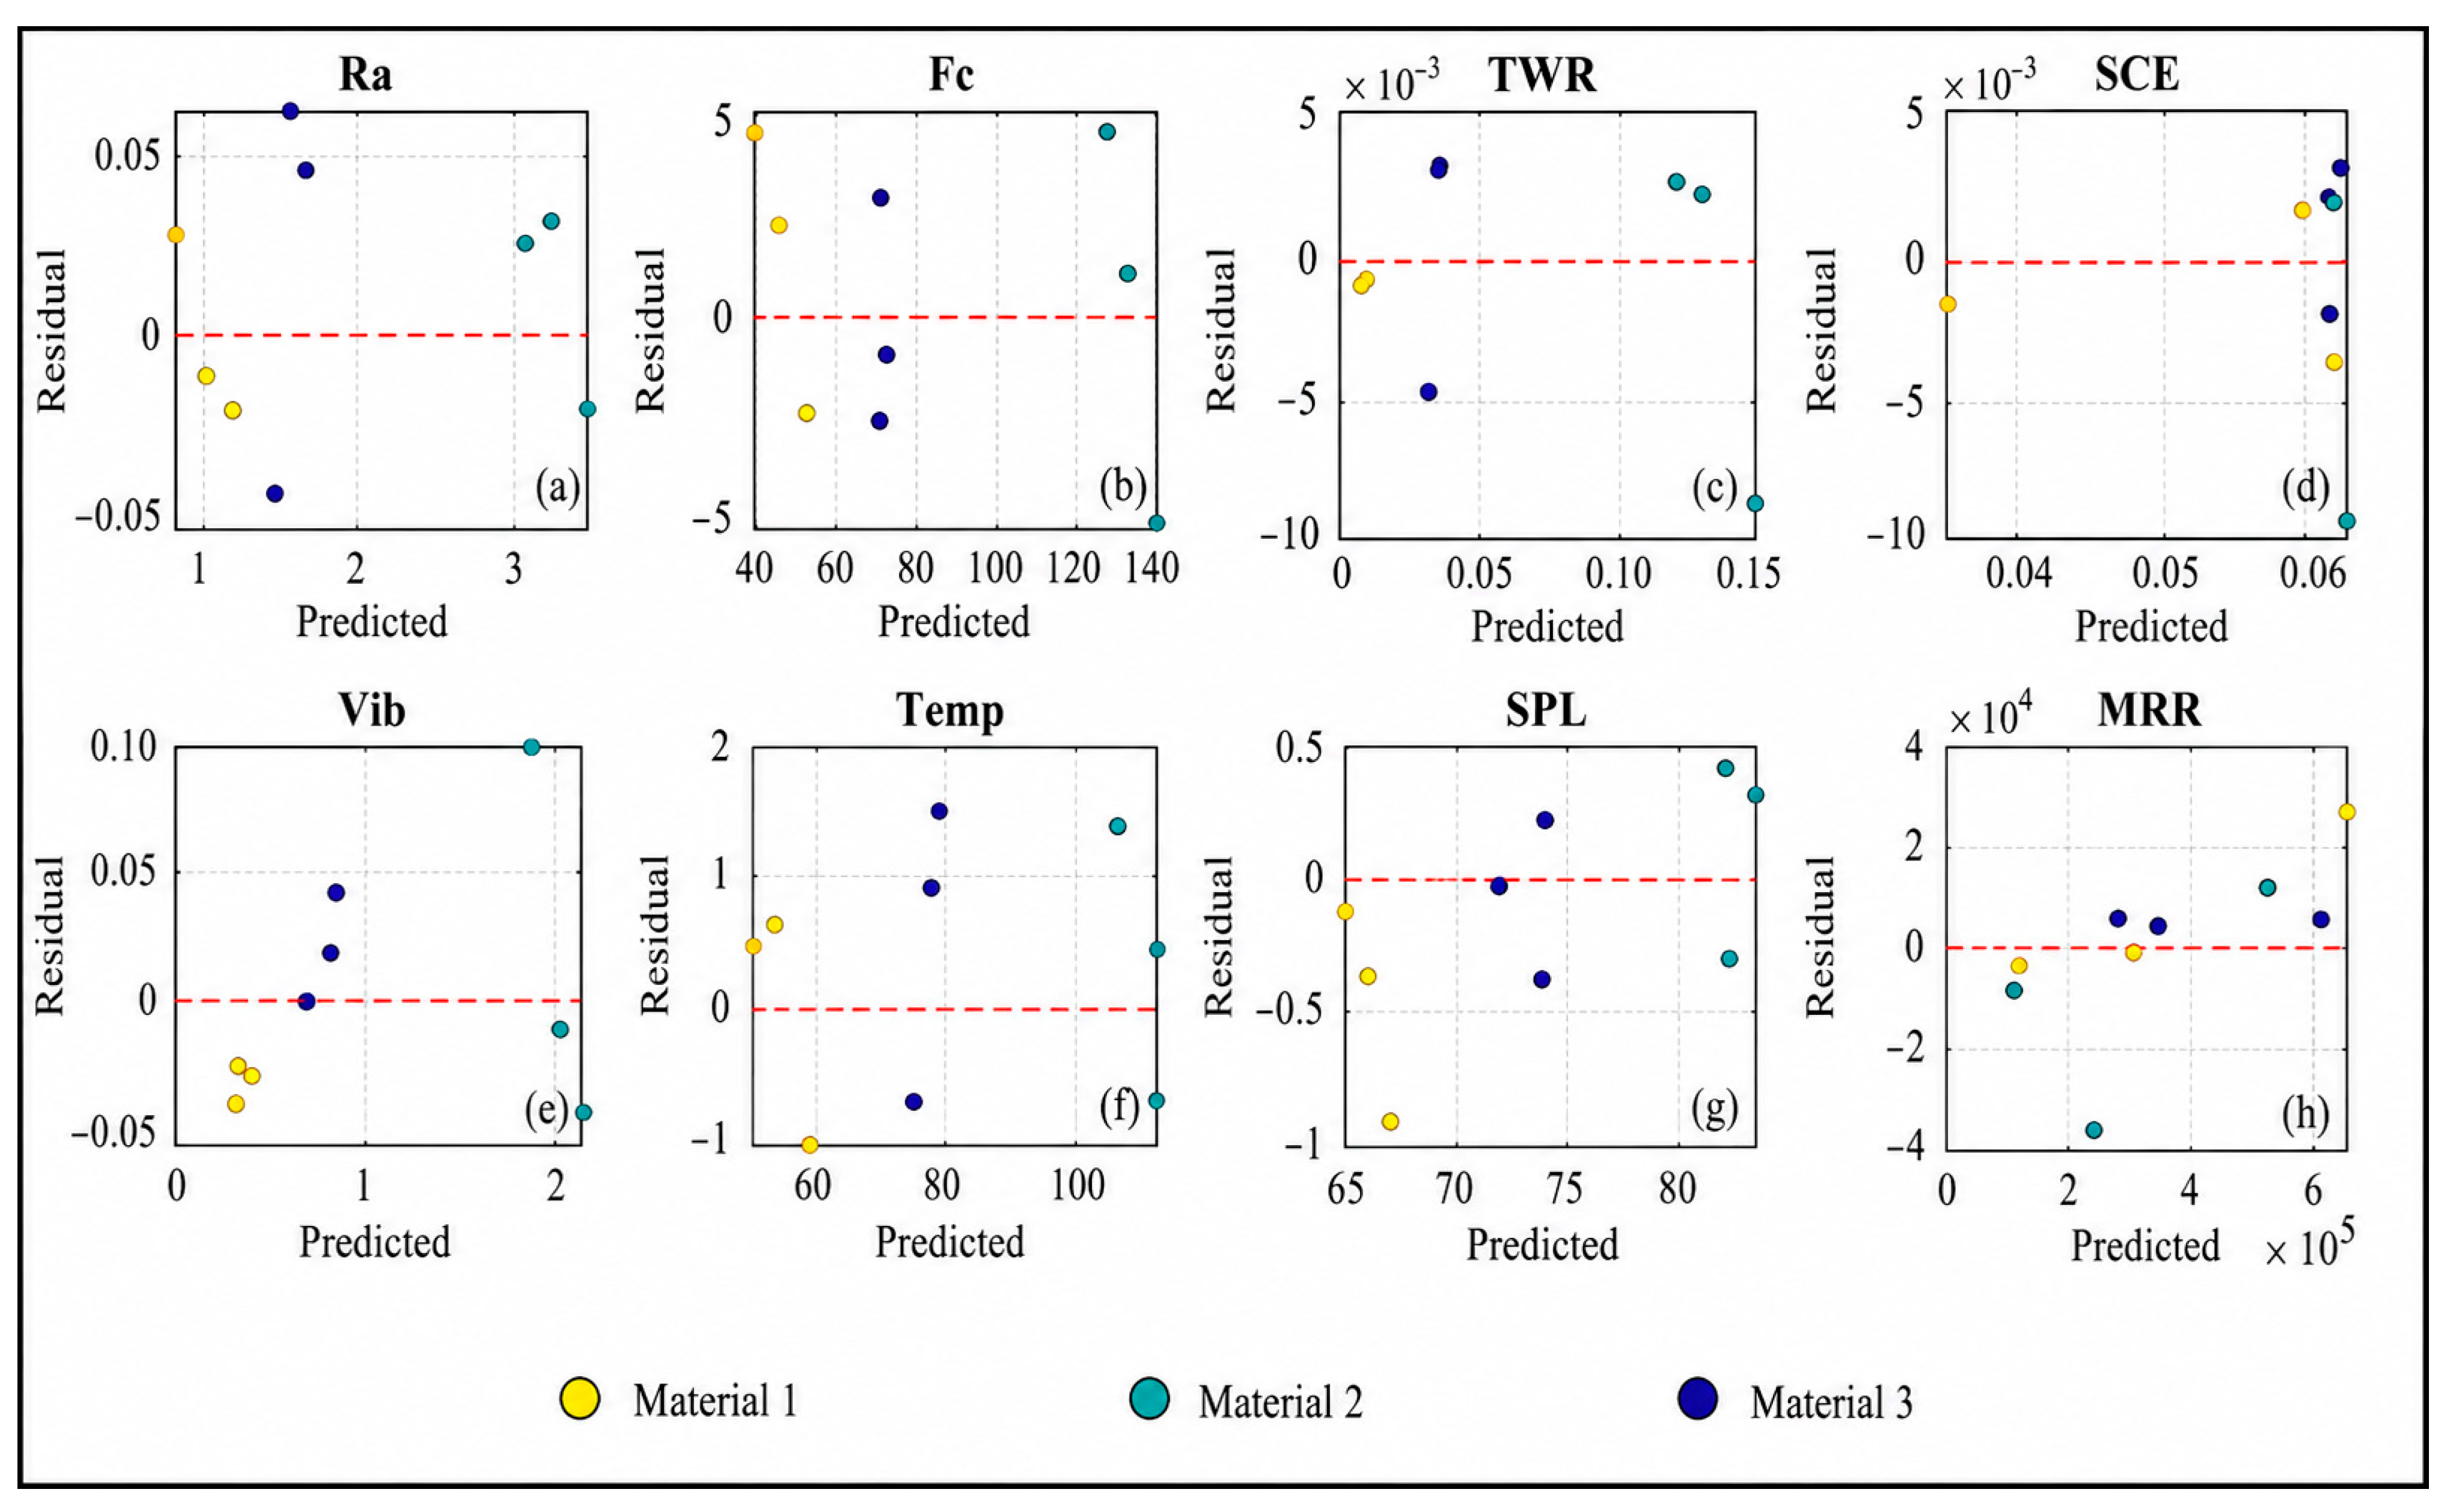
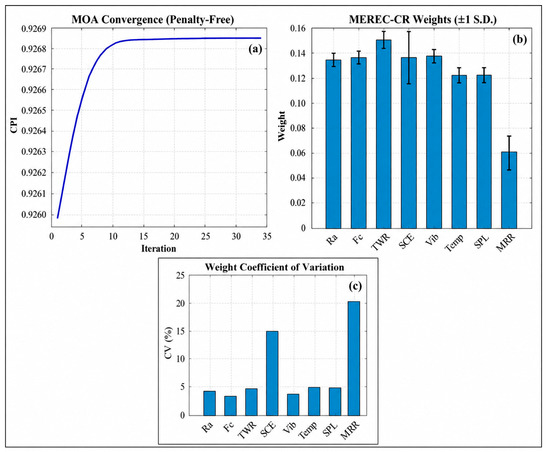
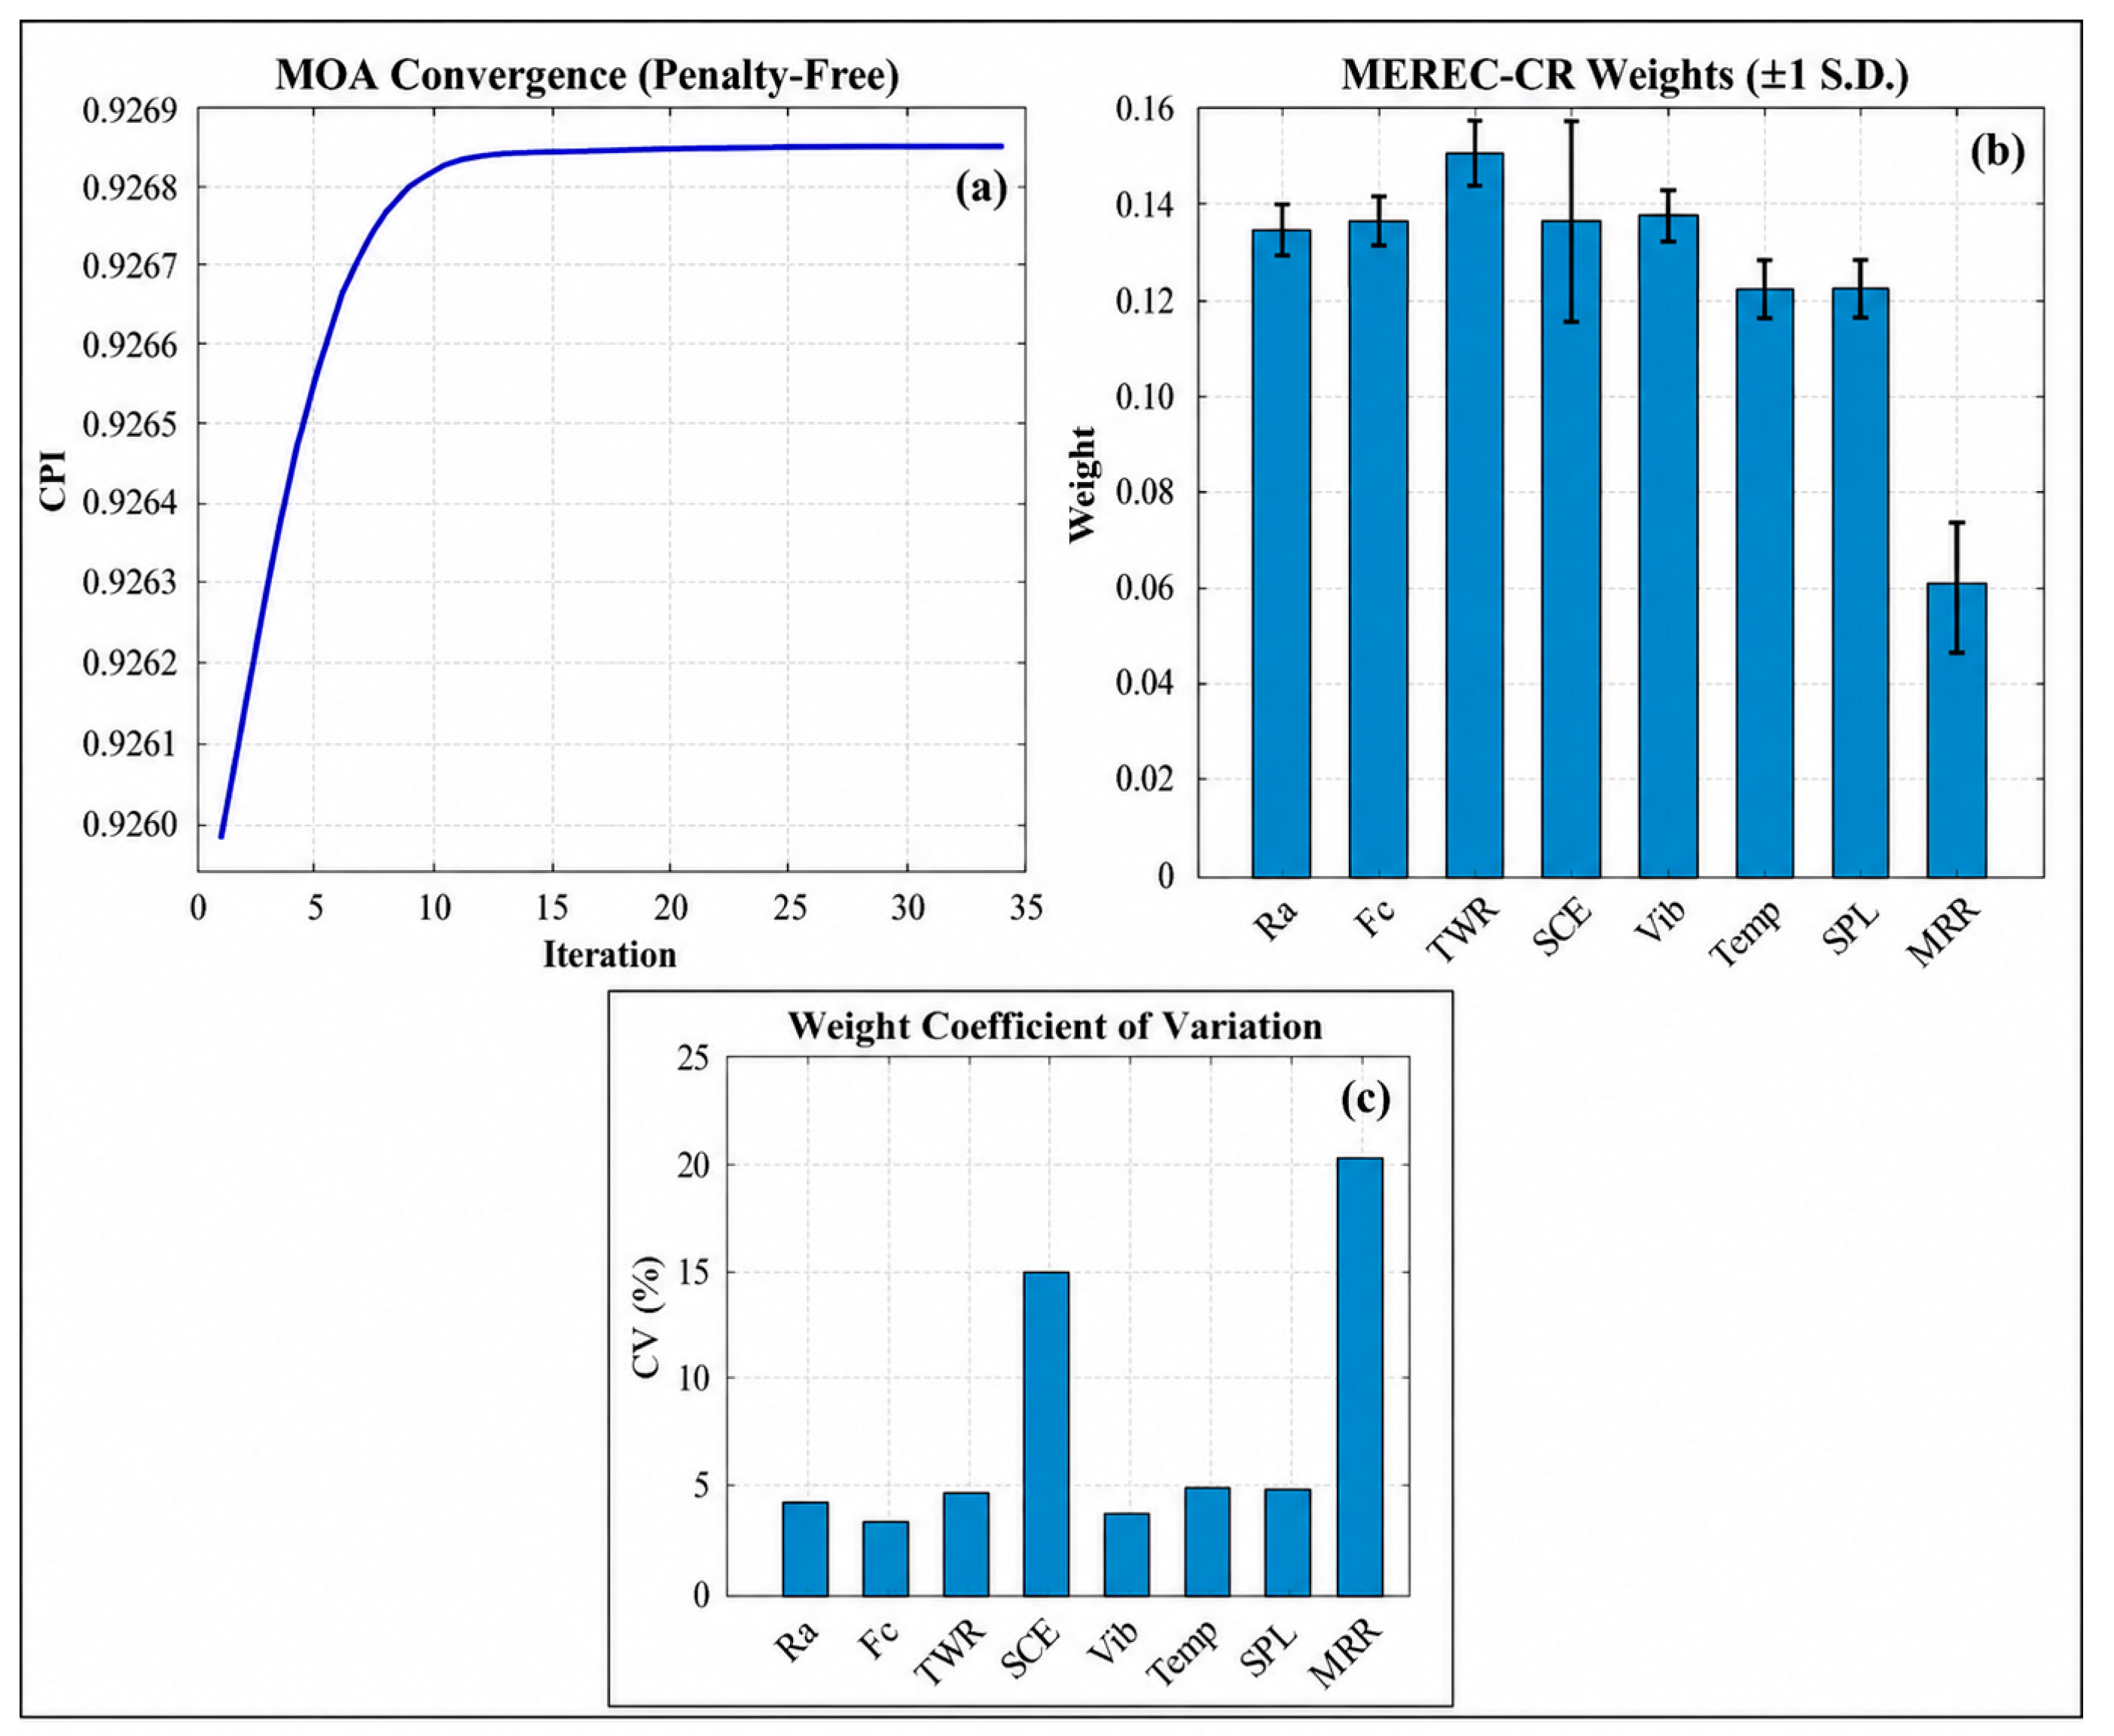
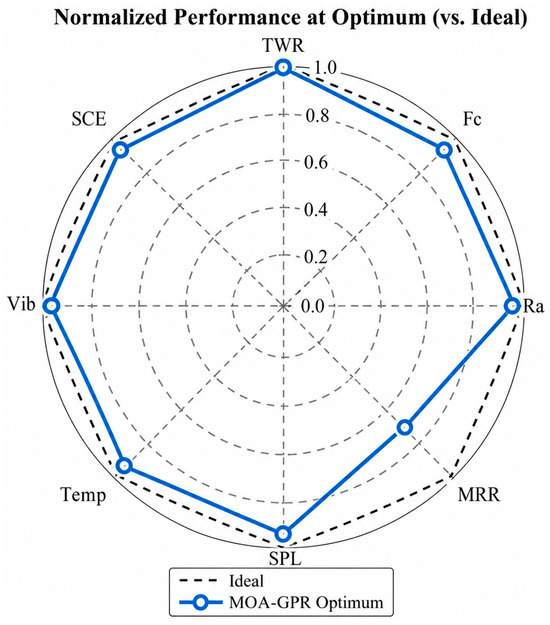
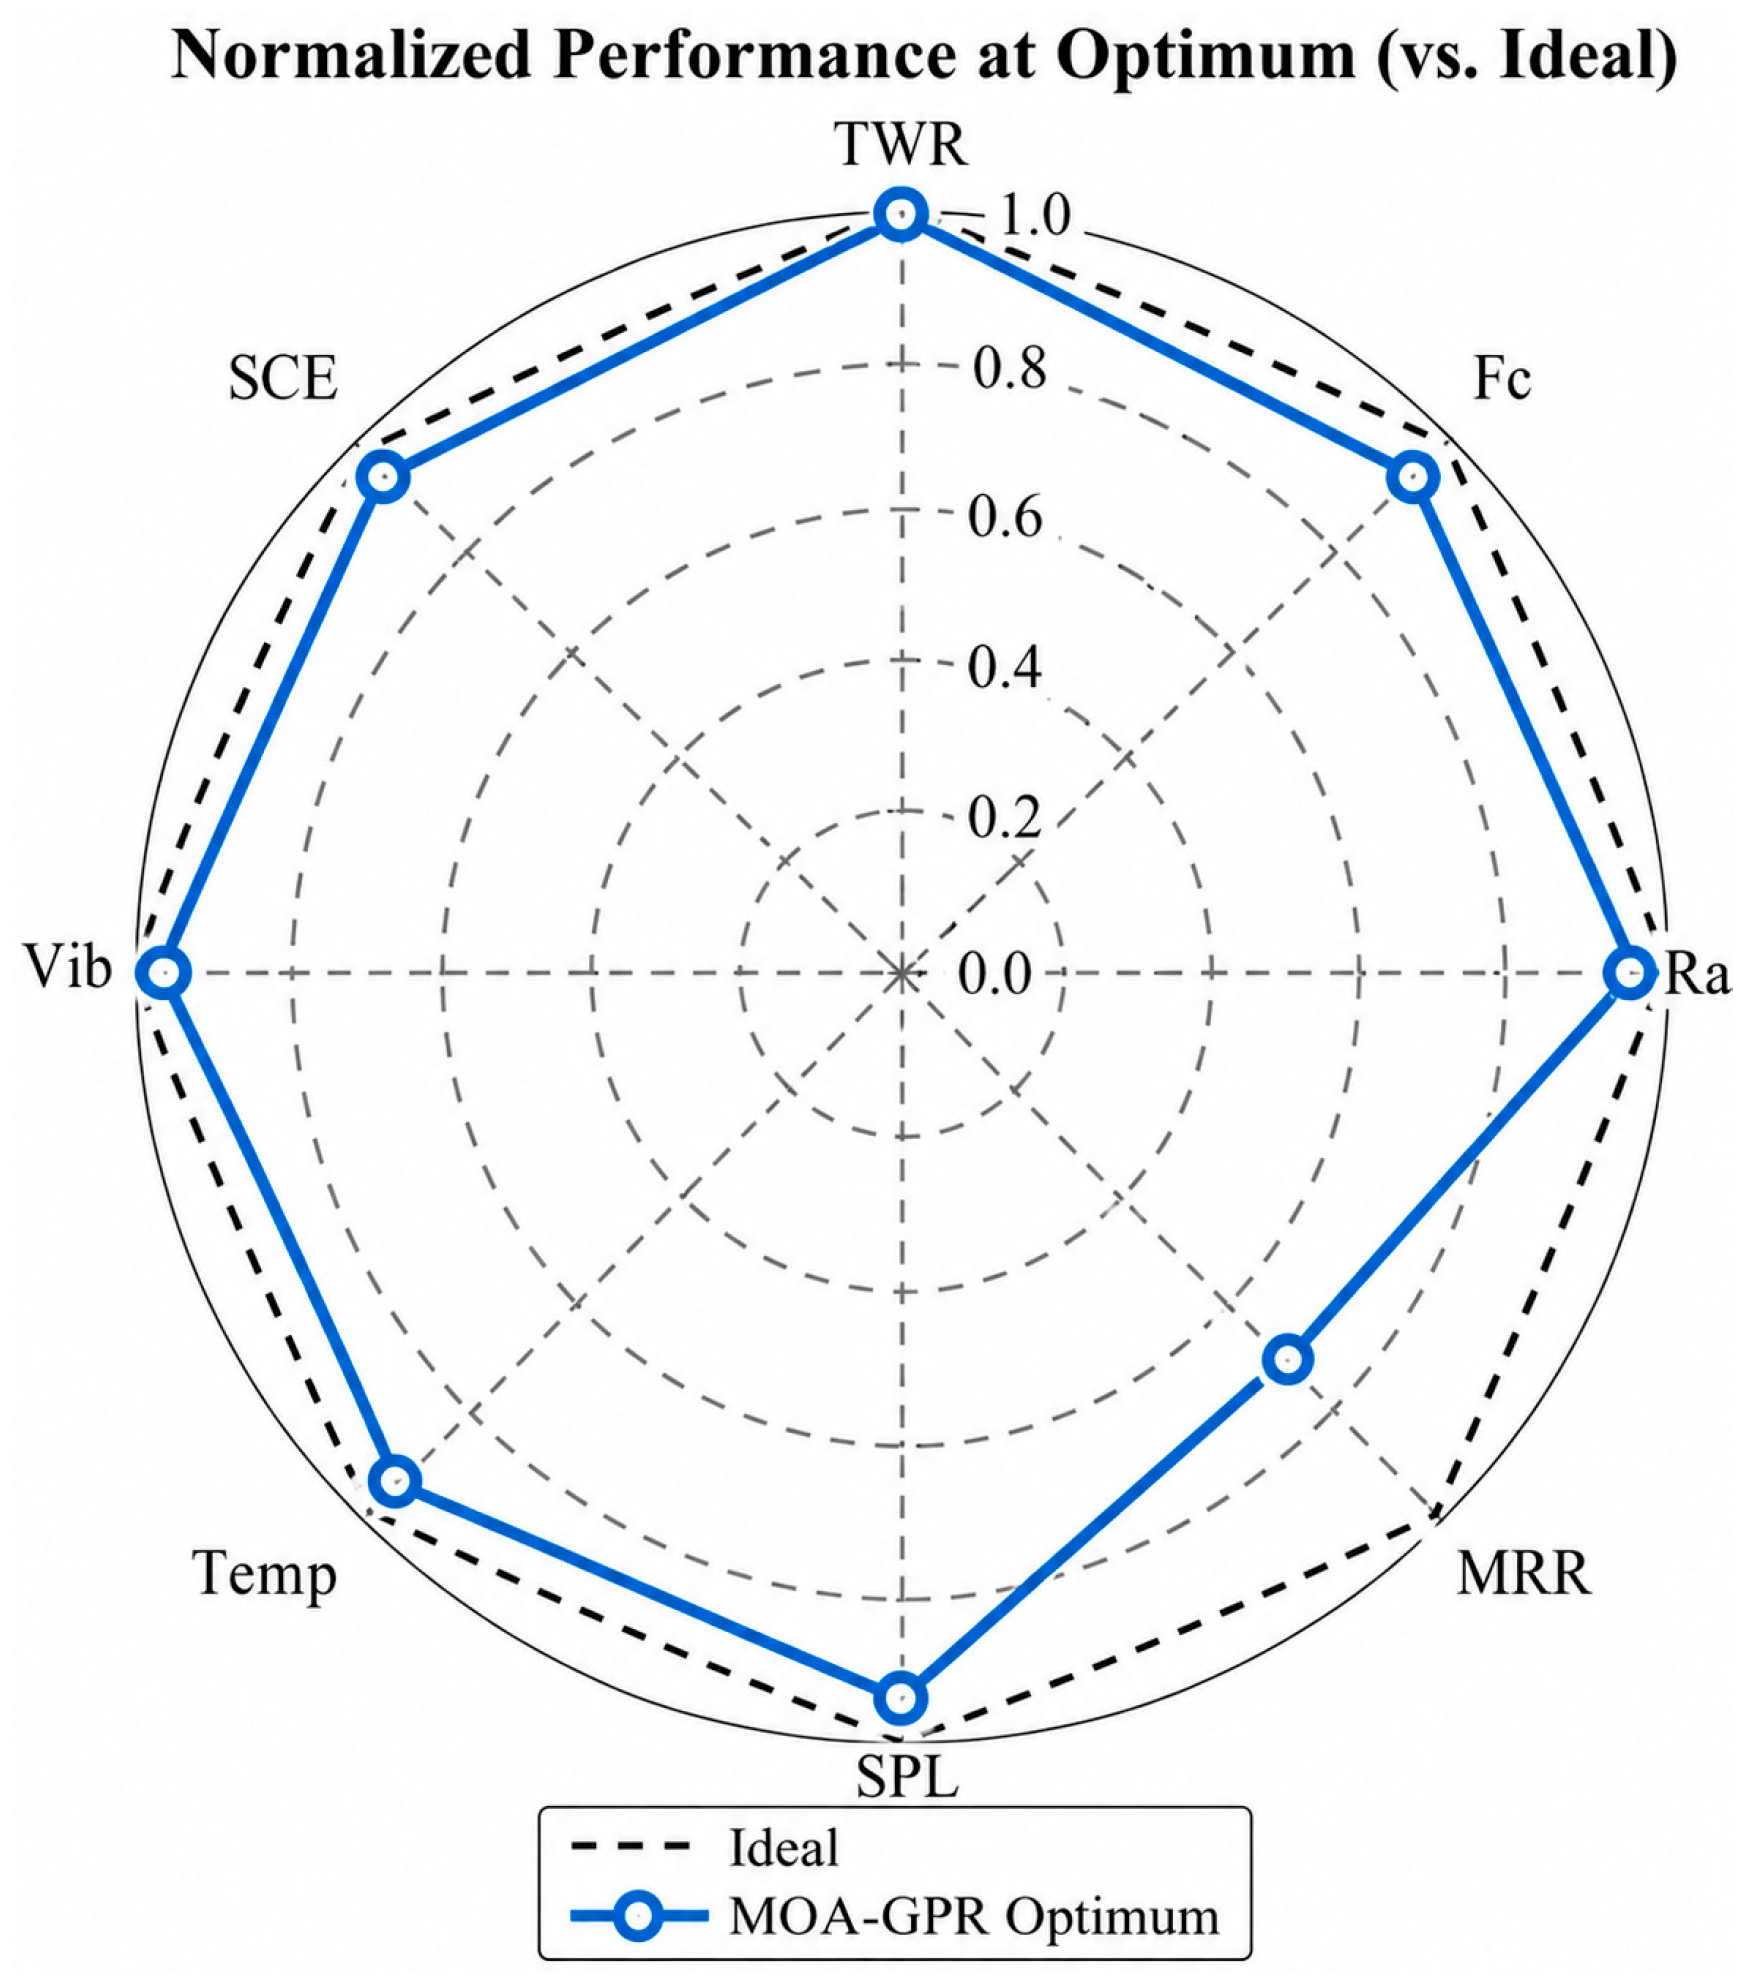
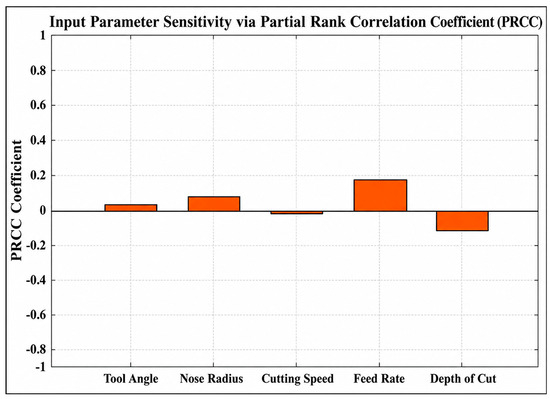
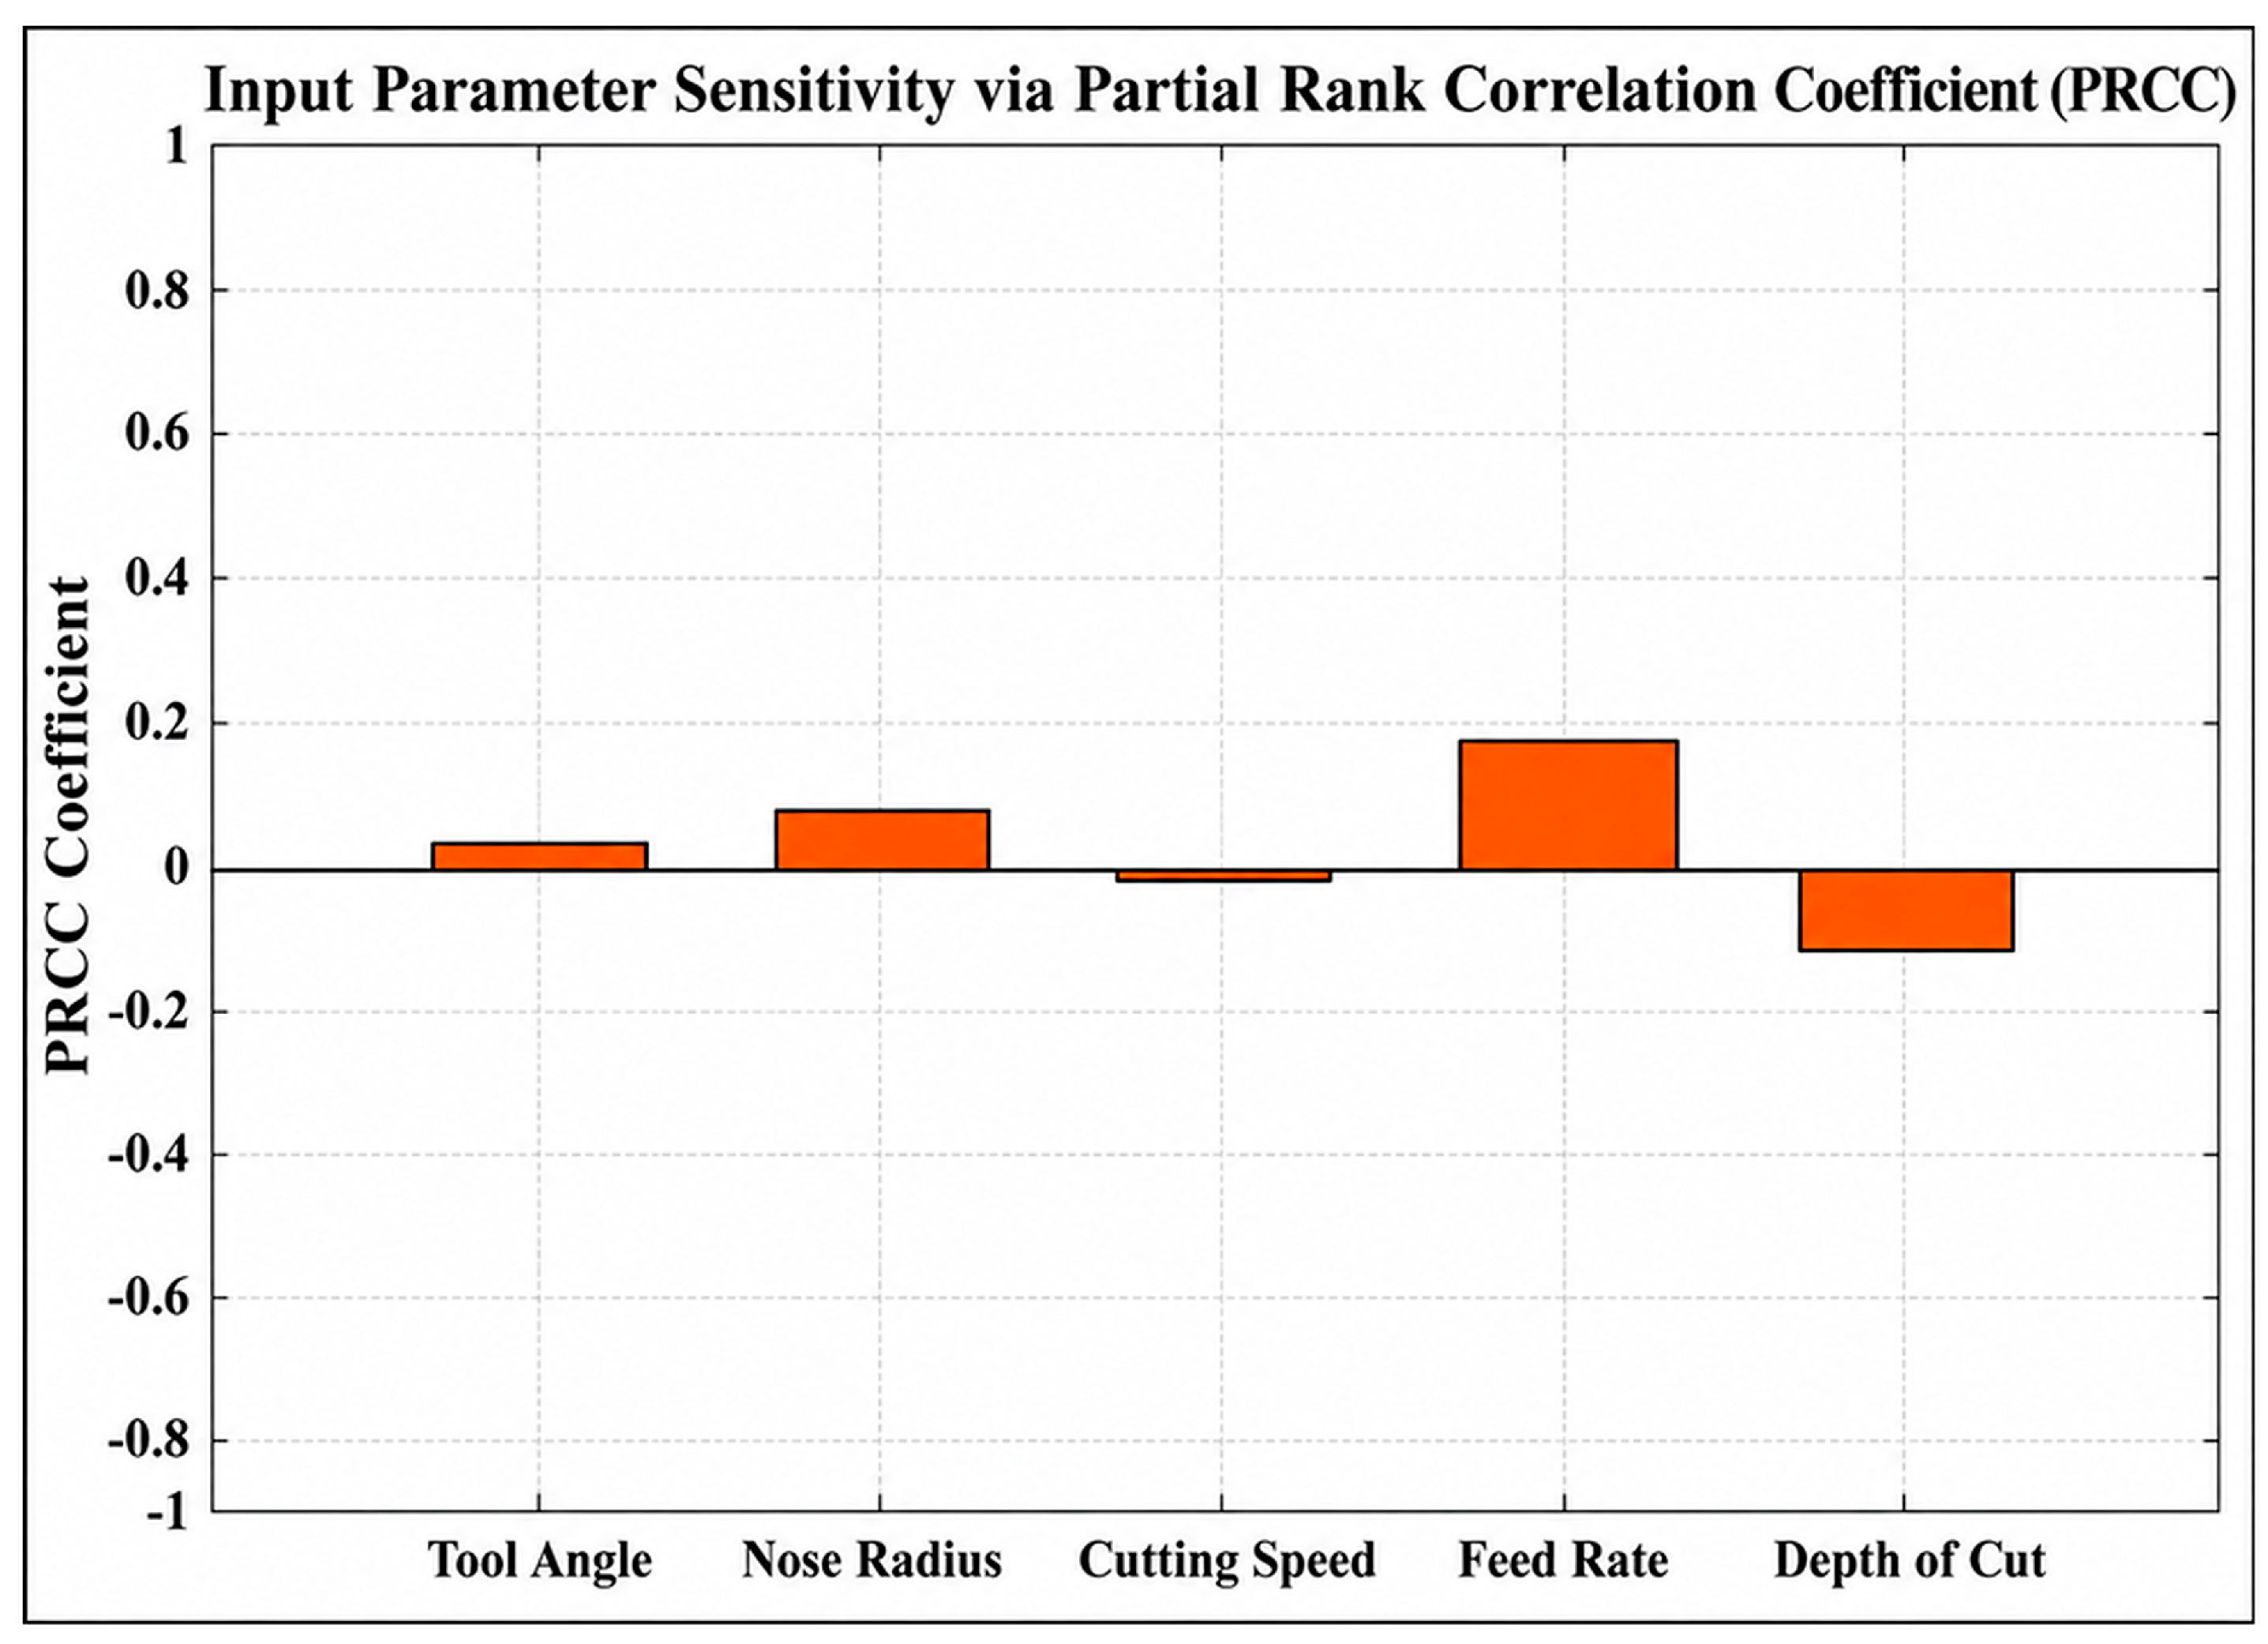
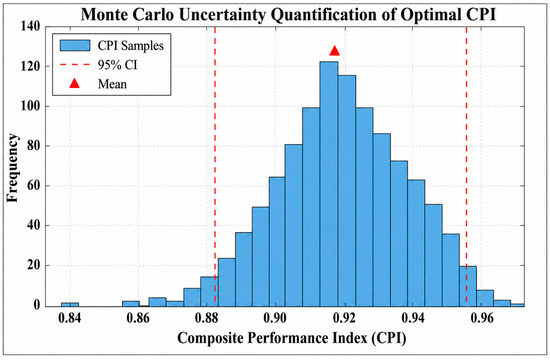
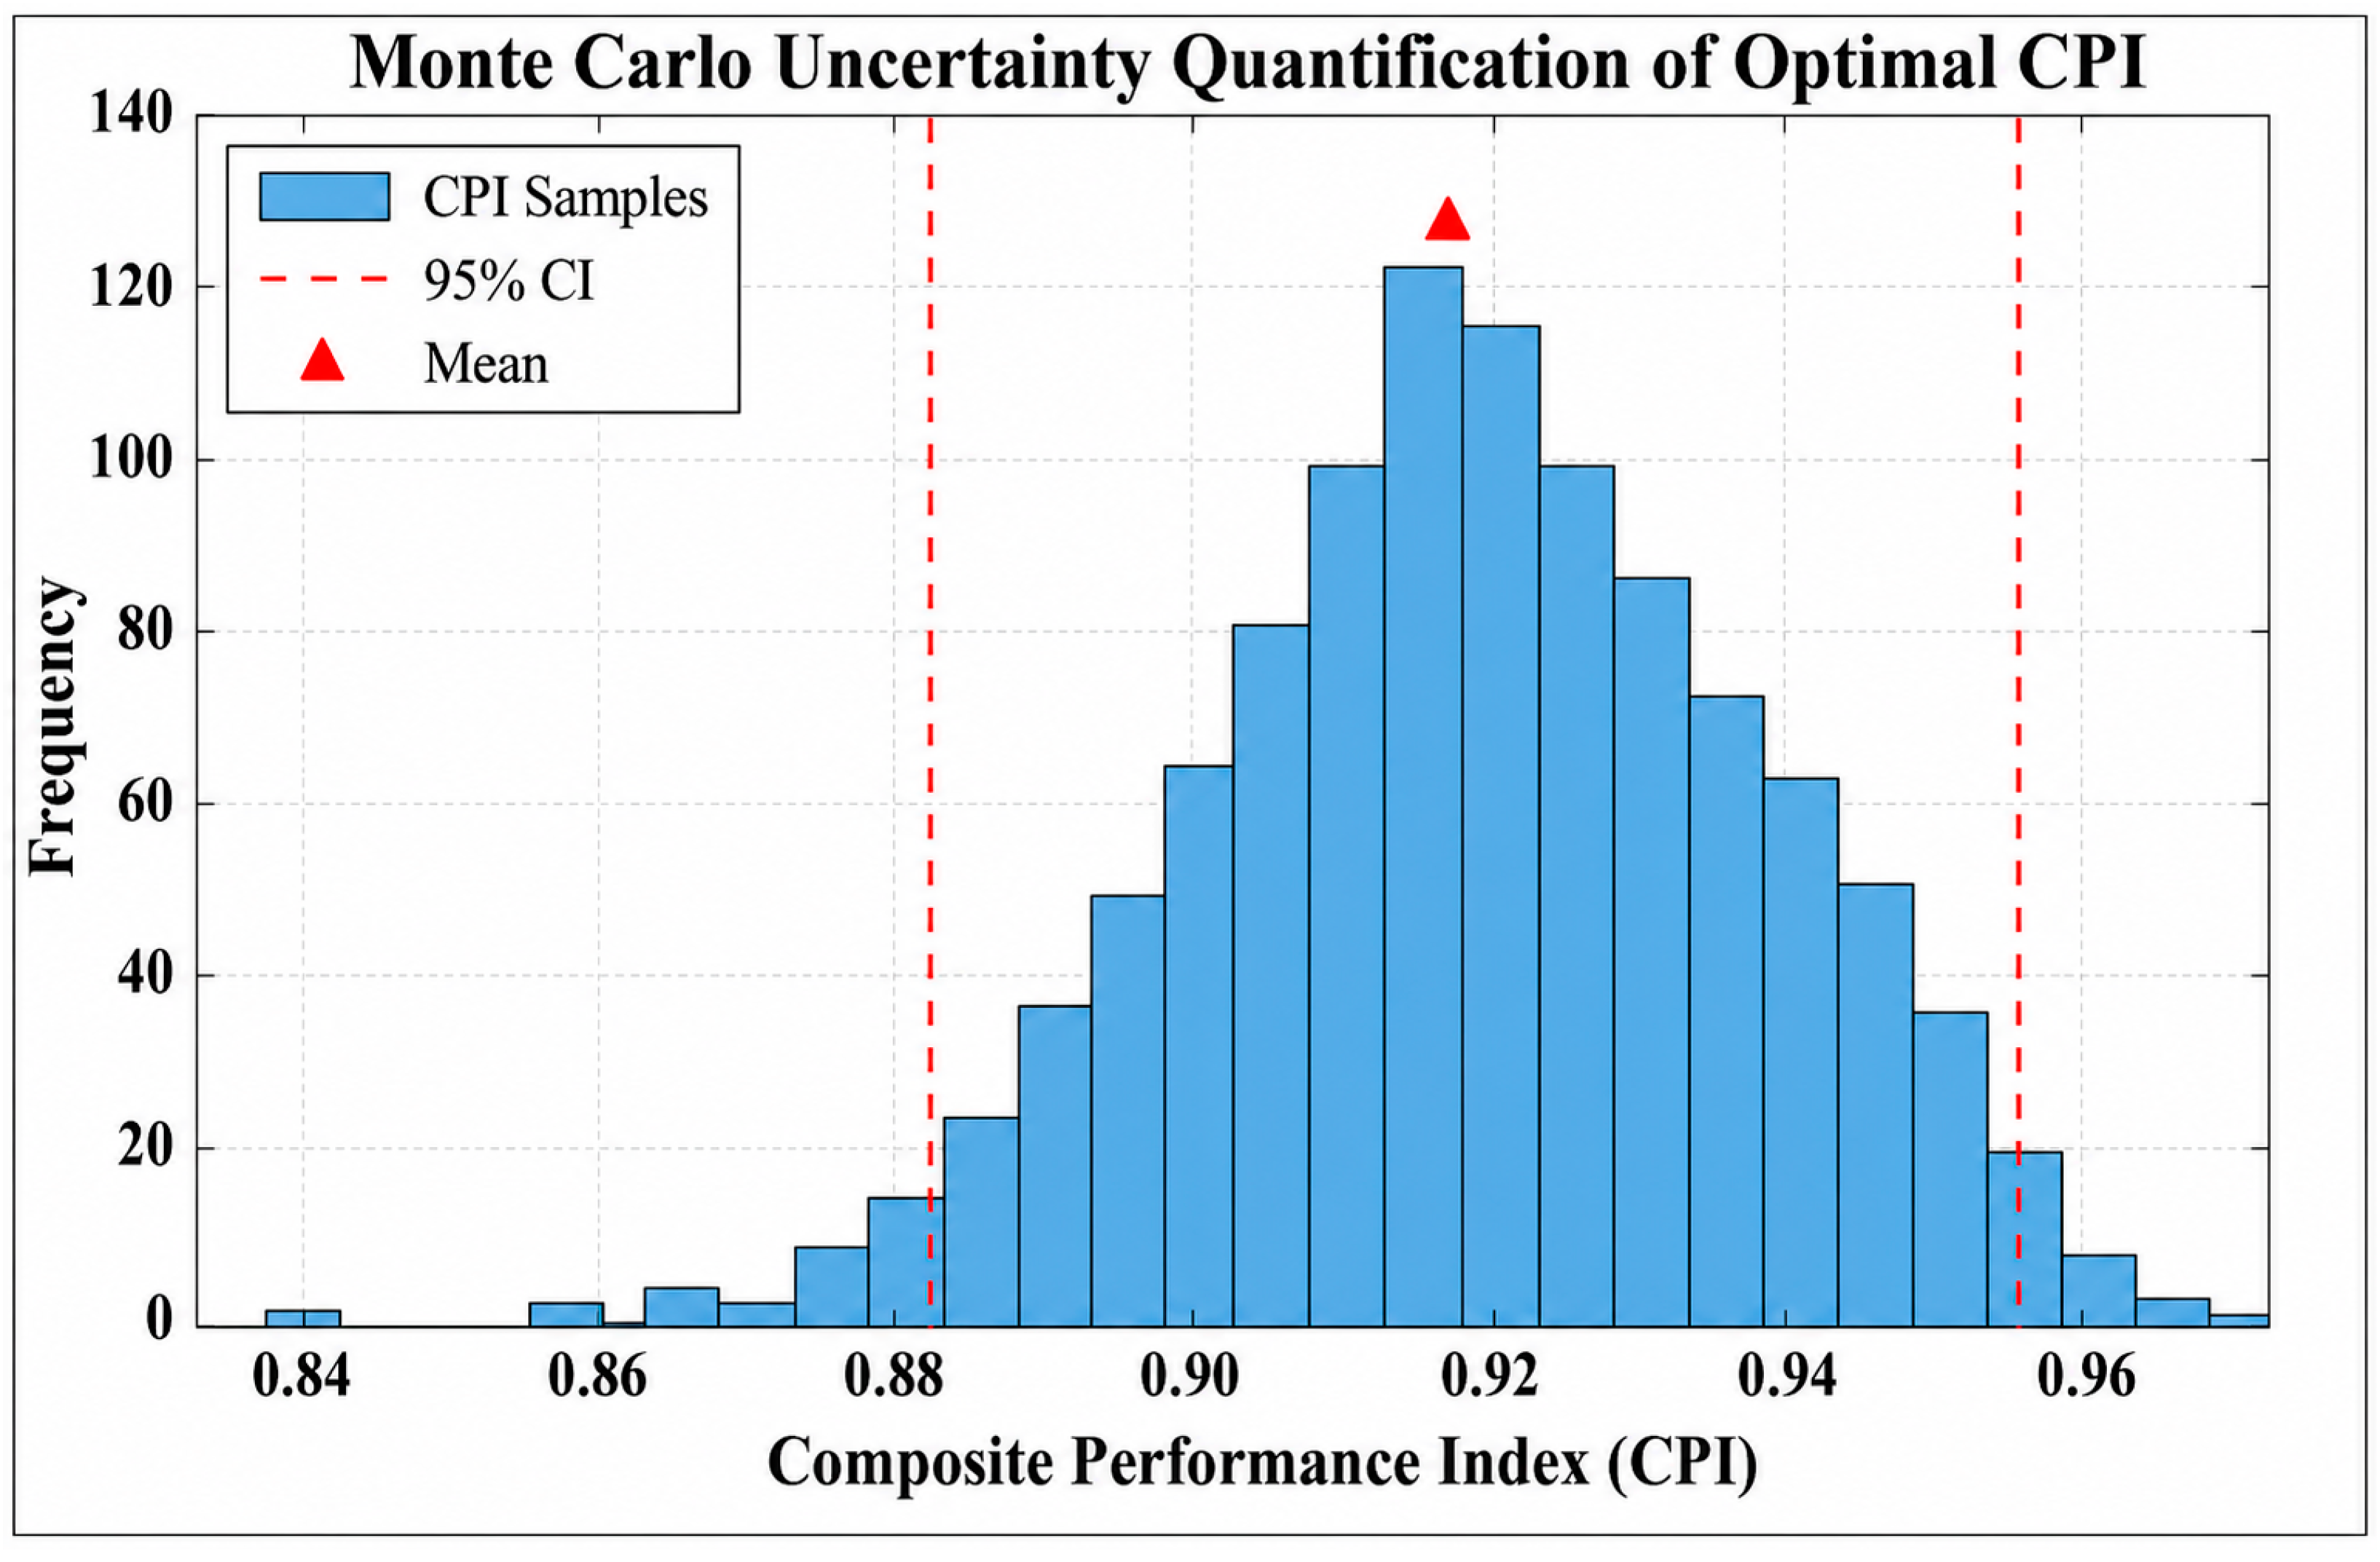

Disclaimer/Publisher’s Note: The statements, opinions and data contained in all publications are solely those of the individual author(s) and contributor(s) and not of MDPI and/or the editor(s). MDPI and/or the editor(s) disclaim responsibility for any injury to people or property resulting from any ideas, methods, instructions or products referred to in the content. |
© 2026 by the authors. Licensee MDPI, Basel, Switzerland. This article is an open access article distributed under the terms and conditions of the Creative Commons Attribution (CC BY) license.