1. Introduction
Coal serves as the cornerstone of China’s energy security, providing a stable and reliable power supply and industrial energy for economic and social development. Its status as the primary energy source remains irreplaceable in the short term. Rock burst refers to the instantaneous release of accumulated elastic strain energy in coal mine workings, which occurs when high stress causes the load on the surrounding coal and rock to exceed their strength limit. This causes the strata to fracture and violently eject into the working area, resulting in support failure, roadway blockage, equipment damage, and posing a severe threat to miners’ lives [
1,
2]. As coal mining advances to greater depths, the risk of coal burst increases significantly, which poses significant operational and safety challenges [
3]. On 20 October 2018, a major rock burst incident occurred in the drainage drift and No. 3 crosscut of the 1303 working face at Shandong Longyun Coal Industry Co., Ltd. (Heze City, China) [
4], resulting in 21 fatalities, 4 injuries, and direct economic losses of 56.398 million yuan.
The causes of rock burst accidents are numerous and complex. To address weaknesses and gaps in coal mine production and safety management, many scholars have conducted extensive research on rock burst prevention [
5]. Current studies on rock burst phenomena primarily focus on two aspects: monitoring, early warning, and prevention measures. Some scholars contend that coal rock burst represents a complex evolutionary process that incubates, develops, and manifests during coal mining operations. Therefore, the core of effectively preventing and controlling coal-rock rock burst lies in monitoring the fracture evolution process of coal-rock bodies, thereby enabling precise prediction and prevention of this hazard. Research in the field of monitoring is currently extensive, ranging from contact-based monitoring and early warning methods such as borehole stress monitoring [
6,
7,
8], mine pressure monitoring techniques, and strain gauge methods, to non-contact geophysical detection technologies represented by electromagnetic radiation [
9,
10,
11], microseismic monitoring [
12], and acoustic emission [
13,
14]. Research on rock burst monitoring and early warning is also continuously advancing. In recent years, as mining depths have increased, the limitations of single monitoring methods have become increasingly apparent; multisource information fusion has become a research hot spot. For instance, Di et al. [
15] proposed a multi-signal fusion early warning method based on the long short-term memory recurrent neural network (LSTM-RNN) and the convolution neural network (CNN) for integrating microseismic, acoustic emission, and electromagnetic radiation signals. Zhao et al. [
16] proposed an intelligent early warning method for rock burst using acoustic emission and electromagnetic radiation, which significantly improved predictive accuracy and generalization capability. This approach provides an effective solution for achieving intelligent and precise early warning of rock burst in coal mines.
While clarifying the research progress and technical directions in rock burst monitoring and early warning, a relatively systematic research framework and practical solutions have also been established academically for proactive prevention and control measures against this hazard. Most scholars generally agree that there are three primary methods for preventing and controlling rock burst: first, mining optimization design approaches represented by staggered-level mining layouts [
17,
18]; second is stress transfer, such as large-diameter drilling for pressure relief [
19], coal seam blasting [
20,
21], hydraulic fracturing [
22,
23,
24], and other prevention and control techniques; third, enhance the impact resistance of the support structure by strengthening or improving the support method [
25]. With the increasing depletion of surface mineral resources, deep mining has become standard practice. Currently, single-method solutions for rock burst prevention and control yield poor results in addressing on-site issues. Therefore, in practical applications, combined management using two or more methods is commonly employed [
5].
In research on rock burst prevention and control, some scholars have employed fault tree analysis (FTA) to identify the critical basic events in rock burst accidents. However, the basic events included in such analyses are often insufficiently comprehensive [
26]. Furthermore, the process of assigning probability values to these basic events typically relies on historical statistical data from a single mine or enterprise group, resulting in probability estimates that lack universal applicability. To address issues mentioned above, this study constructs a more comprehensive basic event system for rock burst accidents based on systematic statistical analysis of accident cases. It introduces fuzzy set theory to handle probability assignment under uncertainty, ultimately enabling precise identification of the critical basic events through Bayesian network inference.
Currently, the mainstream and focus of rock burst research is largely centered on the analysis of stress field evolution. However, coal rock burst is a essentially complex dynamic process involving incubation, development, and occurrence during coal mining operations [
27,
28], with its evolution influenced by the coupled effects of multiple factors. In the field of coal mine safety research, existing studies predominantly explore three dimensions: unsafe human behavior [
29,
30], unsafe equipment conditions [
31,
32], and coal mine production environments [
33,
34,
35]. Xu et al. [
36] analyzed the interaction mechanisms affecting miners’ safety attention, highlighting the importance of considering human-related factors in safety management. Jin et al. [
37] provide guidance for drilling operations and wellbore protection by investigating the factors influencing the deformation and failure of porous coal. A few scholars, such as Tian et al. [
38], have categorized coal mine accidents into four factors: human, machinery, environment, and management. However, there has been limited research on rock burst from an integrated human–machine–environment–management system perspective. Existing findings primarily focus on stress monitoring and prevention technologies, failing to systematically reveal the complete chain of mechanisms through which multiple factors interact, evolve step by step, and ultimately lead to accidents. Furthermore, accident statistics indicate that the direct or indirect causes of most rock burst accidents are closely linked to management factors, further underscoring the necessity and urgency of conducting in-depth investigations into their evolutionary mechanisms at the systemic level.
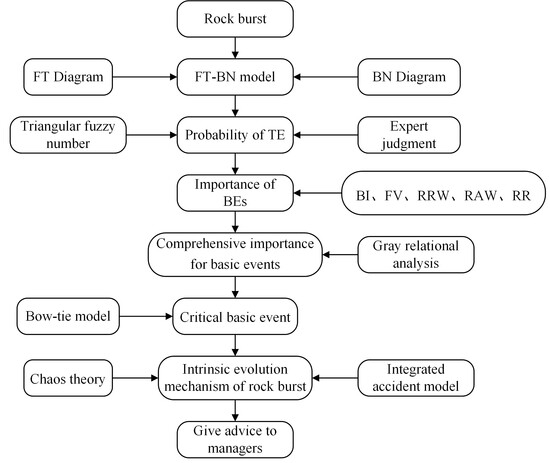
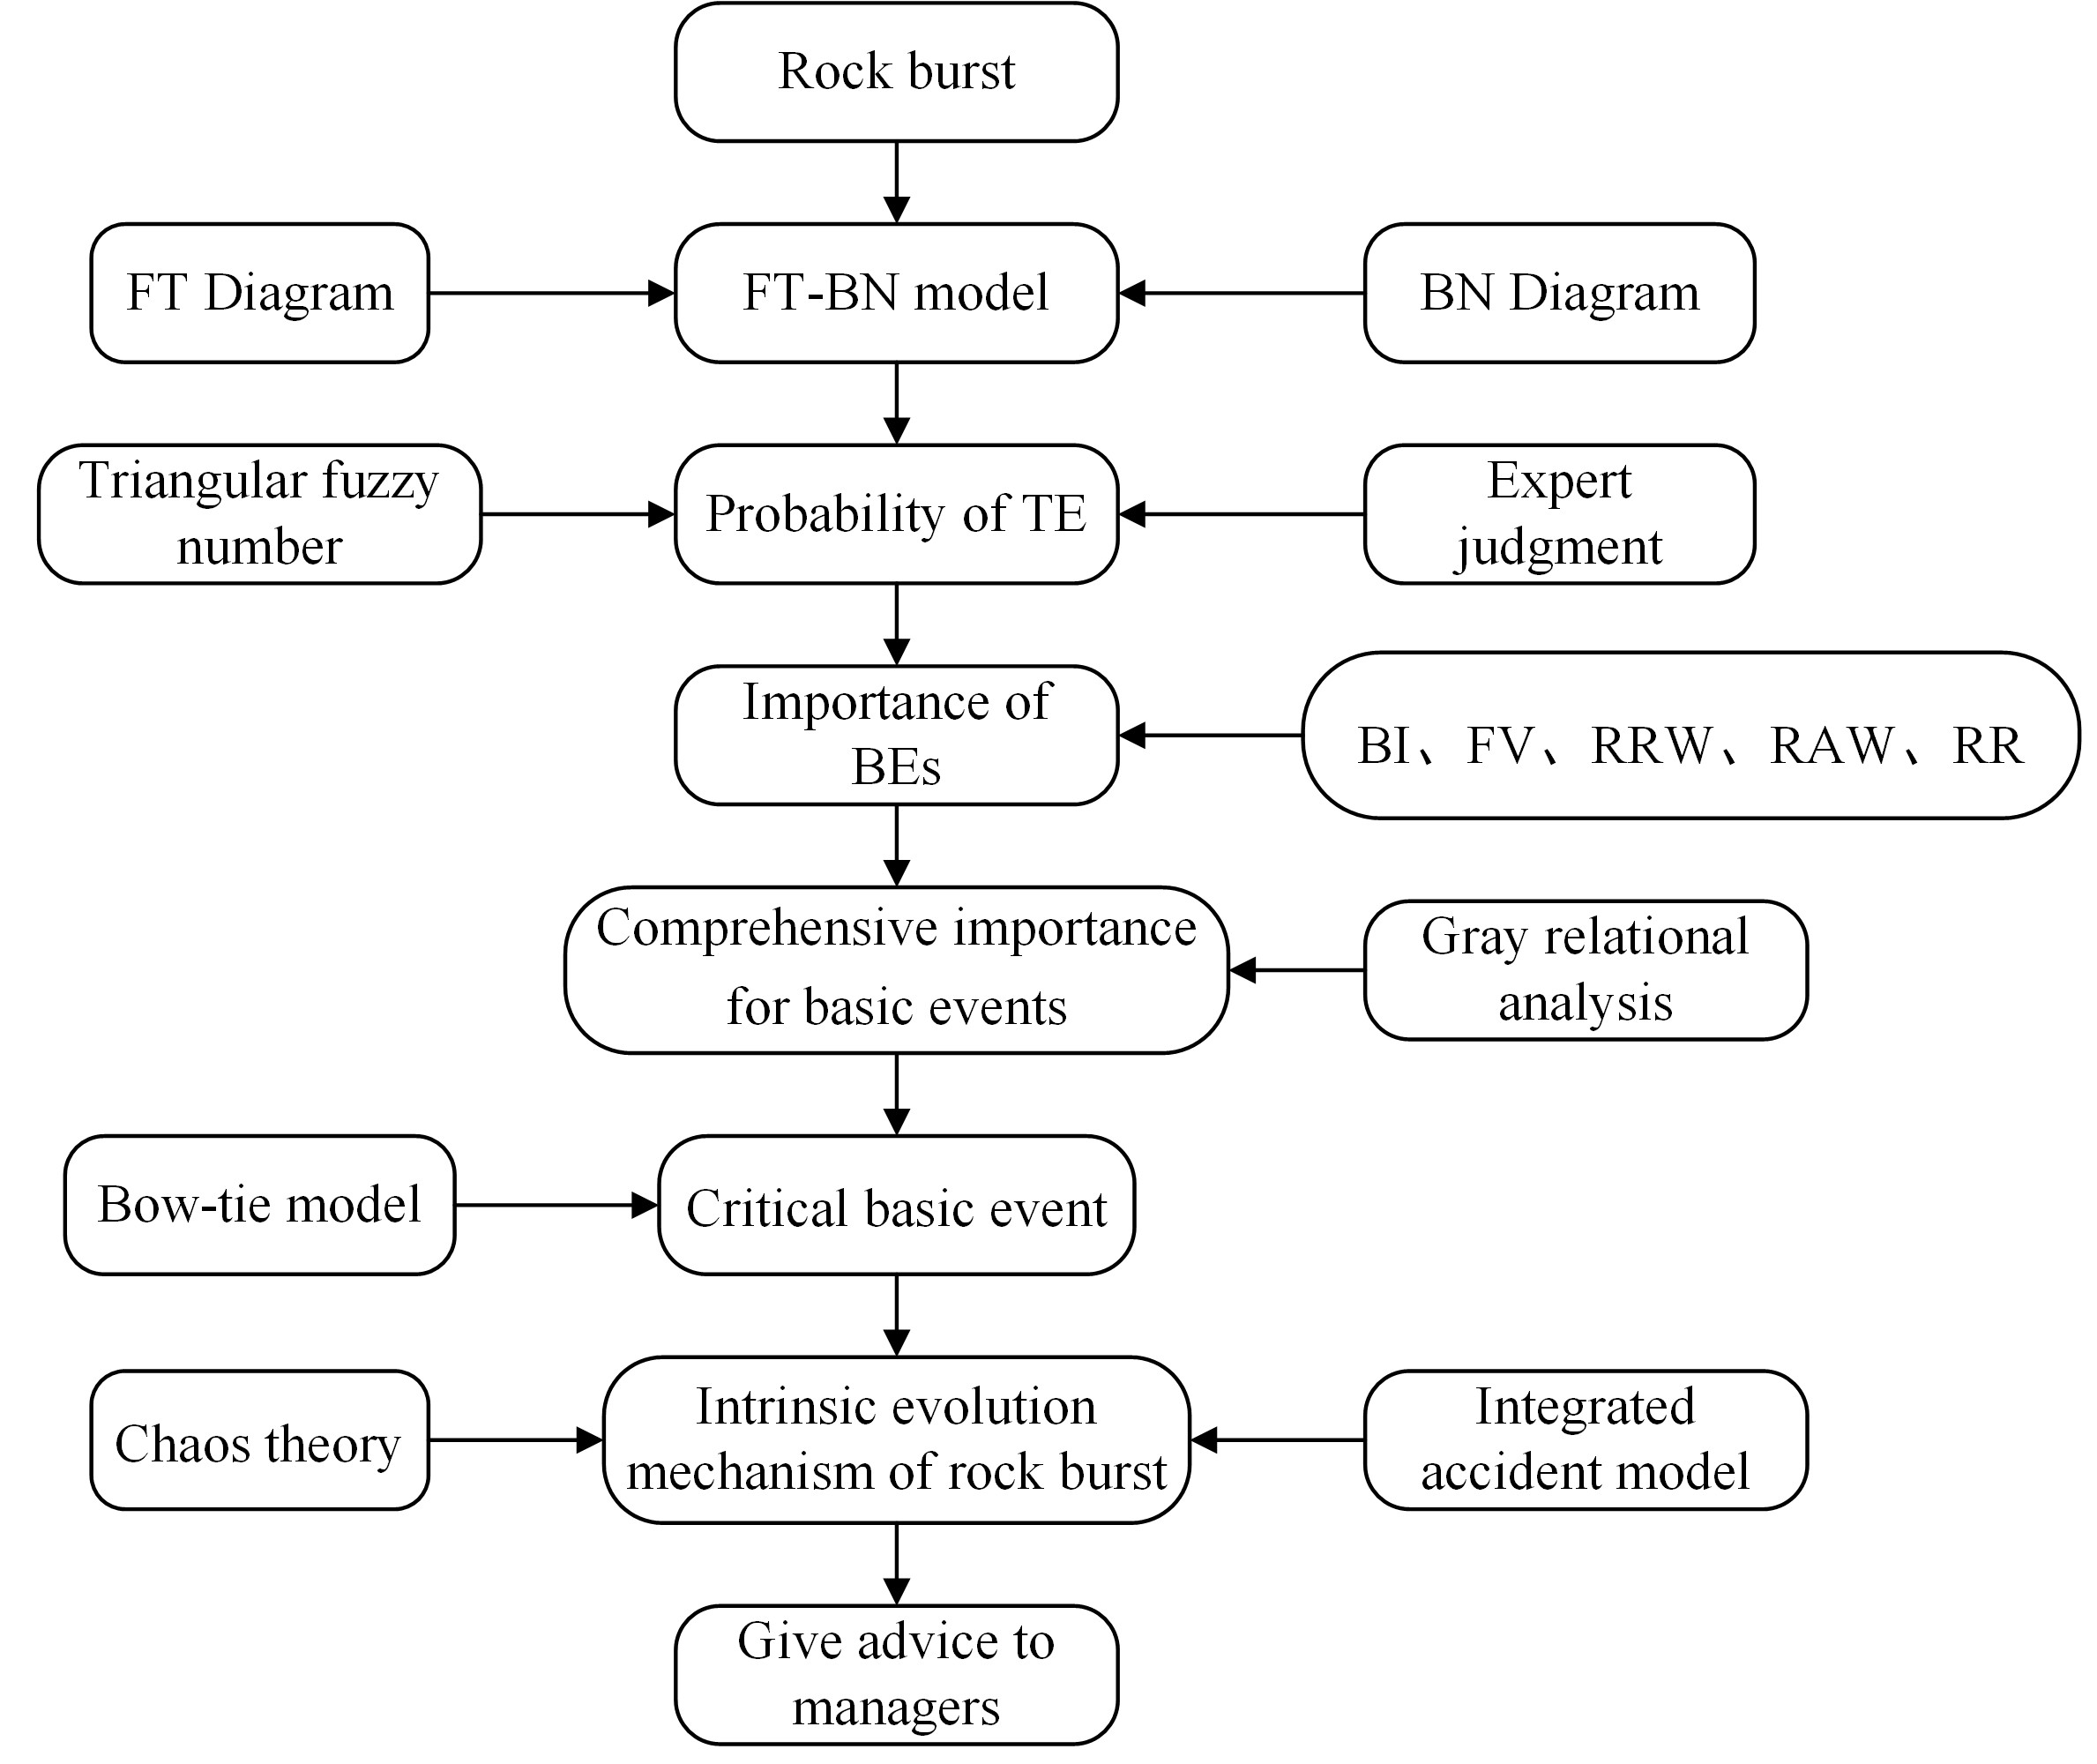
To address the aforementioned limitations, this study develops a systematic risk assessment framework for coal mine rock burst accidents by integrating accident causation analysis, uncertainty quantification, probabilistic reasoning, critical factor prioritization, and accident evolution analysis based on chaos theory. Rather than being a simple combination of existing techniques, the proposed framework provides a structured approach to reveal the interactions among heterogeneous risk factors under incomplete information and further investigates rock burst evolutionary mechanisms from the perspectives of systemic causation and complex system dynamics.
The main contributions of this study are summarized as follows:
- (1)
A multi-theory integrated risk assessment framework is developed by coupling fault tree analysis, Bayesian networks, fuzzy probability estimation, gray relational analysis, and bow-tie modeling, enabling systematic identification and prioritization of critical rock burst risk factors under uncertainty.
- (2)
A comprehensive accident evolution analysis framework is established by combining bow-tie analysis and chaos theory, providing new insights into the transition from multi-factor interactions to catastrophic rock burst events.
- (3)
The proposed framework is validated using 22 rock burst accident cases in Chinese coal mines, demonstrating its capability to identify dominant causal factors and support targeted safety management strategies.
2. Data Statistics
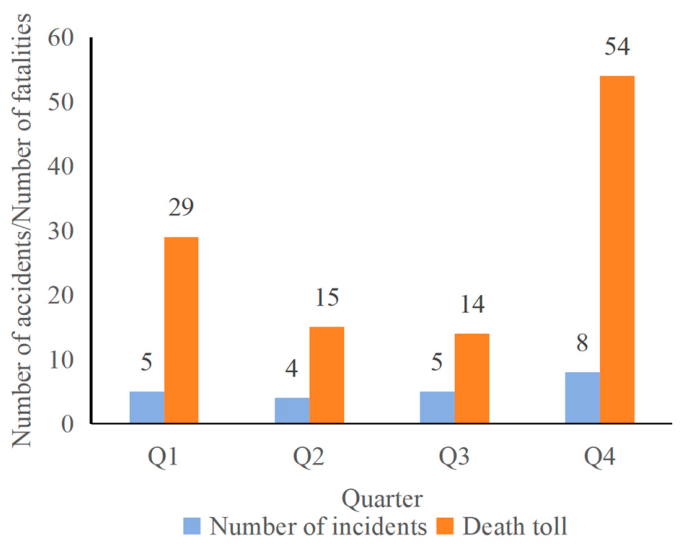
This study collected and analyzed data on coal mine rock burst accidents in China from 2010 to 2024. The data were primarily obtained from the National Mine Safety Administration and provincial regulatory agencies. We selected 22 rock burst incidents as our primary sample, based on the criterion that detailed investigation reports were available. Relevant information was categorized and organized according to the year, quarter, region, and type of incident, and the results are presented in the corresponding charts (
Figure 1,
Figure 2,
Figure 3 and
Figure 4). This approach aims to reveal the temporal and spatial distribution patterns of accidents along with their typological characteristics, thereby providing a reference for implementing phased and targeted rock burst prevention and control measures.
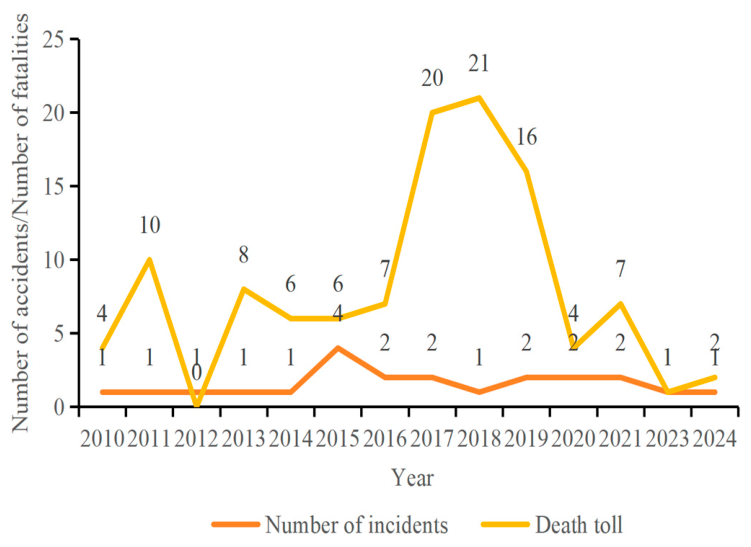
Figure 1 presents a bar chart illustrating the number of rock burst accidents and fatalities from 2010 to 2024. The data reveals two accidents in 2017, resulting in 20 deaths. In 2018, only one incident occurred, yet it claimed 21 lives—marking the highest single-incident death toll within this statistical period. Our analysis, considering the accident causes, indicates that mining depths have increased significantly in recent years, frequently surpassing 800 or even 1000 m, leading to extremely high in situ stresses. Furthermore, the coal seams and roof strata in these mines predominantly exhibit pronounced coal burst tendencies and feature complex geological structures with numerous faults.
From a quarterly distribution perspective,
Figure 2 clearly shows that the fourth quarter recorded the highest number of accidents and fatalities. Analysis of available data suggests that the high accident rate in the fourth quarter may be related to climatic conditions. During this period (October–December), most of China experiences a cold, dry season, during which falling surface temperatures can alter rock stress. Additionally, the fourth quarter is a critical time for coal mines to complete annual production targets, potentially intensifying operational activity. To achieve these goals, companies significantly increase mining intensity and accelerate advancement speeds, leading to more frequent accumulation of mining-induced stress. At the same time, the implementation period for pressure relief measures is often insufficient, and maintenance time is also compressed, making it difficult to identify and address potential safety hazards promptly.
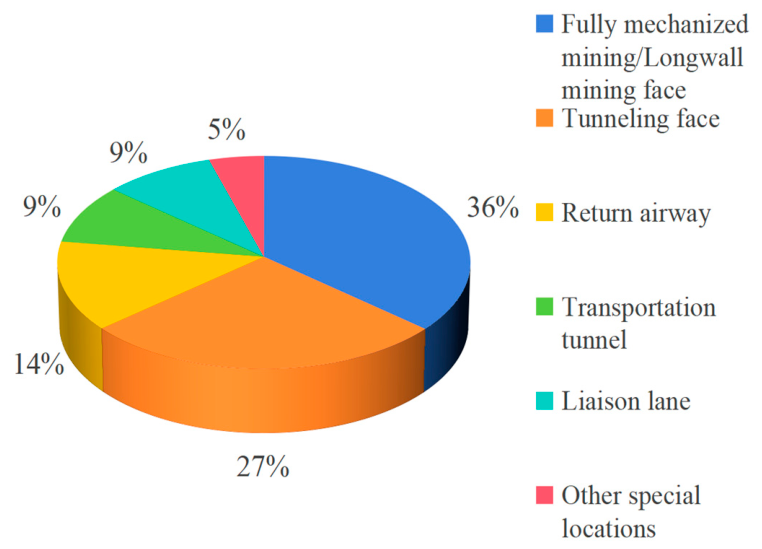
According to the accident location distribution shown in
Figure 3, fully mechanized mining/longwall mining workfaces accounted for the highest proportion (36%), followed by tunneling workfaces (27%). Together, these two types represented more than 60% of accidents. This clearly establishes concentrated mining and tunneling activities as the key contributor to rock burst. Return airways, haulage roadways, crosscuts, and other special locations constitute 14%, 9%, 5%, and 9% of incidents, respectively. This underscores the necessity of extending monitoring and remediation efforts beyond the primary mining face.
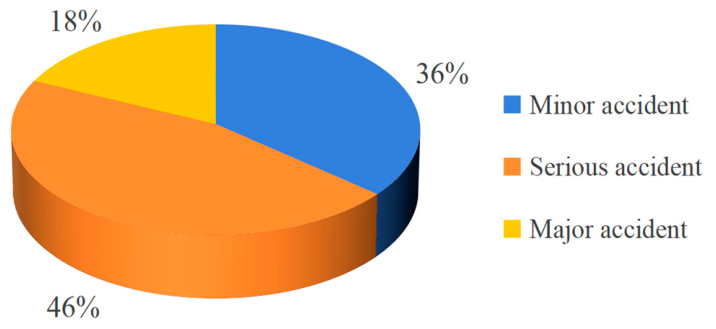
The accident level in
Figure 4 is determined in accordance with the Regulations on the Reporting, Investigation, and Handling of Production Safety Accidents, promulgated by Decree No. 493 of the State Council of China. Among the data collected by this research institute, major accidents accounted for 45%, significant accidents for 36%, and general accidents for 18%. This indicates that rock burst accidents not only occur frequently but also result in severe consequences, often leading to mass casualties and major production disruptions. This underscores their extremely hazardous nature as a major coal mine disaster and highlights the necessity of rock burst prevention and control.
In existing literature on rock burst accident research, statistical data sections predominantly use individual mining areas as samples [
26,
39], and their generalizability remains to be confirmed. This analysis is based on the official accident investigation reports. The accident information was categorized and organized by year, quarter, region, and type to derive the results. Analysis of
Figure 1 and
Figure 2 reveals that coal mine rock burst accidents are temporally clustered, suggesting that production rhythms, changes in geological conditions, and the periodic accumulation of mining-induced stress may be key factors influencing rock burst occurrence. The analysis results in
Figure 3 and
Figure 4 indicate that non-mining areas should also be included in monitoring and remediation efforts. These results highlight the extreme hazard posed by coal mine rock burst as a major disaster, underscoring the necessity of rock burst prevention and control.
4. Results and Discussions
4.1. Fault Tree Analysis of Rock Burst Accidents
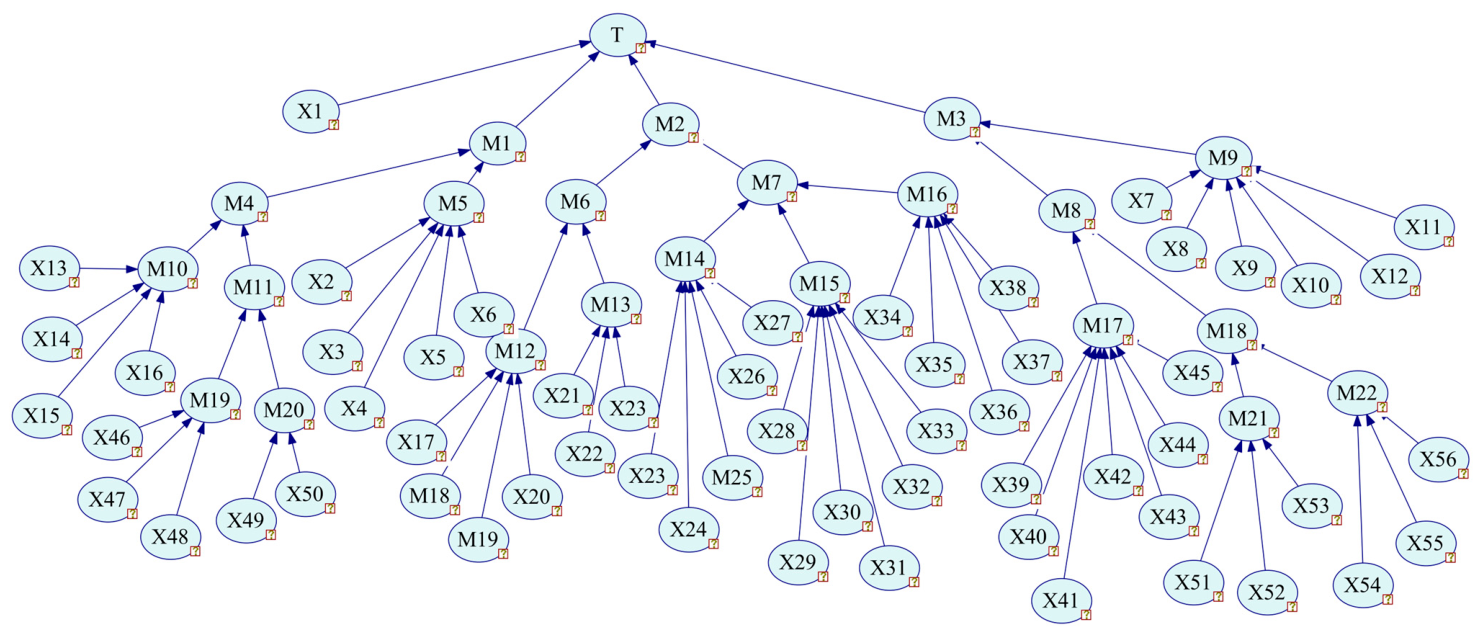
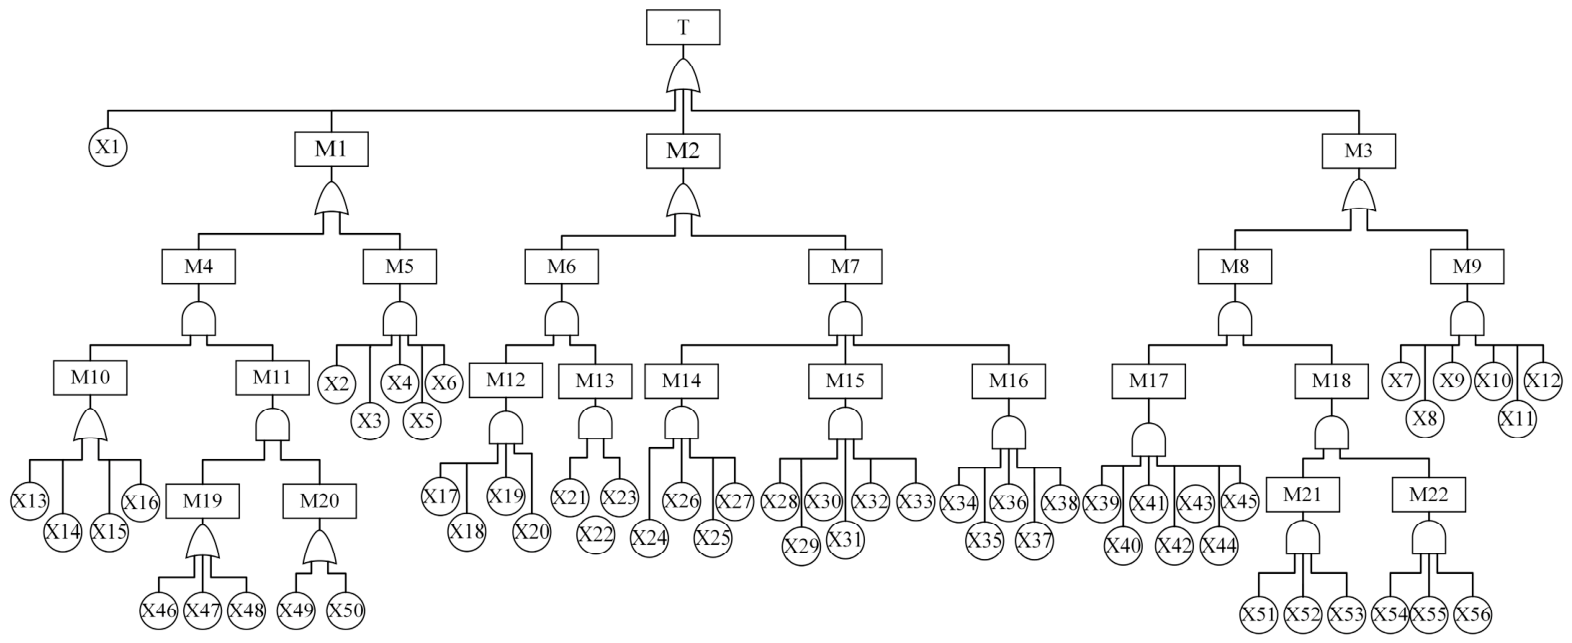
Based on existing research in the field of coal mine rock burst mechanisms, this study systematically reviewed and analyzed investigation reports from 22 typical rock burst accidents. We constructed a coal mine rock burst fault tree model, as shown in
Figure 6. This model uses “rock burst occurrence” as the top event and, through layer-by-layer analysis, ultimately identifies 56 basic events as shown in
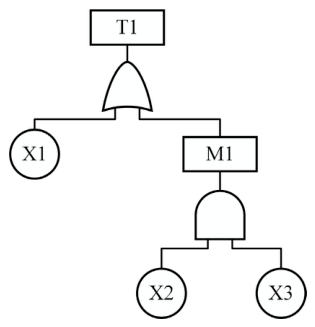
Table 6. The entire fault tree comprises 23 logical gates: 7 AND-gates (30.43%) and 16 OR-gates (69.57%). The high proportion of OR-gates indicates that the causative factors of rock burst accidents exhibit significant diversity and dispersion.
Meanwhile, the proportion of logical AND-gates is relatively low, suggesting that multiple conditions must typically coincide for rock burst to occur. For example, the top event “coal mine rock burst (T)” is connected via AND-gates to “coal rock possess bursting liability (X1)”, “geological conditions (M1)”, “safety management factors (M2)”, and “mining technology factors (M3)”, indicating that the accident occurs only when all four factors act together. It is evident that rock burst accidents result from the coupled interaction between the inherent rock burst tendency of coal and rock formations and external triggering factors such as geological conditions, safety management, and mining techniques [
38].
Among various factors, geological conditions are the fundamental cause of rock burst, determining the inherent properties of the stress environment within coal and rock strata. Special geological structures (such as faults) act as stress concentration zones, where the surrounding coal and rock are typically more fractured and exhibit complex stress distributions. Under mining disturbance, these areas are more prone to inducing rock burst. Mining operations are the direct trigger for rock burst through their disturbance of the strata stress field. High-intensity mining causes rapid extraction of coal and rock, leading to abrupt adjustments in the stress field. If the rate of stress redistribution exceeds the load-bearing capacity of the coal and rock, it may trigger rock burst damage. Safety management deficiencies are the key factor leading to the failure of prevention and control systems. For instance, inadequate monitoring systems prevent the timely detection of precursor information such as stress and microseismic activity, making it difficult for managers to accurately assess risk conditions. This results in missed opportunities for prevention and control, ultimately leading to accidents.
Motahhedi et al. [
26] constructed a fault tree with 20 basic events to identify the critical path to coal seam explosions. In contrast, the fault tree constructed in this study is more systematic and comprehensive, encompassing basic events. During the construction of fault trees, accident investigation reports serve as the basis for analyzing causal conditions across different coal mining environmental systems, thereby ensuring the comprehensiveness and objectivity of basic events. The model constructed in this study clearly reveals the evolutionary patterns and dominant factors of rock burst accidents in China, laying a theoretical foundation for subsequent risk analysis. Given the diversity of mine geological conditions and mining environments, the basic events in the model can be adjusted accordingly in practical applications, thereby balancing its universal applicability with suitability for specific scenarios.
It should be noted that the identified critical basic events were derived from rock burst accident investigation reports of Chinese coal mines during 2010–2024; therefore, the results mainly reflect the characteristics of rock burst accidents under China’s geological conditions, mining practices, and safety management systems. China was selected as the research context because its deep underground coal mining activities and relatively complete accident investigation records provide a valuable basis for causal analysis and uncertainty quantification. However, differences in mining conditions and accident reporting systems among countries may affect the distribution of causal factors. Due to the limited availability and inconsistency of international accident data, this study did not include foreign cases, which will be further addressed in future research through broader international datasets.
4.2. Fuzzy Analysis of the Occurrence Probability of Basic Events
We engaged a panel of 20 experts specializing in coal mine safety and rock burst prevention, all of whom have substantial theoretical and practical expertise. These experts represent research institutes, universities, coal mining enterprises, and safety regulatory agencies, ensuring the comprehensiveness and authority of the evaluation data. During the evaluation process, each expert independently assessed the likelihood of occurrence for all 56 identified basic events based on professional judgment, with the evaluation criteria outlined in
Table 5. Subsequently, applying the fuzzy number aggregation method defined by Equation (4), the fuzzy evaluations provided by 20 experts for the same basic event were comprehensively computed to obtain an aggregated triangular fuzzy number representing the consensus of the expert group.
After obtaining the aggregated fuzzy number, use the formula to calculate the failure probability sequence (FPS) for each basic event. Finally, to get the required basic probability values for each basic event at the nodes of the Bayesian network, we apply the formula to process the computed FPS. All computational results from the aforementioned fuzzy aggregation, FPS calculation, and final probability conversion are summarized in
Table 7.
The calculated probabilities represent the estimated likelihood of occurrence of each basic event associated with coal mine rock burst accidents during the study period of 2010–2024. These probabilities should be interpreted as expert-informed occurrence likelihoods of causal factors under the accident scenarios investigated in this study, rather than annual failure frequencies or unconditional probabilities of all coal mines.
After completing expert evaluations and probability calculations, to verify the reliability of the obtained data, this study selected the critical basic event X1 (Coal rock possess bursting liability) for independent validation. Based on expert fuzzy evaluations, the occurrence probability of X1 was 3.54 × 10⁻². For comparative verification, we have compiled objective statistical data indicating that the total number of registered mines nationwide currently stands at approximately 4200. According to data publicly cited by Academician Pan Yishan, 138 of these mines are classified as having rock burst hazards. Based on this calculation, the objective statistical probability of Event X1 is approximately 3.29 × 10⁻² (138/4200 ≈ 0.03286).
The comparison results show that the probability of occurrence X1 based on expert judgment (3.54 × 10
−2) is highly consistent with the result of 3.29 × 10
−2 derived from national objective statistical data, with a relative error of only 7.6%. In previous studies, methods such as triangular fuzzy numbers have often been employed to address data scarcity when empirical data are difficult to obtain [
51,
52]. However, in practical applications, most studies have only assigned subjective values without further validation through objective data [
26,
43]. By comparing objective and subjective data, this study concludes with high consistency. This not only strongly supports the reliability of the expert evaluation and fuzzy probability calculation methods employed in this study but also validates the soundness of the research approach adopted. Based on the validation results and considering the greater objectivity of statistical data, the occurrence probability of the X1 basic event is adjusted to 3.29 × 10
−2 for all subsequent analyses.
4.3. Bayesian Network Analysis of Rock Burst Accidents
After completing the fault tree construction, this study converted the fault tree (FT) into a Bayesian network (BN) based on the specific conversion logic and methods outlined in
Table 2 and
Table 3. The resulting Bayesian network model for the coal mine rock burst fault tree is presented in
Figure 7. Input the prior probabilities of each basic event into the Bayesian network model. Upon running the model, the probability of the top event is 9.16 × 10
−12.
The advantage of Bayesian networks lies in their ability to express probabilistic dependencies between events and perform reasoning under uncertainty. To effectively establish this model and perform inferential analysis, this study employs GeNIe software as the modeling and analysis platform. By leveraging the software’s forward and backward reasoning capabilities—inferring the probability distribution of outcome variables from known cause variables, and tracing back the probability distribution of cause variables (hypotheses) from observed outcome variables (evidence)—it enables deeper quantitative analysis of how each basic event influences the occurrence of the target event. This provides a practical theoretical basis and strong decision-making support for the early warning and prevention of coal mine rock burst.
To verify the impact of basic event completeness on the probability of top event, this study conducted simulation analyses by introducing omitted basic events. The maximum probability (0.0329) and minimum probability (0.0024) from the basic events, along with the probability value (0.0112) obtained by averaging the probabilities of the middle 54 basic events, are selected as the probability values for the omitted events. We input these three values across the model’s five logical tiers. Subsequently, the Bayesian network was used to compute the top-event probabilities for the logical “AND-gate” and “OR-gate” configurations (see
Table 8). Finally, we evaluated the relative error of these probabilities by comparing them to the actual top-event probability of 9.16 × 10
−12. The results of this error analysis are given in
Table 9.
The related studies have found that there exists an interactive effect among hierarchy, probability, and logic gates, which collectively influence the probability of the top event [
43,
60]. Specifically, the AND-gate structure positioned near the top event demonstrates high sensitivity to omissions of basic events across various probability categories. The influence of the “OR-gate” structure gradually diminishes as the hierarchy decreases and the probability declines. In contrast, the “AND-gate” structure (primarily when located at the bottom layer) exhibits some immunity to interference from missed events.
In existing studies employing fault tree analysis to investigate failure causes, analysis typically commences immediately after establishing the fault tree and basic events [
43]. However, these studies rarely address whether other literature considers the omission of basic events during fault tree construction, nor do they sufficiently explore the impact of omitting basic events on the overall failure probability [
67,
68]. To this end, this study employs simulation analysis by introducing omitted basic events, demonstrating that comprehensive coverage of all basic events across all levels and logical gate structures is essential to ensure the thoroughness and accuracy of causal analysis in investigating rock burst accidents.
4.4. Importance of BEs
To calculate the importance metric for each basic event, this study forcibly sets the state of each basic event to either occurred (
BE = 1) or not occurred (
BE = 0), and recalculates the probability of the top event (TE) based on these states. Subsequently, five importance metrics were calculated for each basic event: Birnbaum Importance (BI), Fussell–Vesely (FV), Risk Reduction Worth (RRW), Risk Achievement Worth (RAW), and Risk Reduction (RR) [
69].
Importance indicators quantify the influence of basic events on the top event probability, with higher importance indicating greater impact, thereby providing a scientific basis for accident prevention. In this study, five key performance indicators are employed for quantitative analysis. Although these measures share the same overall goal, they reflect distinct risk perspectives—such as sensitivity, contribution, risk reduction, risk increase, and removal effectiveness—and may yield inconsistent rankings due to their different mathematical definitions. In practice, safety management requires a multi-criteria assessment that considers current contribution, intervention priority, and potential escalation; hence, no single indicator is sufficient. To address this limitation, gray relational analysis is adopted to integrate the ranking information from all five indicators and derive a more balanced comprehensive priority.
Table 10 presents the calculation results.
Based on the comprehensive importance ranking results, among the top fifteen basic events, geological conditions accounted for 8 items (53.33%), mining technology factors accounted for 4 items (26.67%), and safety management factors accounted for 3 items (20%). The top two factors, X50 and X49, along with the third factor X1, all relate to geological conditions; X10 and X7 pertain to mining techniques; while X17, X19, and X20 correspond to management-related factors such as the absence of a mine pressure monitoring system, inaccurate monitoring results, and inadequate hazard identification, and it is evident from the analysis that more emphasis should be placed on monitoring in future safety management. It is important to recognize that geological conditions are formed through natural processes spanning hundreds of millions of years and are challenging to alter artificially; mining technologies are constrained by the level of scientific and technological development, with limited room for improvement in the short term; while safety management factors have been demonstrated as the key entry point for enhancing coal mine safety production standards [
25,
29,
30].
In the systematic analysis of rock burst accidents, scientifically evaluating the impact of basic events (BEs) on top events (TE) forms the foundation for identifying key causative factors and developing prevention and control strategies. Regarding BE importance analysis, Li et al. [
43] employed a simple summation of different importance indicators to derive a composite importance metric in their study on the probability of explosions in aluminum production [
43]. This method is prone to introducing bias. To integrate multidimensional information more scientifically, this study adopts the gray relational analysis method and constructs a comprehensive evaluation framework based on multifaceted importance indicators (BI, FV, RRW, RAW, RR). This method does not rely on strong distributional assumptions and can effectively handle decision-making scenarios with small samples and incomplete information. It calculates the gray relational degree between the rankings from different importance indicators and an “ideal ranking,” enabling the systematic integration of multi-dimensional metrics. This approach not only overcomes the one-sidedness and subjectivity inherent in traditional single-perspective or simple additive methods but also provides a more scientific and comprehensive methodological foundation for identifying the true critical causes of rock burst accidents.
4.5. Sensitivity Analysis of the Proposed Framework
Since the proposed framework integrates expert knowledge and fuzzy probability estimation, uncertainties associated with expert judgment and incomplete accident information may affect the final risk assessment results. Therefore, sensitivity analyses were conducted to evaluate the robustness of the proposed model under different uncertainty scenarios. Detailed adjusted triangular fuzzy numbers, expert weights, and the complete ranking results of basic events are listed in
Supplementary Tables S1–S3.
First, the uncertainty of triangular fuzzy numbers was examined by reducing the fuzzy intervals by 20%. This scenario represents a situation where expert evaluations become more concentrated and the uncertainty range of basic event probabilities decreases. As shown in
Table 11, the calculated top-event probability was 1.02 × 10
−11, corresponding to a relative deviation of 11.52% from the baseline result. Meanwhile, the Spearman correlation coefficient between the original and perturbed importance rankings reached 0.9936, indicating that the reduction in fuzzy intervals had limited influence on the identification of critical risk factors.
Second, the influence of expert weight uncertainty was investigated. Considering that experts with higher contributions may introduce greater impacts on the evaluation results, the weights of the top 25% experts were increased by 10% and subsequently normalized. The top-event probability under this scenario was 8.72 × 10⁻¹², with a relative error of 4.83%. The Spearman coefficient was 0.9944, demonstrating that moderate variations in expert importance did not significantly alter the ranking stability.
Finally, this study evaluates the combined impact of fuzzy interval variations and the uncertainty of expert weights. The combined perturbation resulted in a top-event probability of 9.82 × 10⁻¹², with a relative error of 7.16%. The Spearman coefficient remained as high as 0.9941, suggesting that the proposed framework maintained strong robustness even under simultaneous uncertainty conditions.
Overall, all perturbation scenarios resulted in Spearman correlation coefficients higher than 0.99, indicating that the ranking of critical risk factors was highly consistent with the original model. Furthermore, by comparing the gray relational analysis results under different perturbation scenarios, it was found that the top five basic events with the highest comprehensive importance remained unchanged. This indicates that the proposed framework is capable of reliably identifying dominant risk factors even when uncertainty exists in expert preferences and fuzzy probability characterization.
It should be noted that the transformation from fault trees to Bayesian networks in this study adopts deterministic logical relationships for intermediate events, where logical gates are represented using binary conditional probability tables. This treatment follows conventional FTA-BN modeling practices and aims to preserve the causal structure derived from accident investigation reports. In contrast, uncertainties in this study are mainly characterized through fuzzy probability estimation of basic events and expert weighting.
Nevertheless, deterministic logical assumptions may simplify the uncertainty associated with causal transmission among intermediate events. Future studies can further incorporate probabilistic logical gates or noisy-OR/AND models to investigate structural uncertainty in accident evolution networks.
4.6. Bow-Tie Analysis of X20
The bow-tie model is a systematic risk assessment methodology centered on critical basic events, employing a bidirectional analysis approach. During the model construction, the left side systematically identifies potential causal factors using fault tree analysis (FTA), while the right side simulates possible cascading consequences through event tree analysis (ETA). The overall structure forms a symmetrical bow-tie configuration. This model categorizes risk factors into three modules: critical basic events are positioned at the central node; the left module employs deductive reasoning to trace various foundational risk factors, including underlying causal elements such as management deficiencies and human error; the right module represents the potential sequence of consequences, encompassing multidimensional impacts including personnel safety and property loss [
49,
70]. For risk management, the model incorporates a dual-layer protection mechanism: preventive controls are configured on the causal analysis side to block accident trigger pathways through technical means; mitigation strategies are deployed on the consequence analysis side to reduce the impact of accidents via emergency response and remedial actions. This phased, multi-tiered protection system forms a comprehensive, three-dimensional prevention network spanning the entire risk lifecycle.
Given that inadequate hazard identification is highly ranked among basic safety management events, it has been selected as the focal point for nodal analysis. Inadequate hazard identification is one of the core factors triggering coal mine rock burst accidents. Its impact extends beyond directly causing accidents; it also amplifies the destructive force and response complexity of accidents through chains of hidden risk accumulation and warning system failure. The impact of inadequate hazard identification on rock burst accidents is systemic: from risk accumulation to incident triggering, from damage amplification to emergency response failure, and ultimately to management collapse—each link in the chain is inextricably connected. This also validates the safety principle that potential hazards are accidents waiting to happen. For sudden and highly destructive disasters like rock burst, the comprehensiveness and precision of inspections directly influence the likelihood of accidents occurring.
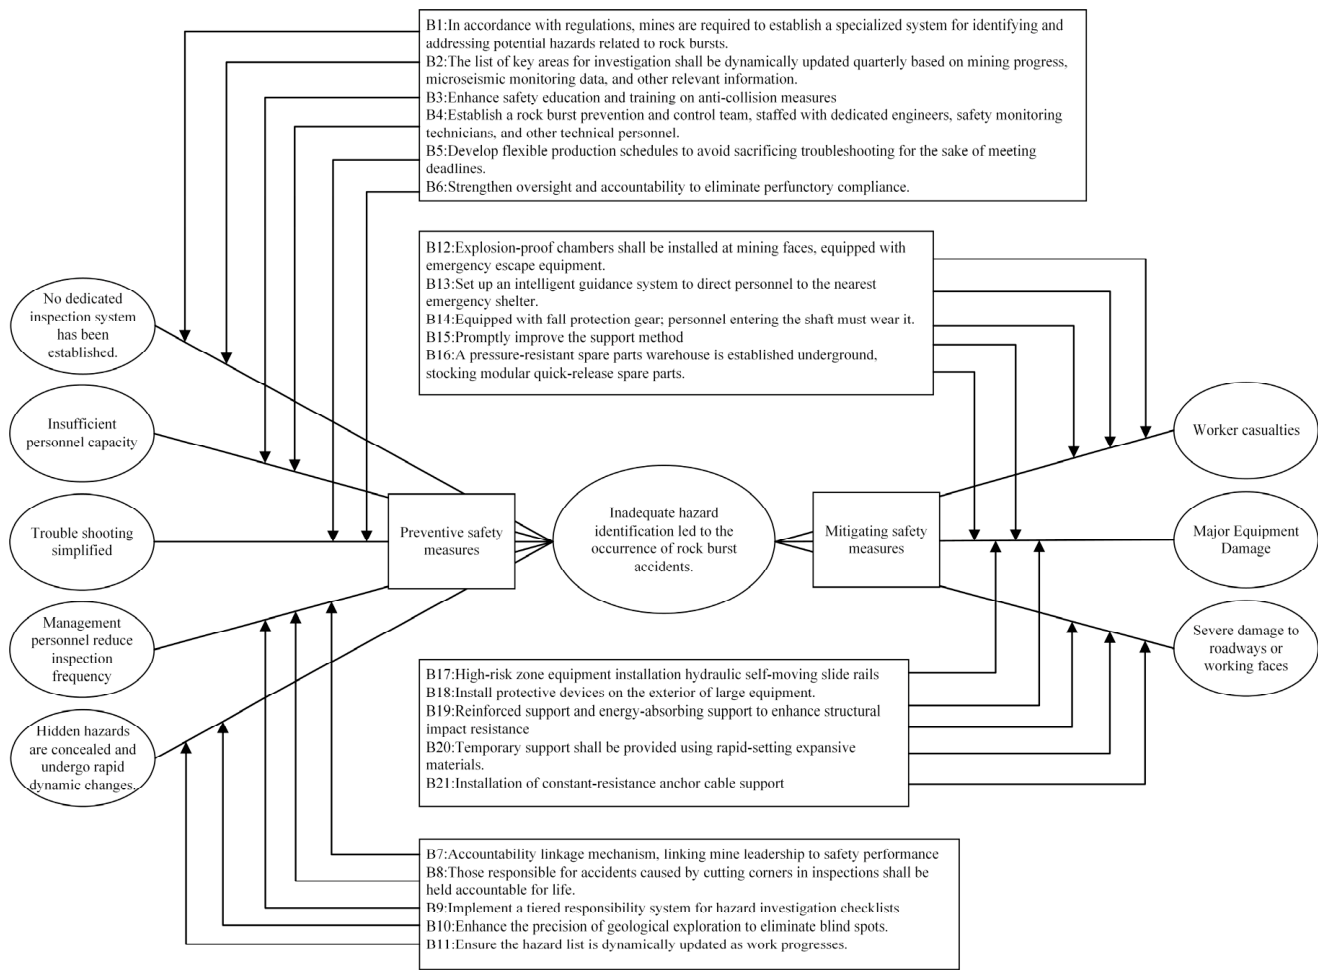
Systematically analyze the causes and consequences of inadequate hazard identification and establish corresponding preventive measures. As shown in
Figure 8, the fault tree analysis on the left side of the node focuses on the fundamental drivers of inadequate hazard identification, covering five contributing factors. The event tree analysis on the right side illustrates the three consequences triggered by inadequate hazard identification. The model also provides targeted preventive control measures and mitigation response plans. Node analysis results indicate that optimization measures can significantly reduce the risk of rock burst accidents caused by inadequate hazard identification.
In the field of coal mine accident research, Tian et al. [
38] employed GT and CBR methodologies to conduct a multidimensional analysis of the causes and safety countermeasures for coal mine accidents. Their examination of rock burst accidents specifically identified “inadequate safety supervision” as a risk factor. However, their study did not delve deeply into the causal mechanisms and consequences of specific hazard factors. Li et al. [
71] emphasized the significant impact of inadequate technical management among the management factors in their study of coal mine gas explosion accidents, yet similarly failed to provide specific elaboration or in-depth analysis on this issue. This study focuses on rock burst accidents and introduces the bow-tie analysis method. Using the basic event X20 (inadequate hazard identification) as an example, it employs deductive reasoning to map its cause chain and consequence chain systematically. Based on this analysis, the study proposes more targeted preventive control measures and post-event mitigation strategies. This analysis demonstrates that coal mining enterprises can leverage the bow-tie model to construct a systematic risk prevention and control framework integrating preemptive prevention with post-event mitigation, thereby providing structured, end-to-end strategic support for the governance of rock burst risks.
4.7. Chaos Analysis of Rock Burst Accidents
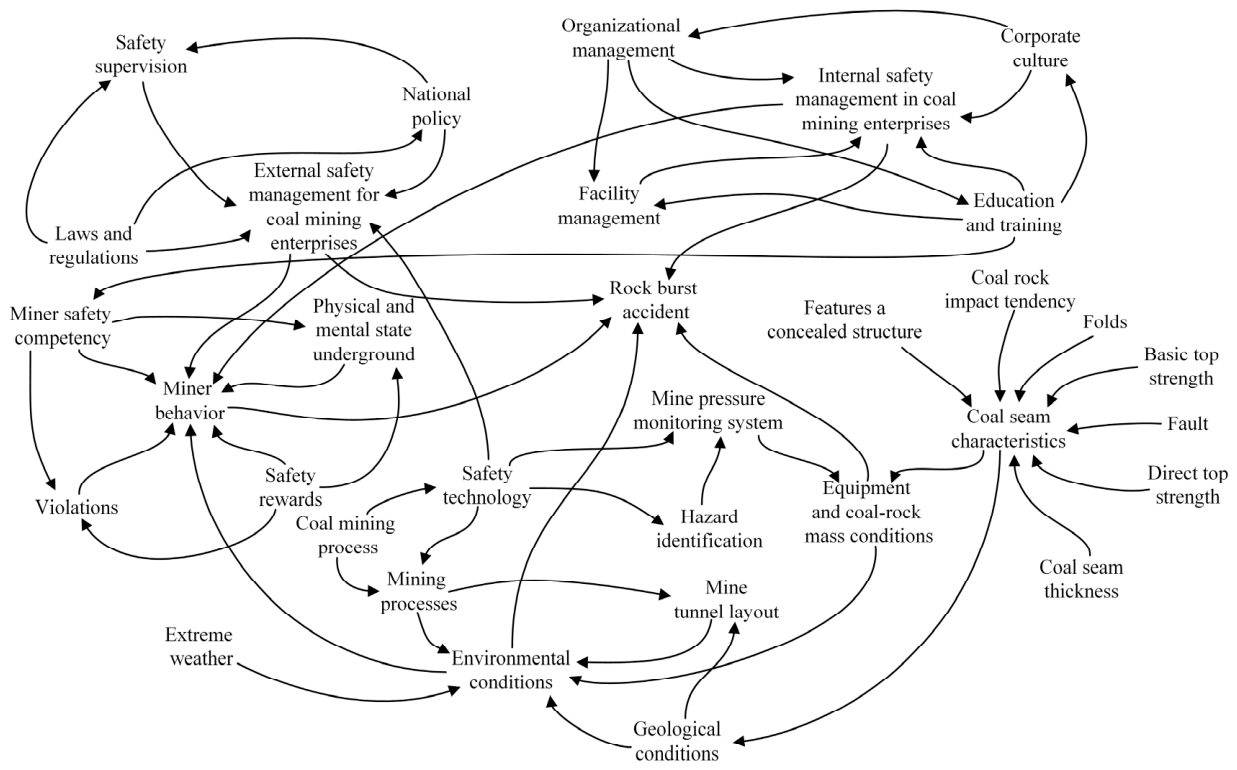
In nonlinear systems, a minute error in a certain factor can, under appropriate conditions, produce an exponential amplification effect through positive feedback mechanisms. In actual production processes, due to the inevitable interference of external factors on the system, minor errors at the initial moment can be amplified over time, leading to unpredictable consequences. As shown in
Figure 9, the direction of the arrows indicates that the latter factor influences the former factor. Minor inconsistencies in safety rewards can be amplified through positive feedback loops within the complex coal mining system. This initially affects miners’ physical and mental state underground, potentially causing complacency and distracted attention, which in turn fosters unsafe behaviors. Ultimately, through the interplay of systemic factors, these issues can escalate into rock burst accidents. This demonstrates that even slight variations in safety incentives may lead to unpredictable shifts in accident outcomes. The butterfly effect reveals the immense potential impact of minute changes: for instance, the slight flutter of a butterfly’s wings in the Amazon rainforest could theoretically trigger a tornado in TX, USA. More crucially, even the slightest variation in that wing flutter might alter the tornado’s path.
On 20 October 2018, a major rock burst incident occurred in the drainage tunnel and No. 3 connecting tunnel of the 1303 working face at Shandong Longyun Coal Industry Co., Ltd., a subsidiary of Shandong Energy Longkou Mining Group. The accident resulted in 21 fatalities and 4 injuries [
4]. The following factors contributed to this rock burst incident. First, the accident area exhibited high self-weight stress, meeting both the stress conditions and propensity for rock burst occurrence. Second, the disturbance caused by tunneling and rib pressure-relief drilling operations. Third, inadequate implementation of individual protective measures at Longyun Coal Mine. Fourth, untimely revisions to Longyun Coal Mine’s rock burst prevention regulations. Fifth, the safety training and education on rock burst prevention at Longyun Coal Mine proved ineffective. Sixth, the technical supervision and inspection of rock burst prevention measures were inadequate. Seventh, the Coal Administration failed to assign adequate priority to safety oversight for rock burst prevention and control. These factors interact and amplify one another, thereby triggering rock burst accidents.
This study conducts a thematic analysis on the safety management dimensions of rock burst. Through a comprehensive importance ranking of 22 fundamental safety management events, the top five critical factors identified are: X17 (failure to establish a mine pressure monitoring organization), X19 (inaccurate mine pressure monitoring results), X20 (inadequate hazard investigation), X18 (inability to understand rock mass movement patterns), and X21 (inadequate coal mine supervision). Research indicates that management oversights not only constitute risk sources in themselves but also interact with other technical factors. Under positive feedback mechanisms, these interactions significantly amplify the overall instability of the system, thereby triggering accidents. This process of multi-factor coupled amplification profoundly demonstrates the mechanism of the “butterfly effect” in nonlinear systems: a minute deviation in initial conditions, through dynamic interactions and cascading amplification within the system, ultimately leads to catastrophic consequences.
In previous studies, analyses of the causes of coal mine safety accidents have primarily focused on engineering and technical aspects such as geological conditions [
72], mining activities [
73,
74], and equipment factors [
75,
76]. In their research, Pan et al. [
25] highlighted the critical role of safety management. They argued that, as a systems engineering task influenced by multiple coupled factors, effective prevention and control must be grounded in scientific management practices throughout all mining operations. In his research on rock burst risk assessment, Liu et al. [
28] developed a multi-level fuzzy comprehensive evaluation model encompassing three primary influencing factors: geological conditions, mining techniques, and safety management. However, regarding the safety management factor, he only mentioned three secondary influencing factors—monitoring and early warning, personnel training, and emergency response plans—without conducting an in-depth analysis. While these studies have indeed revealed some of the underlying mechanisms of coal mine safety accidents, they have not yet fully incorporated the critical element of management. Nor have they adequately explained how the interplay of multiple factors leads to nonlinear amplification. Building upon existing research, this study further incorporates management factors into the analytical framework, focusing on examining the complex coupling relationships among the four major subsystems: geology, mining, equipment, and management. This study argues that coal mining enterprises should place management factors and technical factors on equal footing, emphasize the coupling mechanisms between them, establish a comprehensive risk management system covering the entire process, pay attention to every stage of production, and comprehensively enhance their capacity to prevent and control systemic risks.
In this study, chaos theory is introduced as a conceptual framework to explain the nonlinear amplification mechanism of multi-factor interactions rather than as a quantitative dynamic modeling tool. Due to the lack of continuous monitoring time-series data, chaos-related quantitative parameters cannot be directly calculated. Future research should combine dynamic monitoring datasets with nonlinear system identification methods to quantitatively characterize the evolution trajectory of rock burst hazards.
4.8. Analysis of an Integrated Accident Causation Model for Rock Bursts
The integrated accident model is a systematic analytical framework that synthesizes multidisciplinary theories, multi-factor interaction mechanisms, and dynamic evolutionary patterns. Its core lies in explaining the accident causation mechanisms within complex systems.
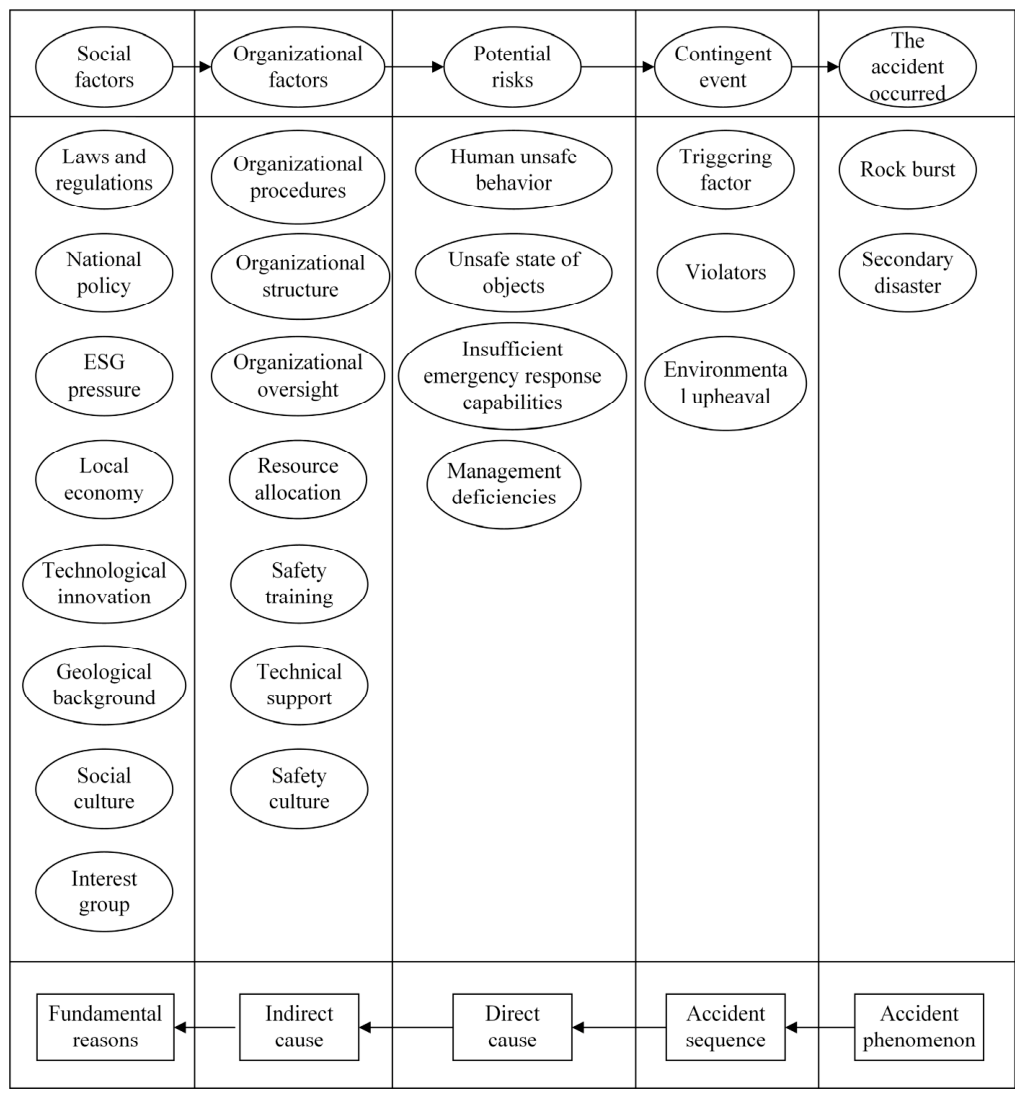
Figure 10 presents a comprehensive theoretical model for rock burst accidents. This model transcends the limitations of single-factor or linear causality. It conceptualizes rock burst accidents as a systemic failure resulting from the dynamic coupling of human, machine, environmental, and management subsystems. In this view, accidents occur when persistent abnormal disturbances accumulate beyond the system’s resilience or fault-tolerance capacity.
The occurrence of rock burst accidents represents a classic case of the comprehensive accident model in terms of its causal mechanism. It represents the result of progressive interactions among multiple-level factors, encompassing the entire chain from foundational conditions to direct triggers and subsequent impacts. Specifically, the model categorizes incentives into three progressively interconnected tiers: Fundamental causes include geological conditions, sociocultural factors, national policies, and regional economies, which collectively create underlying environmental and social risks that may lead to accidents. Indirect causes are rooted in socio-organizational factors and encompass organizational dysfunction, structural flaws, procedural gaps, poor management, a weak safety culture, and inadequate training. These factors intertwine to create underlying risks that contribute to accidents. The direct cause is the trigger point of the accident, primarily encompassing unsafe human behaviors (such as violating operating procedures), unsafe conditions of objects, and sudden environmental changes. These triggering factors directly cause rock burst accidents and may even induce secondary disasters with greater hazards, such as gas out burst, coal dust explosions, and surface subsidence. Furthermore, the organizational errors underlying rock burst accidents stem from societal factors, while specific hazards are often triggered by unintended contact between personnel and objects. The entire evolution of a rock burst incident fully demonstrates the dynamic coupling pathway from root causes to direct triggers.
In the field of coal mine safety research, existing literature predominantly focuses on the direct causes of accidents, such as unsafe human behavior [
28,
29] and unsafe equipment conditions [
30,
31]. While such studies reveal the surface-level mechanisms triggering accidents, they struggle to systematically explain the deeper structural causes underlying them. Building upon this research framework, this study introduces the integrated accident system theory as an analytical model. It extends the perspective beyond direct triggering factors to encompass underlying social, organizational, and managerial dimensions, thereby constructing a three-tiered explanatory pathway: foundational, indirect, and direct. By systematically revealing the structural deficiencies in social systems, organizational operations, and management practices that contribute to rock burst accidents, this study not only addresses the shortcomings of traditional analyses in examining underlying causes but also fundamentally expands the boundaries of understanding regarding the origins of rock burst accidents. This theoretical advance helps move beyond fragmented, isolated identification of causes, providing the basis for a multi-tiered and inclusive management system for rock burst control.
5. Conclusions
This study integrates fuzzy probability theory with gray relational analysis, incorporating the bow-tie model, chaos theory, and the comprehensive accident model to construct a composite analytical framework for systematically evaluating the full-process risks of rock burst accidents. Key findings are as follows:
First, fuzzy methods based on expert judgment yielded probability data for each basic event in rock burst accidents. This data can be utilized for quantitative risk analysis of rock burst occurrence. By establishing an FT-BN model comprising 56 basic events (BEs) and 22 intermediate events, the causal relationships of rock burst accidents were analyzed, yielding a calculated probability of 9.16 × 10⁻¹² for the occurrence of a top event (TE).
Second, the comprehensive importance index for each basic event was calculated through gray relational analysis, systematically evaluating the influence of each basic event on the top event by comprehensively considering different aspects of the basic events. The comprehensive importance ranking for management aspects is X17 > X19 > X20 > X18 > X21, indicating that basic events X17, X19, and X20 contribute most significantly to the occurrence of rock burst accidents in terms of management. Therefore, these three basic events should be the primary focus of safety measures for rock burst prevention.
Third, this study employs the bow-tie model for the first time to analyze the inadequate investigation of key fundamental hazards. The left side of the model outlines 11 preventive safety measures, while the right side details 10 mitigating safety measures, each dedicated to preventing accidents from occurring and reducing their consequences, respectively.
Fourth, research findings based on chaos theory reveal that rock burst accidents exhibit sensitivity and inherent randomness, necessitating consideration of risk factors during the initial stages to prevent such accidents. Rock burst accidents result from the mutual coupling and exponential amplification of failures within subsystems such as personnel, equipment, environment, and management. Preventing rock burst accidents requires addressing these vulnerabilities. Comprehensive theoretical models indicate that organizational errors in rock burst accidents stem from societal factors. Governments should establish regulations and controls through national policies, statutes, and laws to prevent coal mining enterprises from neglecting safety production strategies, thereby averting rock burst accidents.
Although this study developed a composite analytical model for systematically evaluating the full-process risks of rock burst accidents and conducted empirical research based on 22 domestic accident investigation reports from 2010 to 2024, the following limitations remain:
First, the data has temporal and spatial limitations, as all cases are drawn from Chinese coal mines after 2010. This deeply roots the model within China’s specific geological conditions, technological capabilities, and safety management systems. The applicability of the research findings to other mining-developed countries and regions requires further validation. In the future, it will be possible to collect and analyze international rock burst accident cases, conducting cross-regional and cross-cultural comparative studies to validate and refine existing models, thereby distilling more universally applicable patterns of rock burst causation.
Second, although we introduced chaos theory to conceptually elucidate the dynamic characteristics of rock burst systems—such as sensitivity to initial conditions and long-term unpredictability—this qualitative insight has not been fully and quantitatively integrated into the core probabilistic model. Subsequent research may establish a dynamic risk assessment system featuring a computational architecture based on dynamic Bayesian networks and system dynamics, driven by multi-source monitoring data, and incorporating quantified chaos indicators as criteria for system stability. This approach would facilitate the transition from static risk assessment to continuous evolutionary simulation, thereby providing a theoretical foundation and engineering application platform for precise early warning and prevention decisions regarding rock burst hazards.
Third, while the control barriers on the right side of the bow-tie diagram are listed, their reliability, availability, and susceptibility to human factors in actual production are difficult to quantify precisely. The model assumes these barriers function flawlessly when needed, but this falls short of the complex realities of downhole operations. In the future, human reliability analysis techniques can be more systematically integrated into the model to quantify the probability of human errors under different operational scenarios and organizational atmospheres. This will enable risk assessments to more accurately reflect the overall risk of the human–machine–environment–management system.





 ,
,