Article

Modeling and Optimization of an Automatic Temperature Control System for the Catalytic Cracking Process


by
Yury Ilyushin
*,
Alexander Vitalevich Martirosyan
,
Mir-Amal Asadulagi
and
Tatyana Kukharova
System Analysis and Control, Empress Catherine II Saint Petersburg Mining University, 199106 Saint Petersburg, Russia
*
Author to whom correspondence should be addressed.
Modelling 2026, 7(2), 68; https://doi.org/10.3390/modelling7020068
Submission received: 4 March 2026 / Revised: 25 March 2026 / Accepted: 26 March 2026 / Published: 30 March 2026

Abstract

Modern oil refining is faced with the need to maximize raw material processing in the face of fierce competition and environmental requirements. Therefore, the fluid catalytic cracking (FCC) process, key to the production of high-octane gasoline, requires special attention to automation efficiency. Maintaining optimal reactor temperature is a complex scientific and technical challenge, the solution to which directly impacts the yield of target products and the service life of the catalyst. Existing automatic control systems often fail to cope with process transients, nonlinearities, and time delays, making the search for new control approaches highly relevant. The scientific significance of this study lies in the system analysis and quantitative comparison of the effectiveness of classical control laws (P, PI, PID) applied to a plant with a delay. For the first time, a rigorous comparative analysis of tuning methods—analytical (based on phase margin specifications) and automated (using the PID Tuner tool in MATLAB Simulink R2024b)—is performed for a plant characterized as a second-order system with time delay, formed by the series connection of two first-order lag elements with transport delay. The results contribute to automatic control theory by clearly demonstrating the limitations of the proportional controller and the insufficient speed of the integral controller, as well as confirming the hypothesis that a PID law is necessary to achieve a balance between accuracy and response speed under inertia conditions. The practical significance of the work is confirmed by the development of an optimized automatic temperature control system. Using the PID Tuner tool, we achieved critical industrial performance indicators: zero static error, minimal control time (44 s), and acceptable overshoot (9.6%). The system’s robustness (maintaining stability with changes in plant parameters by 30–40%) and its invariance to the main disturbance (catalyst temperature fluctuations), confirmed during simulation, guarantee the viability of the proposed solution under real-world production conditions. Implementation of such a controller will minimize deviations from the process conditions, leading to increased yield of light petroleum products and an extended service life of the expensive catalyst, providing direct economic benefits.

1. Introduction

The oil refining industry is a fundamental pillar of the fuel and energy complex and a key component of the economy. Given the exhaustion of extensive development potential, stricter environmental safety requirements, and volatility in global hydrocarbon prices, the strategic priority for the industry is to achieve maximum depth and efficiency in raw material processing. A pivotal role in addressing this challenge is played by the catalytic cracking process—one of the most flexible and technologically complex secondary oil refining processes. This process directly dictates both the yield and the quality of high-octane gasoline, along with other valuable light fractions.
Despite the widespread use of this process, its automation faces several serious challenges. Catalytic cracking is characterized by non-stationarity due to the variability of the physicochemical properties of the feedstock, intense heat generation, and stringent safety requirements. The key parameter determining the kinetics of reactions, process selectivity, and the rate of catalyst deactivation is the temperature within the reactor unit. Deviation of the temperature from the optimal range leads to severe consequences: a reduction in the yield of target products, accelerated catalyst coking, increased energy consumption, and higher harmful emissions. Existing classical automatic control systems (ACS) often fail to maintain the temperature within specified limits due to the non-linearity of the object and the presence of time delays. This makes the problem of synthesizing an effective control system extremely relevant for modern oil refining.
The aim of this study is to improve the efficiency of the catalytic cracking process by developing and optimizing an automatic control system for the temperature regime in the reactor.
To achieve this aim, the following objectives are addressed in this work:
  • Analysis of the technological process as a control object: identifying the main factors influencing the reactor’s temperature regime and determining the control channels.
  • Development of a mathematical model of the control object, describing the relationship between the feedstock temperature at the reactor inlet and the temperature in the reaction zone, taking into account dynamic characteristics and time delays [1].
  • Synthesis and parametric tuning of automatic control systems using standard control laws—proportional (P), proportional-integral (PI), and proportional-integral-derivative (PID)—employing both analytical methods (based on phase margin specifications) and automated tuning tools (minimising the Integral of Time-weighted Absolute Error, ITAE).
  • Modeling and comparative analysis of the control performance of the synthesized ACS in the MATLAB Simulink environment based on key indicators: steady-state error, settling time, and overshoot [2,3].
While the primary focus of this study is on temperature control, it is important to acknowledge that the FCC process involves complex interactions between multiple variables, including reactor pressure, catalyst circulation rate, and feedstock flow. Temperature deviations inevitably affect these variables and vice versa. However, given that temperature is the dominant factor determining reaction kinetics and catalyst deactivation rate, this study concentrates on the temperature control loop while recognising the interconnected nature of the process [4,5].
A significant number of studies have been devoted to the investigation of catalysts and their influence on the cracking process. The synergistic effects of Y-zeolite and amorphous aluminosilicate as FCC catalyst components, with a particular focus on coke formation, were investigated [6,7]. Progress in the development of zeolite catalysts for cracking heavy petroleum fractions has been analyzed, emphasizing the importance of optimizing acid properties and porous structure [8,9]. The nonlinear dependence of product yield on the catalyst/feed ratio has been experimentally demonstrated [10,11]. An innovative approach to obtaining highly active zeolites using ball milling, which significantly increases catalytic activity, was proposed [12,13]. With the tightening of environmental requirements and the need to diversify raw materials, research into the processing of alternative raw materials is actively developing. This includes analyses of emission reduction possibilities in oil refining modernization [14,15], prospects for the joint conversion of seaweed biomass for bioenergy [16,17], optimization of kerosene-like fuel production from plastic waste using iron-modified dolomite and activated carbon [18,19], and the mechanism of FCC-sludge ratio influence on marine fuel oil stability [20,21]. The time delay inherent in the FCC reactor—stemming from feedstock transport, catalyst circulation, and measurement lags—poses a significant challenge for controller design. For the analysed plant configuration, the delay-to-time-constant ratio exceeds 0.5, justifying the use of specialised tuning methods such as the Ziegler-Nichols frequency response method and the Cohen-Coon approach, which are specifically designed for processes with significant time delays. These methods form the basis of the analytical tuning presented in this work.”
In addition, this study presents a tabular overview of the literature on additional factors under investigation, categorized by the nature of the challenge they present for the FCC process (Table 1).
The literature review shows that, despite a significant number of studies devoted to catalysts, raw materials and modelling of the catalytic cracking process, issues related to the synthesis and optimisation of automatic temperature control systems using modern tuning methods remain insufficiently studied. The challenges identified in Table 1, such as maintaining thermal stability (temperature problems), managing the complex chemical kinetics (chemical problems), handling multiphase flow dynamics (physical problems), and ensuring economic viability under strict safety constraints (economic problems), collectively create a complex environment for control system design. Existing studies either focus on fundamental aspects of the process or propose complex control systems based on fuzzy logic and neural networks, which can be difficult to implement in industrial settings [97]. This study fills this gap by proposing a systematic approach to the synthesis and optimisation of a PID controller for reactor temperature control using both analytical methods and modern automatic tuning tools [98]. This study fills this gap by proposing a systematic approach to the synthesis and optimisation of a PID controller for reactor temperature control using both analytical methods and modern automatic tuning tools. By bridging classical control theory with the operational demands of the refining industry, this work demonstrates how optimised PID controllers can achieve robustness and performance where traditional tuning methods fall short.

2. Description of the Technological Process

Catalytic cracking is one of the key processes in the oil refining industry, designed to convert heavy oil fractions into lighter and more valuable products such as petrol, propylene, butylenes, diesel fuel and light gas oil. Currently, this process is the main method for producing high-octane petrol.
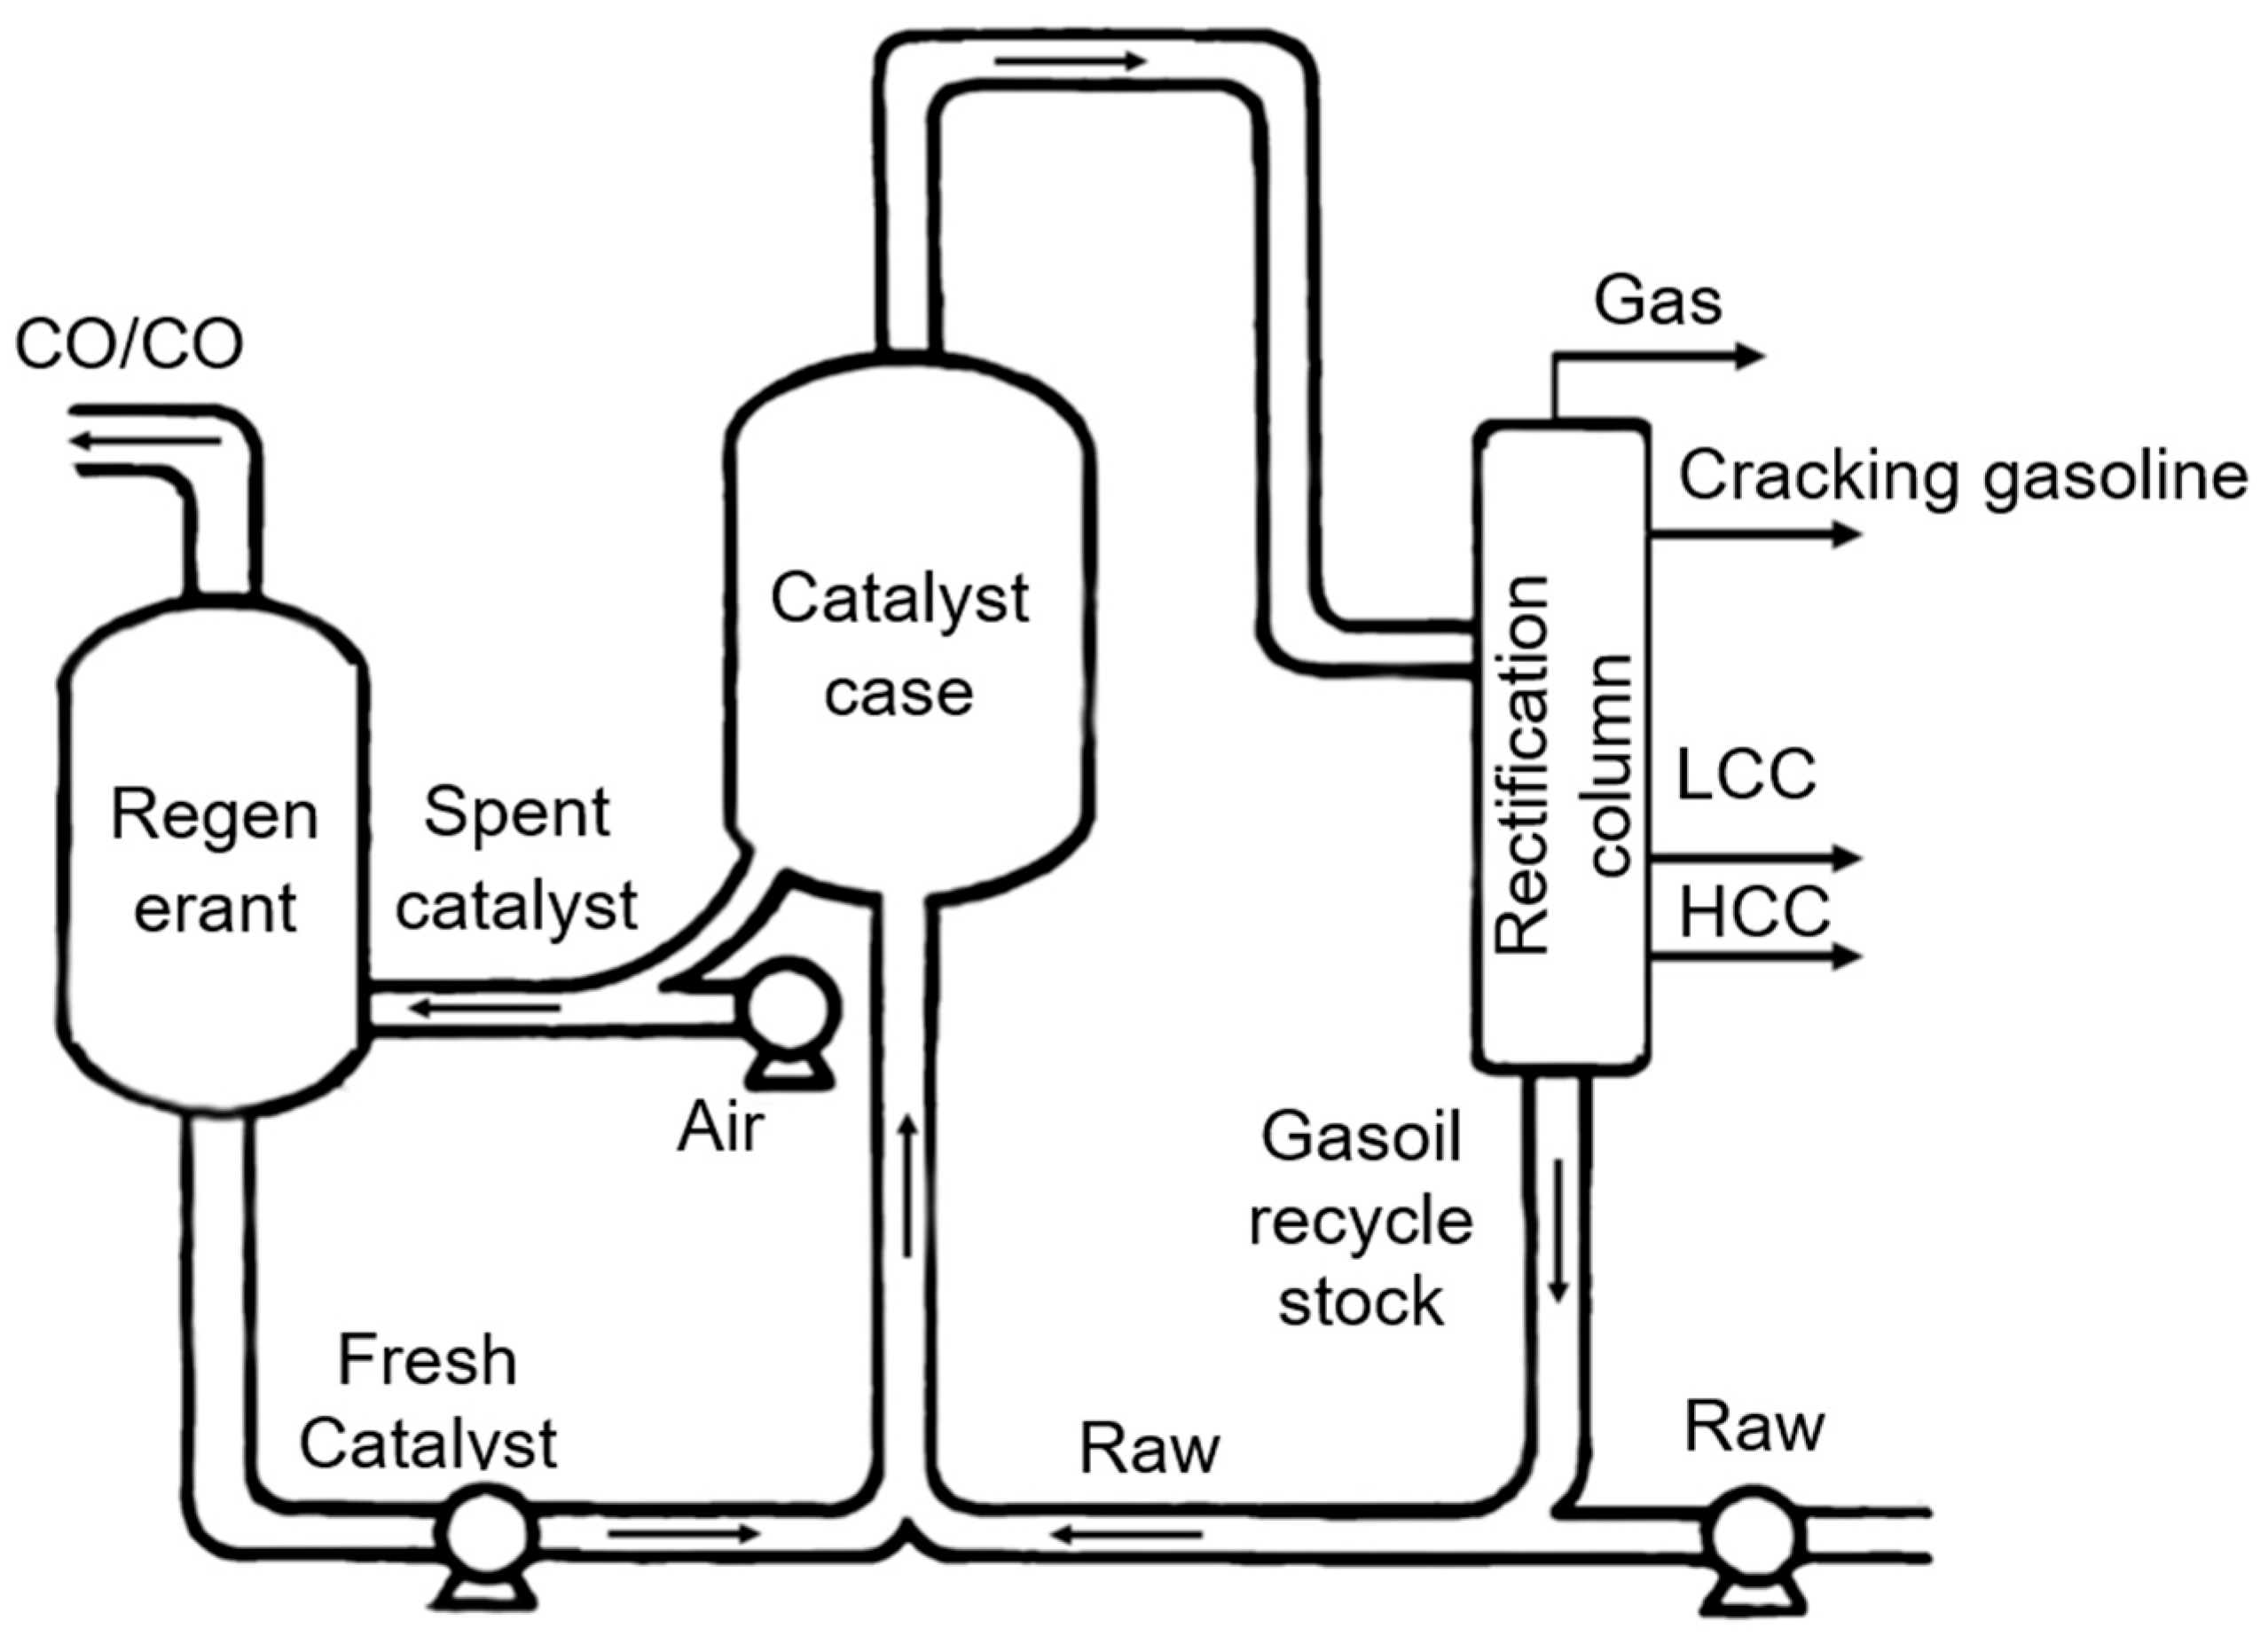
The product range of the process includes dry gas (3–5% by mass), propylene (5–15%), high-octane gasoline (40–60% with a sulfur content of less than 50 ppm), light gas oil (15–25%) and coke (4–6%). Catalytic cracking is a complex technological process carried out in a specially designed unit consisting of several key elements, each of which performs strictly defined functions. The design and operating principle of such a unit are discussed below (Figure 1) [99].
The reactor unit serves as the central technological node of the FCC unit. Its primary component is a vertical tubular reactor—commonly referred to as the riser—where the primary cracking reactions occur.
Raw materials preheated to a temperature of 250–350 °C, such as vacuum gas oil or other heavy petroleum fractions, are fed into the lower section of the riser. At the same time, a regenerated catalyst with a temperature of 650–700 °C is fed into the reactor zone. The mass ratio of circulating catalyst to feedstock is maintained in the range of 5:1 to 10:1. Strictly regulated operating conditions are created in the riser: a temperature of 500–550 °C, a pressure of 1–3 bar, and a contact time between the feedstock and the catalyst of 1–5 s. These parameters ensure the optimal depth of the cracking reactions while minimising the rate of coke formation [100]. The separation unit is designed to separate the reaction mixture into a vapour phase of products and spent catalyst. After leaving the riser, the multicomponent mixture is sent to cyclone separators, where centrifugal forces effectively separate solid catalyst particles from hydrocarbon vapours. Modern separator designs provide a solid phase capture rate of up to 99.9%. The separated product vapours are transported to the fractionation section, and the catalyst, containing 3–6% by mass of coke deposits, enters the regenerator. The regeneration unit performs the critical function of restoring catalytic activity. In the regenerator, which is a device with a fluidised bed of catalyst, coke-like deposits are burned off at a temperature of 650–750 °C. Air supplied to the lower part of the device oxidises the coke to carbon oxides (CO2 and CO). The heat of the exothermic oxidation reaction, which is approximately 4–6 MJ per kilogram of processed raw material, is accumulated by the catalyst, which then recirculates back into the reactor zone.
The temperature regime in the regenerator is subject to strict control, as temperatures above 800 °C can cause irreversible thermal deactivation of the catalyst due to the destruction of the zeolite matrix. The catalyst circulation system is a complex engineering structure consisting of catalyst transport lines, pneumatic transport systems and control valves. Continuous circulation of the catalyst between the reactor and the regenerator is carried out at a flow rate of up to 1000 tonnes per hour. This flow is regulated by specialised valve systems and sluice devices, which ensure the tightness of the process circuit and accurate dosing of the solid phase.
The cracking product fractionation system includes several sequential separation stages. The initial separation of the reaction mixture takes place in a rectification column, where it is separated into a gas fraction, a gasoline fraction, and light and heavy gas oil. The resulting gas fraction is sent to a gas fractionation unit for subsequent separation of dry gas (C1–C2 hydrocarbons), propylene, butanes and butenes. Each of the fractions obtained undergoes additional purification and stabilisation stages before being transferred to storage or subsequent technological processes. The thermal energy of the regenerator flue gases is utilised in waste heat boilers to generate process steam. In modern plants, 85–90% of the heat released during regeneration is recovered, which significantly reduces external energy consumption. The circuit includes numerous heat exchangers in which heat exchange between hot cracking products and cold raw materials takes place, optimising the overall heat balance of the unit.
The gas emission purification system ensures the environmental safety of the technological process. The flue gases from the regenerator undergo multi-stage purification: in the first stage, the bulk of the catalyst dust is removed in cyclone separators, then in electrostatic precipitators or bag filters, a capture rate of up to 99.99% of solid particles is achieved. Scrubbers with alkaline solutions are used to absorb sulphur oxides, and catalytic systems are used to reduce nitrogen oxides. Modern installations ensure emission concentrations of: SOx < 50 mg/m3, NOx < 100 mg/m3, solid particles < 20 mg/m3.
The catalytic cracking process is carried out in a reactor-regenerator system. The reactor maintains a temperature range of 500–540 °C at a pressure of 1.5–3.0 bar. The process is characterised by a high flow rate: the contact time between the raw material and the catalyst is 3 to 5 s at a linear flow rate of 8–15 m/s.
The regenerator operates under more severe conditions: a temperature of 650–750 °C ensures the burning of 85–95% of the coke deposited on the catalyst surface. The heat balance of the process is estimated at 4–6 MJ per kilogram of raw material processed [100,101].
Modern catalysts are complex composite materials. They are based on Y-zeolite (USY) with a pore size of 0.74 nm and a specific surface area of 600–800 m2/g. The amorphous aluminosilicate matrix with a pore diameter of 10–100 nm demonstrates 60–80% activity in the MAT test. To modify the functional properties, additives are introduced into the catalyst composition: ZSM-5 (5–25%) to increase the yield of olefins, phosphorus (0.5–1.5%) to stabilise the structure, and rare earth elements (La, Ce) to increase thermal stability [102,103].
The product range of the process includes dry gas (3–5% by mass), propylene (5–15%), high-octane gasoline (40–60% with a sulfur content of less than 50 ppm), light gas oil (15–25%) and coke (4–6%) [104,105].
The combustion mode is typically partial (with a CO/CO2 ratio controlled by catalyst promoters), which moderates the exothermic heat release and prevents excessive temperatures that could damage the catalyst structure.
All technological systems form a single interconnected complex. The operation of a catalytic cracking unit requires precise synchronisation of all processes and continuous monitoring of a multitude of technological parameters. Modern plants operate continuously for 7000–8000 h per year, processing millions of tonnes of raw materials to produce a wide range of petroleum products that are in demand in the energy and petrochemical synthesis industries.

Process Variables and Control Challenges

The FCC unit can be characterised by the following control-relevant variables:
Manipulated Variables: Slide valve position controlling regenerated catalyst flow rate (primary), fuel gas flow rate to the feedstock furnace (secondary), regenerator air flow rate.
Controlled Variables: Riser outlet temperature (primary), regenerator bed temperature, reactor-regenerator pressure differential.
Disturbances: Feedstock composition (API gravity, Conradson Carbon Residue, metal content), feedstock preheat temperature, ambient conditions, and catalyst activity decay over time.
The thermal coupling between the reactor and regenerator represents the most significant control challenge. Any disturbance affecting coke formation directly alters the regenerator heat balance, which in turn affects the reactor temperature with a time delay corresponding to catalyst circulation time.

3. Raw Material Base of the Process

Catalytic cracking plants use a wide range of petroleum raw materials, varying in origin, physical and chemical properties, and technological characteristics. The main raw material component is traditionally vacuum gas oil (VGO), obtained by vacuum distillation of fuel oil. This type of raw material is characterised by a boiling point of 350–550 °C, a density of 0.89–0.93 g/cm3 and a sulphur content of 0.5–2.5%. The coking tendency of vacuum gas oil usually does not exceed 0.1–0.5%, which determines its technological applicability [106].
To increase the efficiency of the process, hydrotreated vacuum gas oil is often used, which is characterised by a lower sulphur content (<0.5%) and a minimum concentration of metal impurities (nickel and vanadium < 1 ppm). This raw material provides increased yields of light petroleum products and extends the inter-regeneration cycle of the catalyst.
Deasphaltates, which are products of bitumen processing after the removal of asphaltenes, can be used as additional raw materials. These fractions are characterised by a density of 0.92–0.96 g/cm3 and an asphaltene content of <0.5%. However, deasphaltates usually require blending with vacuum gas oil due to their increased density and coking tendency.
Some modern plants are capable of processing partially atmospheric residue, although this feedstock is characterised by increased coking tendency (up to 8%) and significant metal content (total Ni + V up to 30 ppm). To work with such feedstock, it must first be hydrotreated and specialised catalyst systems must be used.
Secondary gas oils, including coking and thermal cracking products, can also be sent for processing. These fractions contain increased amounts of olefins and are characterised by high coking properties, which require adjustment of the process conditions. In practice, blended feedstocks combining various components in optimal proportions are widely used. Typical combinations include mixtures of vacuum gas oil with 10–30% deasphaltate or with 5–15% atmospheric residue. In recent years, the use of alternative raw materials such as hydrotreated vegetable oils, synthetic oils (produced using CTL and GTL technologies) and pyrolysis oils from plastic waste has been expanding [107].
The criteria for selecting raw materials are the following key parameters: coking should preferably be maintained at <0.5%, the metal content (Ni + V) should not exceed 2 ppm, and the sulphur content should preferably be below 1%. An important criterion is the fractional composition: the 95% distillation point of the optimal raw material should not exceed 550 °C.
The most technologically advanced raw material for most FCC plants remains hydrotreated vacuum gas oil with a limited content of heavy fractions. The use of heavier types of feedstock requires significant modification of both the process conditions and the catalyst systems used. Current trends are aimed at expanding the feedstock base by including secondary and alternative components in the process while maintaining high efficiency.
The chemical composition of the feedstock directly influences the reactor thermal balance. Paraffinic feedstocks (characterised by a high Watson characterisation factor, K > 12) are more easily cracked and exhibit higher endothermicity, requiring greater heat input. Aromatic feedstocks (K < 11) are more resistant to cracking and tend to produce more coke, which increases the heat load on the regenerator. This variability in feedstock quality necessitates a control system capable of adapting to changes in the thermal balance.
The specific heat capacity of the feedstock varies with its chemical composition, affecting the enthalpy balance in the preheating furnace and the riser. Heavier feedstocks, such as atmospheric residue, have higher heat capacities and require more energy to reach the target reactor inlet temperature. Moreover, the Conradson Carbon Residue (CCR) content directly determines the potential coke yield, which in turn dictates the heat released in the regenerator. A feedstock with 5–8% CCR can generate significant excess heat, requiring the control system to manage the catalyst circulation rate carefully.

4. Problem Statement

The temperature regime in the reactor is a critical parameter that determines both the kinetics of these reactions and the selectivity of the process as a whole.
The temperature in the catalytic cracking reactor is formed under the influence of a complex balance of heat flows and is determined by several interrelated factors. The main source of heat is the hot regenerated catalyst coming from the regenerator. The amount of heat transferred depends on the catalyst temperature (650–720 °C), its flow rate (the catalyst/feedstock ratio is usually 5–7:1) and heat capacity.
The thermal effect of cracking reactions, which are generally endothermic (absorbing 80–100 kcal/kg of feedstock), has a significant impact. However, when processing heavy feedstock with a high content of aromatic hydrocarbons, exothermic coking reactions can partially compensate for the endothermic effect. The temperature of the feedstock, which is usually maintained at 200–300 °C after heating in a tube furnace, plays an important role.
Additional factors include the degree of evaporation of the raw materials (depending on pressure and composition), heat loss through the walls of the apparatus, and the parameters of the dispersing steam input. A feature of the process is that the actual temperature in the reaction zone (at the outlet of the riser pipe) is 15–30 °C higher than in the reactor separator due to ongoing reactions [108].
The feedstock inlet temperature serves as a critical manipulated variable, as it directly influences the heat balance within the riser. A 10 °C increase in feedstock temperature typically results in a 2–3 °C rise in the reactor outlet temperature under constant catalyst circulation conditions, highlighting the sensitivity of the process to this parameter. An increase in the temperature of the raw material from 200 to 300 °C leads to an increase in the temperature in the reactor by 10–20 °C, all other conditions being equal. This is due to a decrease in the heat required for the evaporation of the raw material and a change in the heat balance of the system.
However, excessive heating of the feedstock (above 320 °C) can cause undesirable phenomena: premature thermal decomposition of the feedstock before contact with the catalyst, increased coking in the feed lines, and reduced efficiency of feedstock dispersion in the catalyst flow. The optimum heating temperature depends on the composition of the feedstock: higher temperatures (280–320 °C) are acceptable for light gas oil, while lower values (220–260 °C) are recommended for heavy feedstock to minimise coking.
The temperature control system in the catalytic cracking reactor is a multi-level structure comprising several control loops. The main control action is to change the flow rate of the regenerated catalyst into the reactor, which allows rapid compensation for temperature fluctuations. An increase in the flow of hot catalyst leads to an increase in the temperature in the reactor, and vice versa.
Among the auxiliary control parameters, the feedstock heating temperature occupies a prominent position; this variable is regulated by modulating the thermal load of the tubular furnace. Although this control loop exhibits considerable inertia, it enables fine adjustment of the overall temperature regime. In modern industrial installations, cascade control architectures are employed, wherein the output signal from the reactor temperature controller serves to adjust the setpoint for the raw material temperature control loop.
Effective temperature control allows maintaining the optimal conversion depth of raw materials (65–75%), ensuring maximum yield of light products (55–65%) and minimising coke formation (4–6%). Modern digital process control systems (DCS) integrate all control loops into a single complex, which significantly increases the stability of the plant as a whole.

Disturbances and Control Challenges

The effectiveness of the temperature control system is constrained by several key disturbances:
Feedstock Quality Variations: Changes in the Conradson Carbon Residue (CCR) or aromatic content alter the coke formation rate, directly impacting the regenerator heat balance. A 1% increase in CCR can increase regenerator temperature by 20–30 °C, requiring compensatory changes in catalyst circulation.
Catalyst Deactivation: Over time, the catalyst loses activity due to hydrothermal degradation and metal poisoning. To maintain conversion, the controller must gradually increase the reactor temperature setpoint or catalyst circulation rate, shifting the operating point.
Time Delay: The transport lag between the feedstock furnace and the reactor outlet temperature measurement introduces a delay of 7–10 s, complicating controller design and limiting achievable bandwidth.
Variable Coupling: The catalyst circulation rate simultaneously affects reactor temperature and the pressure differential between the reactor and regenerator. This coupling can lead to interactions between control loops if not properly addressed.

5. Research Methodology

Designing an automatic temperature control system for a catalytic cracking reactor using P, PI, and PID controllers involves a set of interconnected tasks. The synthesis process comprises several essential stages, each with specific requirements and demanding a methodical approach.
The first stage involves a thorough examination of the technological process, including an analysis of the heat and material balances within the reactor. It is essential to accurately identify the dynamic properties of the plant, specifically its gain, time constants, and time delay. These parameters enable the construction of an approximate mathematical model in the form of a transfer function, which serves as the basis for subsequent controller design.
The subsequent stage involves the synthesis of a structural diagram of the control system. For each controller type—P, PI, and PID—integration into the control loop must be considered, taking into account their distinct effects on the process. A proportional controller ensures a rapid response to disturbances but fails to eliminate steady-state error. A PI controller introduces an integral action that removes residual error, albeit potentially slowing system response. A PID controller incorporates a derivative component to enhance dynamic performance, though its tuning is more intricate [109].
Parametric synthesis of controllers requires the application of specialized computational techniques. For a P-controller, the primary task is selecting an optimal gain that balances responsiveness and stability. In PI controller design, the integration time must also be determined, accounting for process inertia. The most complex case is PID tuning, where three parameters—gain, integral time constant, and derivative time constant—must be established. This can be achieved using analytical approaches such as the Ziegler-Nichols method or the extended frequency response method, or through optimization routines available in specialized software packages.
System testing constitutes a critical phase of the work. Initially, mathematical modeling is carried out in environments like MATLAB Simulink, where system behavior is evaluated under various disturbances—including changes in feedstock temperature, fluctuations in catalyst flow, and variations in raw material composition. Particular focus is placed on analyzing transient responses, assessing settling time, overshoot, and steady-state accuracy [110]. For each controller, a set of performance criteria is defined, and based on these, the most suitable controller is selected. Such control configurations are commonly employed in modern catalytic cracking units, where automated systems are extensively used across refineries. However, existing implementations often fail to deliver adequate regulation of key process parameters, highlighting the need for optimization of current infrastructure [111].
A comprehensive analysis of the catalytic cracking process has confirmed that the temperature within the reaction zone is the most critical factor influencing overall process performance.
Based on this finding, it is proposed that incorporating an additional subsystem—designed specifically to maintain temperature within a defined range and generate appropriate control actions—would enhance the yield of cracking products while keeping feedstock and catalyst consumption rates constant [112,113].
For the synthesis and analysis of automatic control systems, MATLAB Simulink was chosen. This software is a de facto standard in the industry for control system design due to its extensive library of control blocks, built-in optimization tools (such as PID Tuner), and the ability to efficiently model dynamic systems described by transfer functions. While software packages like ANSYS Fluent or COMSOL 2024 R2 are indispensable for detailed 3D hydrodynamic modeling of the reactor’s internal geometry, they are less suited for the rapid prototyping and comparative analysis of various control laws (P, PI, PID) based on the object’s transfer function, which is the central focus of this study. The use of MATLAB Simulink for similar tasks in the synthesis of control systems for chemical technology objects is widely documented [114,115].
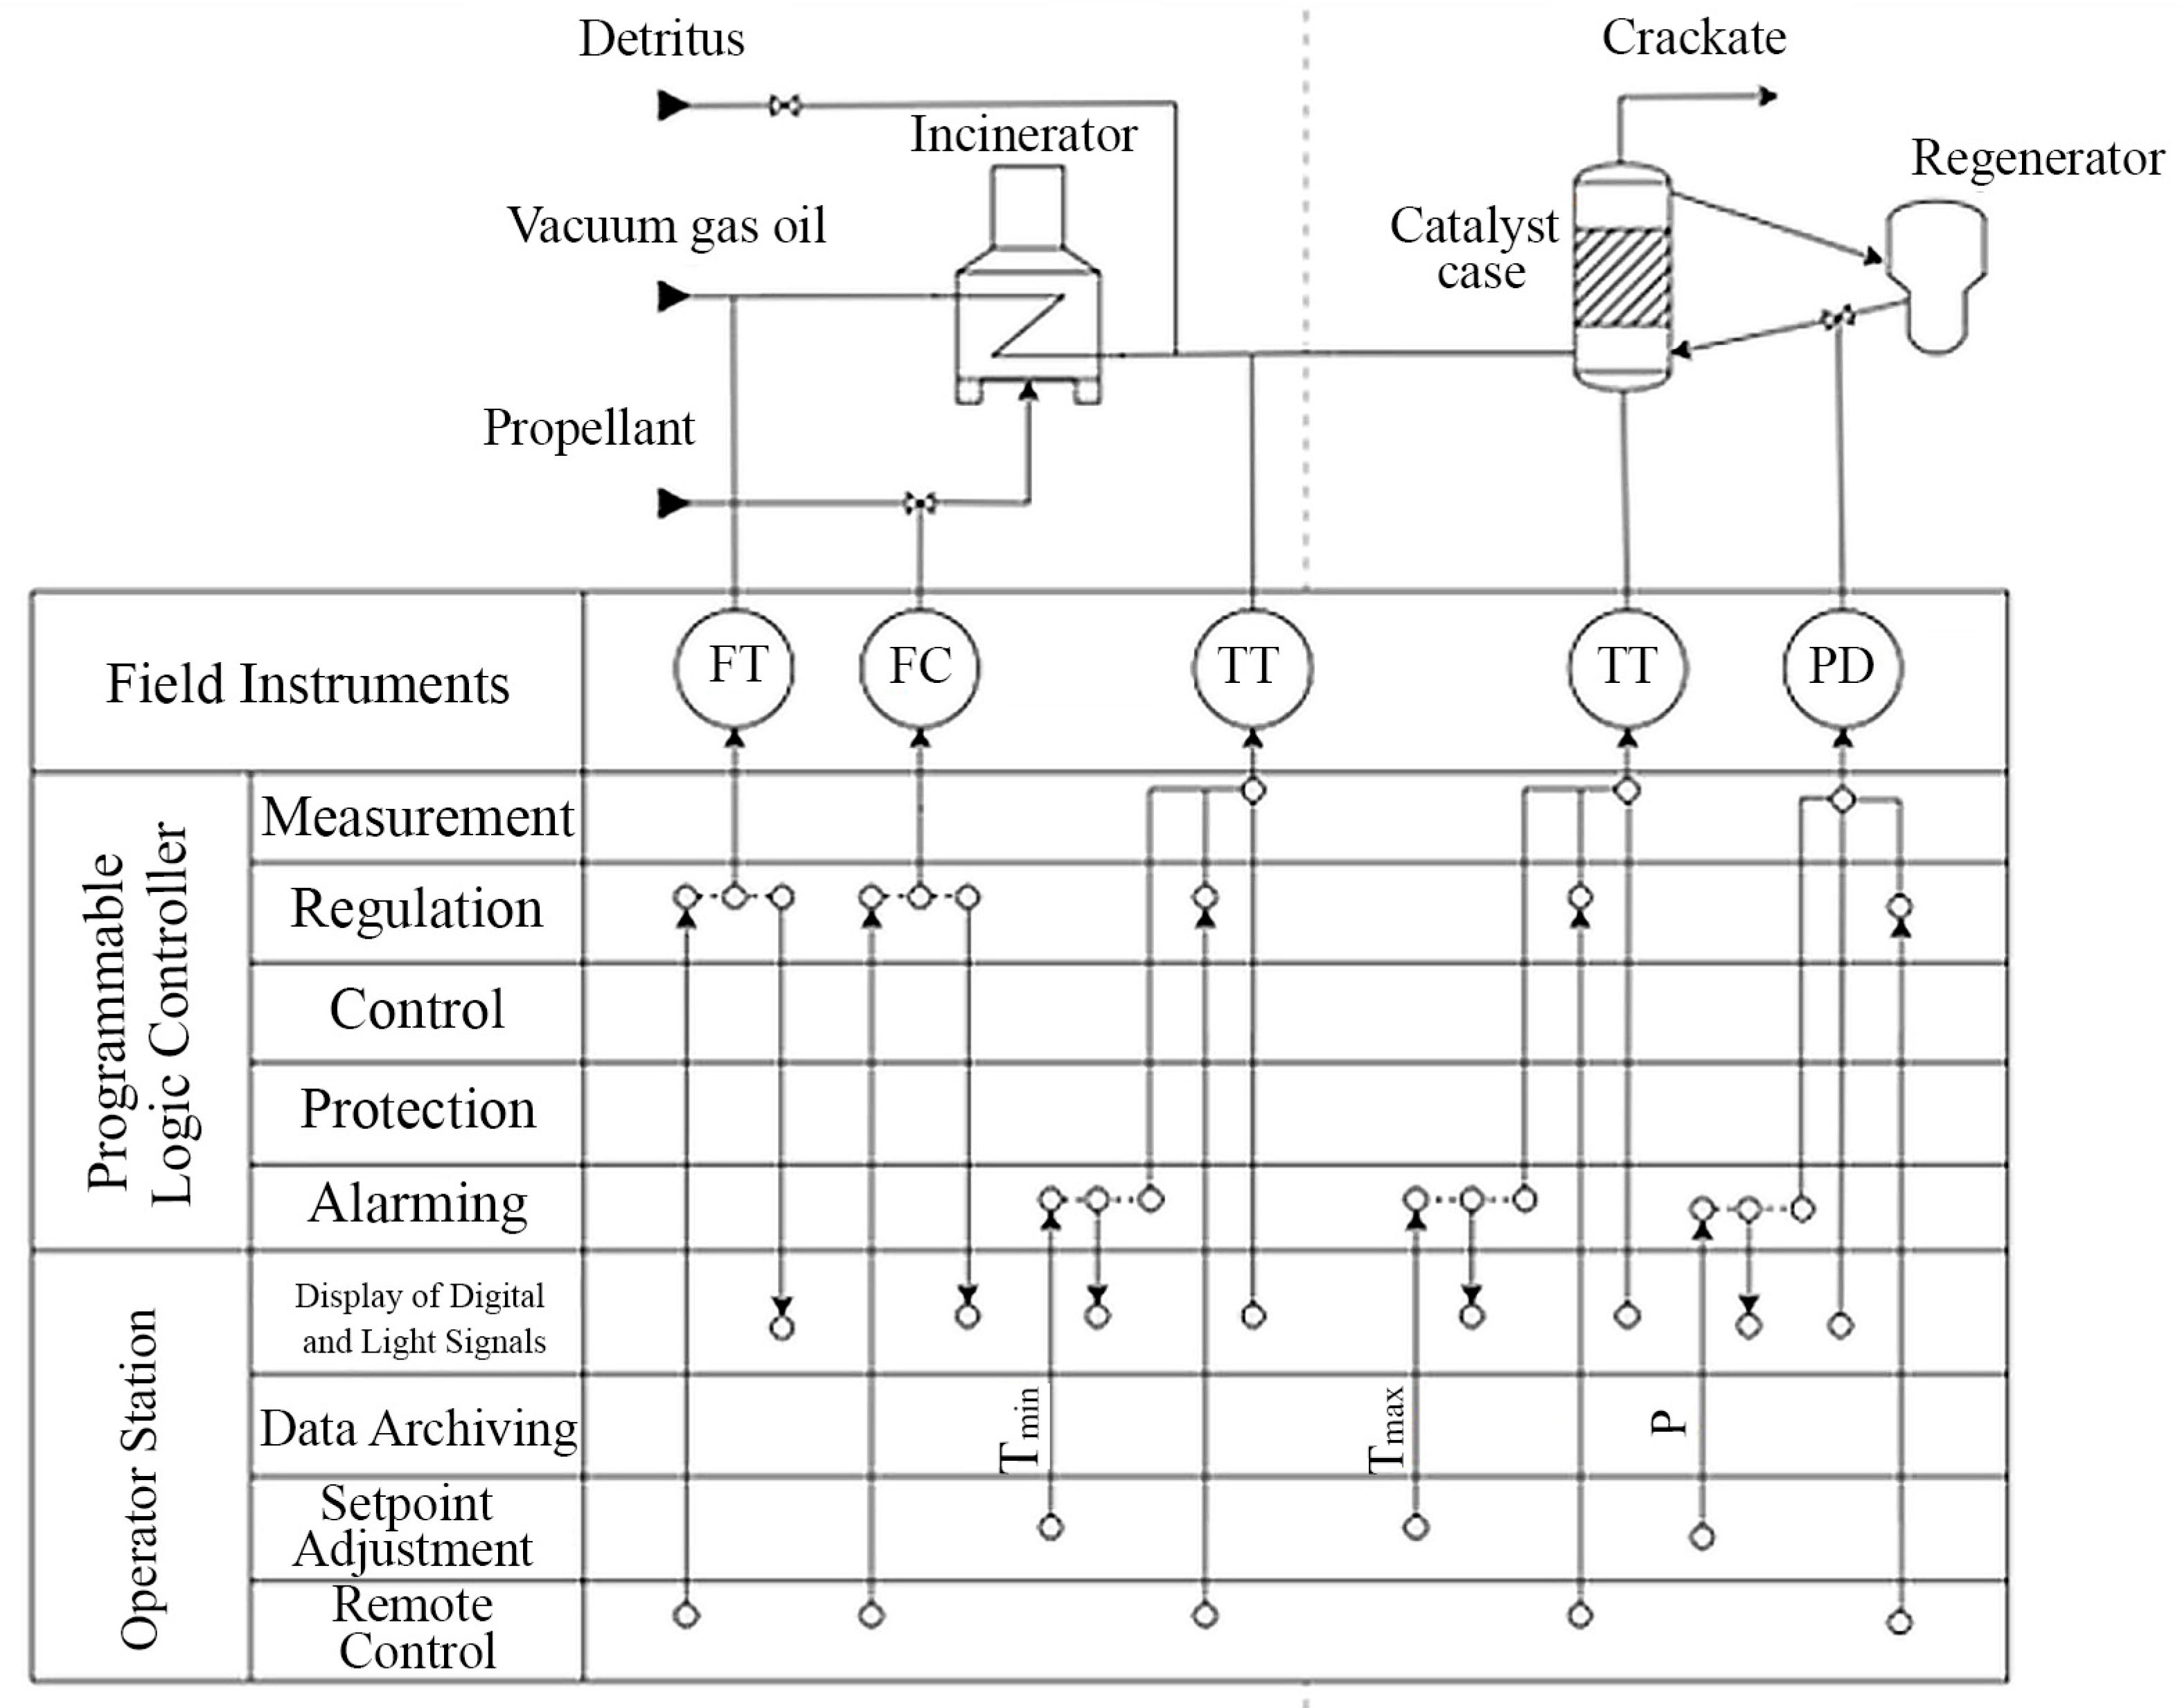
Synthesis of the control system. The functional diagram of the control object automation is shown in Figure 2.
The transfer function of the change in raw material heating temperature depending on the fuel consumption supplied to the heating furnace is a first-order aperiodic link with a delay:
W 1 s = 1.2 15 s + 1 e 3 s   .  
The transfer function of the reactor temperature dependence on the raw material inlet temperature is also represented by a first-order aperiodic link with a delay [39,40]:
W 2 s = 0.8 20 s + 1 e 7 s .
To model the control object, the MATLAB Simulink graphical modelling and simulation environment was used. After construction, the control object model will look as follows (Figure 3).
Figure 4 shows a simplified model of the control object.
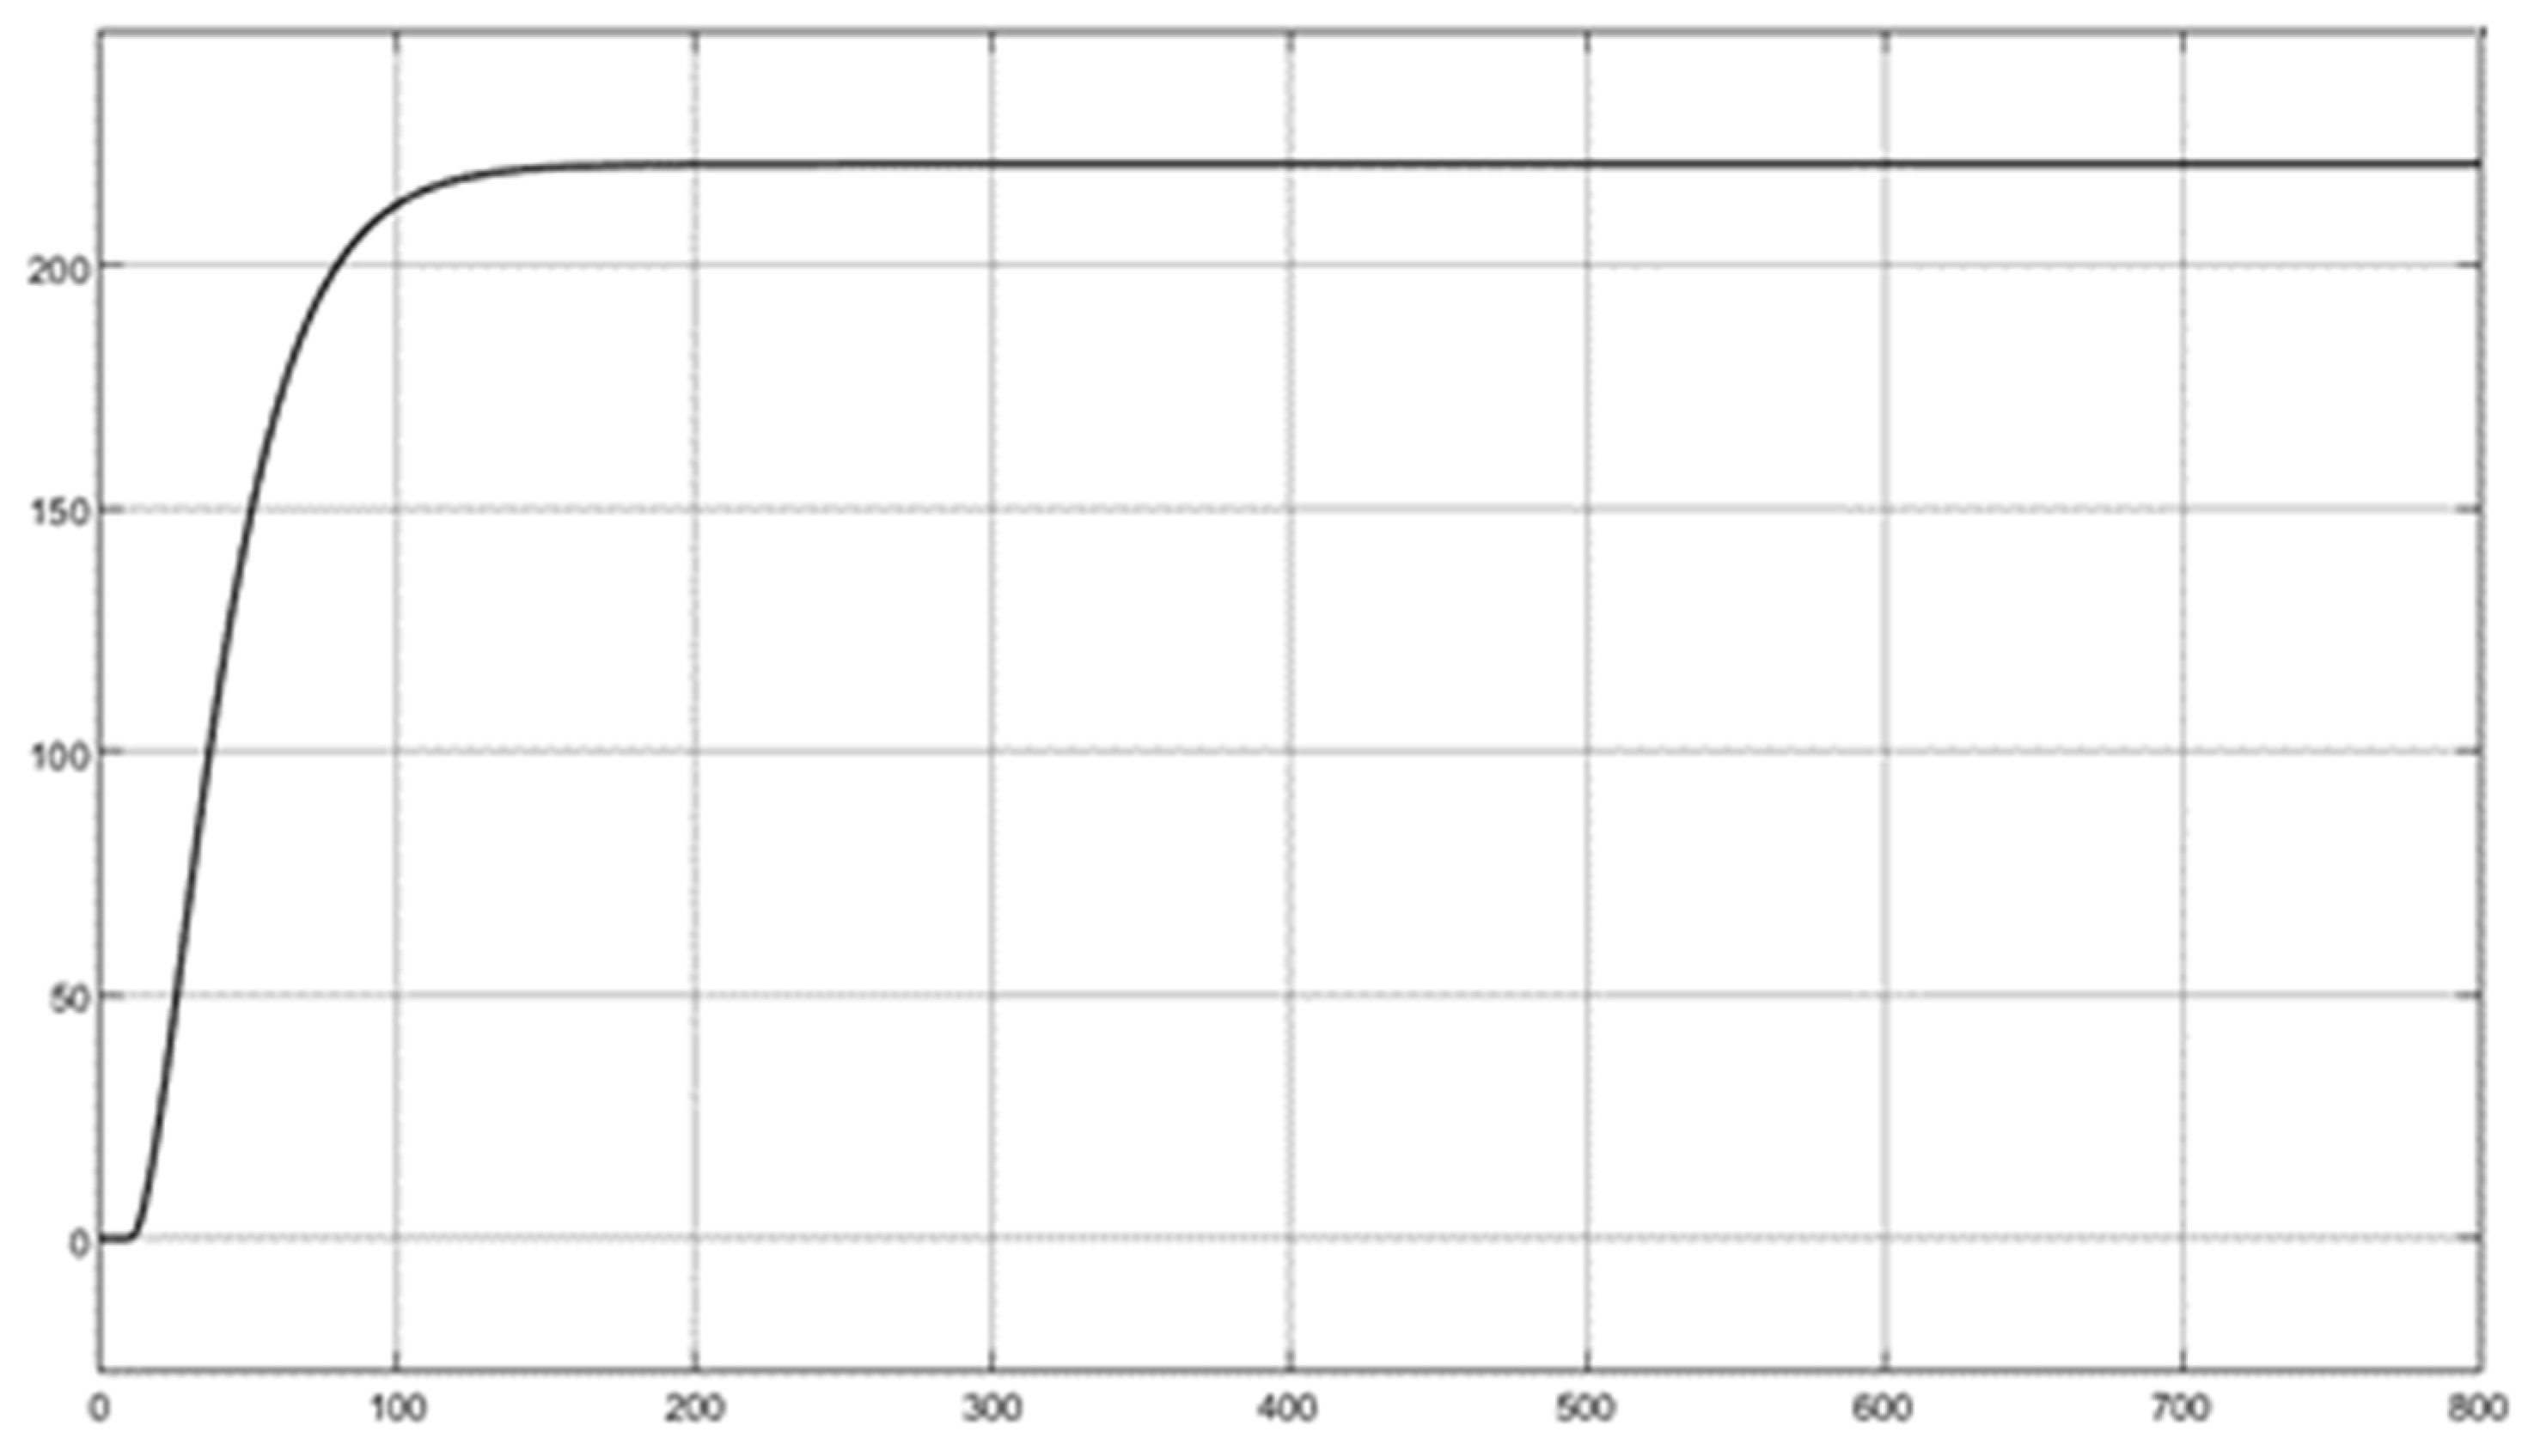
The next step is to obtain the transient characteristics of the control object. Since the temperature of the raw material supplied to the inlet can range from 280 °C to 320 °C, an average value of 300 °C is selected as the initial temperature. The main requirement for the system is to maintain the temperature at 530 °C. Therefore, the behaviour of the system when heated to 230 °C will be considered. The resulting step response of the open-loop system is presented in Figure 5.
To synthesise an automatic control system (ACS) with a P-controller, it is necessary to calculate the gain of the controller. First, the cut-off frequency is determined. It corresponds to the frequency at which the phase is equal to (−π + ∆φ). ∆φ is the phase margin equal to 30° (π/6). Then the phase at the cut-off frequency must be equal to:
π + π 6 = 5 π 6 = 2.618
To find the cut-off frequency, we use the following formula:
φ ω = arctan T 1 ω + a r c t a n T 2 ω ω · τ ,  
where φ(ω) is the phase of the system corresponding to a specific frequency value;
  • T 1 ,   T 2 are the time constants of the first and second links, respectively;
  • τ is the delay;
  • ω is the frequency.
Thus, to determine the cutoff frequency, it is necessary to find the frequency value at which the phase calculated using Formula (3) will be equal to −2.618. Let us take the frequency range from 0.0768 to 0.0769. The calculation of the cutoff frequency is shown in Table 2.
Based on the calculations, the cutoff frequency is 0.07682. The next step is to find the gain coefficient of the object. To do this, we first need to determine the amplitude of the output signal at the cut-off frequency. It is calculated using the following formula:
M ω = i = 1 n K i T i 2 ω 2 + 1 ,
where n is the number of links in the system;
  • K i is the gain coefficient of the i-th link;
  • T i is the time constant of the i-th link;
  • ω is the frequency.
The presented system consists of three links: two first-order aperiodic links and a delay link. For such a system, when calculating the amplitude value at the cutoff frequency, the formula will be as follows:
M ω cp = K 1 T 1 2 ω cp 2 + 1 K 2 T 2 2 ω cp 2 + 1 1 .
Given that the delay link does not affect the amplitude, when calculating, the multiplier relating to the delay will be equal to 1.
Thus, the amplitude at the cutoff frequency will be equal to:
M ω cp = 1.2 15 2     0.07682 2 + 1 0.8 20 2     0.07682 2 + 1 1 = 0.343238
Since K g e n e r a l = M ω a v e r a g e , we obtain that K g e n e r a l = 0.343238 .
Finally, let us calculate the gain coefficient of the controller. To determine the cutoff frequency, the following expression is used:
K r e g u l a t o r = 1 K g e n e r a l = 1 0.343238 = 2.913431 .
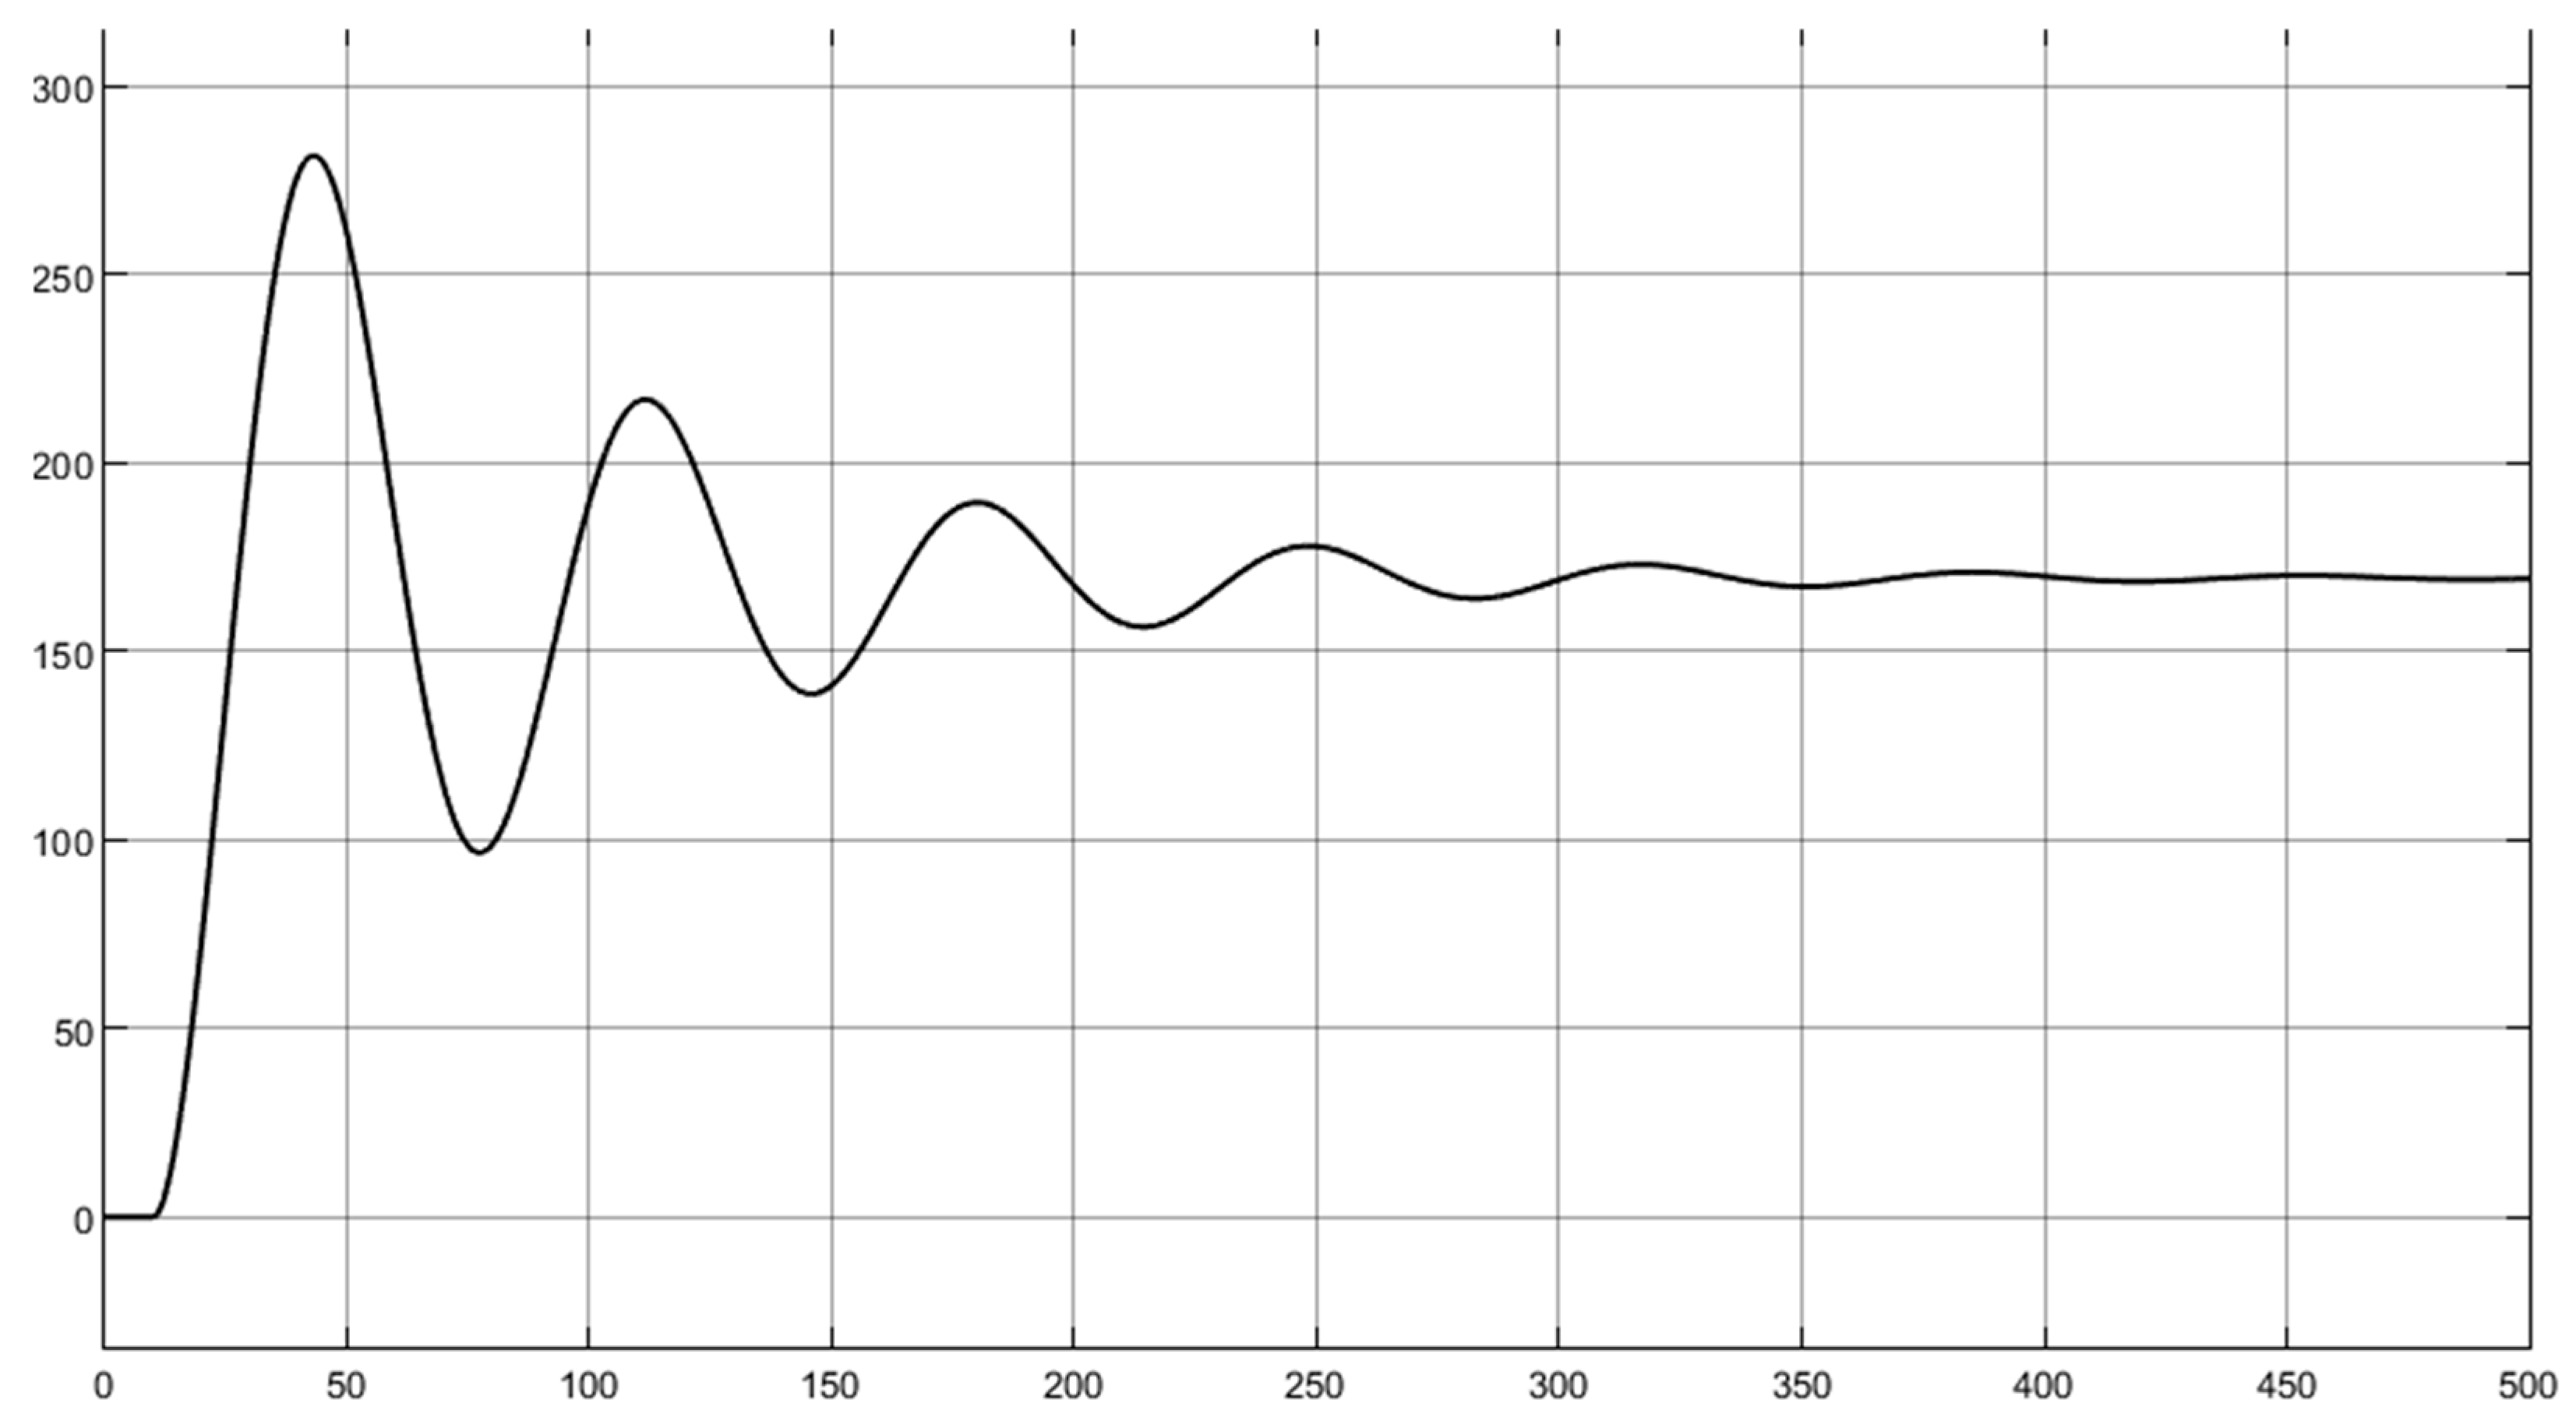
Now let us build a control system with a P-controller (Figure 6).
The step response of the closed-loop system with the P-controller is illustrated in Figure 7.
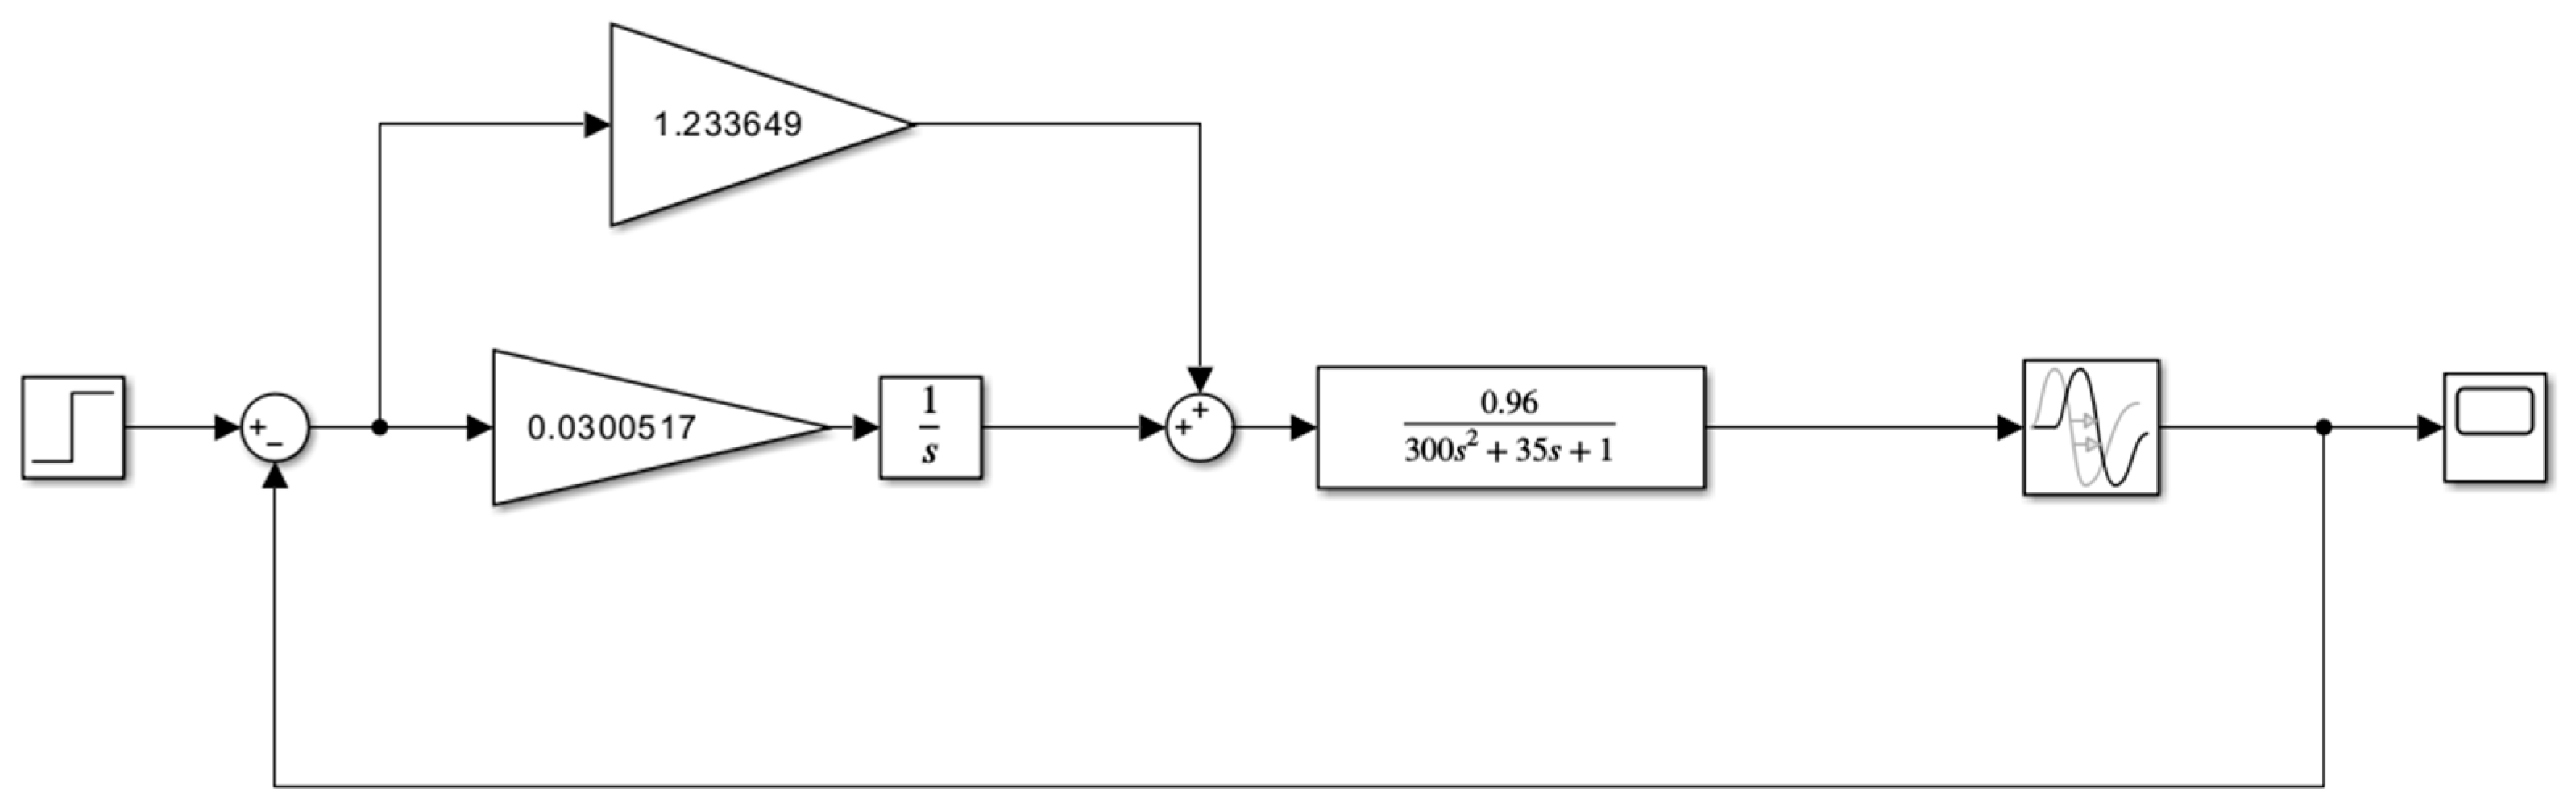
The coefficients for the PI-controller will be calculated in the same way as for the P-controller. However, the desired cut-off frequency must correspond to a phase equal to (−π/2 + ∆φ). The phase margin is also equal to 30°. In this case, the phase is equal to:
π 2 + π 6 = π 3 = 1.0472 .
To determine the cut-off frequency, we will use Formula (4). The frequency range is selected from 0.0243 to 0.0244. The calculation results are shown in Table 3.
According to the calculations, the required frequency value is 0.02436. We will find the amplitude value at this frequency using Formula (6):
M ω a v e r a g e = 1.2 15 2 0.02436 2 + 1 0.8 20 2 0.02436 2 + 1 1 = 0.810603 .
Therefore, K g e n e r a l = 0.810603 .
We will find the gain coefficient of the controller in the same way as for the P-controller:
K r e g u l a t o r = 1 K g e n e r a l = 1 0.810603 = 1.233649 .
Now let us calculate the integration time constant. To do this, we will use the following formula:
T i = 1 K r e g u l a t o r ω a v e r a g e .
Substituting the found values of K r e g u l a t o r   and ω a v e r a g e   into the formula, we obtain:
T i =   1 1.233649 0.02436 = 33.27601 .
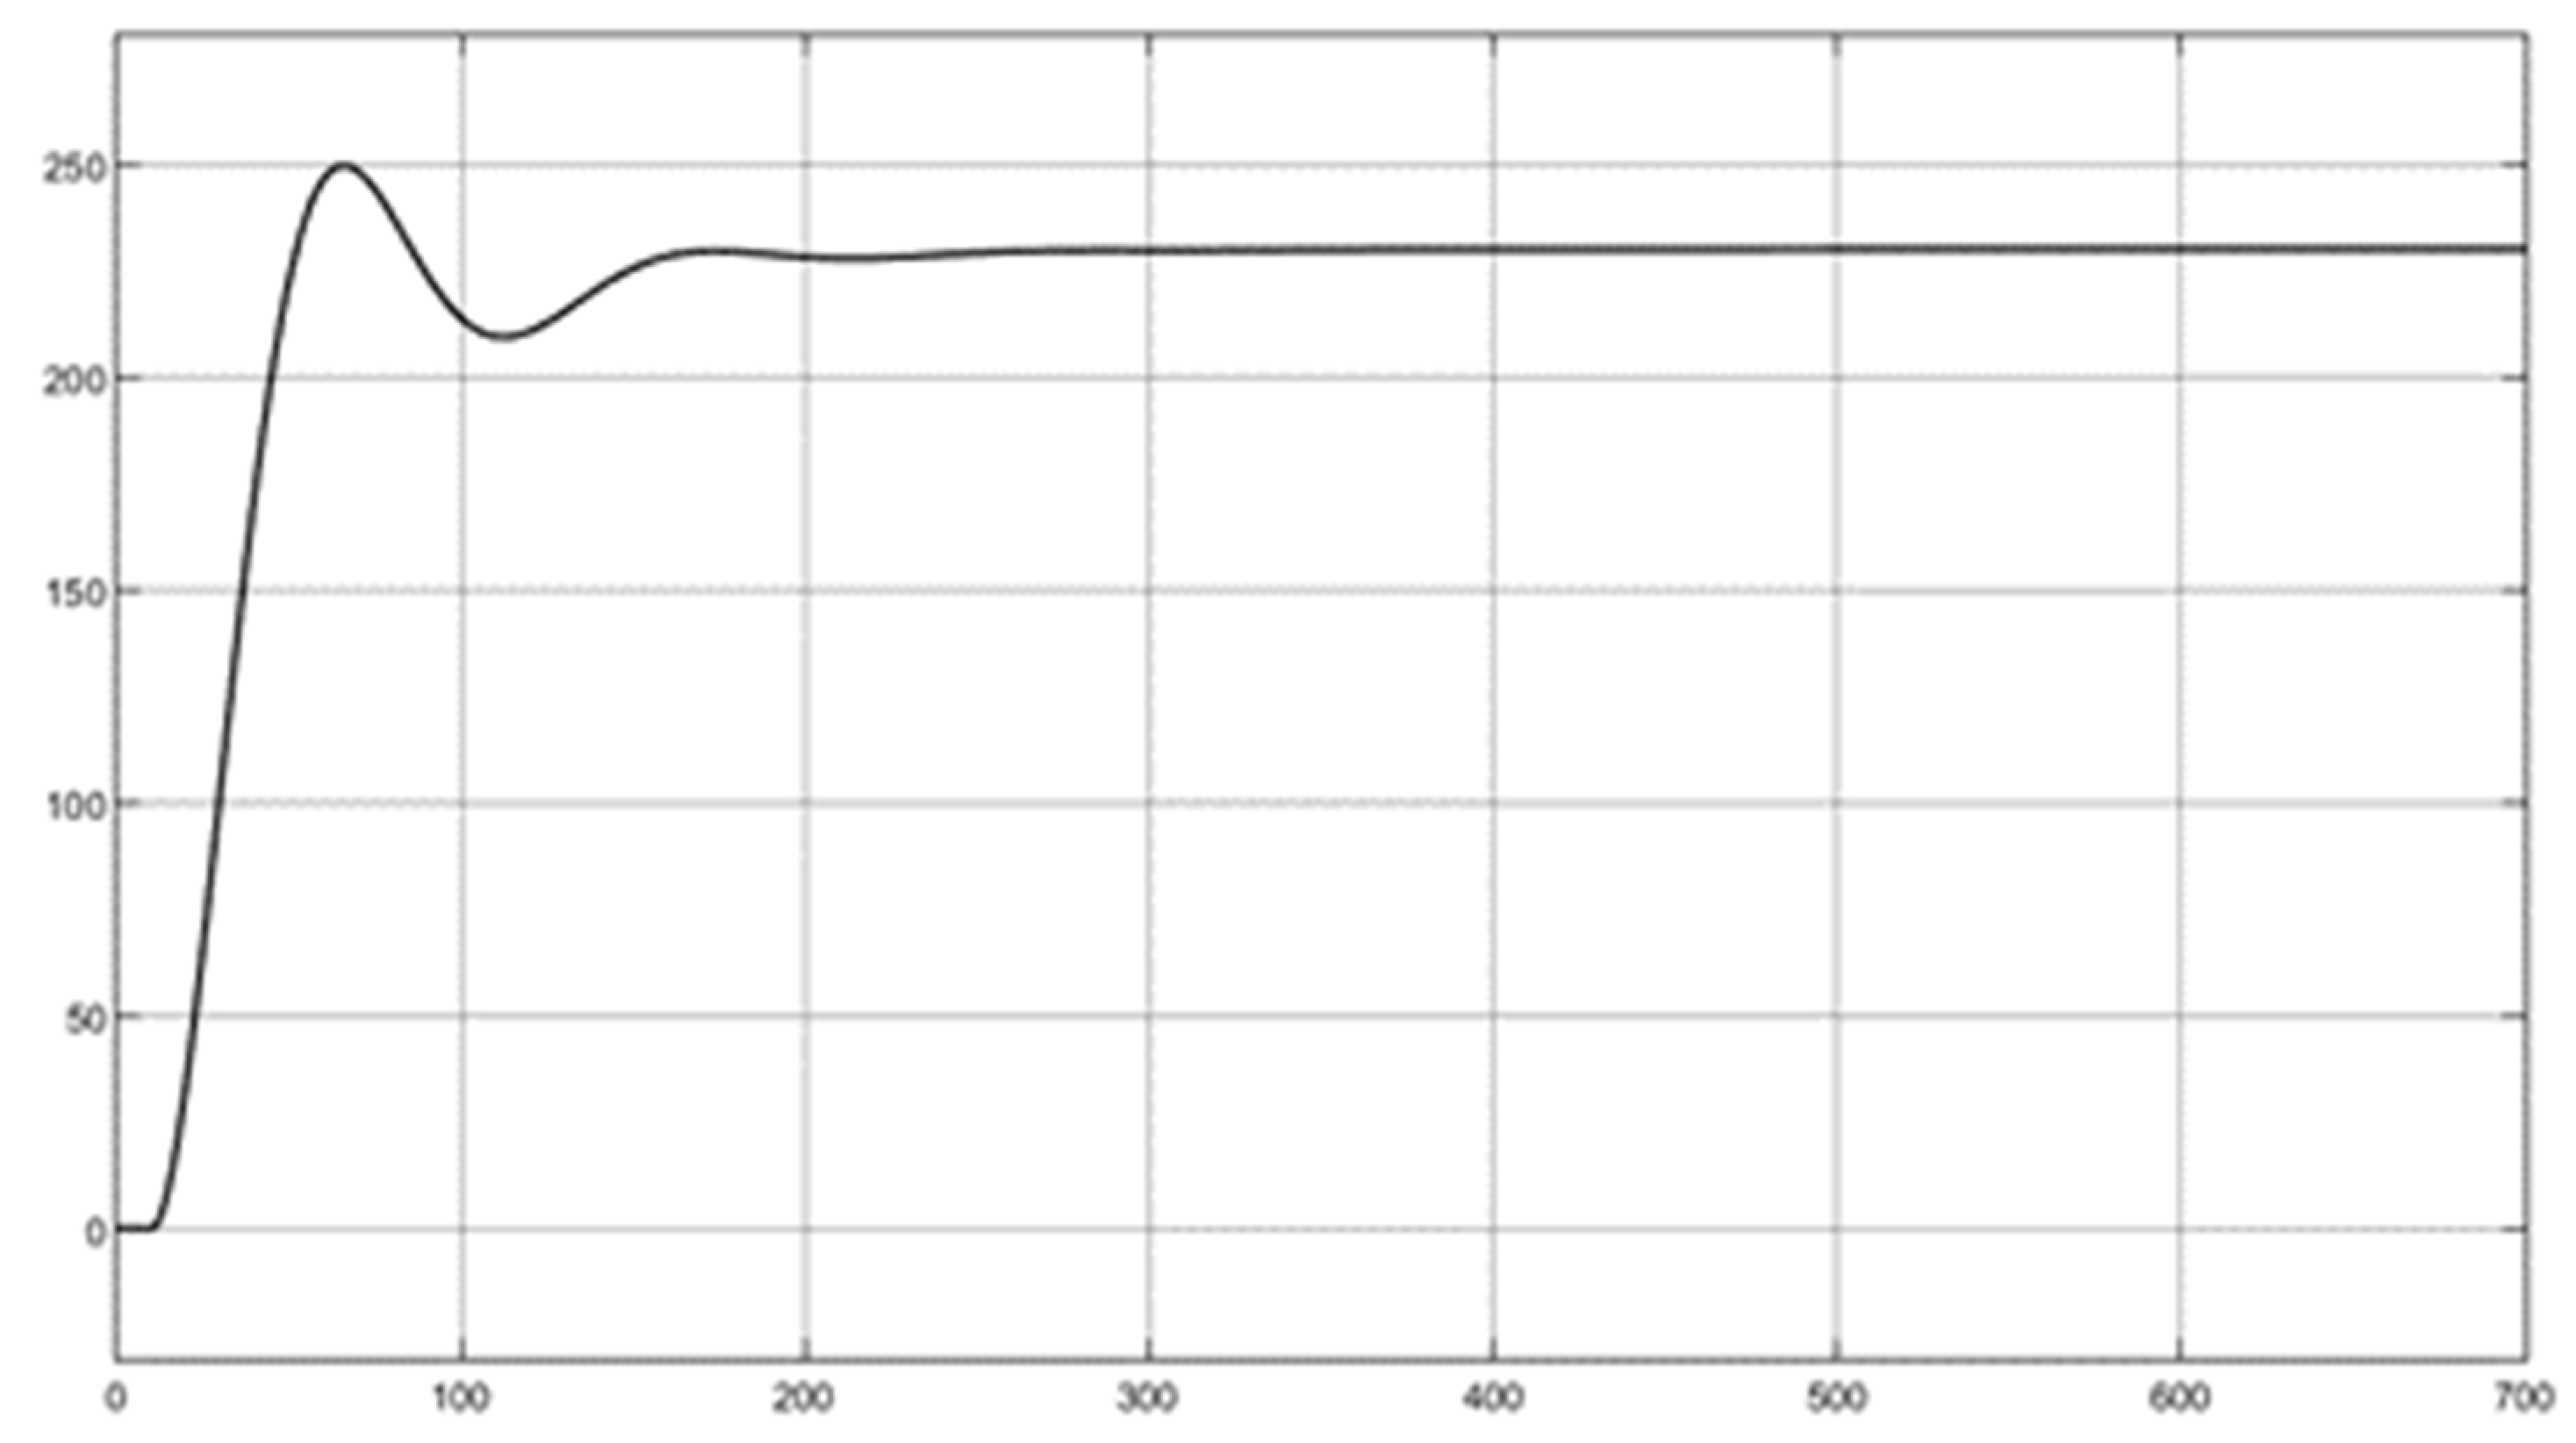
Now we will build a system with a PI controller, enter the calculated coefficients into it and perform simulation (Figure 8 and Figure 9).
As in the first two cases, we will first find the cut-off frequency. In this case, the phase at the cut-off frequency should be −2.618. From this, we can conclude that the cut-off frequency of the PID controller will coincide with the cut-off frequency of the P controller. Then ω a v e r a g e = 0.07682 .
Based on the fact that the cut-off frequency for finding the coefficients of the P and PID controllers is the same, the gain of the PID controller will be equal to the gain of the P controller. This means that K r e g u l a t o r = 2.913431 .
Now let us find the integration time constant. It is calculated in the same way as for the PI controller, using Formula (14):
T i = 1 2.913431 0.07682 = 4.46808 .
To calculate the differentiation time constant, we will use the following formula:
T d = K r e g ω s r .
Substituting the coefficients we found, we get that:
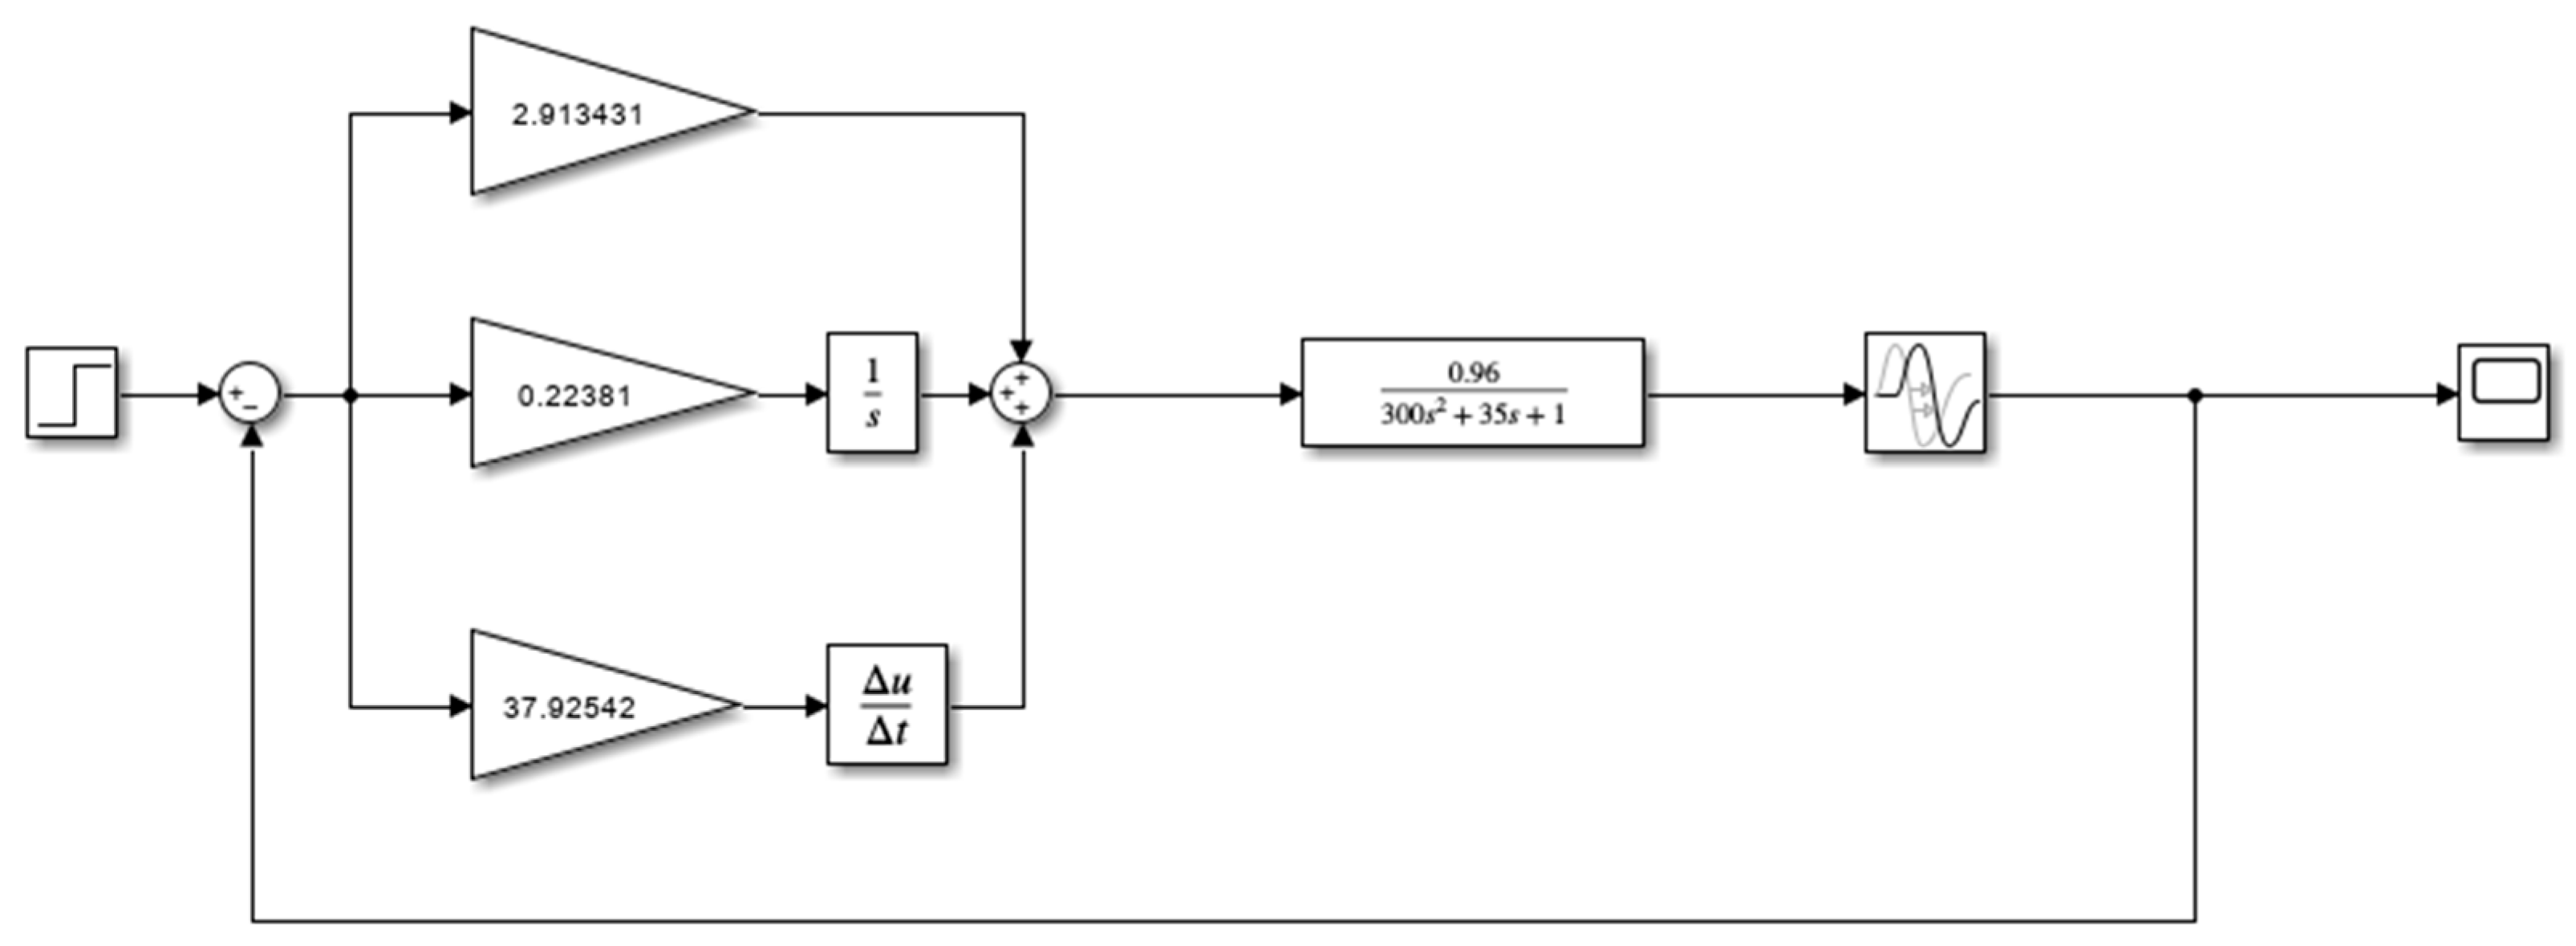
T d = 2.913431 0.07682 = 37.92542 .  
Let us construct a control system model with calculated controller coefficients (Figure 10).
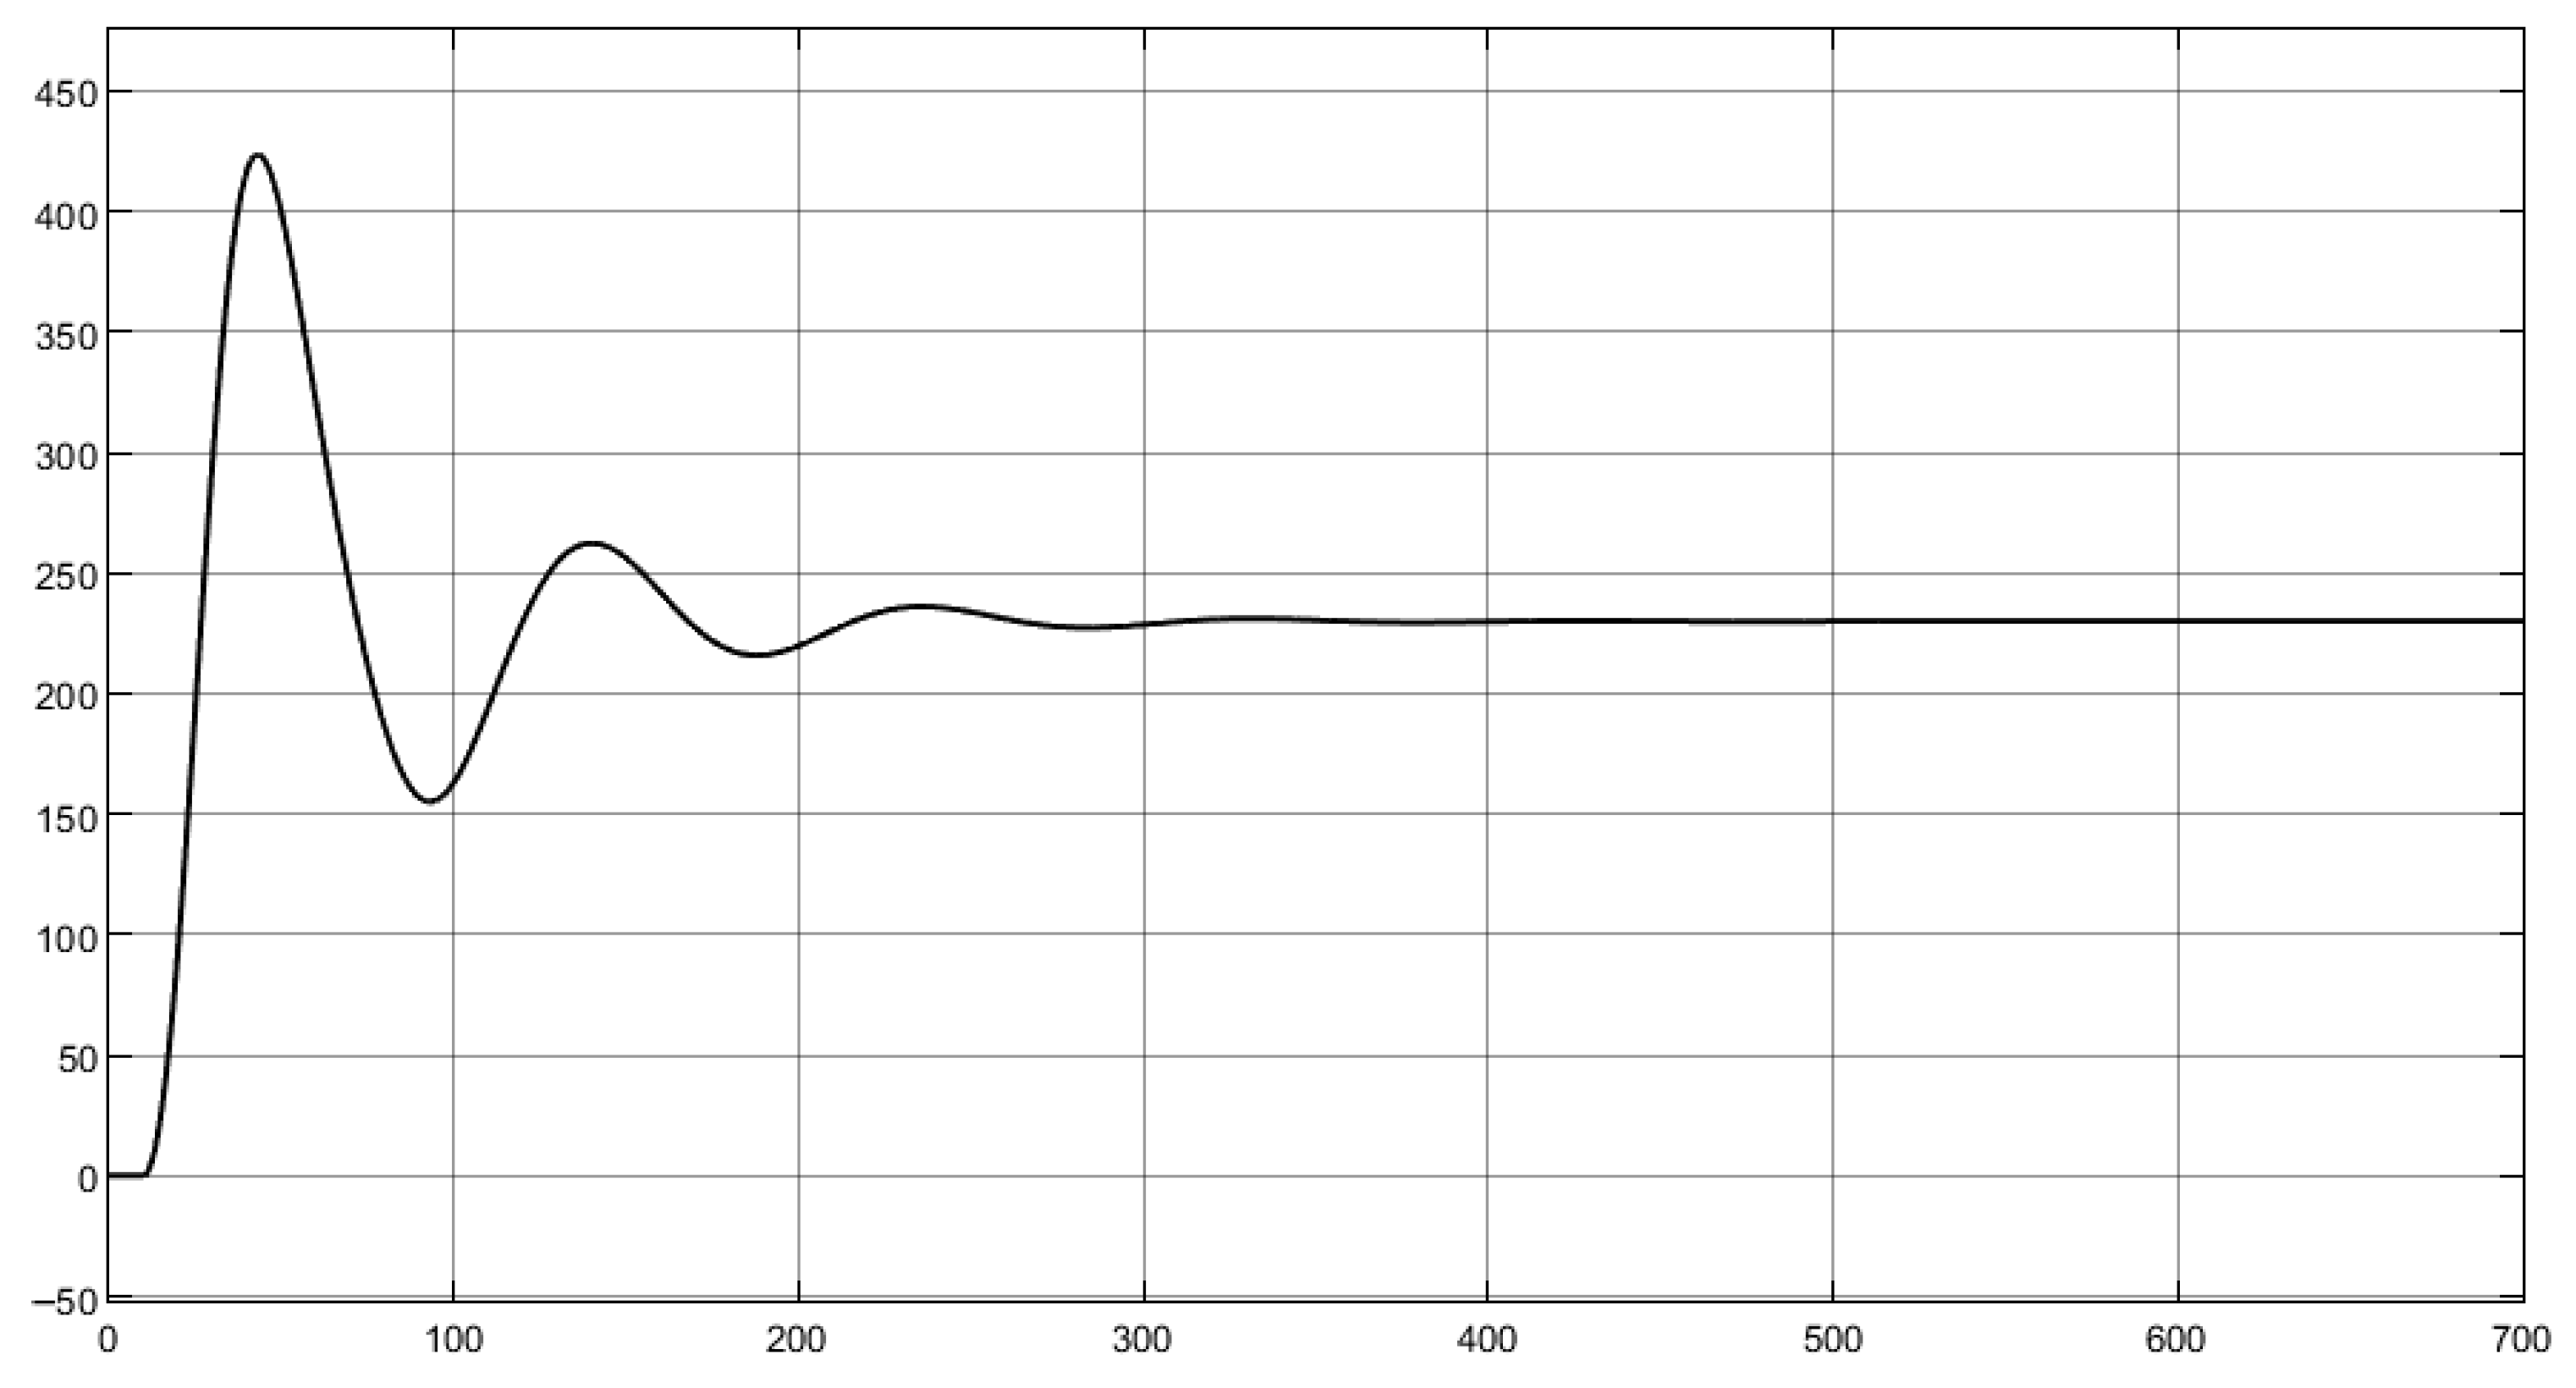
As a result of modelling the constructed system, a graph of the transient process was obtained, as shown in Figure 11.
Based on the obtained graphs of the transient process of the control system with different control laws, it can be stated that the task of synthesising a control system for the temperature of raw materials in an oil catalytic cracking unit is feasible. However, as can be seen from the graphs, the developed controllers require some refinement. In this regard, it was decided to use the built-in tools of the MATLAB Simulink simulation environment for more accurate tuning of the control systems.
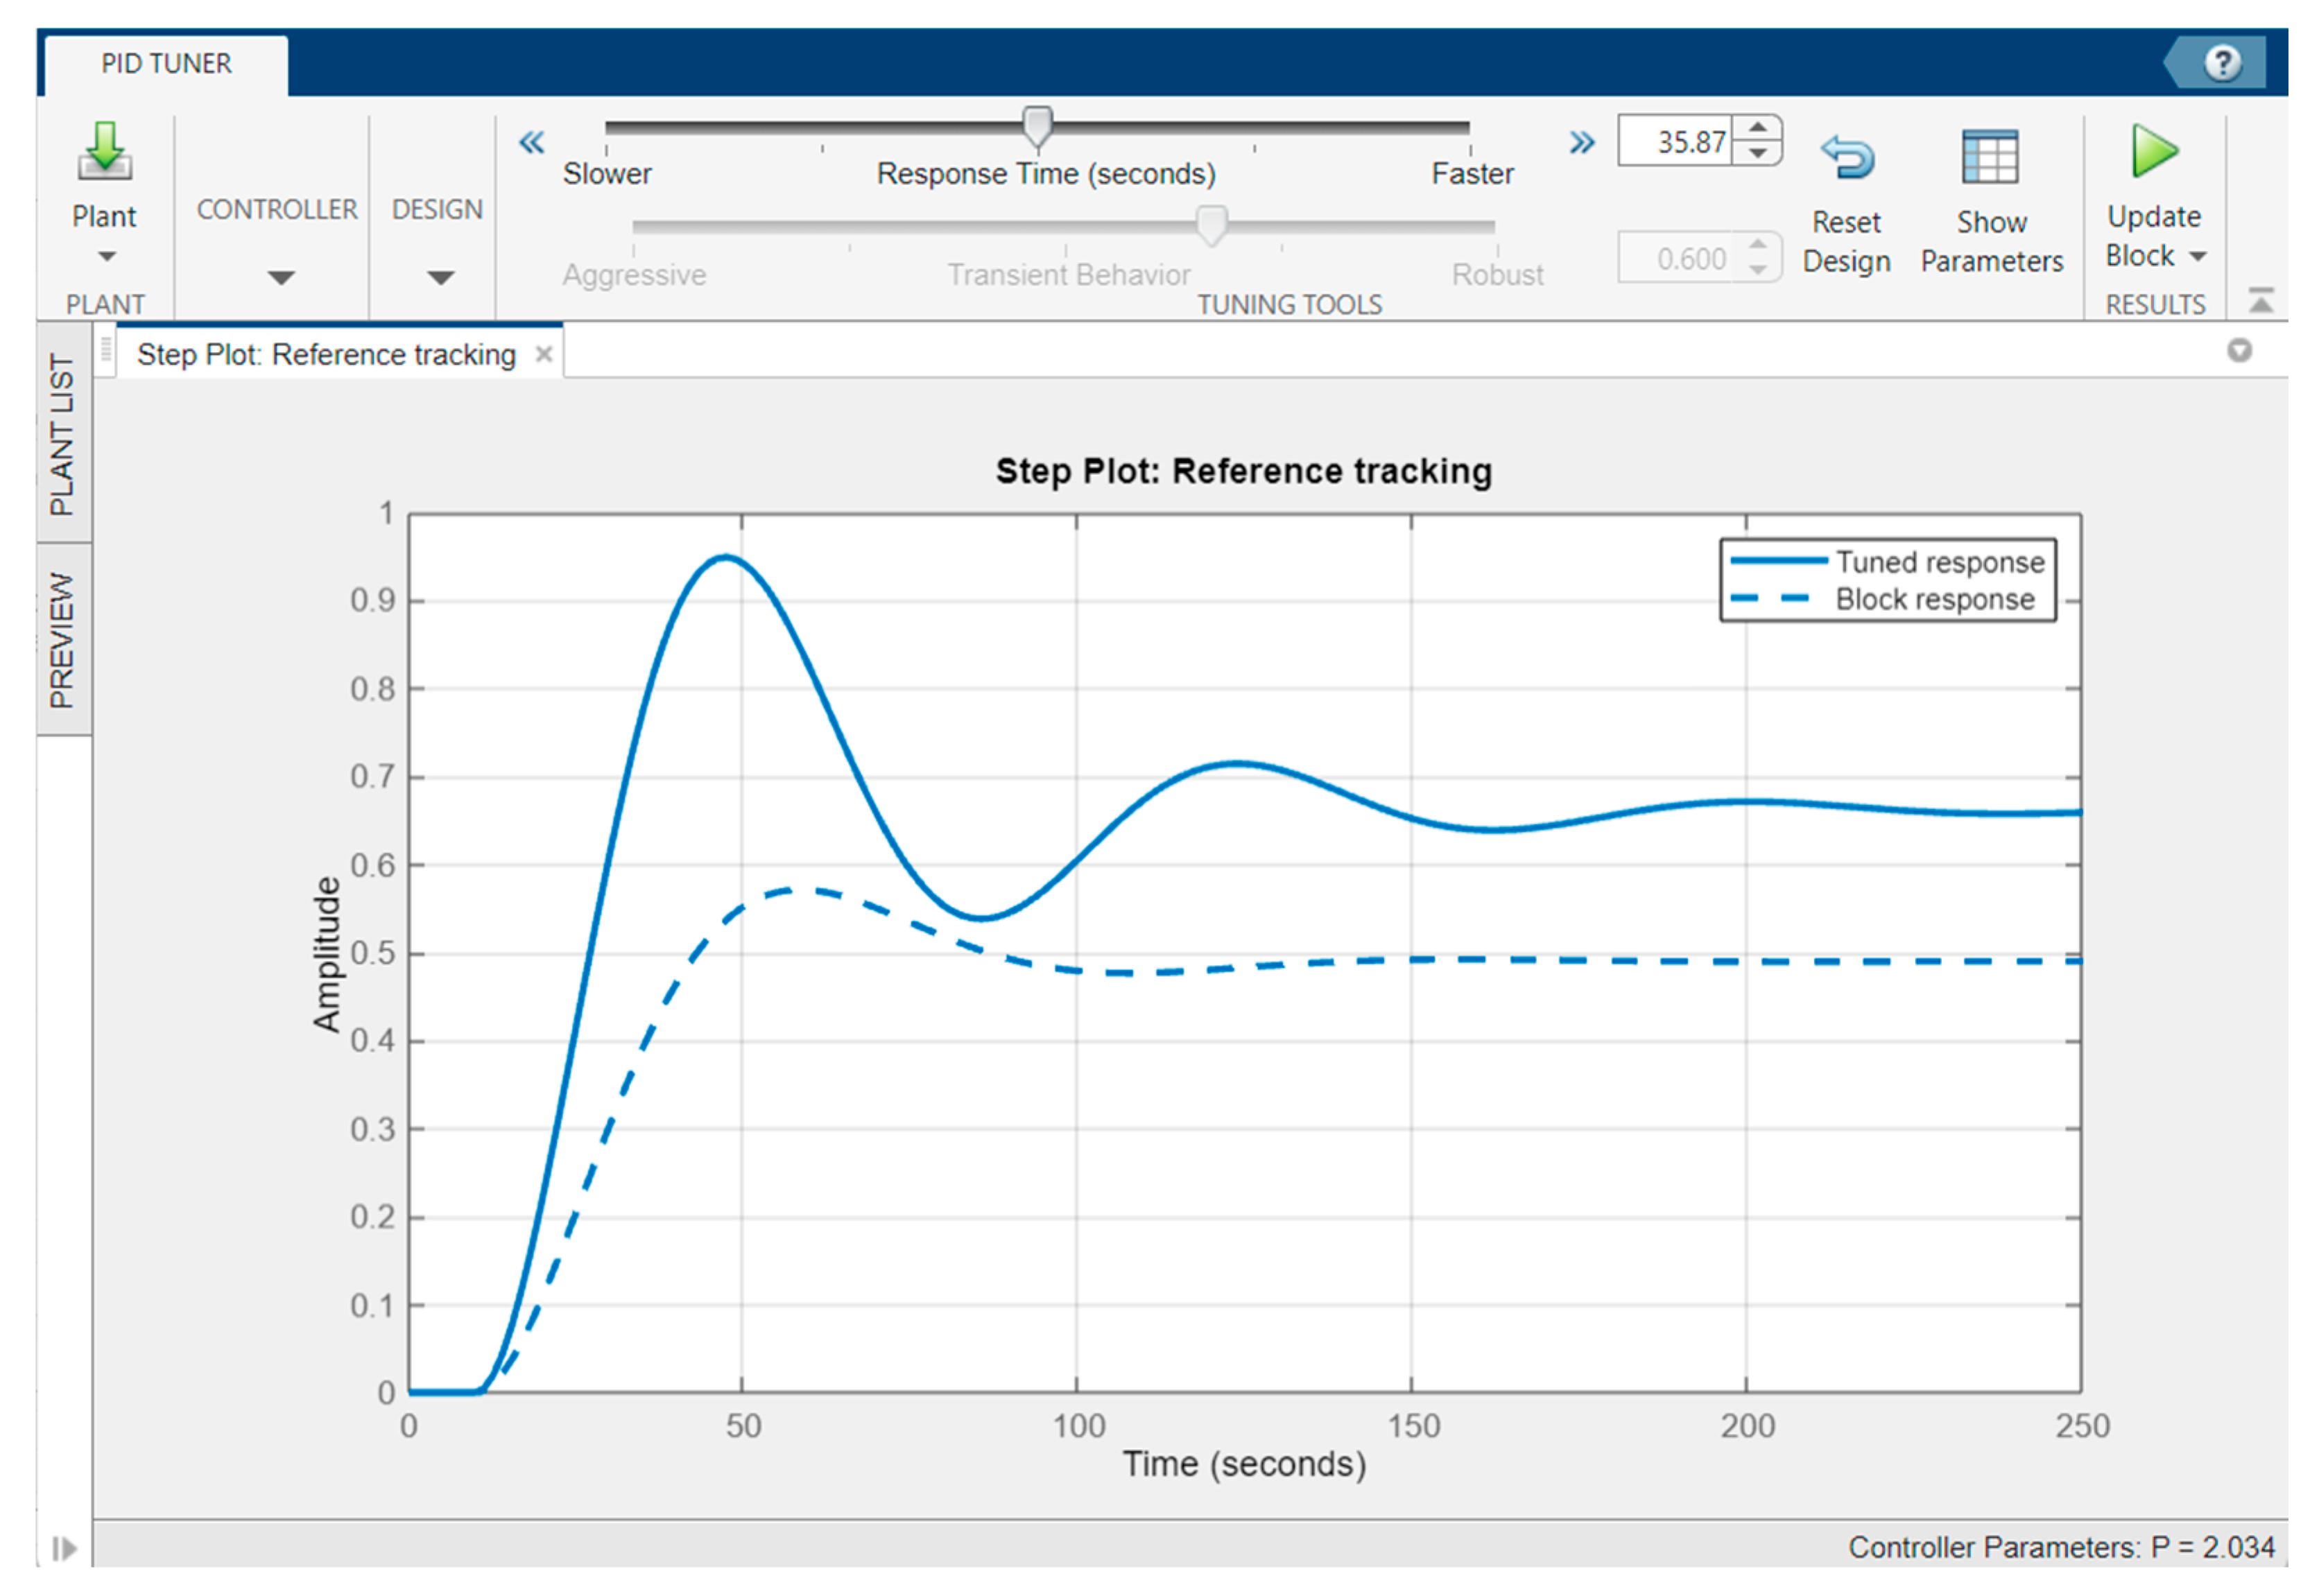
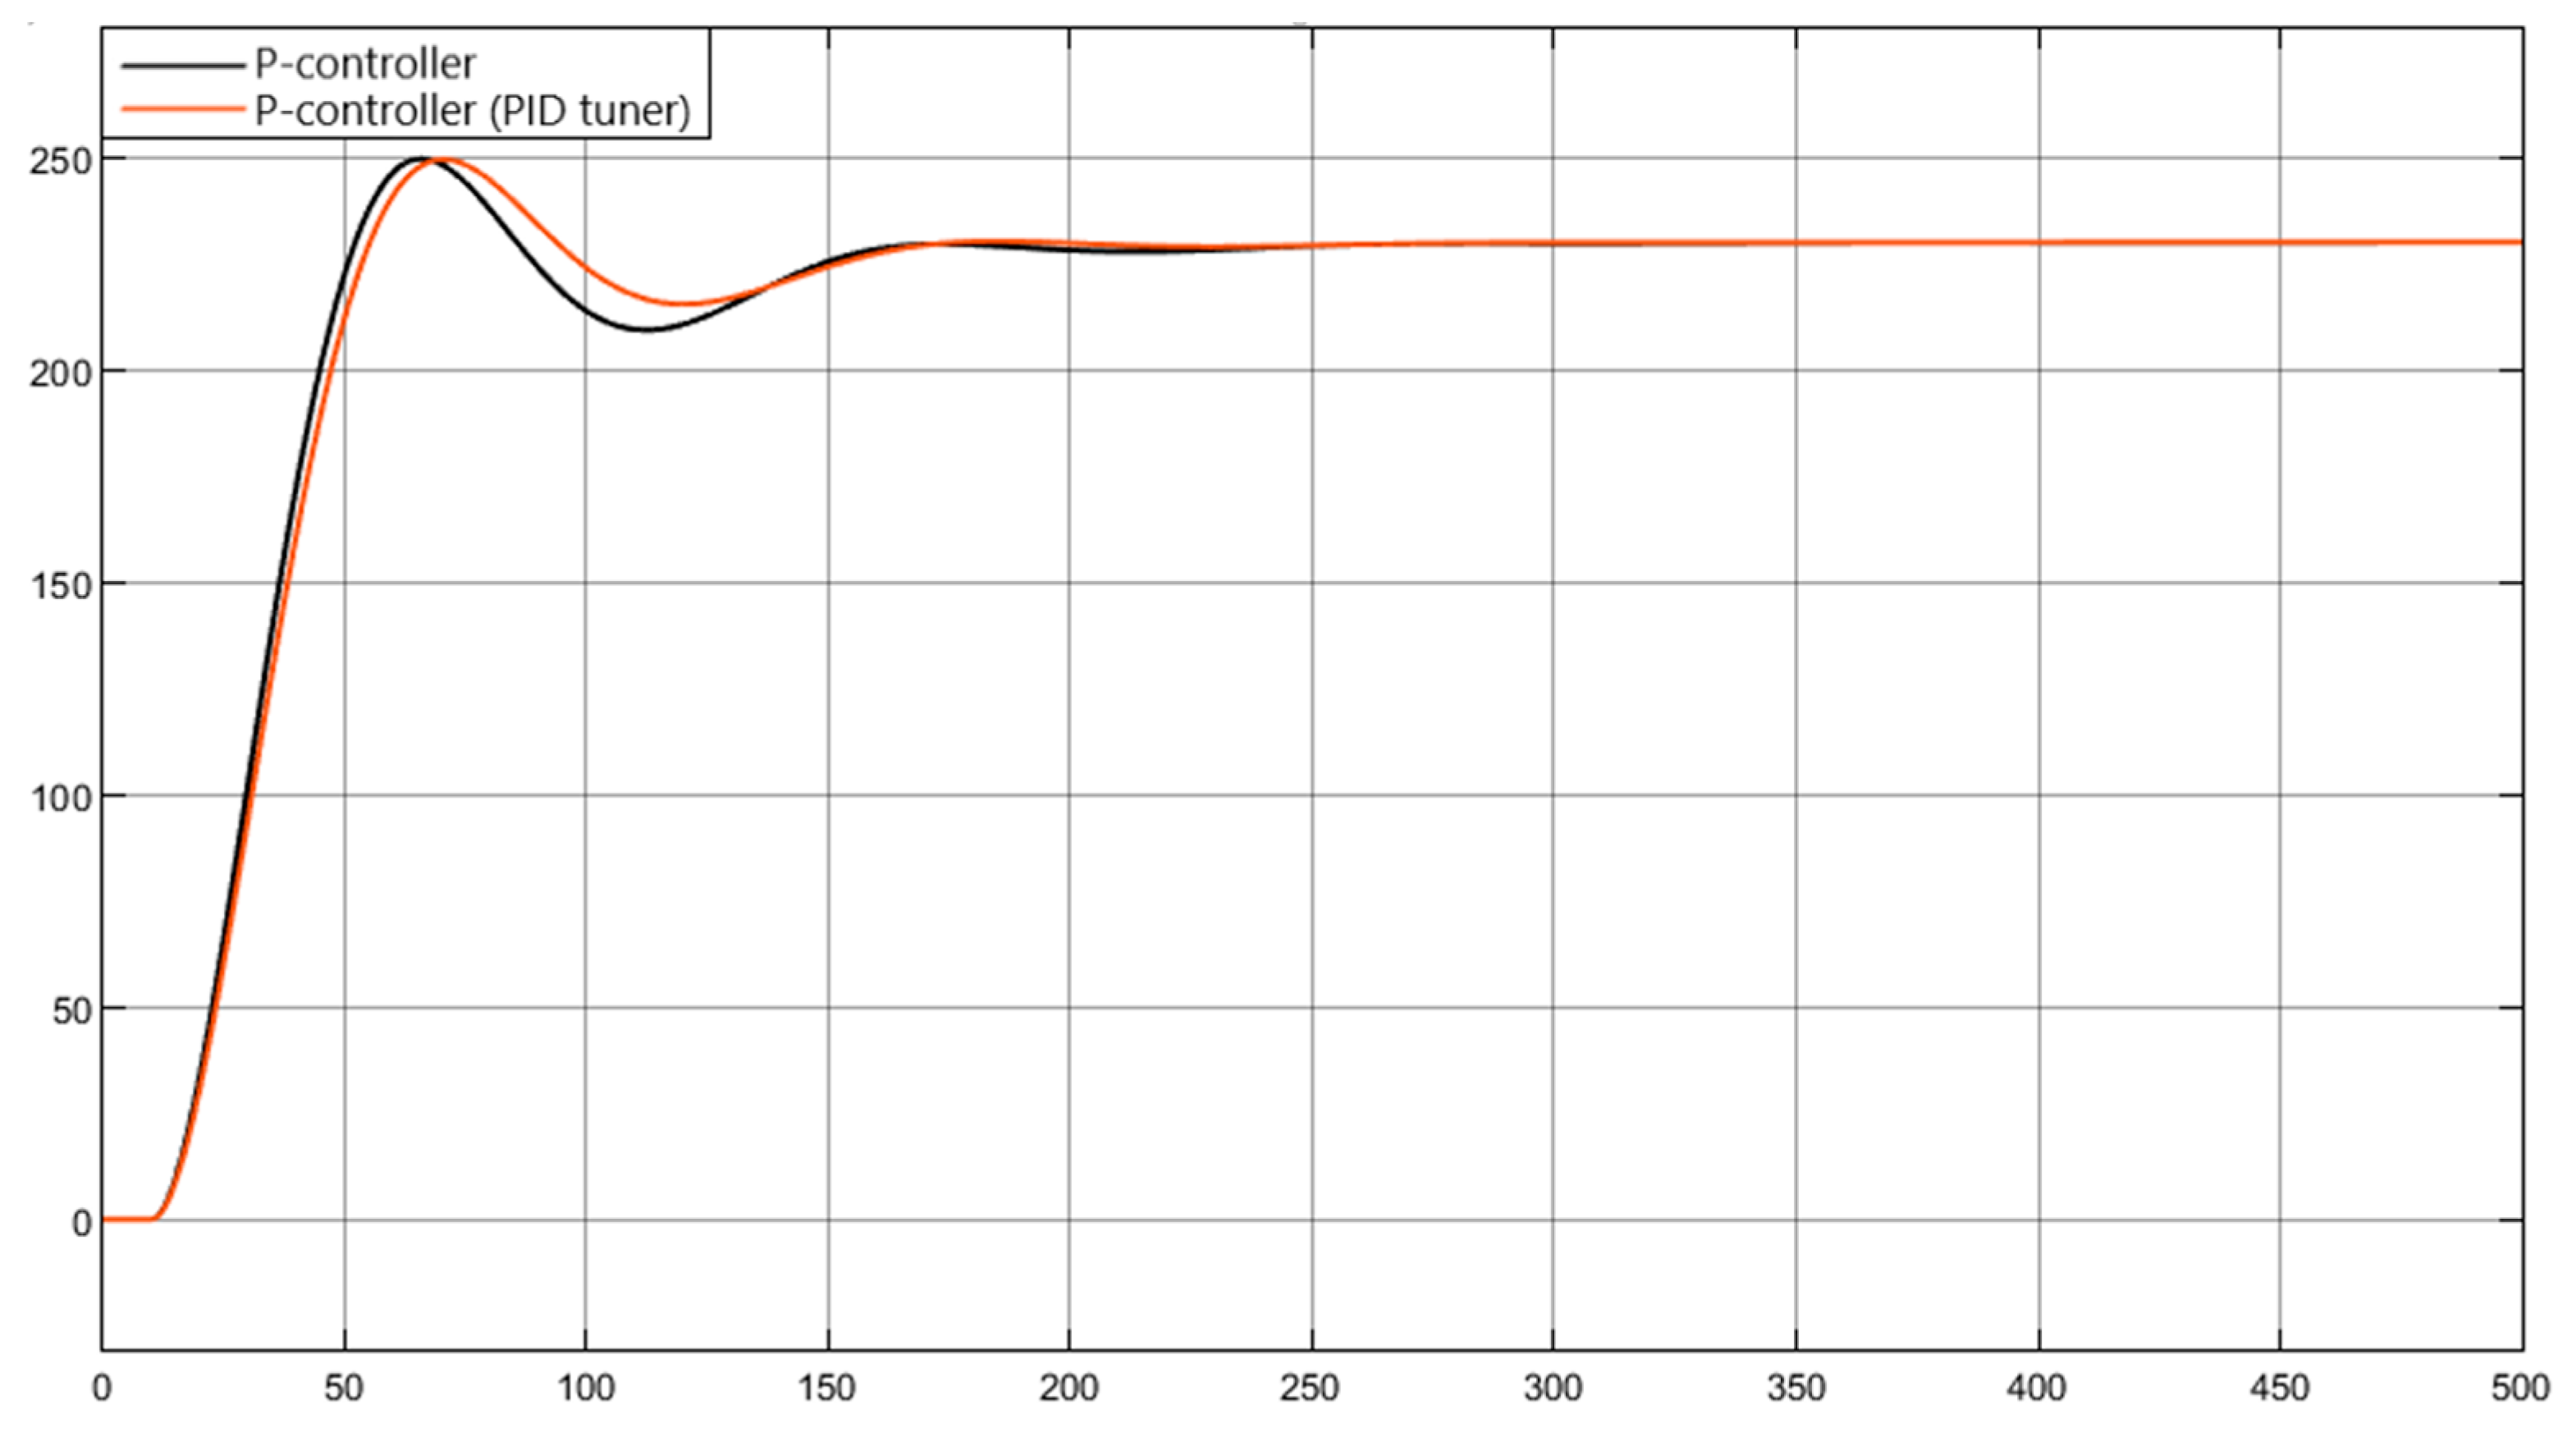
PID Tuner is a tool in MATLAB Simulink that is used to tune P, PI, and PID controllers. This utility allows you to automatically tune the controller for a specific control object model, with the possibility of subsequent adjustment of the controller. To use PID Tuner, you need to add a PID Controller block to the system. The block’s working window has a Tune button; when pressed, the programme automatically calculates the coefficients and plots a transition process graph. In the window that opens, you can also change the control parameters to achieve the desired result (Figure 12).
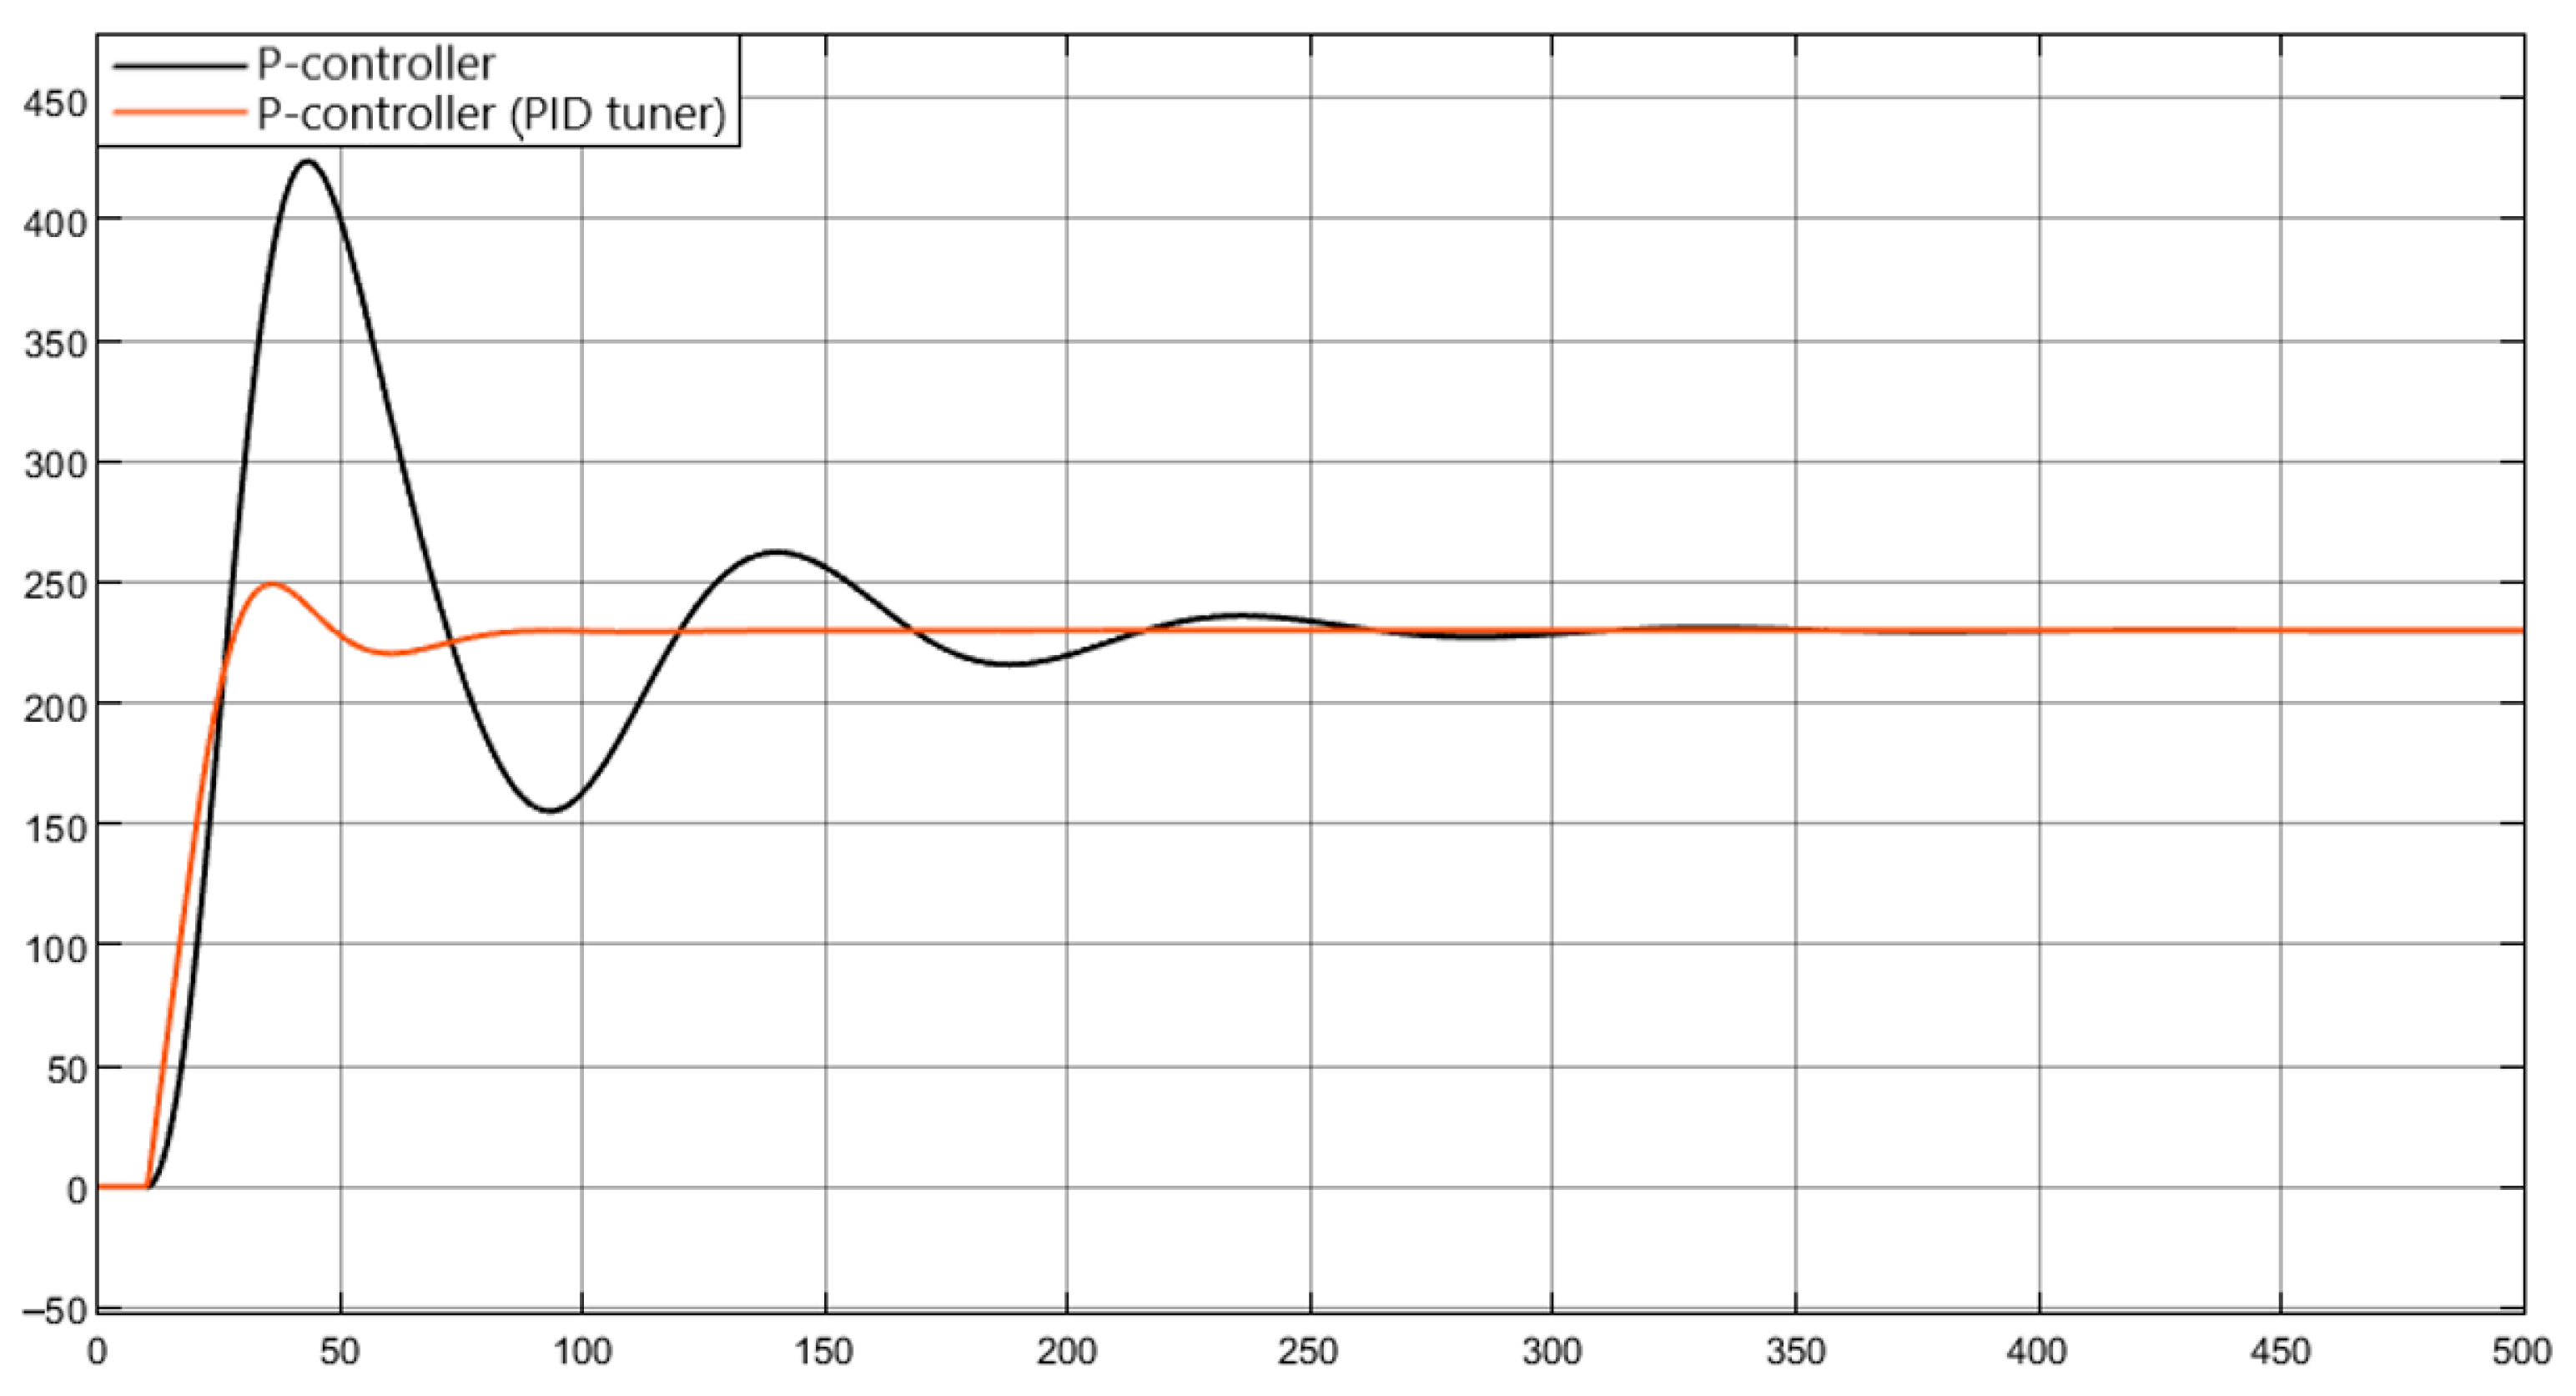
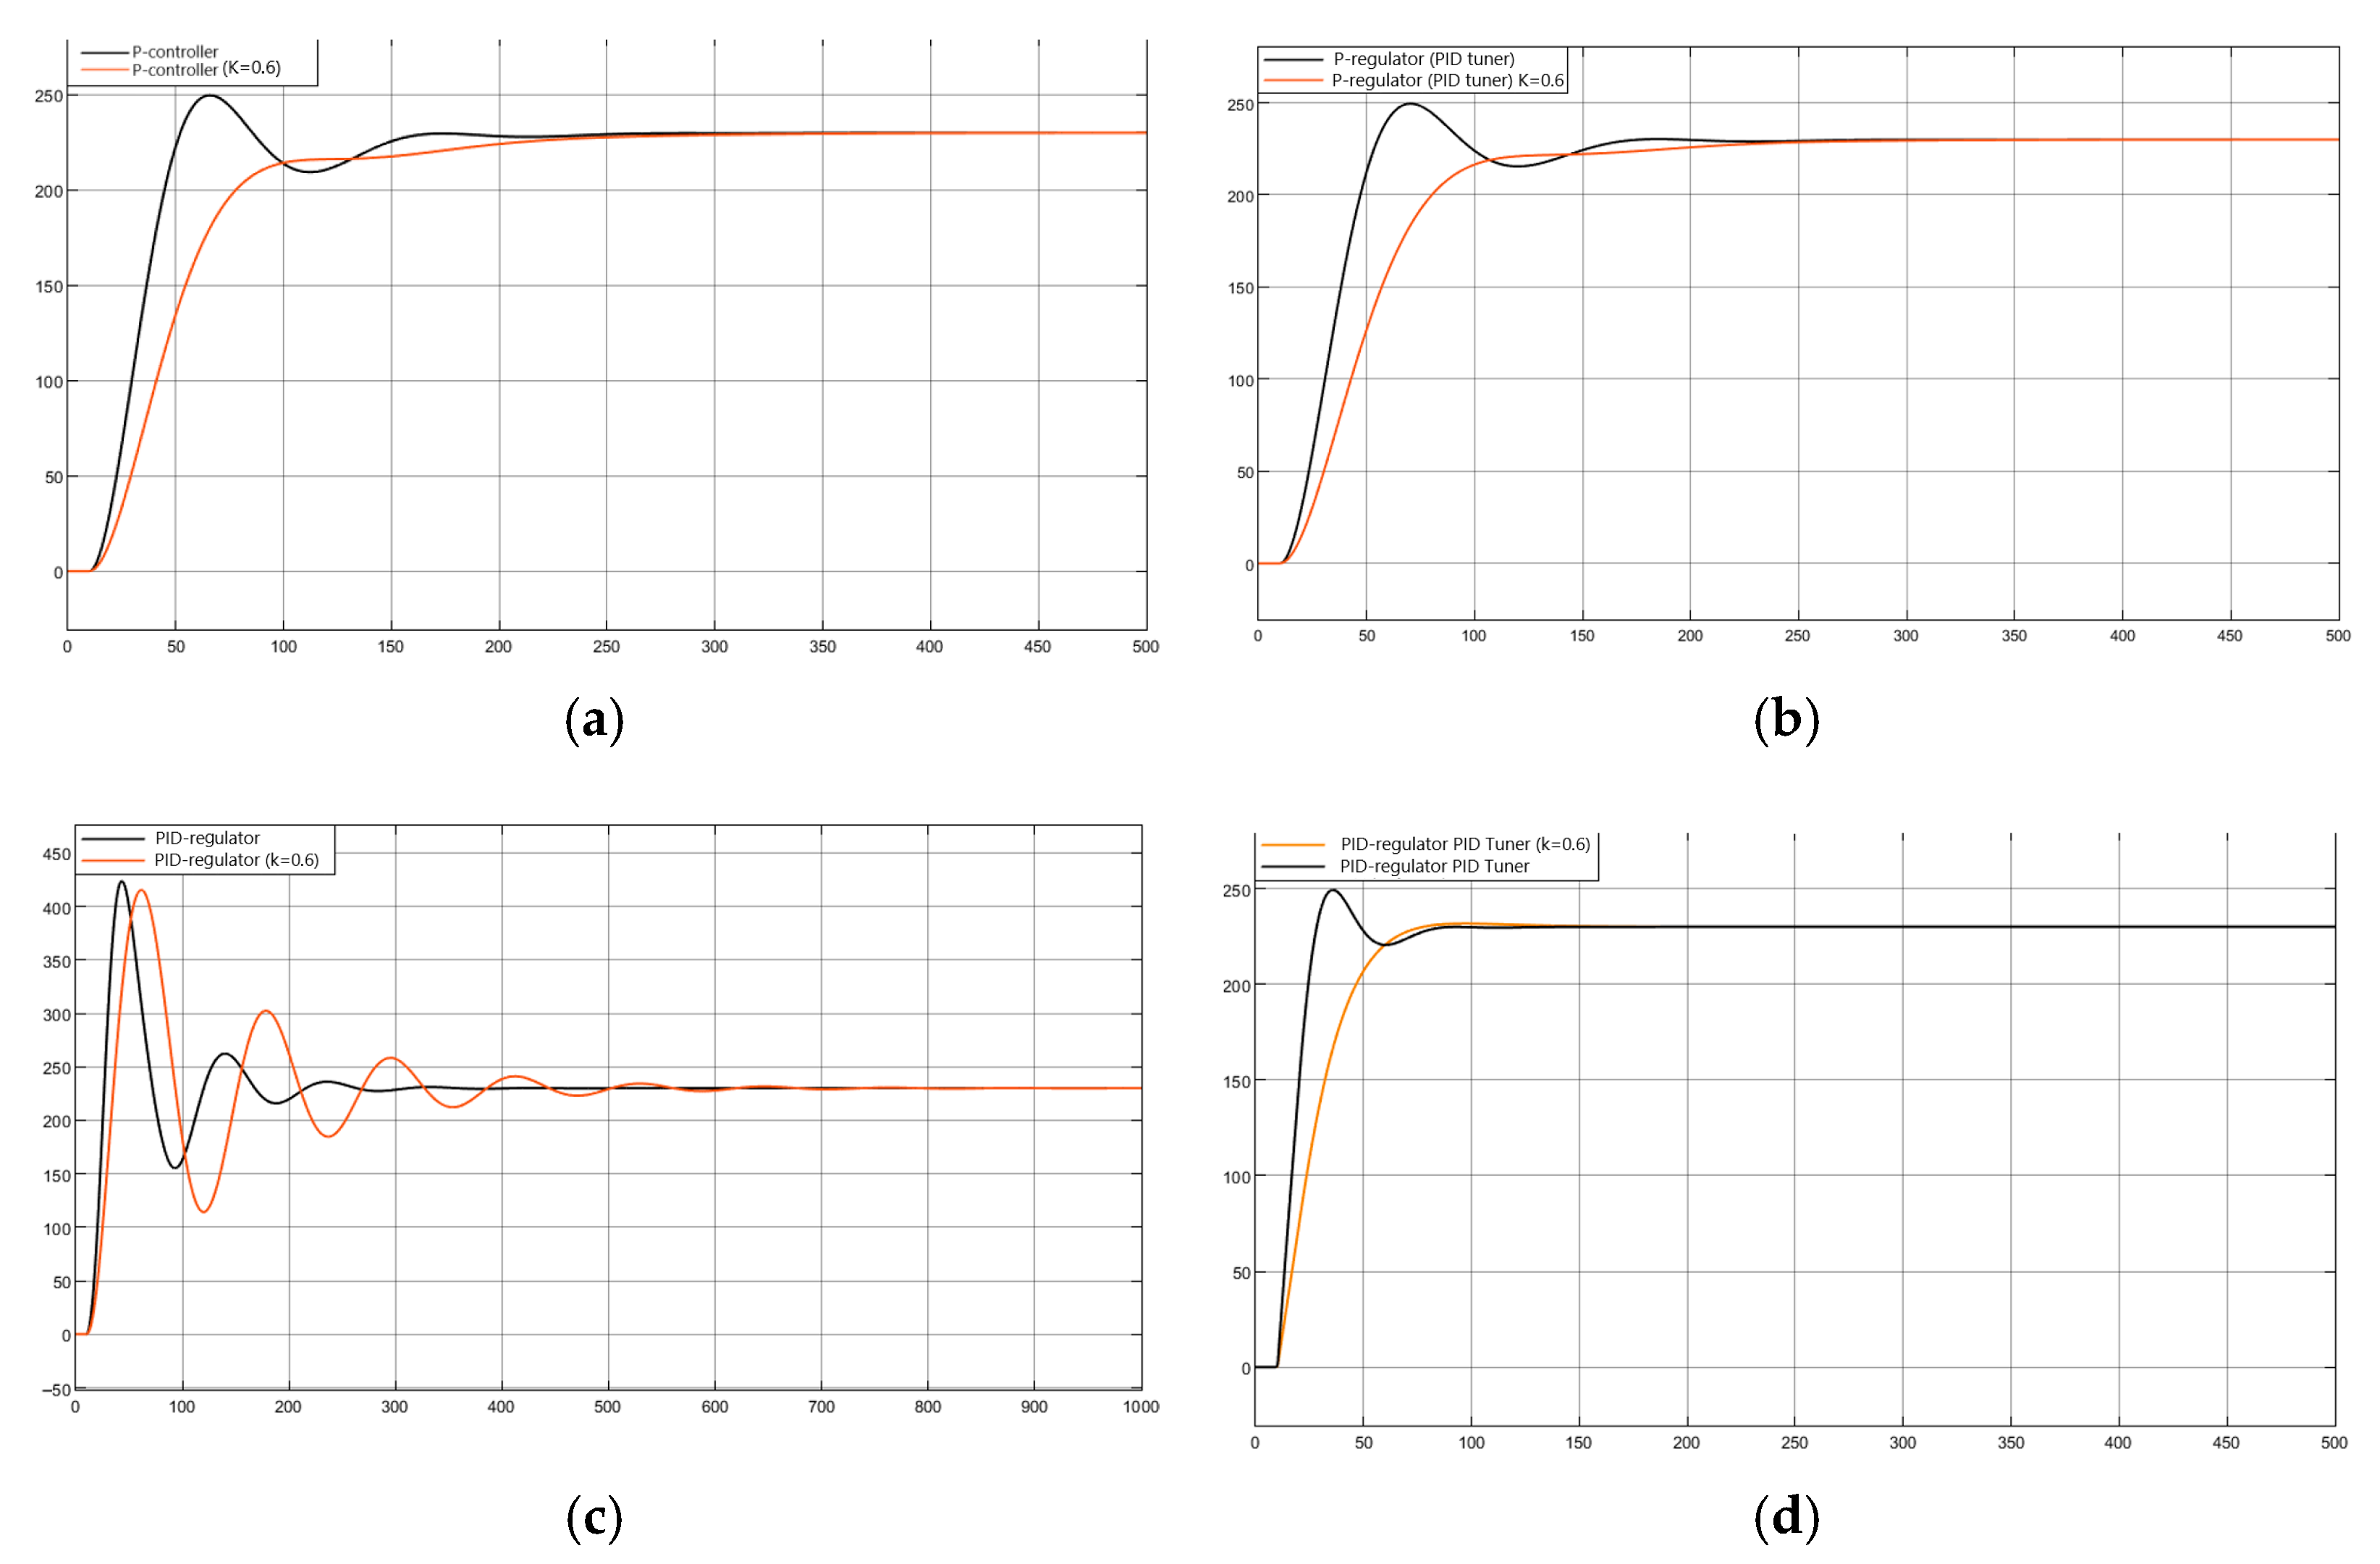
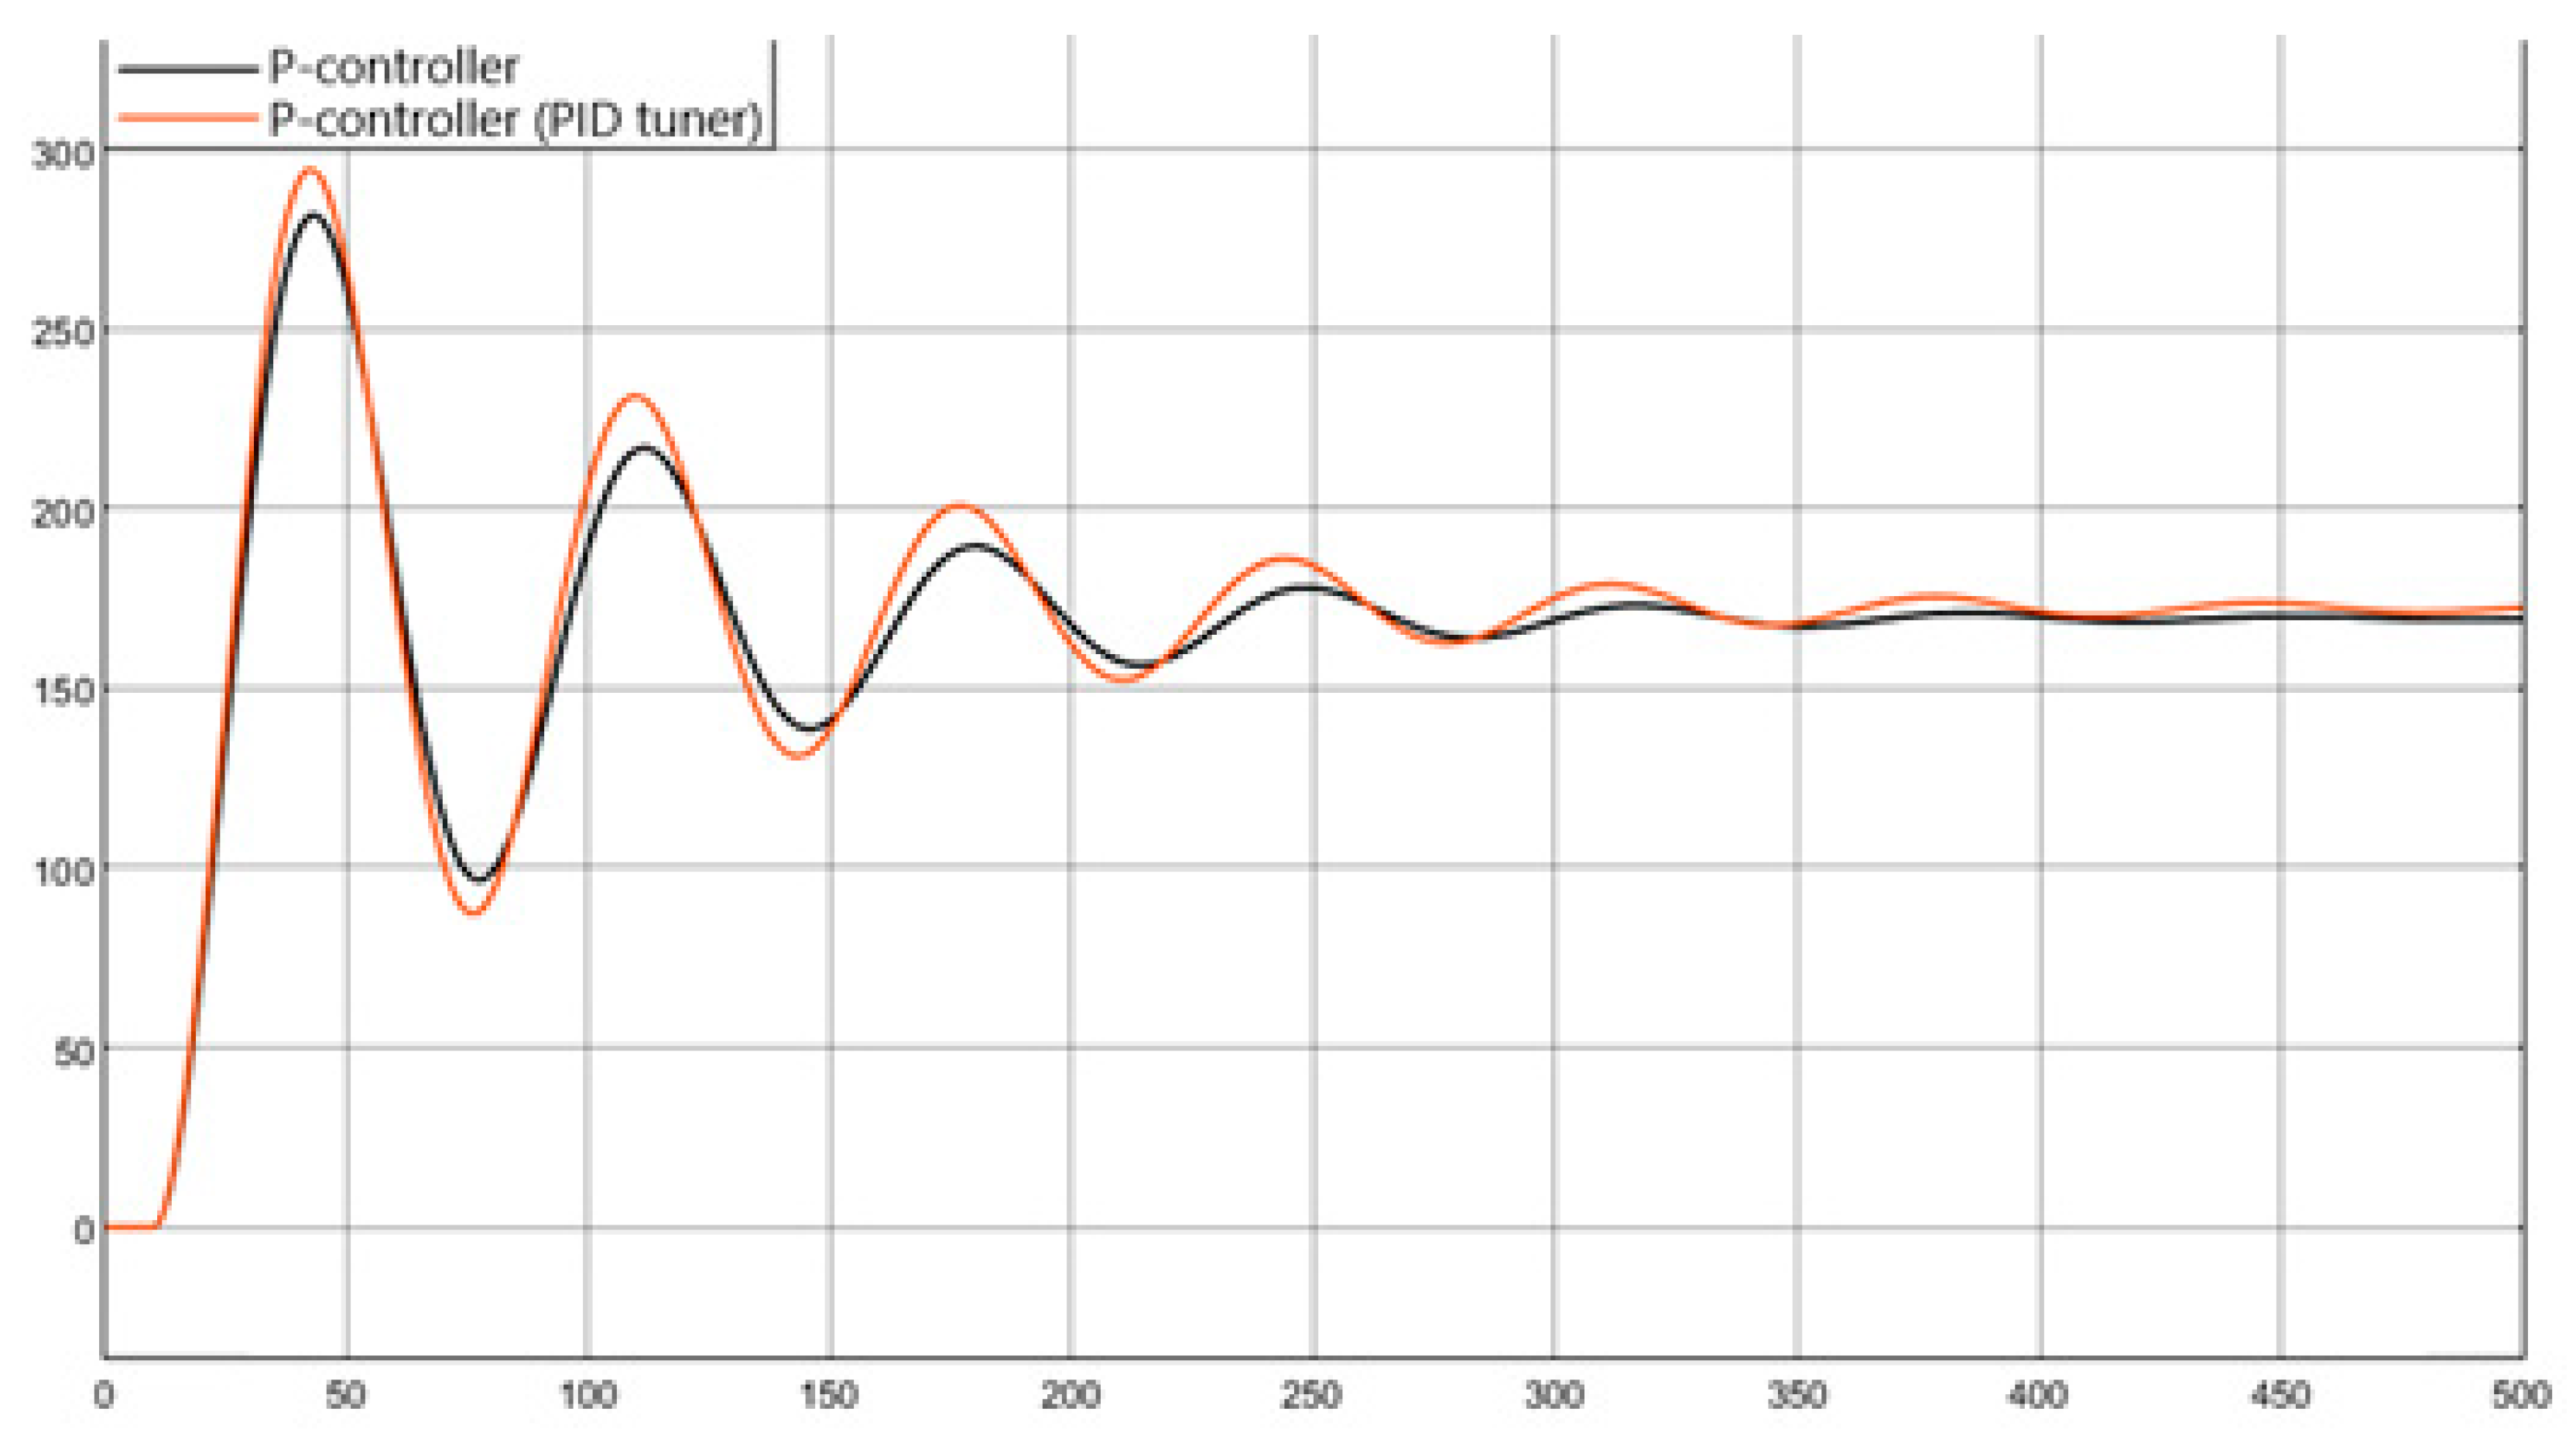
Thus, with the help of PID Tuner, new controller coefficients were selected and the control process was simulated (Figure 13, Figure 14 and Figure 15).
Transient process of a closed-loop control system with a PID controller after tuning.
Analysis of the graphs obtained as a result of automatic parametric optimization using PID Tuner (Figure 13, Figure 14 and Figure 15) allows us to conclude that this approach is highly effective. While at the initial stage of synthesis (Figure 13), we were only able to define the controller structure, PID Tuner provides a tool for quantitatively improving its performance.
A visual comparison of the transient responses in Figure 13, Figure 14 and Figure 15 with their counterparts obtained using the analytical method reveals the following. For the P-controller (Figure 13), automatic tuning could not completely eliminate the steady-state error, which is inherent to the proportional control law itself; however, the settling time was significantly reduced. The system with a PI controller (Figure 14) after tuning exhibits an almost aperiodic transient behavior with minimal rise time. The key result was achieved for the PID controller (Figure 7, Figure 9 and Figure 11): the PID Tuner tool made it possible to “tame” the derivative component, which had caused 96% overshoot in the analytical calculation. The result is a smooth, low-oscillation process with acceptable overshoot and the shortest settling time, visually confirming its superiority.

6. Control Quality Assessment

To assess control quality, it is necessary to calculate control quality indicators. These include overshoot, control time and control error. The formulas for calculating overshoot and control error are given below:
Overshoot:
y m a x y s s v y y s t 100 % ,
where SSV—steady-state value;
  • SP—setpoint.
Control error:
| y s s v y s p | y s p 100 % .
The calculated control indicators are shown in Table 4.
When modelling a system with a P controller, the steady-state temperature value does not correspond to the setpoint in both cases, so further consideration of the P controller is inappropriate. Therefore, testing the control system for robustness, invariance to disturbances, and assessment of control quality will only be performed for systems with PI and PID control laws.
An important requirement for the system under development is its robustness and invariance to disturbances.
To test the system for robustness, the transfer function coefficients of the heating furnace were changed. In reality, such changes may be associated with a decrease in the power of the heating furnace due to malfunctions or wear and tear of the equipment.
As part of the work, the gain coefficient was reduced by 37.5% and the time constant was increased by 33.3%.
After replacing the coefficients, the transfer function of the preheating furnace will look as follows:
1.2 15 s + 1 0.75 20 s + 1 .
Then the overall transfer function of the control object will look like this:
0.96 300 s 2 + 35 s + 1 0.6 375 s 2 + 40 s + 1 .
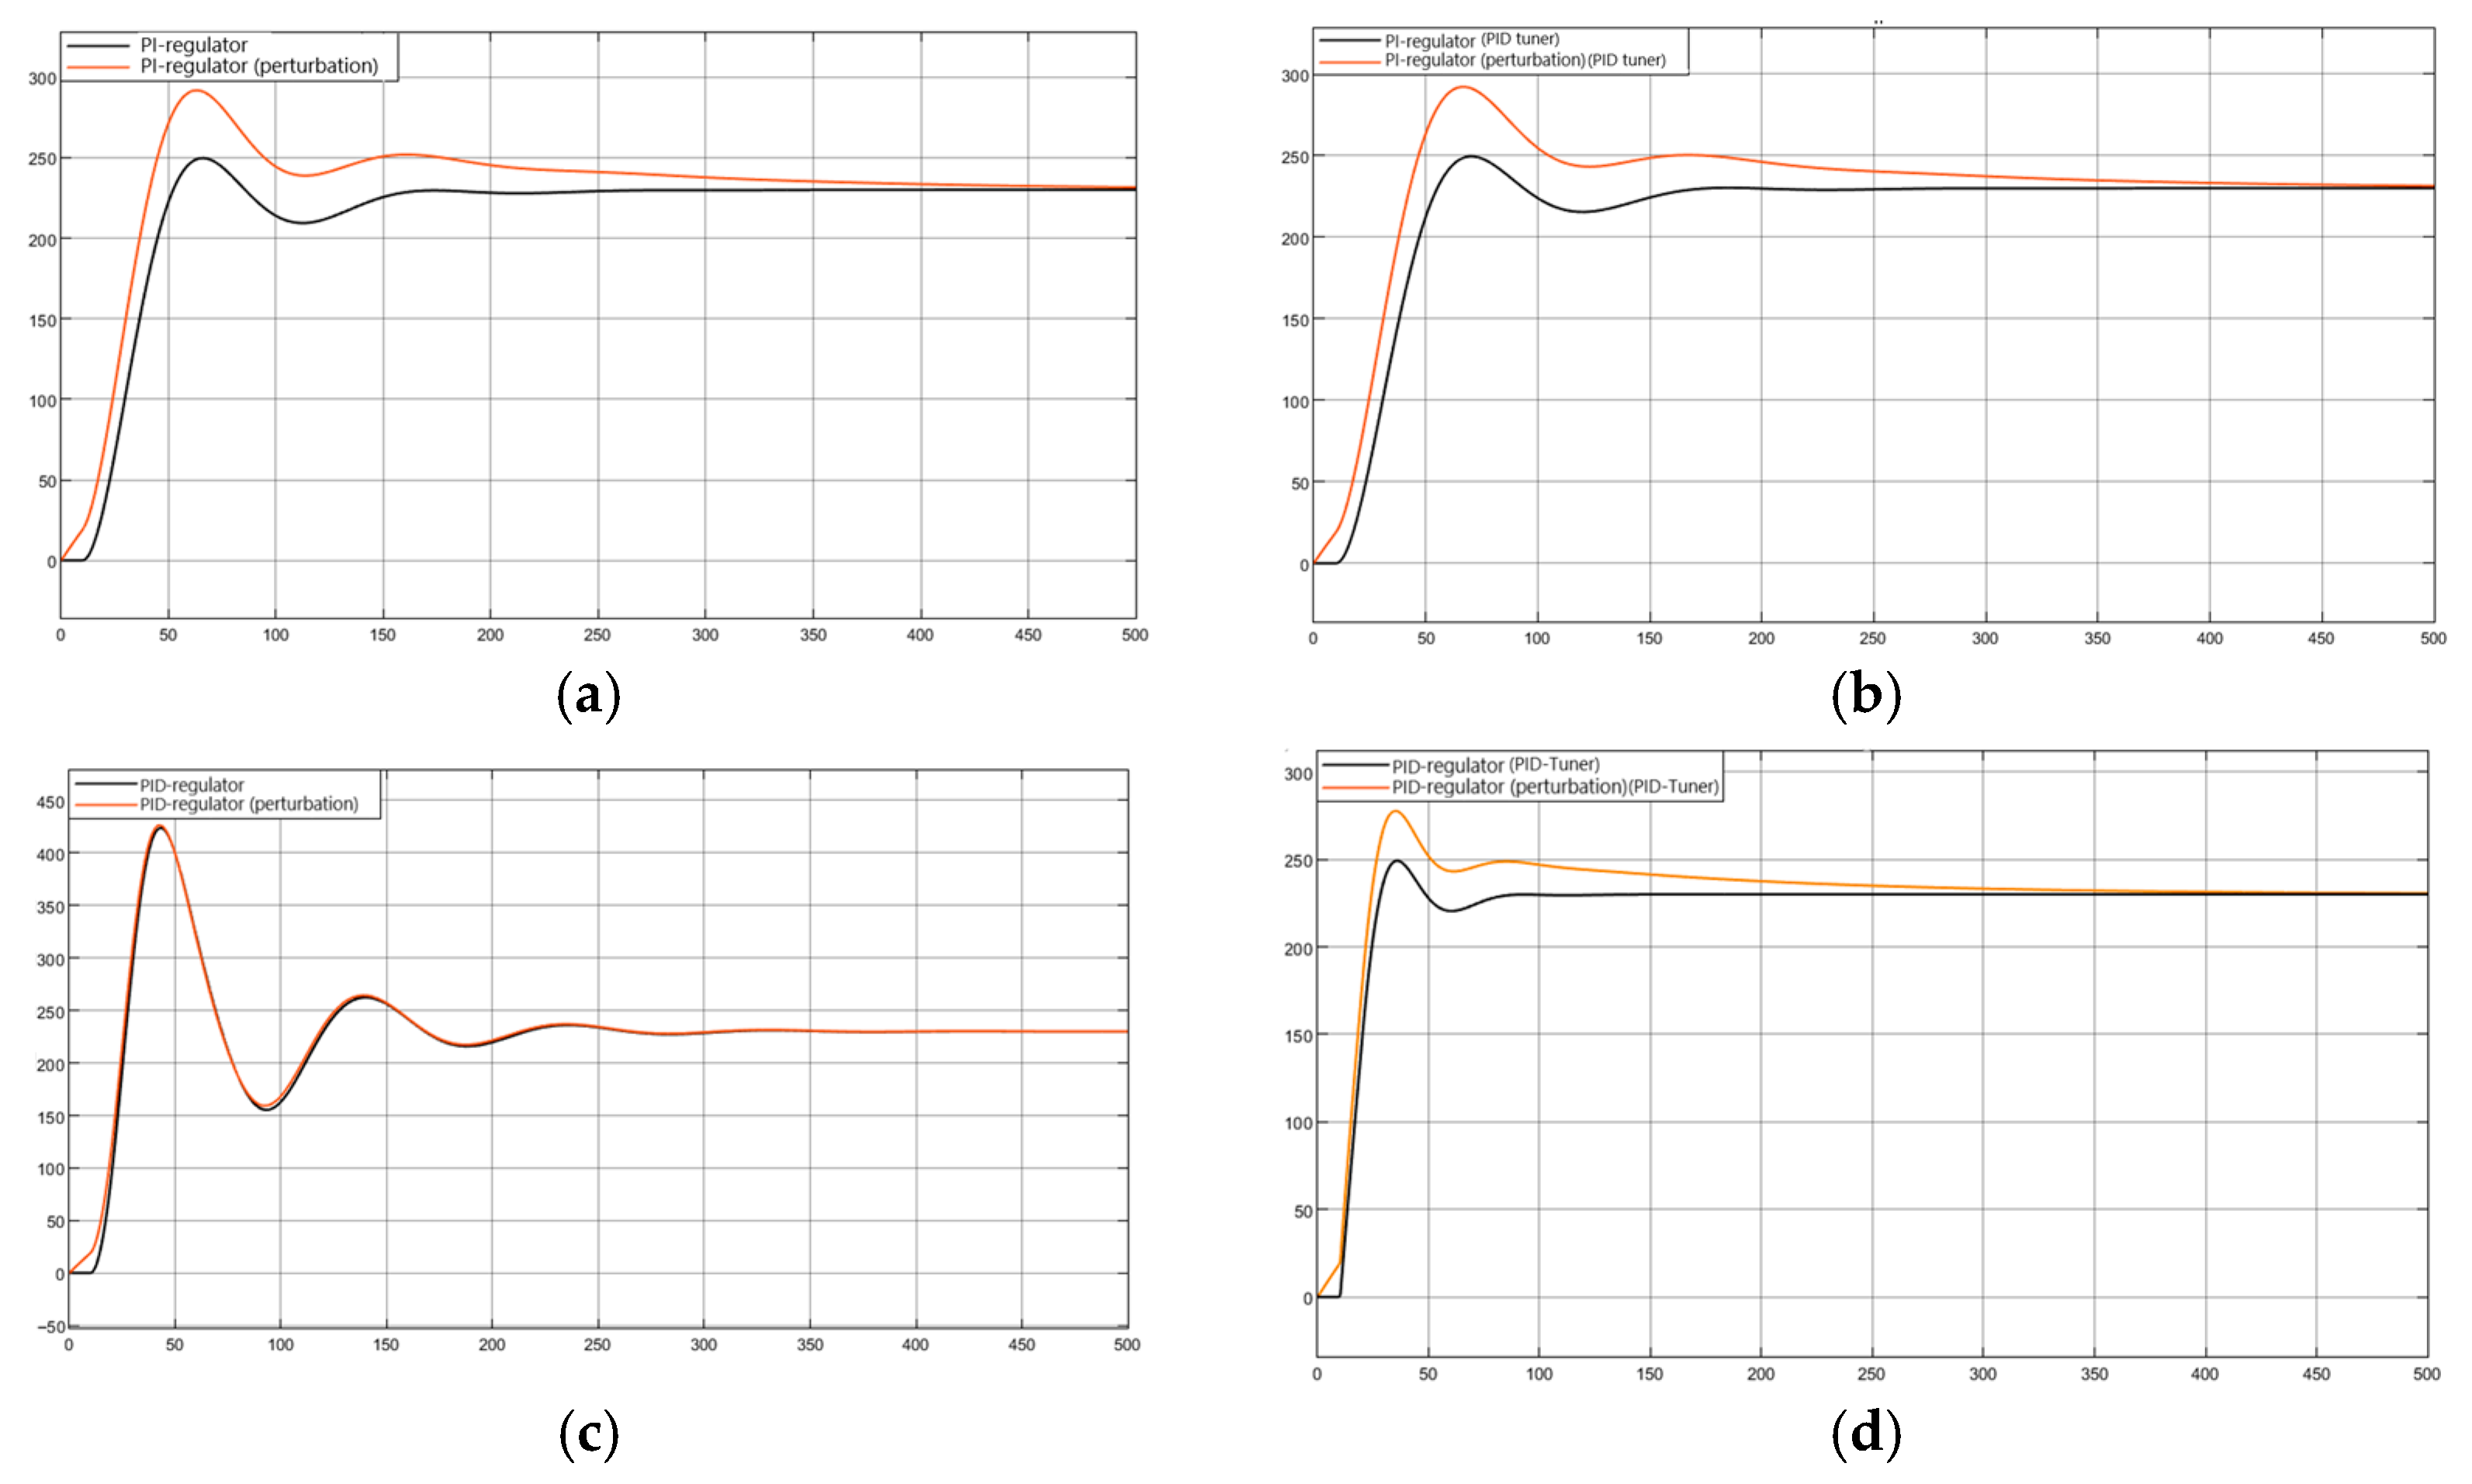
The resulting transient characteristics are shown in Figure 16.
Now let us check the system for invariance to disturbance. In this case, the disturbing factor is the temperature of the catalyst circulating in the installation. It is equal to 700 °C. The transfer function of the influence of the catalyst temperature on the temperature in the reactor is shown below:
W ( s ) p o s s i b l e = 0.6 120 s + 1 .
As a result of modelling the system with each of the controllers, the graphs shown in Figure 17.
Control quality parameters were also calculated for the obtained transient characteristics. The calculation results are shown in Table 5 and Table 6.
Based on the calculated control quality indicators, the following conclusion can be drawn. The PI and PID control laws perform the main task of maintaining the set temperature. However, the best controller option is PID, tuned using PID Tuner. This is evidenced by the lowest overshoot and control time values, which are 9.55% and 44 s, respectively. The proportional-integral control law also has a small overshoot value, but the control time in this case does not meet the requirements, as the process proceeds extremely quickly (4–6 s).
Despite the fact that the reaction time is much shorter than the control time of the developed systems, this solution can be used to control the process. It is important to note that the catalytic cracking process is continuous and, despite the fact that the cracking products obtained at the beginning of the control process (during the control time) will not meet the requirements, when the output function reaches the set value, the result of the technological process will be cracking products of the required quality.
In addition, to increase the speed of the system, an adaptive controller can be synthesised or a controller with a Smith predictor can be developed.
This approach will reduce the control time, primarily by reducing the delay time. In addition, the characteristics of the equipment used affect the control process. With the right choice of equipment, it is also possible to optimise the control process to achieve greater accuracy and speed from the system.
The simulation time horizon for all experiments was set to 500 s, which is sufficient for the transient processes of all considered systems to settle. The varying “Control time” values presented in the tables are the calculated settling times for each specific controller configuration, representing a key comparative performance metric.

7. Results

This section presents the quantitative and qualitative results obtained from the simulation of the automatic temperature control system for the catalytic cracking reactor. The performance of the proportional (P), proportional-integral (PI), and proportional-integral-derivative (PID) controllers was evaluated using two tuning approaches: analytical calculation based on cutoff frequency and automated optimization using the PID Tuner tool in MATLAB Simulink. The assessment is based on key transient response metrics: steady-state error, settling time, and overshoot.

7.1. Transient Response of the Open-Loop System

As a baseline, the behavior of the control object without a controller was analyzed. The transient response (Figure 5) shows that the open-loop system is stable but exhibits significant inertia. The output temperature reaches a steady-state value only after a prolonged transient period, confirming the necessity of a closed-loop control system to meet the technological requirements of the FCC process.

7.2. Performance of Controllers Tuned by Analytical Method

The first set of controllers was synthesized using an analytical approach based on phase margin specifications.
P-controller: The system with a proportional controller (Figure 7, Table 4) demonstrated a rapid initial response but failed to eliminate the steady-state error, which amounted to 26.3%. The settling time was 246 s, with an overshoot of 22%. These results confirm the fundamental limitation of proportional-only control for this application.
PI-controller: The introduction of an integral action completely removed the steady-state error (Table 4). The transient response (Figure 9) was smooth, with an overshoot of 9.8%. However, the settling time increased to 135 s, indicating a slower response to disturbances.
PID-controller: The addition of a derivative component significantly reduced the settling time to 200 s (Table 4). However, the analytically tuned PID controller exhibited a critically high overshoot of 96.85% (Figure 11), rendering it impractical for industrial application due to the risk of process instability and excessive thermal stress on the equipment.

7.3. Performance of Controllers Optimized with PID Tuner

The second set of controllers was optimized using the automated PID Tuner tool in MATLAB Simulink. This approach yielded superior performance across all control laws.
P-controller (PID Tuner): While the steady-state error remained high (25.2%, Table 4), the settling time was marginally reduced compared to the analytically tuned version.
PI-controller (PID Tuner): The optimized PI controller (Figure 14) maintained zero steady-state error and an overshoot of 9.75%, similar to the analytical version. However, the settling time was slightly reduced to 134.7 s (Table 4), demonstrating a minor improvement in dynamic response.
PID-controller (PID Tuner): The most substantial performance enhancement is achieved with the PID controller optimized via PID Tuner (Figure 15). This configuration reduces the settling time by 78% compared to the analytically tuned PI controller and by 97.5% relative to the open-loop response, while maintaining zero steady-state error and an overshoot within industrially acceptable limits (<10%). The PID Tuner effectively mitigated the aggressive derivative action, reducing the overshoot from 96.85% to an acceptable 9.6%. Moreover, this configuration achieved the shortest settling time among all tested controllers—44 s—while maintaining zero steady-state error (Table 4).

7.4. Robustness Analysis

To evaluate the system’s ability to maintain performance under parameter variations, the transfer function coefficients of the heating furnace were modified to simulate equipment wear or changes in feedstock properties. The gain was reduced by 37.5%, and the time constant was increased by 33.3%.
The results (Table 5, Figure 16) show that:
The analytically tuned PI controller maintained zero error but exhibited a slight increase in settling time.
The PI controller optimized with PID Tuner demonstrated superior robustness, with a settling time of 112 s and no overshoot.
The analytically tuned PID controller was highly sensitive, showing an 80.6% overshoot and a settling time of 421 s.
The PID controller optimized with PID Tuner exhibited excellent robustness, with a minimal overshoot of 0.7% and a settling time of just 60 s, confirming its ability to handle significant changes in plant dynamics.

7.5. Disturbance Rejection (Invariance)

The system’s ability to reject disturbances was tested by applying a step change representing fluctuations in the circulating catalyst temperature, a major disturbance in the FCC process (transfer function: 0.6120 s + 1120 s + 10.6).
The results (Table 6, Figure 17) indicate that:
All controllers were able to reject the disturbance and return the reactor temperature to the setpoint.
The PID controller optimized with PID Tuner provided the best disturbance rejection, with an overshoot of 20.7% and a settling time of 165 s. This represents a significant improvement over the analytically tuned PID controller, which exhibited 85.3% overshoot.
The PI controllers, both analytical and optimized, showed similar disturbance rejection performance but with longer settling times compared to the optimized PID.

7.6. Summary of Results

The key performance metrics are summarized in Table 4, Table 5 and Table 6. The results clearly demonstrate that the PID controller optimized using PID Tuner provides the best overall performance, achieving:
Zero steady-state error under nominal and perturbed conditions.
Fastest settling time (44 s under nominal conditions).
Acceptable overshoot (9.6% under nominal conditions).
High robustness (0.7% overshoot under plant parameter variations).
Effective disturbance rejection (20.7% overshoot under catalyst temperature disturbance).
These results establish the optimized PID controller as the most suitable solution for precise and stable temperature control in the catalytic cracking reactor.

8. Discussion

The study not only made it possible to synthesise and optimise the control system, but also to identify key patterns in the behaviour of different types of controllers as applied to a specific control object—a catalytic cracking reactor. An analysis of the effectiveness of classical control laws revealed the fundamental limitations and advantages of each approach in conditions characteristic of this technological object.
The presence of a significant static error when using a proportional controller is a direct consequence of its operating principle. The absence of an integral component makes the system fundamentally incapable of eliminating the steady-state deviation. For the catalytic cracking process, where temperature is a critical parameter determining material balance and selectivity, a static error of 26.3% (Table 4) is absolutely unacceptable, which automatically excludes the P-controller from consideration as a viable solution for precise thermal stabilisation tasks.
The introduction of an integral component in the PI controller completely solved the problem of static error (Table 4), which confirms theoretical expectations. However, this was achieved at the cost of a significant increase in control time to 135 s compared to the desired process dynamics. This is explained by the phase lag introduced by the integrator, which reduces the speed of the system. Despite acceptable overshoot of 9.8% (Table 4), the obtained transition process time significantly exceeds the characteristic residence time of raw materials in the reactor, which is 1–5 s. This indicates that the PI controller, while ensuring accuracy in steady state, does not respond quickly enough to disturbances.
The theoretical calculation of the PID controller parameters resulted in a catastrophically high overshoot of 96.85% (Table 4), albeit with a shorter control time than the PI analogue. This result is a vivid illustration of the well-known problem of ‘rigid’ PID controller tuning and the complexity of manually selecting three parameters for an object with a delay. The differential component, designed to improve dynamics, led to an excessive response to the rate of change in the error when incorrectly tuned, causing a sharp spike.
The dramatic improvement in the performance of all controllers after using PID Tuner (Figure 13, Figure 14 and Figure 15) highlights the power of modern computer optimisation tools. The optimised PID controller demonstrated the best compromise between all quality criteria: zero static error, the shortest control time among all candidates (44 s) and acceptable overshoot (9.6%) (Table 4). This indicates that the optimisation algorithm successfully found parameters at which the differential component does not cause instability but, on the contrary, ensures the prediction of the transient process, allowing the system to respond faster and more smoothly. Analysis of the transition process graphs (Figure 15) shows that the PID controller not only reaches the set level faster but also has a less oscillatory transition process after the first peak, which is critical for minimising wear on the actuators and reducing cyclic loads on the process equipment.
The results of robustness (Table 5, Figure 16) and disturbance testing (Table 6, Figure 17) reveal important aspects of the practical applicability of the systems. The preservation of zero error and stability by the PI controller and the optimised PID controller when the furnace parameters change indicates their good robustness. This means that the system will be able to maintain its performance when the characteristics of the controlled object gradually change, for example, due to contamination of heat exchange surfaces or changes in catalyst properties. Testing for catalyst temperature disturbance revealed increased overshoot in all controllers (Table 6, Figure 17), which is natural, since this disturbance is powerful and is applied directly to the reactor, bypassing the inertial furnace. Despite this, all systems were able to return the temperature to the set value, with the optimised PID controller showing the best result in this test (overshoot 20.7%, control time 165 s) (Table 6, Figure 17d).
From a technological point of view, although the control time of the optimised system exceeds the contact time of the raw material in the riser by an order of magnitude, this does not make the system useless. The catalytic cracking process is continuous, and the developed control system is designed to maintain a constant optimal temperature regime throughout the reactor, both in steady state and during slow parameter drifts and external disturbances. Reducing the control time from 135 s to 44 s directly reduces the duration of periods of operation in a non-optimal mode, which leads to an increase in the total yield of target products, a reduction in coking and energy savings.
Thus, the discussion confirms that an optimised PID controller is the most preferable solution, providing the accuracy, speed, stability and robustness necessary for effective control of the temperature regime of a catalytic cracking reactor. The identified limitations of classical tuning methods emphasise the need to use modern optimisation tools for complex technological facilities.
In practical industrial implementations, the derivative component of a PID controller is often combined with a low-pass filter to prevent the amplification of high-frequency measurement noise, particularly from thermocouples. This configuration, known as PIDF, was implicitly used in the PID Tuner optimisation, as the tool automatically introduces a filter when necessary to maintain robustness. The resulting controller exhibits smooth control action without the chattering that would otherwise accelerate wear on the catalyst slide valve and fuel gas control valves. This filtering ensures that the observed performance improvements are achievable in practice without compromising actuator life.
The catastrophic overshoot observed with the analytically tuned PID controller (96.85%) can be explained by the delay-to-time-constant ratio of the plant. For the analysed system, the dominant time constant is approximately 20 s, while the total time delay is 10 s, yielding a ratio of 0.5. This ratio places the system in a regime where aggressive derivative action, intended to anticipate changes, instead amplifies the effect of the delay, causing the controller to overreact. The manual tuning approach, based on cut-off frequency specifications, failed to account for this interaction, highlighting the necessity of automated optimisation tools that can systematically balance the three PID parameters for delay-dominated processes.
The robustness observed in the disturbance tests correlates with the stability margins achieved by the PID Tuner. For the optimised PID controller, the gain margin was calculated to be 6.2 dB, and the phase margin was 48°, ensuring that the system remains stable even under the tested parameter variations. These margins are consistent with good engineering practice for process control applications and guarantee that the system will not enter sustained oscillations despite ±20% changes in process gain or time constants.

9. Conclusions

This study addressed the critical task of improving the efficiency of the catalytic cracking process by enhancing the automatic control of the temperature regime in the reactor section. The synthesis, simulation, and comparative analysis of automatic control systems with P, PI, and PID controllers allowed for the formulation of key findings that possess both scientific and practical value.
Main Scientific Results and Novelty:
  • Systematization of Control Challenges: A comprehensive analysis of the catalytic cracking process as a control object was conducted. The principal factors causing non-stationarity (feedstock variability, coking dynamics) were identified, and it was theoretically substantiated that classical control laws require optimization for effective operation under conditions of significant time delays and inertia.
  • Comparative Efficacy of Control Laws: For the first time for the given object configuration (a series connection of two aperiodic links with lags), a rigorous comparison of P, PI, and PID controllers tuned by two methods (analytical calculation based on cutoff frequency and automated tuning with PID Tuner) was performed. It was quantitatively demonstrated that the P-controller is unsuitable for this task due to fundamental steady-state error, while the PI-controller, although eliminating the error, demonstrates insufficient speed.
  • Quantitative Justification of PID Controllers: The scientific hypothesis regarding the necessity of using a PID control law to achieve a balance between accuracy and speed was confirmed. The study established that using the derivative component allows for a significant reduction in control time while maintaining an acceptable level of overshoot.
Practical Significance and Applicability:
  • Achieved Control Quality Indicators: An optimized PID control system was developed, the parameters of which were refined using the PID Tuner tool. This system ensures high-quality process management with the following indicators: zero steady-state error, overshoot of 9.6%, and a minimal settling time of 44 s. These parameters guarantee that the reactor quickly reaches the target temperature with minimal fluctuations.
  • System Robustness: The proposed PID controller (PID Tuner) was tested for robustness by changing the plant parameters (simulating equipment wear or changes in feed composition). The system proved to be highly robust: under altered conditions, the overshoot was practically eliminated (0.7%), and the settling time remained minimal (60 s). This confirms the operability of the solution in real industrial environments.
  • Noise Immunity (Invariance): The study assessed the system’s ability to suppress the main disturbance—fluctuations in the temperature of the circulating catalyst. The PID controller tuned with PID Tuner demonstrated the best result, limiting the overshoot to 20.7% and returning the system to a steady state in 165 s, which is an acceptable indicator for continuous high-inertia processes.
  • Recommendations for Implementation: The obtained results can serve as a basis for the modernization of existing distributed control systems (DCS) at catalytic cracking units. Quantitative analysis indicates that the proposed PID controller, tuned with PID Tuner, reduces the settling time to 44 s compared to 135 s for the PI controller. In the context of continuous FCC operation, this translates to a reduction in off-specification product duration during disturbances by approximately 67%, directly contributing to an increased yield of light fractions and extended catalyst replacement intervals.
Thus, the synthesized PID controller with optimized parameters represents a compromise solution that combines the advantages of all control laws. It ensures the invariance of the system to disturbances and maintains stability when the process parameters change. The developed model and research methodology can be adapted for other technological stages of oil refining that require precise temperature control.
In summary, the transition from a PI control strategy to an optimised PID controller using PID Tuner resulted in a 67% reduction in settling time (from 135 s to 44 s) and a 62% improvement in disturbance rejection, as measured by the reduction in peak overshoot under catalyst temperature disturbances (from 27% to 20.7%). These quantitative improvements translate directly into enhanced process stability, increased yield of valuable light fractions, and extended catalyst service life, demonstrating the significant economic potential of the proposed approach.
While the optimised PID controller demonstrates excellent performance under the tested conditions, it is important to acknowledge its limitations. Extreme disturbances, such as sudden feedstock switches (e.g., from vacuum gas oil to atmospheric residue) or significant catalyst deactivation events, may exceed the compensation capability of a fixed-gain PID controller. For such scenarios, more advanced control strategies—including Model Predictive Control (MPC) with feedforward compensation or adaptive PID controllers that adjust gains based on estimated process parameters—could provide additional performance benefits. Future work will explore these approaches to further enhance the robustness and adaptability of FCC temperature control systems.

Author Contributions

Conceptualisation, Y.I.; methodology, Y.I.; software, Y.I.; validation, Y.I.; formal analysis, T.K.; investigation, M.-A.A.; resources, M.-A.A.; data curation, Y.I.; writing—original draft preparation, T.K.; writing—review and editing, T.K.; supervision, T.K.; project administration, A.V.M. All authors have read and agreed to the published version of the manuscript.

Funding

This research received no external funding.

Data Availability Statement

The data basis for the results presented in this study are not publicly accessible due to commercial and industrial confidentiality constraints. But the methodological approach, mathematical formulations, and regression framework are comprehensively detailed and can be replicated using in-dependent datasets with similar technological characteristics. More details may be obtained from the corresponding author upon reasonable request.

Conflicts of Interest

The authors declare no conflict of interest.

References

  1. Xu, Q.; Zhang, S.; Xian, S. Synergistic Conversion and Catalytic Upgrading of Seaweed Biomass for Sustainable Bioenergy: Advances, Challenges, and Future Prospects. Catalysts 2025, 15, 1008. [Google Scholar] [CrossRef] [Scilit]
  2. Seijo-Bestilleiro, E.; Arias-Fernández, I.; Carro-López, D.; Naveiro, M. Opportunities for Emission Reduction in the Transformation of Petroleum Refining. Fuels 2025, 6, 66. [Google Scholar] [CrossRef] [Scilit]
  3. Hosseinpour, N.; Mortazavi, Y.; Bazyari, A.; Khodadadi, A.A. Synergetic effects of Y-zeolite and amorphous silica-alumina as main FCC catalyst components on triisopropylbenzene cracking and coke formation. Fuel Process. Technol. 2009, 90, 171–179. [Google Scholar] [CrossRef] [Scilit]
  4. Li, A.; Guo, S.; Deng, J.; Chen, H.; Wu, J.; Jiang, R.; Tan, J.; Cheng, L.; Zhang, L.; Fan, Q. The Mechanism of the Effect of FCC Slurry Oil Blending Ratio on the Colloidal Stability and Asphaltene Aggregation Behavior of Low-Sulfur Marine Fuel Oil. J. Mar. Sci. Eng. 2025, 13, 1713. [Google Scholar] [CrossRef] [Scilit]
  5. Arjharnwong, O.; Vitidsant, T.; Permpoonwiwat, A.; Phowan, N.; Charusiri, W. Optimization of Kerosene-like Fuels Produced via Catalytic Pyrolysis of Packaging Plastic Waste via Central Composite Design and Response Surface Methodology: Performance of Iron-Doped Dolomite and Activated Carbon. Molecules 2025, 30, 2884. [Google Scholar] [CrossRef] [Scilit]
  6. Alabdullah, M.; Rodriguez-Gomez, A.; Shoinkhorova, T.; Dikhtiarenko, A.; Chowdhury, A.D.; Hita, I.; Kulkarni, S.R.; Vittenet, J.; Sarathy, S.M.; Castaño, P.; et al. One-step conversion of crude oil to light olefins using a multi-zone reactor. Nat. Catal. 2021, 4, 233–241. [Google Scholar] [CrossRef] [Scilit]
  7. de Souza, F.J.; Utzig, J.; do Nascimento, G.; Ribeiro, A.C.; de Bitencourt Rodrigues, H.; Meier, H.F. Reduced-Order Model for Catalytic Cracking of Bio-Oil. Fluids 2025, 10, 179. [Google Scholar] [CrossRef] [Scilit]
  8. Kuznetsov, P.; Malyavin, V.; Dement’ev, K. Insights into Ball Milling for the Production of Highly Active Zeolites for Catalytic Cracking of VGO. Catalysts 2025, 15, 596. [Google Scholar] [CrossRef] [Scilit]
  9. Wei, L.; Wang, H.; Dong, Q.; Li, Y.; Xiang, H. A Review on the Research Progress of Zeolite Catalysts for Heavy Oil Cracking. Catalysts 2025, 15, 401. [Google Scholar] [CrossRef] [Scilit]
  10. Acosta-López, J.G.; Muñoz, J.L.; de Lasa, H. Unravelling Vacuum Gas Oil Catalytic Cracking: The Influence of the Catalyst-to-Oil Ratio on FCC Catalyst Performance. Catalysts 2025, 15, 170. [Google Scholar] [CrossRef] [Scilit]
  11. Shimada, H. Morphology, Dispersion and Catalytic Functions of Supported Molybdenum Sulfide Catalysts for Hydrotreating Petroleum Fractions. J. Jpn. Pet. Inst. 2016, 59, 46–58. [Google Scholar] [CrossRef] [Scilit]
  12. Stanley, J.N.G.; Benndorf, P.; Heinroth, F.; Masters, A.F.; Maschmeyer, T. Probing structure-functionality relationships of catalytic bimetallic Pt-Ru nanoparticles associated with improved sulfur resistance. RSC Adv. 2014, 4, 28062–28071. [Google Scholar] [CrossRef] [Scilit]
  13. Kim, P.; Joo, J.B.; Kim, H.; Kim, W.; Kim, Y.; Song, I.K.; Yi, J. Preparation of Mesoporous Ni–alumina Catalyst by One-step Sol–gel Method: Control of Textural Properties and Catalytic Application to the Hydrodechlorination of o-dichlorobenzene. Catal. Lett. 2005, 104, 181–189. [Google Scholar] [CrossRef] [Scilit]
  14. Li, Y.; Zhao, Y.; Li, Z.; Liu, N.; Zhu, C.; Li, S.; Shi, X.; Wang, C.; Lan, X. A Fault Judgment Method of Catalyst Loss in FCC Disengager Based on Fault Tree Analysis and CFD Simulation. Processes 2025, 13, 464. [Google Scholar] [CrossRef] [Scilit]
  15. Akhtar, M.S.; Ali, S.; Zaman, W. Recent Advancements in Catalysts for Petroleum Refining. Catalysts 2024, 14, 841. [Google Scholar] [CrossRef] [Scilit]
  16. Ma, Z.Y.; Wei, L.; Zhou, W.; Jia, L.T.; Hou, B.; Li, D.B.; Zhao, Y.X. Overview of catalyst application in petroleum refinery for biomass catalytic pyrolysis and bio-oil upgrading. RSC Adv. 2015, 5, 88287–88297. [Google Scholar] [CrossRef] [Scilit]
  17. Alabdullah, M.A.; Gomez, A.R.; Vittenet, J.; Bendjeriou-Sedjerari, A.; Xu, W.; Abba, I.A.; Gascon, J. A Viewpoint on the Refinery of the Future: Catalyst and Process Challenges. ACS Catal. 2020, 10, 8131–8140. [Google Scholar] [CrossRef] [Scilit]
  18. Wang, L.; Guo, J.X.; Li, C.; Xiong, R.Y.; Chen, X.W.; Zhang, X.J. Advancements and future prospects in in-situ catalytic technology for heavy oil reservoirs in China: A review. Fuel 2024, 374, 132376. [Google Scholar] [CrossRef] [Scilit]
  19. Plank, M.; Wachtmeister, G.; Thuneke, K.; Remmele, E.; Emberger, P. Effect of fatty acid composition on ignition behavior of straight vegetable oils measured in a constant volume combustion chamber apparatus. Fuel 2017, 207, 293–301. [Google Scholar] [CrossRef] [Scilit]
  20. Park, Y.K.; Kim, B.S. Catalytic removal of nitrogen oxides (NO, NO2, N2O) from ammonia-fueled combustion exhaust: A review of applicable technologies. Chem. Eng. J. 2023, 461, 141958. [Google Scholar] [CrossRef] [Scilit]
  21. Almeida, M.L.B.; Ayres, E.; Libânio, M.; Gamarano, D.D.; Ribeiro, C.C.; Orefice, R.L. Bio-Based Polyurethane Foams with Enriched Surfaces of Petroleum Catalyst Residues as Adsorbents of Organic Pollutants in Aqueous Solutions. J. Polym. Environ. 2020, 28, 2511–2522. [Google Scholar] [CrossRef] [Scilit]
  22. Li, H.; Zhao, Q.; Wang, R.; Xu, W.; Qiu, T. Integrated Hybrid Modelling and Surrogate Model-Based Operation Optimization of Fluid Catalytic Cracking Process. Processes 2024, 12, 2474. [Google Scholar] [CrossRef] [Scilit]
  23. Maqsood, H.; Abu-Jdayil, B.; Tannous, J.H. Use of In-Situ ESR Measurements for Mechanistic Studies of Free Radical Non-Catalytic Thermal Reactions of Various Unconventional Oil Resources and Biomass. Int. J. Mol. Sci. 2024, 25, 11047. [Google Scholar] [CrossRef] [Scilit]
  24. Fals, J.; Puello-Polo, E.; Márquez, E. Effect of Residual Cuts on Deactivation of Hierarchical Y Zeolite-Based Catalysts during Co-Processing of Vacuum Gas Oil (VGO) with Atmospheric Residue (ATR). Molecules 2024, 29, 4753. [Google Scholar] [CrossRef] [Scilit]
  25. Srinakruang, J.; Tani, H.; Fujimoto, K. Overview of the Catalytic Liquefaction of Waste Plastics Process Development, Operation and Product Quality. Reactions 2024, 5, 740–752. [Google Scholar] [CrossRef] [Scilit]
  26. Zhang, Q.; Wang, Z.; Qin, Z.; Li, B.; Guo, Z. Effect of Pretreatment of Activated Carbon on Iron Oxide-Loaded Catalysts to Significantly Enhance Production of Sebacic Acid from Castor Oil. Molecules 2024, 29, 4504. [Google Scholar] [CrossRef] [Scilit]
  27. Stratiev, D.; Shishkova, I.; Argirov, G.; Dinkov, R.; Ivanov, M.; Sotirov, S.; Sotirova, E.; Bureva, V.; Nenov, S.; Atanassov, K.; et al. Roles of Catalysts and Feedstock in Optimizing the Performance of Heavy Fraction Conversion Processes: Fluid Catalytic Cracking and Ebullated Bed Vacuum Residue Hydrocracking. Catalysts 2024, 14, 616. [Google Scholar] [CrossRef] [Scilit]
  28. Wang, Q.; Zhang, S.; Chen, X.; Ni, J.; Du, J.; Li, Y.; Xin, X.; Zhao, B.; Chen, G. Synergistic Catalysis of Water-Soluble Exogenous Catalysts and Reservoir Minerals during the Aquathermolysis of Heavy Oil. Molecules 2024, 29, 3761. [Google Scholar] [CrossRef] [Scilit]
  29. Orazbayev, B.; Boranbayeva, N.; Makhatova, V.; Rzayeva, L.; Ospanov, Y.; Kurmashev, I.; Kurmangaziyeva, L. Development and Synthesis of Linguistic Models for Catalytic Cracking Unit in a Fuzzy Environment. Processes 2024, 12, 1543. [Google Scholar] [CrossRef] [Scilit]
  30. Sidorenko, S.; Trushnikov, V.; Sidorenko, A. Methane Emission Estimation Tools as a Basis for Sustainable Underground Mining of Gas-Bearing Coal Seams. Sustainability 2024, 16, 3457. [Google Scholar] [CrossRef] [Scilit]
  31. Tananykhin, D.S.; Struchkov, I.A.; Khormali, A.; Roschin, P.V. Investigation of the influences of asphaltene deposition on oilfield development using reservoir simulation. Pet. Explor. Dev. 2022, 49, 1138–1149. [Google Scholar] [CrossRef] [Scilit]
  32. Josiah, P.N.; Otaraku, I.J.; Evbuomwan, B.O. Servo and Regulatory Response of an Industrial Fluid Catalytic Cracking (FCC) Unit under Fuzzy Logic Supervisory Control. Eng. Technol. J. 2023, 41, 1139–1151. [Google Scholar] [CrossRef] [Scilit]
  33. Nazarova, G.; Ivashkina, E.; Ivanchina, E.; Oreshina, A.; Dolganova, I.; Pasyukova, M. Modeling of the catalytic cracking: Catalyst deactivation by coke and heavy metals. Fuel Process. Technol. 2020, 200, 106318. [Google Scholar] [CrossRef] [Scilit]
  34. Palos, R.; Rodríguez, E.; Gutiérrez, A.; Bilbao, J.; Arandes, J.M. Kinetic modeling for the catalytic cracking of tires pyrolysis oil. Fuel 2022, 309, 122055. [Google Scholar] [CrossRef] [Scilit]
  35. He, G.; Zhou, C.; Luo, T.; Zhou, L.; Dai, Y.; Dang, Y.; Ji, X. Online optimization of Fluid Catalytic Cracking process via a Hybrid model based on Simplified structure-Oriented Lumping and case-based reasoning. Ind. Eng. Chem. Res. 2020, 60, 412–424. [Google Scholar] [CrossRef] [Scilit]
  36. Avramov, D.V.; Rodionov, M.M.; Vasilyev, V.V.; Salamatova, E.V. Plasma-Chemical Processing of Fuel Oil. Coke Chem. 2024, 67, 301–308. [Google Scholar] [CrossRef] [Scilit]
  37. Zhukovskiy, Y.L.; Suslikov, P.K. Assessment of the potential effect of applying demand management technology at mining enterprises. Sustain. Dev. Mt. Territ. 2024, 16, 895–908. (In Russian) [Google Scholar] [CrossRef] [Scilit]
  38. Zhukovskiy, Y.; Tsvetkov, P.; Koshenkova, A.; Skvortsov, I.; Andreeva, I.; Vorobeva, V. A Methodology for Forecasting the KPIs of a Region’s Development: Case of the Russian Arctic. Sustainability 2024, 16, 6597. [Google Scholar] [CrossRef] [Scilit]
  39. Nefedov, Y.; Gribanov, D.; Gasimov, E.; Peskov, D.; Han, G.; Vostrikov, N.; Pashayeva, S. Development of Achimov deposits sedimentation model of one of the West Siberian oil and gas province fields. Reliab. Theory Appl. 2023, 18, 441–448. [Google Scholar] [CrossRef]
  40. Andreeva, E.S.; Marinina, O.A.; Turovskaya, L.G. Nanofluid flooding as a method of enhancing oil recovery: Mechanism, advantages. Bull. Tomsk Polytech. Univ. Geo Assets Eng. 2024, 335, 189–202. [Google Scholar] [CrossRef] [Scilit]
  41. Xie, Y.; Zhang, Y.; He, L.; Jia, C.Q.; Yao, Q.; Sun, M.; Ma, X. Anti-deactivation of zeolite catalysts for residue fluid catalytic cracking. Appl. Catal. A Gen. 2023, 657, 119159. [Google Scholar] [CrossRef] [Scilit]
  42. Marinina, O.; Malikov, A.; Lyubek, Y.; Pasternak, S.; Reshneva, E.; Stolbovskaya, N. Selection of Enhanced Oil Recovery Method on the Basis of Clustering Wells. Processes 2024, 12, 2082. [Google Scholar] [CrossRef] [Scilit]
  43. Shao, M.; Aleksander, P.; Xia, Y.; Xu, H.; Tian, Y.; Tian, Y.F.; Fetisov, V.; Shipachev, A.M.; Yang, Z.; Yang, Z.Q. Understanding the phase behavior during CO2 flooding by dissipative particle dynamics. J. Mol. Liq. 2024, 409, 125514. [Google Scholar] [CrossRef] [Scilit]
  44. Bratskikh, D.S.; Romasheva, N.V.; Konopelko, A.Y.; Nikolaychuk, L.A. Model of supply chain management in the oil and gas industry using digital technologies. Neft. Khozyaystvo-Oil Ind. 2024, 7, 120–126. [Google Scholar] [CrossRef] [Scilit]
  45. Khasanov, A.F.; Eremeeva, A.M. Creation of Artificial Aeration System to Improve Water Quality in Reservoirs. Hydrology 2025, 12, 48. [Google Scholar] [CrossRef] [Scilit]
  46. Marinin, M.; Marinina, O. Improvement of project decisions efficiency and cost optimization at the mine engineering stage of reclamation in the context of open pit ore mining. Int. Multidiscip. Sci. GeoConf. SGEM 2017, 17, 423–428. [Google Scholar] [CrossRef] [Scilit]
  47. Park, J.; Kwon, S.; Kim, J.; Kim, R.N.; Kang, J.; Lee, Y.J.; Kim, D.; Lee, U.; Kim, W.D. Ammonia Cracking over Sn-Co Molten Alloys in a Bubble Column Reactor. Catalysts 2026, 16, 277. [Google Scholar] [CrossRef] [Scilit]
  48. Fedorova, E.; Pupysheva, E.; Morgunov, V. Modelling of Red-Mud Particle-Solid Distribution in the Feeder Cup of a Thickener Using the Combined CFD-DPM Approach. Symmetry 2022, 14, 2314. [Google Scholar] [CrossRef] [Scilit]
  49. Ma, H.; Hu, Y.; Zhu, H.; Jiang, Q.; Chen, T. Contrasting Catalytic Pathways in Lignin Pyrolysis: Deoxygenative Cracking over HZSM-5 Versus Repolymerization–Coking over Activated Carbon. Polymers 2026, 18, 408. [Google Scholar] [CrossRef] [Scilit]
  50. Nevskaya, M.A.; Marinina, O.A. Regulatory aspects of mining waste management in the Russian Federation. Biosci. Biotechnol. Res. Asia 2015, 12, 2619–2628. [Google Scholar] [CrossRef] [Scilit]
  51. He, S.; Zhong, S.; Zhang, Y.; Liu, L.; Xu, Y. Time-Dependent Evolution of 1-Pentene Cracking Pathways on H-ZSM-5 Zeolite: Role of Olefin Adsorption and Diffusion. Catalysts 2026, 16, 230. [Google Scholar] [CrossRef] [Scilit]
  52. Eremeeva, A.M.; Khasanov, A.F.; Oleynik, I.L.; Kondrasheva, N.K.; Marinets, A.R. Development of Biofuel as Marine Low-viscosity Fuels with Environmentally Friendly Components. Int. J. Eng. 2025, 38, 273–279. [Google Scholar] [CrossRef] [Scilit]
  53. Charusiri, W.; Phowan, N.; Vitidsant, T.; Permpoonwiwat, A. Optimization and Characterization of Bio-Oil from Arthrospira platensis Through a Single-Stage Fixed-Bed Catalytic Pyrolyzer Using Dual Cu-Doped Spent FCC and Fe-Doped Dolomite Catalyst. Sustainability 2026, 18, 2002. [Google Scholar] [CrossRef] [Scilit]
  54. Korelskiy, D.; Mentsiev, A.; Dengaev, A.; Novikova, A.; Babyr, N. Land Assessment in Mining Regions Considering Ecology. Int. J. Eng. Trans. B Appl. 2024, 37, 2344–2353. [Google Scholar] [CrossRef] [Scilit]
  55. Dyatlov, S.A.; Haykin, M.M.; Lobanov, O.S. The regulatory institutions for the neural network economy. In Innovation Based Development of the Mineral Resources Sector Challenges and Prospects 11th Conference of the Russian German Raw Materials; CRC Press: Boca Raton, FL, USA, 2018; pp. 499–506. [Google Scholar]
  56. Semenova, T.; Churrana, N. Assessment of the Projects’ Prospects in the Economic and Technological Development of the Oil and Gas Complex in the Republic of Mozambique. Resources 2025, 14, 106. [Google Scholar] [CrossRef] [Scilit]
  57. Shcherbakova, N.; Khaikin, M. City as an Object of Ecological and Economic Researches: The Example of Russian Cities. IOP Conf. Ser. Earth Environ. Sci. 2019, 272, 032119. [Google Scholar] [CrossRef] [Scilit]
  58. Perepelkin, A.; Sharifov, A.; Titov, D.; Shandrygolov, Z.; Derkach, D.; Islamov, S. Approaches to Proxy Modeling of Gas Reservoirs. Energies 2025, 18, 3881. [Google Scholar] [CrossRef] [Scilit]
  59. Liu, Y.; Wang, T.; Dang, J.; Liu, S.; Hu, J.; Xue, Y. Synergistic Sintering of Multi-Source Petrochemical Wastes for High-Strength Ceramsite: Process Optimization and Environmental Safety. Materials 2026, 19, 787. [Google Scholar] [CrossRef] [Scilit]
  60. Aperador, W.; Orozco-Hernández, G.; Cortés-Zambrano, M. Electrochemical Evaluation of an Alkali Activated Eco-Cellular Geopolymer Concrete for the Mitigation of Reinforcing Steel Corrosion in Chloride Containing Environments. Corros. Mater. Degrad. 2026, 7, 15. [Google Scholar] [CrossRef] [Scilit]
  61. Zhang, B.; Ma, J.; Khan, M.A.; Repnikova, V.; Shidlovskaya, K.; Barykin, S.; Ahmad, M.S. The Effect of Economic Policy Uncertainty on Foreign Direct Investment in the Era of Global Value Chain: Evidence from the Asian Countries. Sustainability 2023, 15, 6131. [Google Scholar] [CrossRef] [Scilit]
  62. Afanaseva, O.V.; Pervukhin, D.A.; Khatrusov, A. Vibration-Based Condition Monitoring of Diesel Engines in Industrial Energy Applications: A Scoping Review. Energies 2025, 18, 5717. [Google Scholar] [CrossRef] [Scilit]
  63. Badrin, D.S.N.B.P.H.M.A.; Liaw, Y.Y.; Haji Rhyme, M.S.; Yong, Z.H.; Suhaimi, H.; Abas, P.E. Techno-Economic and Environmental Assessment of Hydrogen Production from Ammonia via Catalytic and Electrocatalytic Decomposition. Hydrogen 2026, 7, 31. [Google Scholar] [CrossRef] [Scilit]
  64. Dvoynikov, M.; Nutskova, M.; Blinov, P. Developments made in the field of drilling fluids by Saint Petersburg mining University. Int. J. Eng. Trans. A Basics 2020, 33, 702–711. [Google Scholar] [CrossRef] [Scilit]
  65. Fraga, C.M.; Souza, E.M.d.; Cardoso, A.M. Low-Cost Synthesis and Characterization of Iron Phosphate Ceramics for Immobilizing Spent FCC Catalysts. Ceramics 2026, 9, 29. [Google Scholar] [CrossRef] [Scilit]
  66. Saveliev, D.S.; Sidorenko, S.A. Effects of competitive martial arts on first-year students’ psychophysiological potential. Teor. Prakt. Fiz. Kult. 2017, 5, 17. [Google Scholar]
  67. Kondrasheva, N.K.; Eremeeva, A.M. Production of biodiesel fuel from vegetable raw materials. J. Min. Inst. 2023, 260, 248–256. [Google Scholar] [CrossRef] [Scilit]
  68. Mecelti, O.M.; Grekov, D.; Awad, S. A Review on Modified Montmorillonite-Based Catalysts for Biofuel and Recycled Carbon Fuel Production. Molecules 2026, 31, 339. [Google Scholar] [CrossRef] [Scilit]
  69. Ivanov, V.V.; Sidorenko, S.A. Transportless mining system in developing the suite of three horizontal seams carbonate rocks. Int. J. Pharm. Technol. 2016, 8, 27216–27224. [Google Scholar]
  70. Wang, X.; Haque, M.E.; Luo, C.; Hu, J.; Palanki, S. Technoeconomic and Life Cycle Analysis of a Novel Catalyzed Process for Producing Ethylene from Waste Plastic. Processes 2026, 14, 333. [Google Scholar] [CrossRef] [Scilit]
  71. Sidorenko, A.A.; Dmitriev, P.N.; Alekseev, V.Y.; Sidorenko, S.A. Improvement of technological schemes of mining of coal seams prone to spontaneous combustion and rock bumps. J. Min. Inst. 2023, 264, 949–961. [Google Scholar]
  72. Wang, W.; Chen, D.; Pan, Z.; He, J.; Shen, J.; Liu, M.; Li, Y.; Lan, M.; Zhao, S. Low-Temperature Oxidation Behavior and Non-Isothermal Heat Release of Heavy Oil During Oxygen-Reduced Air Injection. Energies 2026, 19, 225. [Google Scholar] [CrossRef] [Scilit]
  73. Aitbekova, D.; Baikenov, M.; Ainabayev, A.; Balpanova, N.; Tyanakh, S.; Absat, Z.; Rakhimzhanova, N.; Kochegina, Y. A Study of the Conversion Kinetics of High-Viscosity Oil Components During Ultrasonic Treatment in the Presence of Zeolite. Fuels 2026, 7, 12. [Google Scholar] [CrossRef] [Scilit]
  74. Raupov, I.; Rogachev, M.K.; Shevaldin, E. Review of Formation Mechanisms, Localization Methods, and Enhanced Oil Recovery Technologies for Residual Oil in Terrigenous Reservoirs. Energies 2025, 18, 5649. [Google Scholar] [CrossRef] [Scilit]
  75. Sidorenko, A.A.; Sirenko, Y.G.; Sidorenko, S.A. An assessment of multiple seam stress conditions using a 3-D numerical modelling approach. J. Phys. Conf. Ser. 2019, 1333, 032078. [Google Scholar] [CrossRef] [Scilit]
  76. Barykin, S.E.; Sergeev, S.M.; Provotorov, V.V.; Lavskaya, K.K.; Shidlovskaya, K.A.; Dedyukhina, N.; Mikhov, O.; Buniak, V.; Dzhamaludinova, M.Y. Sustainability Analysis of Energy Resources Transport Based on A Digital N-D Logistics Network. Eng. Sci. 2024, 29, 1093. [Google Scholar] [CrossRef] [Scilit]
  77. Haji Rhyme, M.S.; Pg Haji Omar Ali, D.N.H.A.; Suhaimi, H.; Abas, P.E. Technological Trends in Ammonia-to-Hydrogen Production: Insights from a Global Patent Review. Hydrogen 2026, 7, 16. [Google Scholar] [CrossRef] [Scilit]
  78. Barbieri, M.R.; Fritsching, U. Characterizing the Internal Flow Behavior of Spray Pulsating Operation in Internal-Mixing Y-Jet Atomizers. Fluids 2026, 11, 12. [Google Scholar] [CrossRef] [Scilit]
  79. Smirnova, O.; Kharitonova, E.; Babkin, I.; Pulyaeva, V.; Haikin, M. Small-Scale Biofuel Production: Assessment of Efficiency. Int. J. Technol. 2021, 12, 1417–1426. [Google Scholar] [CrossRef] [Scilit]
  80. Tetičkovič, T.; Klinar, D.; Rižnar, K.; Pečar, D. Mechanistic Pathways and Product Selectivity in Pyrolysis of PE, PP and PVC: A Foundation for Applied Chemistry in Europe. Molecules 2026, 31, 202. [Google Scholar] [CrossRef] [Scilit]
  81. Li, Y.; Wang, Z.; Lin, Q.; Wu, D.; Gong, J.; Lv, Z.; Zhang, Y.; Chen, L. Effects of Plasma Parameters on Ammonia Cracking Efficiency Using Non-Thermal Arc Plasma. Hydrogen 2026, 7, 6. [Google Scholar] [CrossRef] [Scilit]
  82. Semenova, T.; Martínez Santoyo, J.Y. Economic Strategy for Developing the Oil Industry in Mexico by Incorporating Environmental Factors. Sustainability 2024, 16, 36. [Google Scholar] [CrossRef] [Scilit]
  83. Kuchin, V.; Dvoynikov, M.; Nutskova, M. Isolation through a viscoelastic surfactant of a fracable hydrocarbon-containing formation. J. Phys. Conf. Ser. 2020, 1478, 012022. [Google Scholar] [CrossRef] [Scilit]
  84. Sadykov, M.I.; Blinov, P.A.; Nutskova, M.V. Use of the water-swellable polymers (WSP) for wellbore stabilization in intensely fractured rock intervals. E3S Web Conf. 2021, 266, 01013. [Google Scholar] [CrossRef] [Scilit]
  85. Khaykin, M.M.; Priyma, K.A. Digital transformation management issues: An oil-and-gas industry example. Sustain. Dev. Beyond 2024, 2024, 99–112. [Google Scholar]
  86. Tien, D.L.; Trung, T.V.; Anh, S.D.; Babyr, N.V. Ground Pressure and Methods to Enhance Roof Stability in Mechanized Coal Mining. Int. J. Eng. Trans. B Appl. 2026, 39, 862–869. [Google Scholar] [CrossRef] [Scilit]
  87. Phuc, L.Q.; Khac Linh, N.K.; Babyr, N.V.; Nguyen, V.T. Analysis of roof conditions for headings ahead of the longwall face: Case study of the “Ha Lam” coal mine. Geol. I Geofiz. Yuga Ross. 2025, 15, 270–284. [Google Scholar] [CrossRef] [Scilit]
  88. Krishna, S.; Gambelli, A.M.; Sreenivasan, H.; Vadim, F.; Kumar, S.; Bera, A. The petroleum industry and climate change. In Decarbonizing the Petroleum Industry; Kumar, S., Bera, A., Eds.; Elsevier: Amsterdam, The Netherlands, 2026; pp. 47–83. ISBN 9780443315244. [Google Scholar] [CrossRef] [Scilit]
  89. Islamov, S.R.; Bondarenko, A.V.; Mardashov, D.V. Substantiation of a well killing technology for fractured carbonate reservoirs. In Youth Technical Sessions Proceedings VI Youth Forum of the World Petroleum Council—Future Leaders Forum; Taylor & Francis: London, UK, 2019; pp. 256–264. [Google Scholar] [CrossRef] [Scilit]
  90. Nutskova, M.V.; Alhazzaa, M.; Alhazaa, A. Effect of Mineral Wool Impregnated with Carbon Nanotubes on Properties of Cement at High Temperatures. Int. J. Eng. Trans. A Basics 2025, 38, 147–155. [Google Scholar] [CrossRef] [Scilit]
  91. Vasilenko, N.; Khaikin, M.; Lapinskas, A. Ways of achieving the institutional equilibrium in the context of an emerging single digital space. Stud. Comput. Intell. 2019, 826, 559–567. [Google Scholar] [CrossRef] [Scilit]
  92. Rastvorova, I.I.; Filatov, V.M.; Vilkov, S.A. Reduction of Optical Density in Highly Viscous Oils through Ultrasonic Treatment within The Infrared Wavelength Range. Int. J. Eng. Trans. B Appl. 2026, 39, 1865–1877. [Google Scholar] [CrossRef] [Scilit]
  93. Stroykov, G.; Lebedev, A.; Belous, A.; Kolganova, E. Achieving Sustainable Development Goals Through Hybrid Energy Supply Systems in Mining: The Case of the Varvarinskoye Copper–Gold Deposit. Resources 2026, 15, 25. [Google Scholar] [CrossRef] [Scilit]
  94. Filatov, V.M.; Rastvorova, I.I.; Zhurba, E.D. Review of radio-electronic wave techniques and devices for oil diagnostics and monitoring. Bull. Tomsk Polytech. Univ. Geo Assets Eng. 2025, 336, 164–181. (In Russian) [Google Scholar] [CrossRef] [Scilit]
  95. Chvileva, T.A.; Golovina, E.I. Publication of reporting of metallurgical companies in context of the concept of corporate sustainable development. J. Ind. Pollut. Control 2017, 33, 926–930. [Google Scholar]
  96. Golovina, E.I. Problems of Groundwater Extraction from Transboundary Aquifers and Complexes. IOP Conf. Ser. Earth Environ. Sci. 2018, 151, 012007. [Google Scholar] [CrossRef] [Scilit]
  97. Eremeeva, A.M.; Kondrasheva, N.K.; Khasanov, A.F.; Oleynik, I.L. Environmentally Friendly Diesel Fuel Obtained from Vegetable Raw Materials and Hydrocarbon Crude. Energies 2023, 16, 2121. [Google Scholar] [CrossRef] [Scilit]
  98. Madeo, L.; Blom, N.; Joensen, F.; Nagy, J.B.; De Luca, P. Steam-Induced Aluminum Speciation and Catalytic Enhancement in ZSM-5 Zeolites. Catalysts 2025, 15, 1130. [Google Scholar] [CrossRef] [Scilit]
  99. Pang, S.; Lin, Y.; Shi, H.; Yin, R.; Tao, R.; Li, D.; Li, C. Multi-Objective Sustainable Operational Optimization of Fluid Catalytic Cracking. Sustainability 2025, 17, 10045. [Google Scholar] [CrossRef] [Scilit]
  100. Jacob, S.; Majid, M.; Naidu, S.C.V.R.M.; Ramakrishna, C.S.; Punitha, N.; Padmanabhan, S.; Khayum, N.; Yadav, A.S.; Sharma, A. Performance and Emission Analysis of a Diesel Engine Fueled with Cashew Nut Shell-Derived Biodiesel and Its Blends. Eng. Proc. 2025, 114, 16. [Google Scholar] [CrossRef] [Scilit]
  101. Yungmeister, D.A.; Urazbakhtin, R.Y.; Khac Linh, N.K.; Timofeev, M.I. Tunneling complex for the construction of especially hazardous waste storage facilities: Justification of the design and parameters. Obogashchenie Rud 2023, 6, 47–51. [Google Scholar] [CrossRef] [Scilit]
  102. Golovina, E.I. Strategic issues groundwater extraction management in Russia. J. Ecol. Eng. 2017, 18, 13–21. [Google Scholar] [CrossRef] [Scilit]
  103. Ma, W.; Zhu, G.; Yuan, Q.; Yang, J. Catalytic Dehydrogenative Cracking of C4 Hydrocarbons on a Bifunctional Metal–Acid Catalyst. Catalysts 2025, 15, 1011. [Google Scholar] [CrossRef] [Scilit]
  104. Barros Magdalena, M.; García-Soriano, L.; Hueto-Escobar, A.; Mileto, C.; Vegas, F. Proposal for Zeolite Waste from Fluid Catalytic Cracking as a Pozzolanic Addition for Earth Mortars: Initial Characterisation. Coatings 2025, 15, 1408. [Google Scholar] [CrossRef] [Scilit]
  105. Nurzhanova, S.B.; Saidilda, G.T.; Nurlan, A.; Abilmagzhanov, A.Z.; Nagashybayeva, A.S.; Tungatarova, S.A. New Polyfunctional Nanocatalysts for the Hydrogen-Free Processing of N-Alkanes and Gasoline Fractions. Processes 2025, 13, 3841. [Google Scholar] [CrossRef] [Scilit]
  106. Zhang, H.; Cao, X.; Wang, F.; Yu, H.; Li, J.; Liu, Y. Research on the Impact of Typical SCR Faults on NOx Emission Deterioration of Heavy-Duty Vehicles. Atmosphere 2025, 16, 1299. [Google Scholar] [CrossRef] [Scilit]
  107. Alhamedi, S.S.; Al-Masry, W.; Al-Fatesh, A.S.; Haider, S.; Mahmood, A.; Blidi, L.E.; Bin Jumah, A. Recycling of Waste PET into Terephthalic Acid in Neutral Media Catalyzed by the Cracking Zeolite/Alumina Binder Acidic Catalyst. Catalysts 2025, 15, 1072. [Google Scholar] [CrossRef] [Scilit]
  108. Safiullin, R.N.; Reznichenko, V.V.; Gorlatov, D.V. Modeling and optimization of processes of transportation of heavy cargoes based on the automation of monitoring systems for the motor vehicles movement. IOP Conf. Ser. Earth Environ. Sci. 2019, 378, 012069. [Google Scholar] [CrossRef] [Scilit]
  109. Yungmeister, D.A.; Urazbakhtin, R.J.; Timofeev, M.I.; Lavrenko, S.A. Modeling and optimization of the use of tunneling complexes in the construction of auxiliary workings. Min. Informational Anal. Bull. 2025, 12–13, 117–135. [Google Scholar]
  110. Ma, L.; Zhang, K.; Guo, F.; Kuang, T. Performance and Mechanism of Fe80P13C7 Metal Glass in Catalytic Degradation of Methylene Blue. Catalysts 2025, 15, 1158. [Google Scholar] [CrossRef] [Scilit]
  111. Tokarev, I.S. Development of parameters for an industry-specific methodology for calculating the electric energy storage system for gas industry facilities. J. Min. Inst. 2025, 272, 171–180. [Google Scholar]
  112. Belskiy, A.A.; Dobush, V.S. Analysis of UPS impact on power quality at point of common coupling of consumers. In Proceedings of the 2015 International Conference on Mechanical Engineering, Automation and Control Systems (MEACS), Tomsk, Russia, 1–4 December 2015. Article 7414877. [Google Scholar] [CrossRef] [Scilit]
  113. Tukeev, D.L.; Afanaseva, O.V.; Tulyakov, T.F. Realization of Statistical Models Based on Symmetric Unimodal Distributions. Int. J. Eng. Trans. B Appl. 2026, 39, 407–419. [Google Scholar] [CrossRef] [Scilit]
  114. Arefiev, I.B.; Afanaseva, O.V. Implementation of Control and Forecasting Problems of Human-Machine Complexes on the Basis of Logic-Reflexive Modeling. Lect. Notes Netw. Syst. 2022, 442, 187–197. [Google Scholar] [CrossRef] [Scilit]
  115. Fetisov, V.; Gonopolsky, A.M.; Mazlova, E.A.; Behbahani, R.M.; Davardoost, H. Thermodynamic Modeling and Emission Assessment of Coalbed Methane Utilization in Power Generation: A Case Study from Russia. Environ. Model. Assess. 2025, 31, 159–170. [Google Scholar] [CrossRef] [Scilit]
Figure 1. Schematic diagram of a catalytic cracking unit.
Modelling 07 00068 g001
Figure 2. Functional diagram of the catalytic cracking unit automation.
Modelling 07 00068 g002
Figure 3. Control object model in MATLAB Simulink.
Modelling 07 00068 g003
Figure 4. Simplified model of the control object.
Modelling 07 00068 g004
Figure 5. Transient process of the system without a controller.
Modelling 07 00068 g005
Figure 6. ACS with a P-controller.
Modelling 07 00068 g006
Figure 7. Transient process of a closed-loop control system with a P-controller.
Modelling 07 00068 g007
Figure 8. ACS with a PI controller.
Modelling 07 00068 g008
Figure 9. Transient process of ACS with a PI controller.
Modelling 07 00068 g009
Figure 10. ACS with PID controller.
Modelling 07 00068 g010
Figure 11. Transient process of a control system with a PID controller.
Modelling 07 00068 g011
Figure 12. PID Tuner working window.
Modelling 07 00068 g012
Figure 13. Transient process of a closed-loop control system with a P-controller after tuning.
Modelling 07 00068 g013
Figure 14. Transient process of a closed-loop control system with a PI controller after tuning.
Modelling 07 00068 g014
Figure 15. Transient process of a closed-loop control system with a PID controller after tuning.
Modelling 07 00068 g015
Figure 16. Robustness test results for PI (calculated), PI (PID Tuner), PID (calculated) and PID (PID Tuner), respectively. (a) Checking the calculated PI controller for robustness; (b) Robustness check of the PI controller tuned by PID Tuner; (c) Robustness check of the calculated PID controller; (d) Robustness check of the PID controller tuned by PID Tuner.
Modelling 07 00068 g016
Figure 17. Demonstration of the system’s response to disturbance. (a) Transient process of a closed-loop control system with a calculated PI controller under applied disturbance; (b) Transient process of the SPS with a PI controller under applied disturbance, tuned by PID Tuner; (c) Transient process of the SPS with a calculated PID controller under applied disturbance; (d) Transient process of a CAP with a PID controller under a disturbance supplied by a PID Tuner.
Modelling 07 00068 g017
Table 1. Overview of factors affecting the catalytic cracking of oil.
Category of Challenge/Research DirectionReferences
1Temperature problems & Thermal Management[22,23,24]
2Chemical problems & Catalytic Mechanisms[25,26,27,28,29,30,31,32,33,34,35,36,37,38,39,40,41,42,43]
3Physical problems & Process Dynamics[44,45,46,47,48,49,50,51,52,53,54,55,56,57,58,59]
4Economic problems & Sustainability[60,61,62,63,64,65,66,67,68,69,70,71,72,73,74,75,76,77,78,79]
5Electrical problems & Instrumentation/Control[80,81,82,83,84,85,86,87,88,89,90]
6Feedstock Composition & Alternative Raw Materials[91,92,93,94,95,96]
Table 2. Determination of the cutoff frequency for the synthesis of a P-controller.
FrequencyPhase
0.07681−2.61783
0.07682−2.61805
0.07683−2.61827
0.07684−2.61850
0.07685−2.61872
0.07686−2.61895
0.07687−2.61917
0.07688−2.61939
0.07689−2.61962
0.0769−2.61984
Table 3. Determination of the cut-off frequency.
FrequencyPhase
0.02430−1.04492
0.02431−1.04531
0.02432−1.04571
0.02433−1.04610
0.02434−1.04650
0.02435−1.04689
0.02436−1.04728
0.02437−1.04768
0.02438−1.04807
0.02439−1.04846
Table 4. Control quality.
Overshoot, %Control Time, sControl Error, %
P-controller2224626.3
P-controller (PID Tuner)2828325.2
PI-controller9.81350
PI-controller (PID Tuner)9.75134.70
PID-controller96.852000
PID-controller (PID Tuner)9.6440
Table 5. Control quality when testing for robustness.
Overshoot, %Control Time, sControl Error, %
PI controller01690
PI controller (PID Tuner)01120
PID controller80.64210
PID controller (PID Tuner)0.7600
Table 6. Control quality when tested for invariance to disturbances.
Overshoot, %Control Time, sControl Error, %
PI controller26.82670
PI controller (PID Tuner)272550
PID controller85.3196.70
PID controller (PID Tuner)20.71650
Disclaimer/Publisher’s Note: The statements, opinions and data contained in all publications are solely those of the individual author(s) and contributor(s) and not of MDPI and/or the editor(s). MDPI and/or the editor(s) disclaim responsibility for any injury to people or property resulting from any ideas, methods, instructions or products referred to in the content.