1. Introduction
The global transition towards sustainable energy systems has positioned hydrogen as a critical enabler of decarbonisation across transport, industrial, and power sectors. Conventional hydrogen production through steam methane reforming (SMR) generates 9–10 kg CO
2 per kg H
2 produced [
1], whilst green hydrogen from renewable electrolysis faces high costs (
$4–6/kg) and substantial infrastructure requirements [
2]. An emerging alternative pathway that simultaneously addresses both waste management and energy transition challenges is the conversion of plastic waste into hydrogen through thermochemical gasification. Recent comprehensive reviews of thermal conversion technologies for plastic waste demonstrate the technical maturity and scalability potential of pyrolysis and gasification processes [
3,
4].
Oman presents a compelling case for waste-to-hydrogen development due to dual pressures on its waste management and energy systems. The country generates approximately 1.2 kg of municipal solid waste (MSW) per capita daily, slightly above the MENA regional average of 1.08 kg [
5], with plastic waste comprising 27% of the total stream (within the 15–30% range typical for GCC countries; [
6])—amongst the highest fractions in the Middle East. Current waste management practices rely heavily on landfilling, which creates significant methane emissions (~500 kg CO
2-eq per tonne of waste) and mounting environmental pressures [
7]. Concurrently, Oman has committed to ambitious decarbonisation targets under Vision 2040, including the development of a hydrogen economy to diversify its energy portfolio beyond fossil fuel dependence. These converging challenges create strategic opportunities for integrated waste-to-hydrogen infrastructure.
The planning of hydrogen production and distribution infrastructure has been addressed through facility location optimisation in various contexts, with studies applying mixed-integer programming to minimise system costs across capital investment, production, and transportation [
8]. However, existing frameworks focus predominantly on green or blue hydrogen pathways, with limited attention devoted to waste-derived hydrogen. This focus reflects established supply chains, predictable feedstock availability (natural gas for blue and renewable electricity for green), and proven industrial scalability. Waste-derived hydrogen faces perceived barriers, including feedstock variability, collection logistics, and policy competition with mechanical recycling, limiting its strategic representation despite dual benefits. Gasification of plastic waste has demonstrated technical feasibility at commercial scale, achieving hydrogen yields of 140–250 kg per tonne depending on feedstock composition and process conditions [
9,
10,
11]. Techno-economic analyses suggest cost competitiveness with conventional production routes when waste management co-benefits—specifically landfill diversion, avoided methane emissions, and carbon credit monetisation—are appropriately valued [
12,
13], though these studies typically assume developed-country contexts with well-established collection systems.
The Gulf Cooperation Council (GCC) region has announced ambitious hydrogen development plans, with combined production capacity targets exceeding 500 million tonnes annually by 2050, focused primarily on green hydrogen from solar and wind resources for export markets [
2,
14]; Despite well-documented waste management challenges—including high per capita waste generation, limited recycling infrastructure, and heavy reliance on landfilling [
5]—the intersection of waste management and hydrogen production has received minimal attention in regional energy planning. No quantitative analysis exists for waste-to-hydrogen potential, optimal infrastructure configuration, or integration with complementary pathways in Oman or the broader GCC region.
Despite growing interest in both hydrogen infrastructure and waste management, existing planning frameworks exhibit critical gaps. Hydrogen infrastructure models focus predominantly on blue and green production pathways, with limited attention devoted to waste-derived hydrogen despite its demonstrated dual benefits for waste management and energy production. Existing waste-to-hydrogen studies address techno-economic feasibility at individual facility scale [
9,
10] but do not optimise spatial configuration across multiple facilities subject to geographically distributed waste availability constraints. Moreover, waste management and hydrogen economy objectives are typically addressed through separate policy frameworks rather than integrated infrastructure planning. This study addresses these gaps by presenting the first comprehensive facility location and capacity optimisation model for waste-to-hydrogen infrastructure in the Gulf region. The model integrates waste availability constraints, hydrogen demand projections, and circular economy co-benefits within a unified spatial planning framework, providing decision support for infrastructure deployment that simultaneously addresses waste management and energy transition objectives. This study addresses these gaps by developing an optimisation framework for waste-to-hydrogen infrastructure planning in Oman through 2040, representing the first quantitative spatial analysis of waste-derived hydrogen potential in the GCC region. The contribution of this work lies in three principal elements: first, it integrates spatially distributed waste availability constraints with location-specific hydrogen demand projections to determine realistic production potential under feedstock limitations. Second, it compiles region-specific techno-economic parameters, including Oman’s plastic waste composition (27% of municipal solid waste, consistent with the 15–30% range reported for GCC countries; [
6]), and establishes waste-to-hydrogen as a complementary pathway within a diversified hydrogen economy alongside blue hydrogen (SMR with carbon capture and storage (CCS)) for industrial applications and green hydrogen (electrolysis) for transport sectors. Third, it determines optimal facility locations and capacities across five candidate hubs (Muscat, Sohar, Duqm, Salalah, Nizwa) that maximise hydrogen production from available plastic waste whilst respecting facility scale economies and local demand patterns. The analysis quantifies levelised production costs with sensitivity analysis, assessing demand coverage under alternative growth scenarios, and identifies policy mechanisms to support deployment.
2. Model Formulation
This section presents a mixed-integer linear programming (MILP) model for optimal waste-to-hydrogen infrastructure planning in Oman. The model determines facility locations, capacities, and hydrogen distribution networks to maximise production from available plastic waste whilst minimising total system cost.
2.1. Problem Scope and Assumptions
The optimisation problem addresses three interconnected decisions: (1) selection of hub locations from five candidate sites, (2) determination of waste processing capacity at each selected location, and (3) allocation of hydrogen flows from production hubs to demand centres. The candidate hub locations—Muscat, Sohar, Duqm, Salalah, and Nizwa—were selected based on population density, existing industrial infrastructure, port access, and proximity to hydrogen demand centres. The planning horizon targets 2040, aligned with Oman Vision 2040 and national circular economy objectives.
The model incorporates several simplifying assumptions. Steady-state operation is assumed, with production and demand represented as annual averages rather than accounting for seasonal fluctuations in waste generation or hydrogen consumption. Hydrogen demand at each centre is treated as deterministic, projected from vehicle adoption rates, industrial requirements, and export commitments. Gasification technology converts mixed plastic waste (HDPE, LDPE, PP, PS, and PET) into hydrogen through thermal gasification at 800–1000 °C. Hydrogen yields from mixed plastic waste vary with composition and process technology. Pure polymers achieve 120–250 kg H
2/tonne [
10,
11], whilst real-world waste mixtures produce 140–214 kg H
2/tonne through optimised three-stage processing [
9]. This study adopts 150 kg H
2/tonne as a reasonable estimate for mixed municipal plastic waste, balancing technological optimism with operational conservatism. Recent process modelling studies have validated similar conversion efficiencies for waste plastic gasification, demonstrating the technical feasibility of these yield assumptions through comprehensive mass and energy balance simulations [
15]. Waste availability in 2040 is projected based on population growth forecasts (3% annually), MSW generation rates (1.2 kg/capita/day), and plastic fraction (27% of MSW, within the 15–30% range reported for GCC countries; [
6]). Facility scale economies impose a minimum processing capacity of 50 tonnes per day (TPD) for economic viability and a maximum capacity of 500 TPD per facility based on commercial-scale operational experience. Whilst advanced facilities can process up to 2000 TPD [
16,
17], this study adopts 500 TPD as a conservative constraint reflecting proven technology suitable for initial deployment. Following successful initial deployment, facility capacity could scale to 750–1000 TPD through technology learning and improved collection efficiency (discussed in
Section 4.2.4). However, expansion ultimately remains constrained by available feedstock (330,279 tonnes of plastic waste/year), limiting system-wide scaling regardless of individual facility capacity. Recent simulation studies have validated plastic waste gasification processes for hydrogen production, demonstrating technical feasibility and providing process parameters for system modelling [
18]. Transportation utilises compressed hydrogen tube trailers for distances under 200 km, with unit costs of
$0.05 per kg·km [
8]. Feedstock quality is assumed to be relatively homogeneous, enabling stable conversion efficiency across facilities.
This study focuses specifically on gasification as the thermochemical conversion pathway. Gasification is selected over alternative processes (pyrolysis, hydrothermal liquefaction) due to several technical advantages for hydrogen production: higher hydrogen yields (150 kg H
2/tonne waste; [
9,
10], lower tar formation requiring less extensive syngas cleanup, and syngas composition suitable for hydrogen purification via pressure swing adsorption. Moreover, gasification technology has reached commercial maturity for waste feedstocks, with established operational parameters applicable to Oman’s plastic waste composition (27% of municipal solid waste). References to pyrolysis in the literature review acknowledge related thermochemical conversion pathways but do not form part of the modelled system.
2.2. Mathematical Notation
Sets:
I = Set of candidate hub locations, i ∈ {1,2, …, 5}.
J = Set of hydrogen demand centres, j ∈ {1,2, …, 5}.
Decision Variables:
xi ∈ {0,1} = Binary variable; equals 1 if hub is built at location i, 0 otherwise.
Qi ≥ 0 = Waste processing capacity at hub i (tonnes/year).
Fij ≥ 0 = Hydrogen flow from hub i to demand centre j (tonnes H2/year).
Parameters:
Cost Parameters:
FCi = Fixed capital cost for hub at location i ($).
VCi = Variable operating cost per unit hydrogen at location i ($/kg H2).
TCij = Unit transportation cost from i to j ($/kg H2·km).
WCi = Waste collection and preprocessing cost at location i ($/tonne).
Demand and Supply:
Dj = Annual hydrogen demand at centre j (tonnes H2/year).
Wi = Available plastic waste at location i (tonnes/year).
dij = Distance from location i to centre j (km).
Technical:
Capacity Bounds:
Qmin = Minimum economic processing scale (tonnes/year).
Qmax = Maximum hub processing capacity (tonnes/year).
Nmax = Maximum number of hubs allowed.
2.3. Objective Function and Constraints
The model maximises total hydrogen production from available plastic waste whilst respecting physical, technical, and budgetary constraints:
The objective maximises total waste processed across all selected hub locations, promoting circular economy principles through maximum diversion of plastic waste from landfills. This waste-maximising formulation reflects the dual waste management and energy production objectives inherent to waste-to-hydrogen systems, where the primary policy goal is maximising waste diversion rather than minimising hydrogen production costs. Economic analysis (levelised cost calculation, cost comparisons, sensitivity analysis) subsequently evaluates the economic viability of the waste-maximising solution rather than determining an economically optimal configuration.
Constraints:
Total hydrogen received at each demand centre must meet or exceed the required quantity.
(2) Production-Flow Balance:
Hydrogen distributed from each hub cannot exceed production capacity, where Qi · ηi converts waste processing capacity to hydrogen output.
Processing capacity exists only at selected locations (xi = 1) and must satisfy minimum economic scale and maximum facility size constraints.
Waste processing at each location cannot exceed the available feedstock supply. This constraint assumes waste is processed at its generation location rather than transported between hubs. This assumption reflects practical considerations specific to Oman’s context: plastic waste transportation introduces quality degradation through moisture absorption and contamination, collection and sorting costs already constitute significant LCOH components, and inter-city waste transport would substantially increase logistics costs. Moreover, co-located waste generation and processing aligns with distributed circular economy principles, avoiding the environmental and economic burden of long-distance waste transport whilst maintaining the feedstock quality specifications necessary for efficient gasification
The total number of hubs is constrained for practical management coordination.
Location decisions are binary; capacities and flows are non-negative continuous variables.
2.4. Solution Approach and Cost Calculation
The formulated MILP is implemented in Python 3.14.2 using the PuLP optimisation library (version 3.3.0) with the CBC solver [
19]. The relatively small problem size (5 candidate locations, 5 demand centres, 40 decision variables) enables a solution within seconds on standard computing hardware. The model maximises hydrogen production subject to waste availability constraints, with cost calculations performed post-optimisation.
Total annual system cost is calculated after optimisation as
Annualised CAPEX uses the capital recovery factor (CRF) with 8% discount rate over a 25-year facility lifetime:
where
r = discount rate (0.08), and
n = lifetime (25 years). CAPEX includes equipment costs (
$15,000/tonne annual capacity), site preparation (
$40/m
2 for 20,000 m
2), and engineering/procurement/construction margins [
20].
Operating expenses (OPEX) comprise operations and maintenance (4% of CAPEX annually), labour (20 employees per facility at
$60,000/year; [
21]), electricity (15 kWh/kg H
2 at
$0.055/kWh; [
22]), water (0.01 m
3/kg H
2 at
$3.43/m
3; [
23]), waste collection (
$35/tonne), and land lease (
$3/m
2/year for 20,000 m
2; [
24]).
Transportation costs are calculated as the product of unit rate (
$0.05/kg H
2·km), hydrogen flow quantity, and transport distance [
8].
The levelised cost of hydrogen (LCOH) represents the ratio of total annual system cost to total hydrogen production:
This post-optimisation cost calculation approach allows transparent cost attribution whilst maintaining computational tractability of the production–maximisation formulation.
2.5. Cost Structure
Capital expenditure comprises gasification reactor and syngas cleanup systems (
$45 M), pressure swing adsorption units (
$8 M), utilities and auxiliaries (
$12 M), engineering and construction costs (20% of equipment), and contingency (15%), totalling
$75–80 M per facility [
9,
10].
Operational expenditure includes feedstock (zero cost—diverted waste), labour (48 full-time staff across four shifts), maintenance (4% of CAPEX annually), utilities (electricity, water, chemicals), and insurance (1% of CAPEX). These assumptions align with established gasification plant parameters [
18,
25].
4. Results and Analysis
This section presents the optimisation results for Oman’s waste-to-hydrogen infrastructure planning. The analysis begins with the base case solution, followed by cost analysis, sensitivity assessment, and scenario comparisons.
4.1. Base Case Optimal Configuration
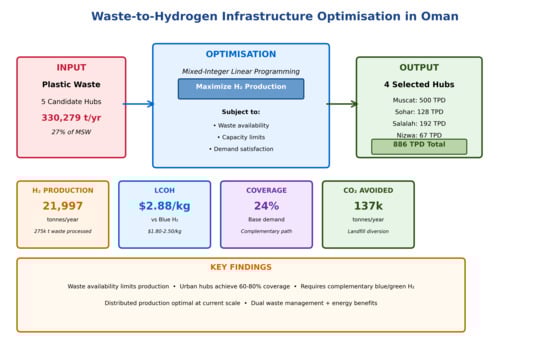
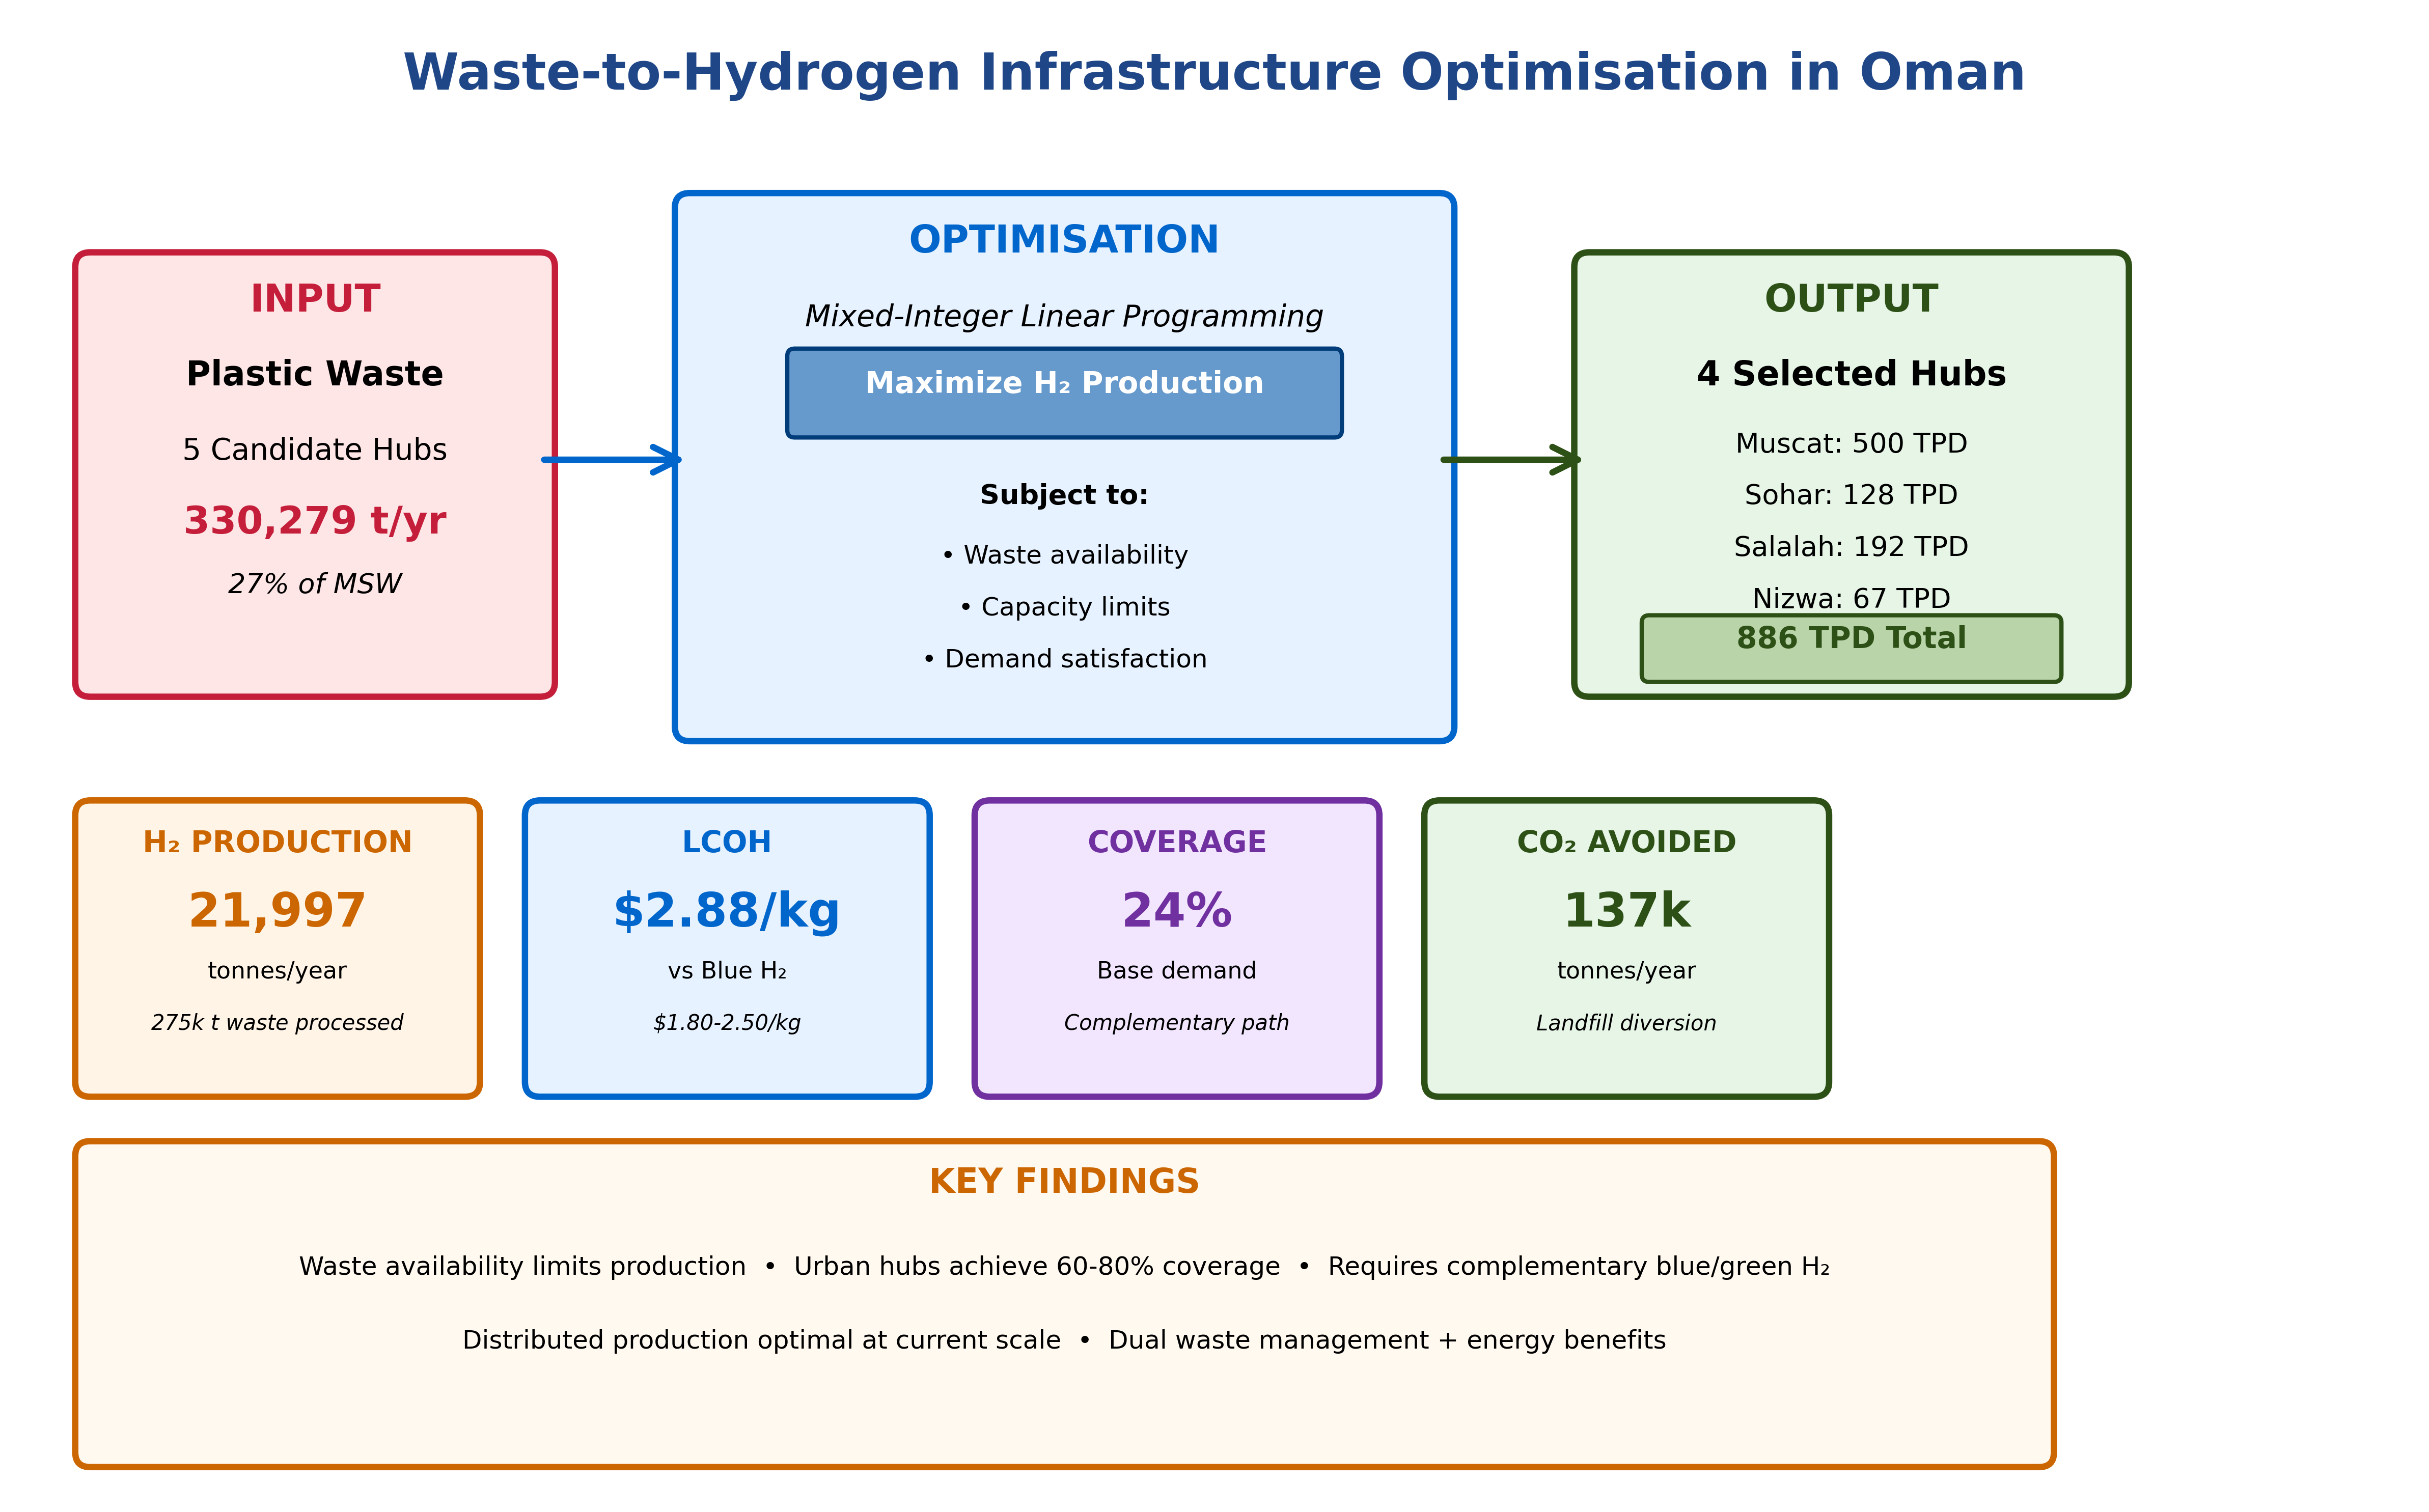
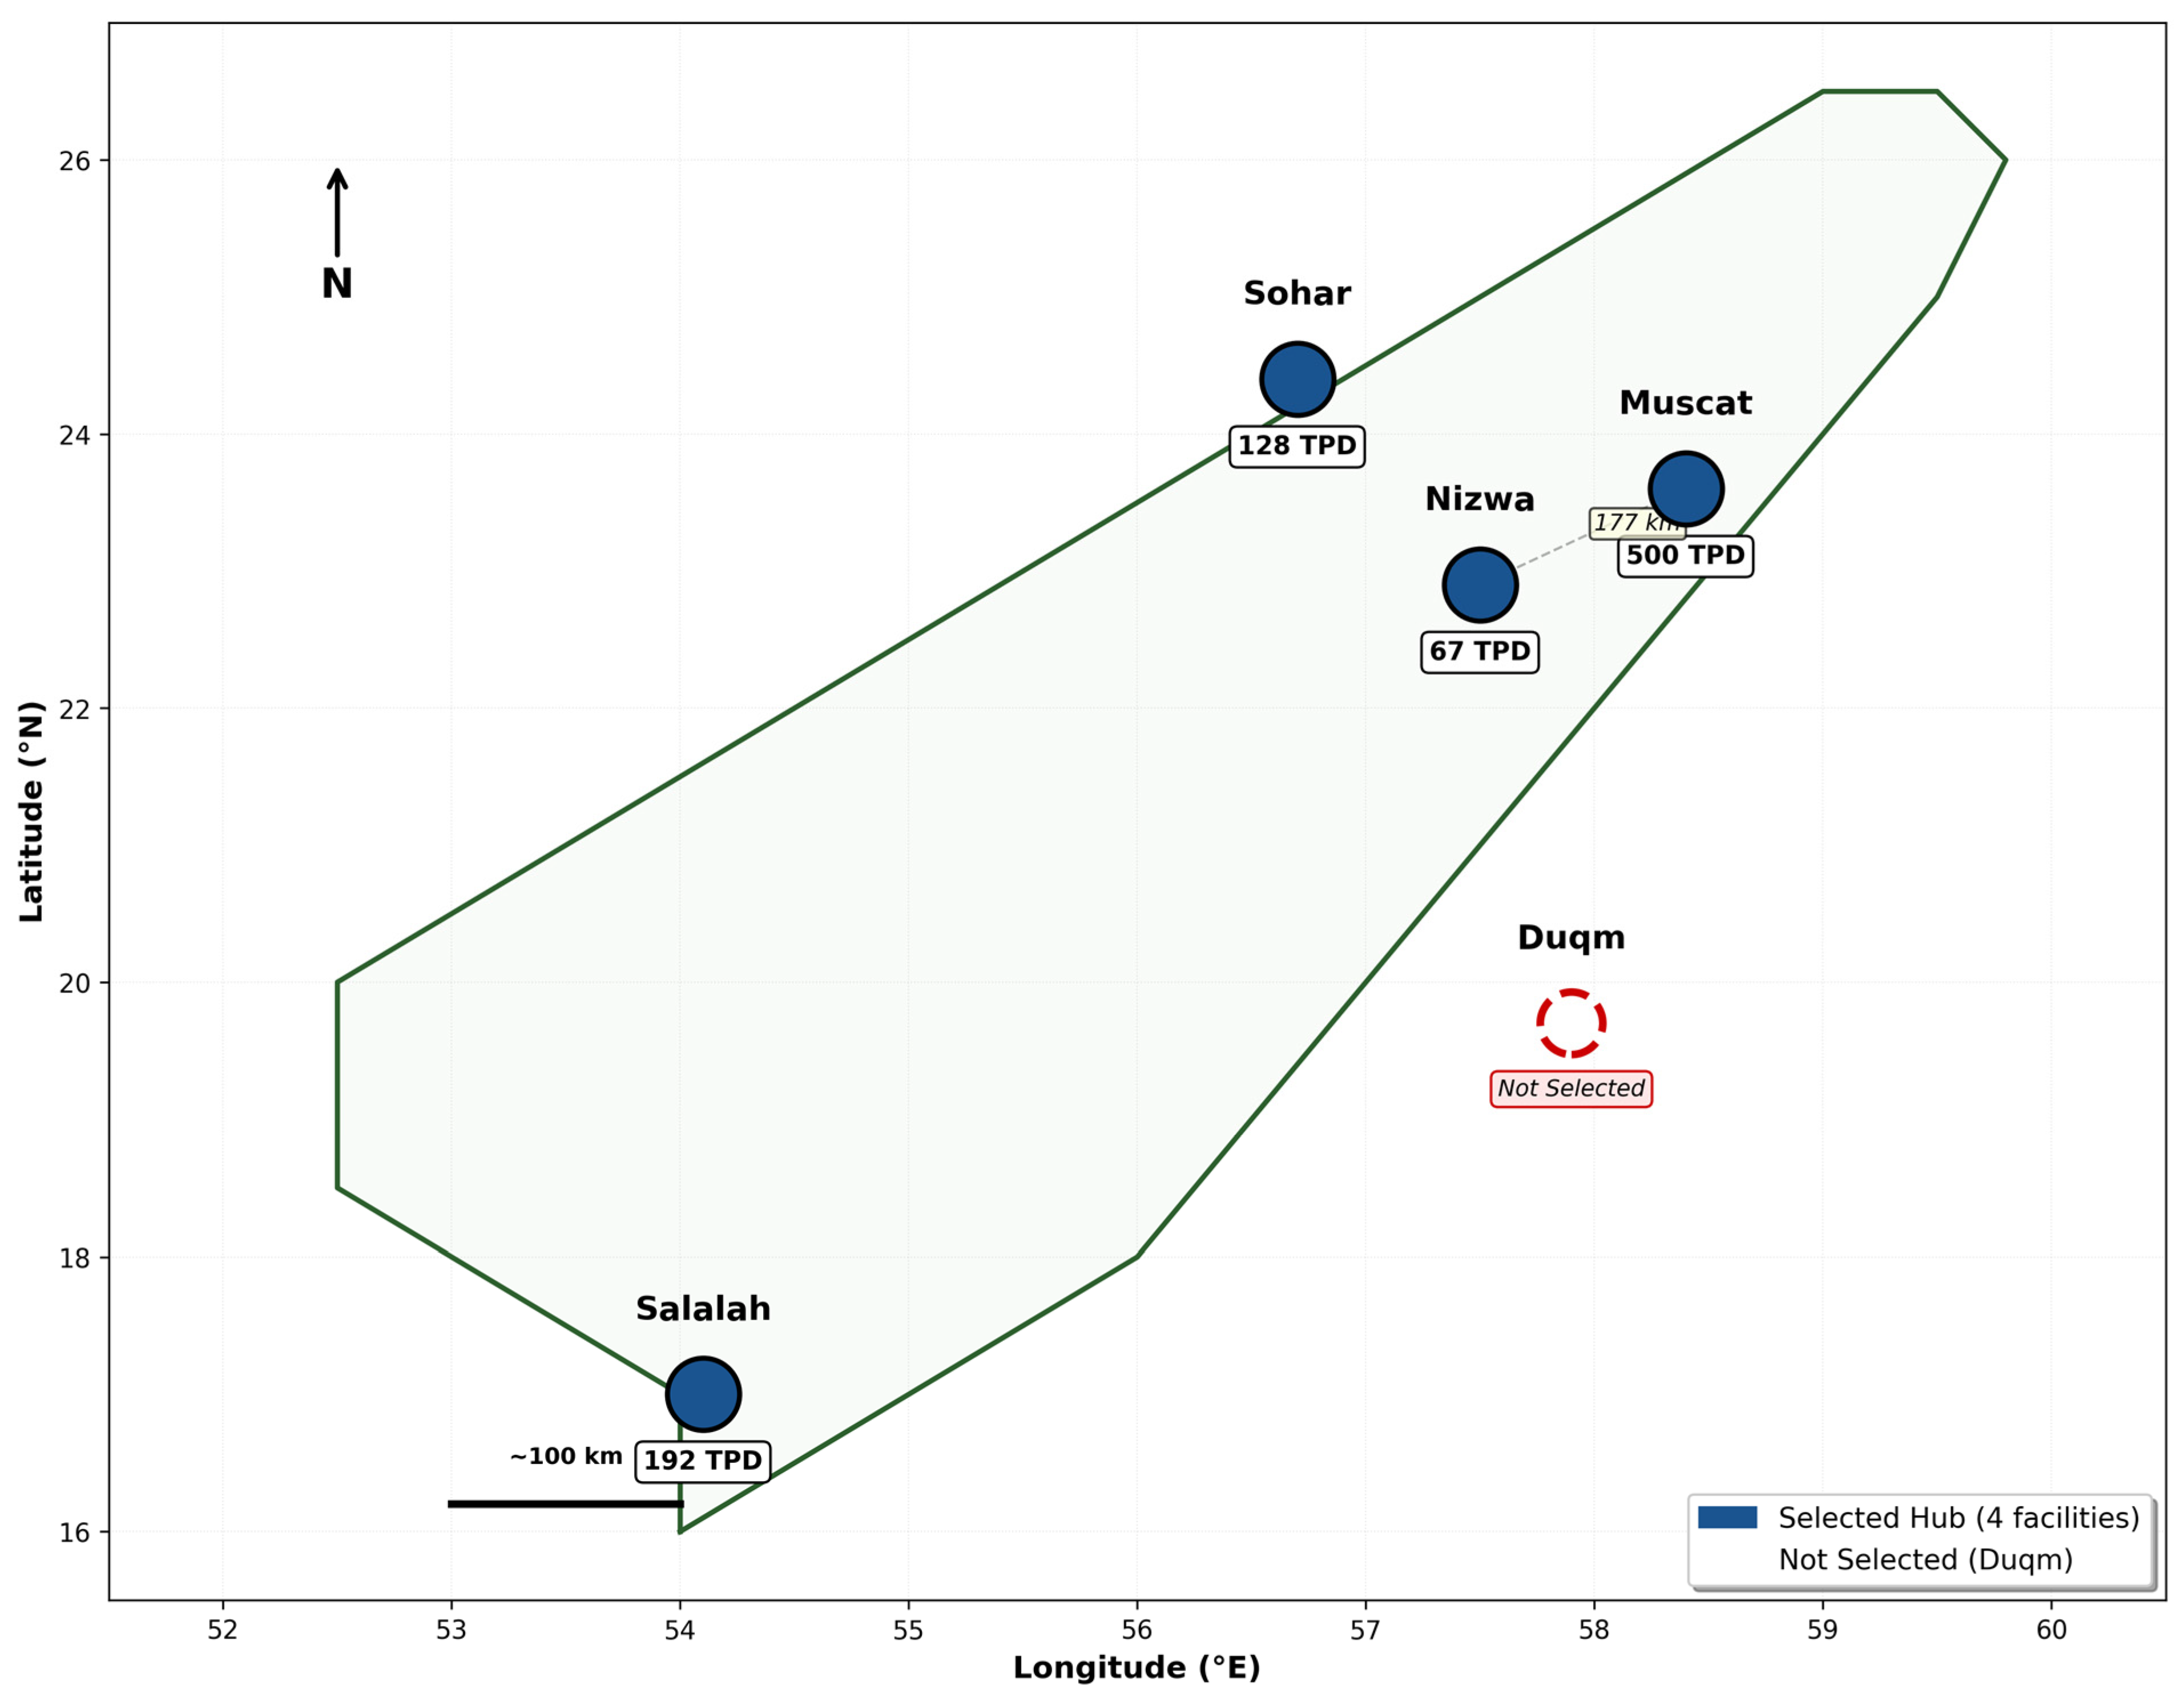
Optimisation results indicate that waste-to-hydrogen can produce 21,997 tonnes of H2 annually from available plastic waste in Oman by 2040, at a levelised cost of $2.88/kg. The optimal network comprises four facilities: Muscat (500 TPD), Sohar (128 TPD), Salalah (192 TPD), and Nizwa (67 TPD). Critically, plastic waste alone can meet only 24.4% of base case demand (90,000 tonnes), highlighting that waste-to-H2 must serve as a complementary pathway alongside steam methane reforming with CCS for industrial demand, green electrolysis for the transport sector, and regional waste import agreements. The production cost of $2.88/kg is competitive with conventional SMR ($1–2/kg) whilst offering waste management co-benefits valued at approximately $17.5 million annually.
The selection of Muscat, Sohar, Salalah, and Nizwa is driven by waste availability and proximity to demand centres. Muscat operates at maximum capacity (500 TPD) due to high urban waste generation (207,175 tonnes/year), accounting for 56% of total H2 production. Sohar, Salalah, and Nizwa achieve 100% local waste utilisation. Duqm was excluded despite having the highest H2 demand (35,000 tonnes/year) due to insufficient local waste (only 3267 tonnes/year), indicating that industrial hubs require alternative production pathways such as SMR with CCS or green hydrogen.
Table 6 presents facility-level metrics. The four facilities collectively process 275,000 tonnes of plastic waste annually (83% of available waste), with the remaining 17% representing Muscat waste exceeding single-facility capacity limits.
The optimal solution shows no inter-hub hydrogen flows, as transport costs ($0.05/kg·km) make long-distance trucking economically prohibitive. For example, transporting hydrogen from Muscat to Duqm (340 km) would add $17/kg in transport costs—exceeding production costs by sixfold. This finding indicates that each demand centre requires co-located production rather than centralised production with radial distribution.
Demand coverage varies significantly by hub type. Urban and transport-focused hubs (Muscat 83%, Salalah 59%, and Nizwa 42%) achieve moderate-to-high coverage, whilst industrial hubs (Sohar 11% and Duqm 0%) face severe shortfalls. Sohar’s refinery requires 28,000 tonnes H2/year for hydroprocessing—far exceeding waste-derived supply (3173 tonnes/year). Similarly, Duqm’s 230,000 bbl/day refinery demands 28,543 tonnes of H2/year but has insufficient local waste to justify facility construction. These industrial gaps must be filled through dedicated SMR with CCS or future pipeline imports.
The optimisation encountered three binding constraints: waste availability at Sohar, Salalah, and Nizwa (100% utilisation); maximum facility size at Muscat (500 TPD limit preventing full waste utilisation); and minimum facility size at Duqm (waste availability below 50 TPD threshold). Relaxing the maximum capacity constraint could increase Muscat production by 4400 tonnes of H2/year, whilst regional waste sharing agreements could enable additional facilities.
The levelised cost of $2.88/kg is competitive with blue hydrogen ($1.5–2.5/kg) and significantly cheaper than current green hydrogen ($4–6/kg), though green hydrogen costs are projected to decline to $2–3/kg by 2030. When accounting for waste management co-benefits—including avoided landfill costs ($6.9 million/year) and carbon credits for landfill diversion (137,000 tonnes CO2-eq/year)—the effective production cost may be as low as $2.50/kg. The cost structure comprises 50% annualised CAPEX, 42% OPEX, and 8% transport, suggesting that capital cost reductions through technology learning could significantly improve economics.
4.2. Cost Analysis and Economic Competitiveness
The levelised cost of hydrogen from plastic waste gasification is $2.88/kg in the base case, positioning waste-to-H2 as competitively priced within Oman’s emerging hydrogen economy. This cost represents the economic viability assessment of the waste-maximising configuration rather than a cost-minimised solution. This section analyses the cost structure, compares production economics with alternative hydrogen pathways, and examines sensitivity to key technical and economic parameters.
4.2.1. Cost Structure and Component Breakdown
The total annual system cost of
$63.3 million for producing 21,997 tonnes of H
2 comprises three primary components: fixed costs, variable costs, and transportation costs.
Table 7 presents the detailed cost breakdown.
The cost structure is dominated by capital-intensive components, with annualised CAPEX alone representing 50% of total costs. This capital intensity has important implications for technology deployment. As waste-to-H
2 deployment scales globally, gasification equipment costs could decline through manufacturing learning curves, consistent with learning effects observed in other energy technologies [
41,
42], potentially reducing levelised costs to
$2.40–2.50/kg. The capital-intensive nature of waste-to-hydrogen systems, where CAPEX dominates total costs, aligns with recent techno-economic assessments of plastic waste gasification infrastructure [
43]. The 8% discount rate assumption reflects moderate project risk; concessional financing or government guarantees (reducing discount rate to 5–6%) could lower costs by
$0.30–0.40/kg, whilst higher perceived risk (10–12% discount rate) would increase costs proportionally. Larger facilities benefit from lower unit CAPEX. The Muscat facility at 500 TPD approaches optimal scale, whilst smaller facilities (Nizwa at 67 TPD) face higher per-unit costs—though this is offset by avoiding long-distance transport.
Variable costs comprise 92% of total costs, with waste collection ($0.44/kg), O&M ($0.45/kg), and electricity ($0.21/kg) as the next-largest components after CAPEX. Waste collection costs ($35/tonne) reflect the need for source separation, cleaning, and transport logistics for municipal plastic waste. This cost could be partially offset through extended producer responsibility (EPR) schemes or municipal waste management budgets, effectively reducing the cost borne by hydrogen producers.
Transport costs are zero in the optimal solution, confirming that truck-based hydrogen distribution is uneconomical at current volumes. The model employs a uniform LCOH of $2.88/kg across all facilities, reflecting identical technology and feedstock assumptions regardless of capacity. Facility-specific metrics (NPV, IRR, and payback period) are not calculated, as the analysis focuses on system-level economics and spatial optimisation rather than individual facility profitability. Capacity variations (500, 128, 192, and 67 TPD) reflect feedstock availability constraints rather than cost differentials. This validates the localised production–consumption model but highlights a potential barrier to future scale-up: if hydrogen demand grows beyond local waste availability, costly transport infrastructure (pipelines or liquid H2 trucks) would be required.
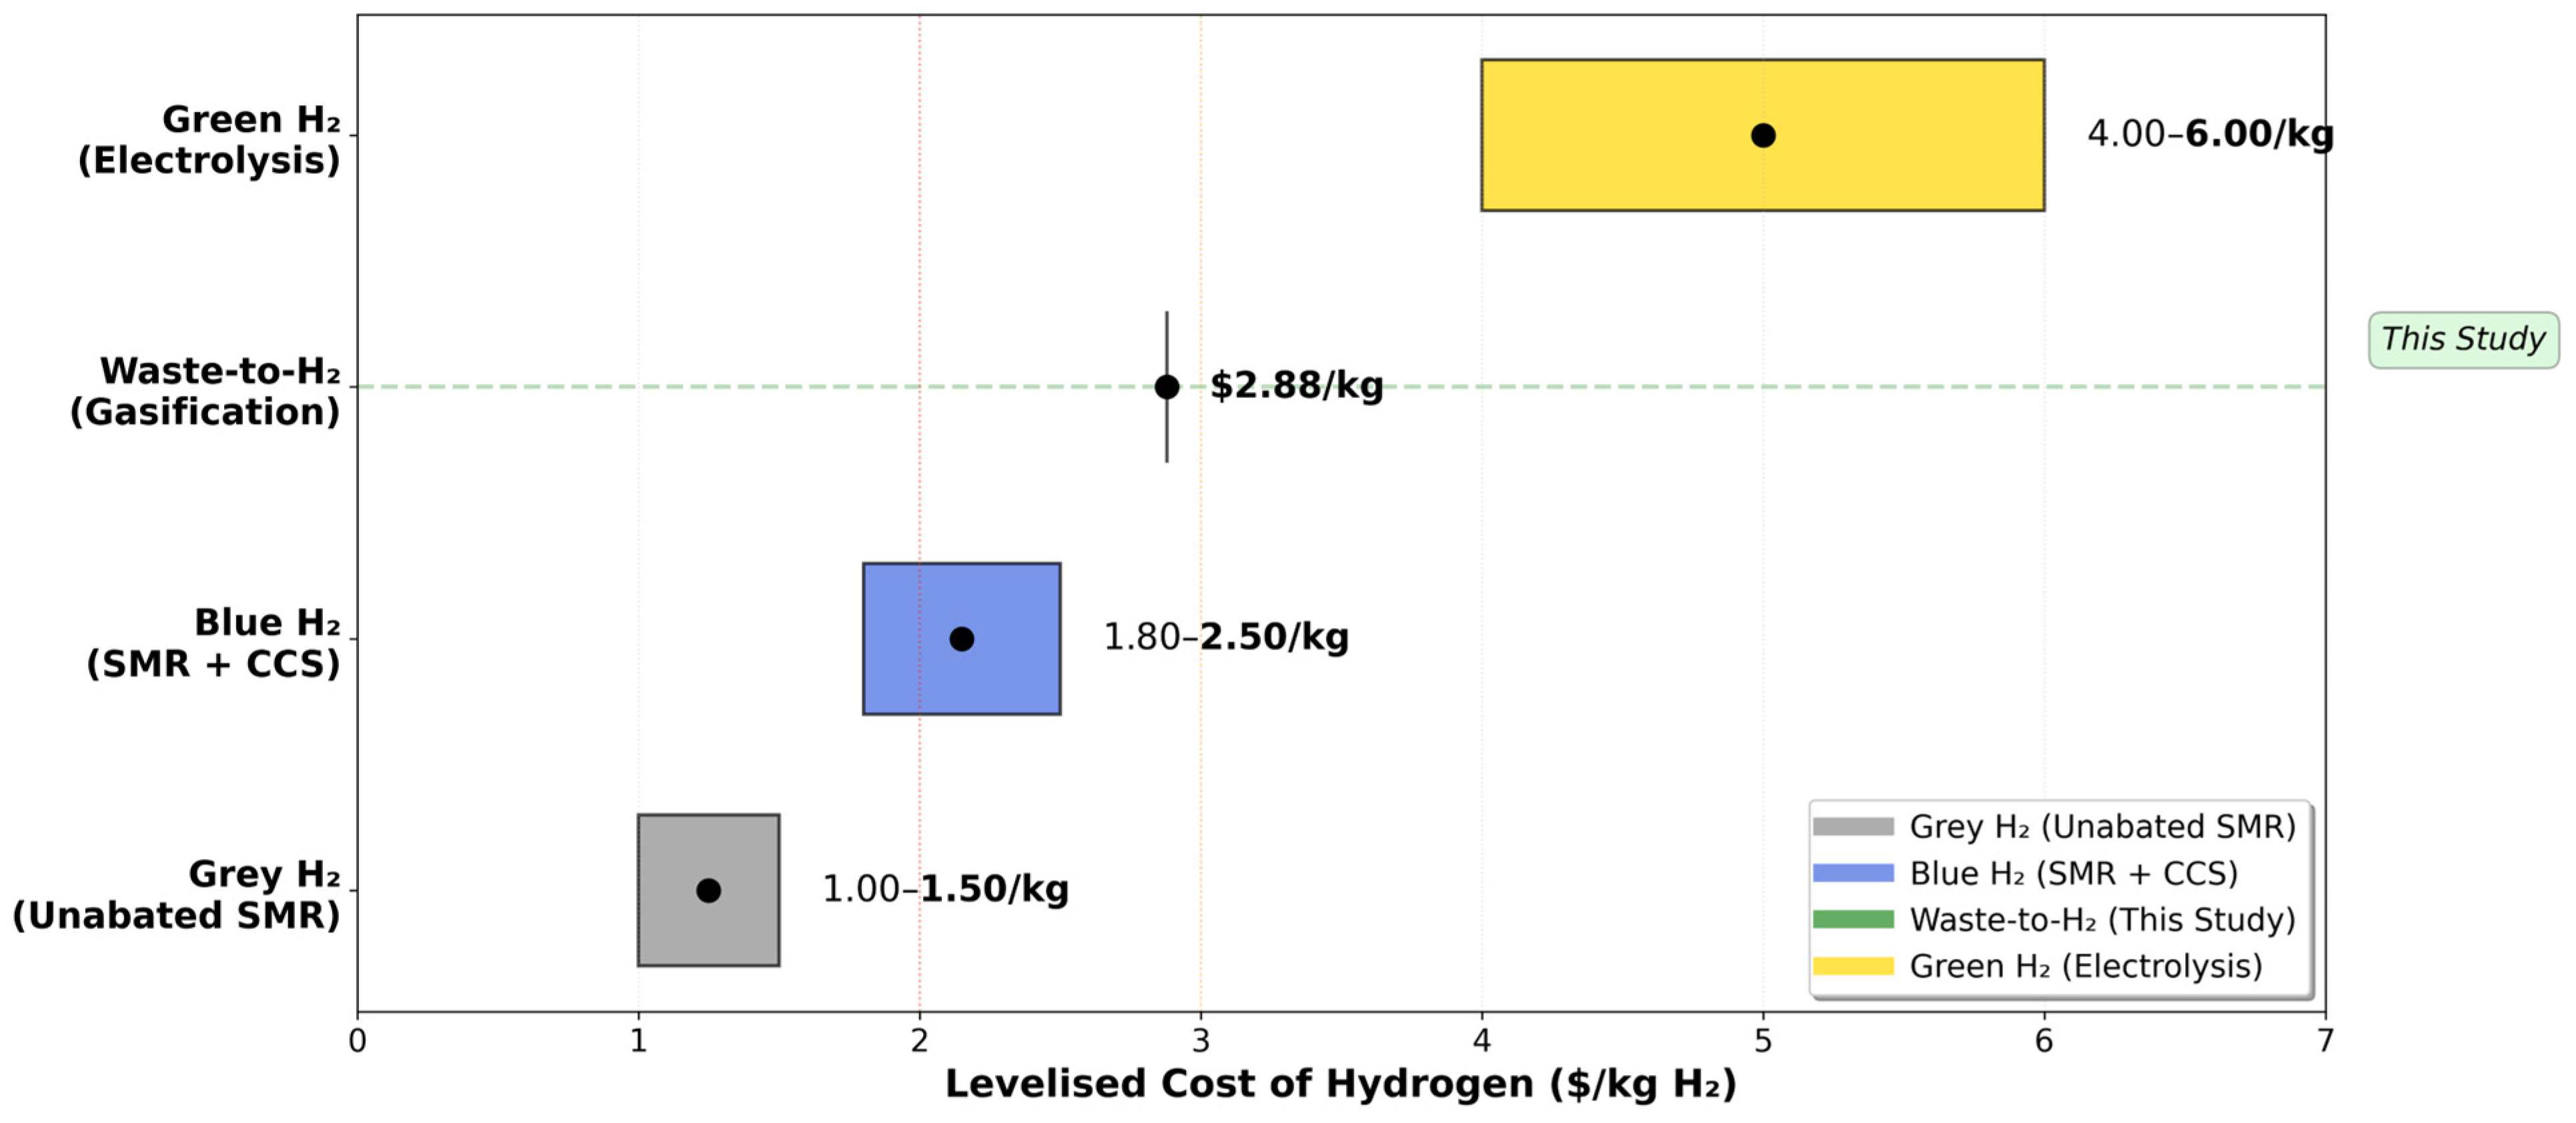
4.2.2. Comparison with Alternative Hydrogen Production Pathways
The $2.88/kg waste-to-H2 cost can be compared with alternative production pathways relevant to Oman’s context. Grey hydrogen from unabated SMR costs $1.00–1.50/kg, offering the lowest production cost due to abundant natural gas ($2–3/MMBtu in Oman) but with high carbon intensity (9–10 kg CO2/kg H2) incompatible with net-zero targets. This pathway represents the baseline for industrial H2 but faces increasing regulatory pressure.
Blue hydrogen from SMR with CCS costs
$1.80–2.50/kg [
44,
45], leveraging existing SMR infrastructure with high CO
2 capture efficiency. However, it requires CO
2 transport and storage infrastructure, which is currently limited in Oman. This pathway is the likely solution for Sohar and Duqm industrial demand, with Oman exploring CCS projects.
Green hydrogen from electrolysis currently costs
$4.00–6.00/kg, projected to decline to
$2.00–3.00/kg by 2030 [
2]. It offers zero emissions and synergises with Oman’s 10 GW renewable energy targets, but currently faces high costs and requires 50–55 kWh/kg H
2 for PEM electrolysis [
46]. Pilot projects are underway, with competitiveness expected by 2030 when renewable electricity reaches
$0.02–0.03/kWh.
Waste-to-hydrogen from gasification at $2.88/kg (this study) offers a competitive cost with waste management co-benefits and carbon-negative potential. However, it is limited by feedstock availability and technology readiness (TRL 7–8). This pathway represents a niche solution for urban and transport hubs, complementing SMR and electrolysis.
At
$2.88/kg, waste-to-hydrogen is more expensive than current blue hydrogen (
$1.80–2.50/kg; [
44,
45]) but significantly cheaper than green hydrogen (
$4–6/kg; [
2]). Comparative assessments of thermochemical hydrogen production routes demonstrate that feedstock characteristics and process configuration significantly influence production economics, with waste-based pathways offering competitive costs when waste management co-benefits are appropriately valued [
47]. Critically, waste-to-H
2 becomes increasingly competitive when accounting for non-monetised benefits. Avoiding 500 kg CO
2-eq/tonne waste through landfill diversion (estimated from Nordahl et al., [
7], a US-based study used as a proxy in the absence of Oman-specific data) generates approximately 137,000 tonnes of CO
2-eq credits annually. At
$20–50/tonne of CO
2 (potential Oman carbon price), this represents a
$2.7–6.9 million/year value, reducing effective H
2 costs to
$2.76–2.57/kg.
Figure 2 illustrates the levelised cost comparison across all four production pathways.
Municipalities currently pay $20–40/tonne for landfill disposal. Diverting 275,000 tonnes of plastic waste saves $5.5–11 million annually in avoided landfill costs—potentially shared between municipalities and H2 producers through tipping fee arrangements, further reducing effective production costs. Eliminating open burning of plastic waste in informal settlements provides local air quality and health benefits not captured in production cost calculations but valuable in policy evaluation.
When these co-benefits are internalised, waste-to-H2 effective costs may be as low as $2.40–2.50/kg, making it cost-competitive with blue hydrogen even before considering the strategic value of feedstock diversification and energy security.
4.2.3. Sensitivity Analysis
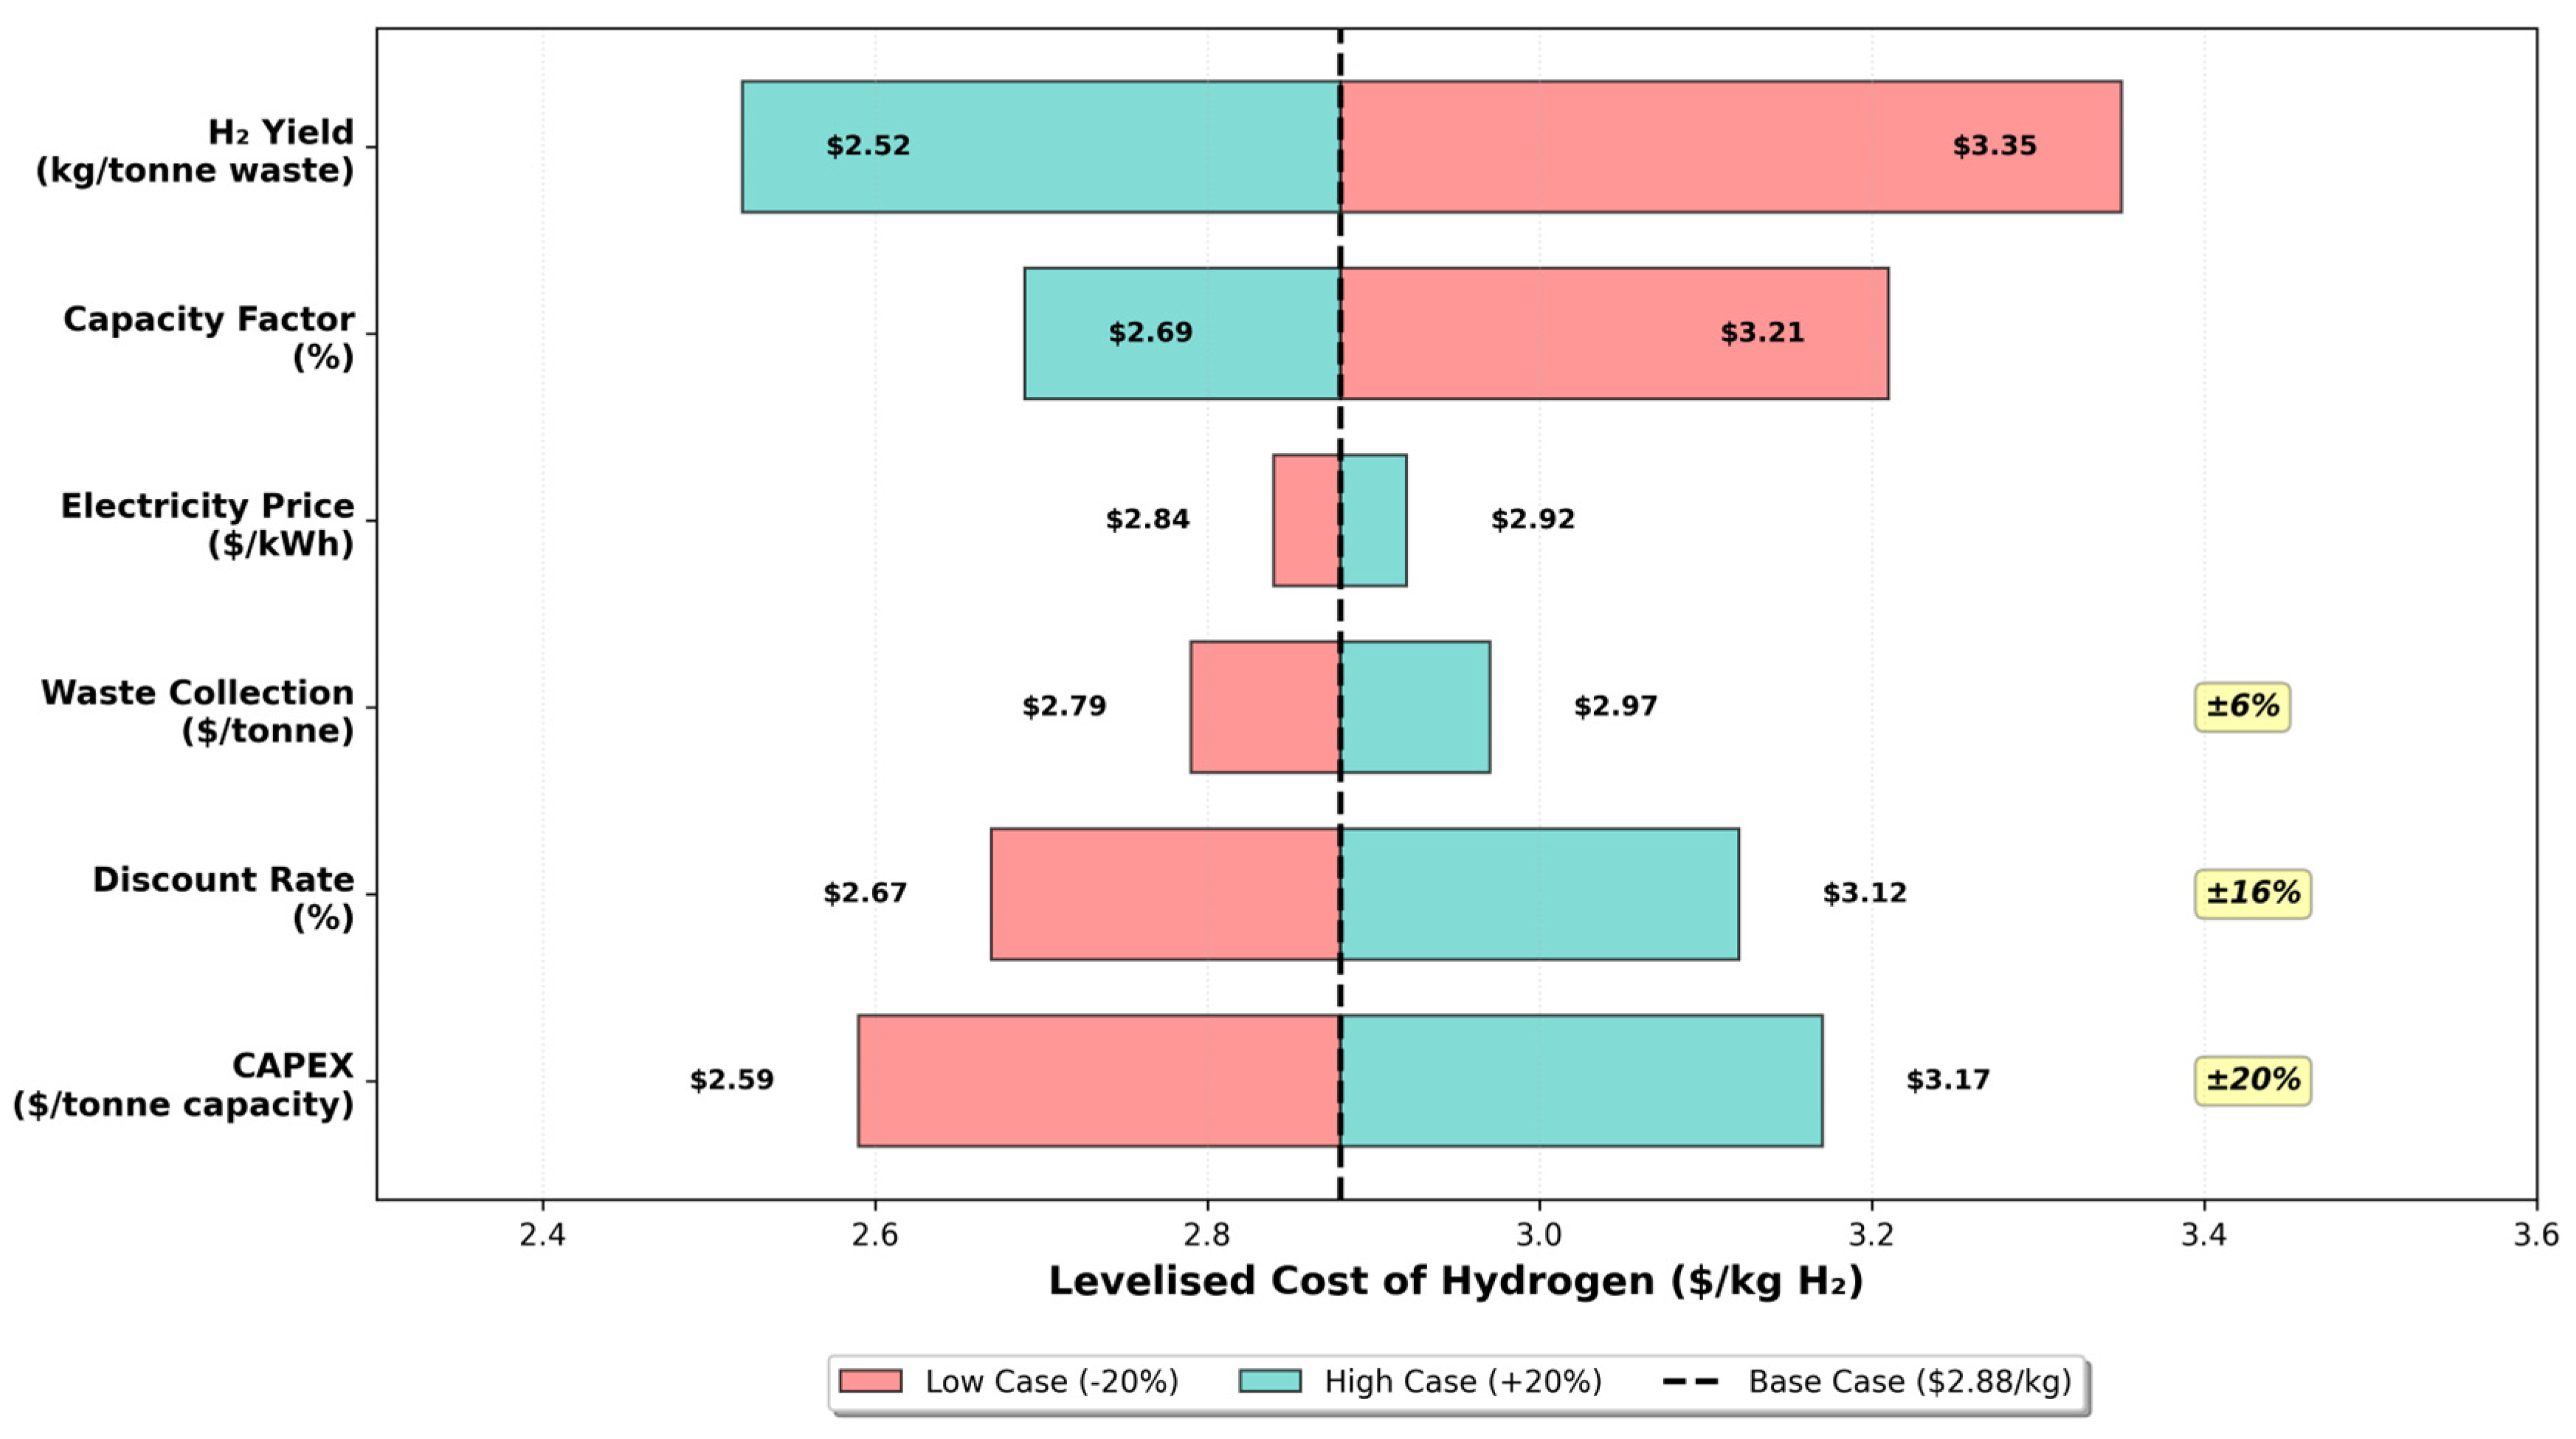
Table 8 presents sensitivity analysis results examining how levelised costs respond to ±20% variations in key technical and economic parameters. The baseline cost is
$2.88/kg.
Hydrogen yield emerges as the most impactful parameter, with a ±29% cost swing across the evaluated range. Improving gasification efficiency from 150 kg of H
2/tonne (base case) to 180 kg of H
2/tonne—achievable through optimised feed preparation and reactor design—reduces costs proportionally. Conversely, feed quality issues reducing yield to 120 kg/tonne would increase costs significantly, potentially threatening economic viability. This finding underscores the critical importance of plastic waste quality control and source separation programmes to maintain consistent feedstock characteristics. Quality control monitors: (1) moisture content < 10%, (2) contamination < 5% by weight, (3) plastic composition (HDPE/PP/PET yield 180–200 kg of H
2/tonne versus mixed plastics at 140–150 kg of H
2/tonne), and (4) particle size 10–50 mm. Mechanical sorting facilities using optical scanners achieve these specifications.
Figure 3 illustrates these sensitivities in a tornado diagram, ranked by impact magnitude.
CAPEX represents the second-most sensitive parameter, with a ±20% variation in capital costs translating to a ±10% change in levelised costs. Technology learning through scaled deployment, modular designs, or domestic manufacturing of gasification equipment within Oman or the GCC region could reduce CAPEX. Conversely, stricter environmental standards or enhanced safety requirements could increase capital costs. Given that CAPEX represents 50% of the levelised cost, this parameter warrants particular attention in cost reduction strategies.
The discount rate significantly affects costs, with a ±16% cost swing for a ±20% rate change, reflecting the capital-intensive nature of waste-to-H2 systems. Government support mechanisms such as low-cost financing, loan guarantees, or green bonds could substantially improve project economics by reducing the cost of capital. Operational parameters, including electricity costs, waste collection costs, and capacity factor, demonstrate moderate impacts (±3–18% cost changes), suggesting that whilst day-to-day operational optimisation remains important, it offers limited potential for transformative cost reductions compared to capital and yield improvements.
A combined optimistic scenario incorporating improved yield (180 kg/tonne), CAPEX reduction through learning, and lower discount rates (6%) could achieve levelised costs approaching the
$2.00–2.50/kg range cited by Lan and Yao [
48]—competitive with blue hydrogen and approaching grey hydrogen costs. This scenario appears plausible by 2030–2035 with technology maturation and appropriate policy support. Conversely, a combined pessimistic scenario with reduced yield (120 kg/tonne), increased CAPEX (+20%), and higher discount rates (10%) could increase costs to
$3.50–4.00/kg—approaching current green hydrogen costs but without the associated zero-carbon benefits. Such a scenario would likely limit waste-to-H
2 deployment to niche applications where waste management co-benefits provide strong additional value.
From an environmental robustness perspective, the waste-to-hydrogen pathway achieves net carbon avoidance of 500 kg CO
2-eq per tonne waste processed (137,000 tonnes CO
2-eq annually system-wide) through landfill methane avoidance, rendering it carbon-negative on a lifecycle basis. This performance compares favourably to conventional grey hydrogen production (9–10 kg CO
2/kg H
2; [
1]), with the model’s environmental performance remaining robust across all sensitivity scenarios as emissions primarily depend on avoided landfill methane rather than process parameters.
4.2.4. Cost Reduction Pathways and Technology Roadmap
Several pathways could progressively reduce waste-to-hydrogen costs from the current
$2.00–3.00/kg range identified in the literature [
48]. In the near term (2025–2028), feed optimisation through improved plastic sorting and cleaning could increase H
2 yield to 165–180 kg/tonne from the current 150 kg/tonne baseline. Simultaneously, localisation of gasification equipment production within Oman or the GCC region could reduce CAPEX by 10–15%, whilst operational learning could improve capacity factors from 85% to 90% through enhanced maintenance optimisation, targeting
$2.75/kg. These combined improvements could potentially reduce costs to
$2.60–2.70/kg.
Medium-term developments (2028–2032) could include commercial demonstration of larger 750–1000 TPD facilities, capturing additional economies of scale and potentially reducing CAPEX by 15–20%. Co-location synergies through integration with existing industrial facilities could enable utilities and labour sharing, targeting 5–10% OPEX reductions. Municipal extended producer responsibility schemes could reduce the waste collection costs borne directly by hydrogen producers by up to 20%. These combined advances could potentially achieve costs of $2.30–2.50/kg.
Long-term prospects (2032–2040) include advanced gasification technologies such as plasma or supercritical water gasification, which could increase yields to 200–250 kg H2/tonne—representing a 33–67% yield improvement over current baseline assumptions. Carbon credit monetisation through Oman carbon pricing mechanisms at $30–50/tonne CO2-eq could reduce effective costs by $0.15–0.30/kg. Regional-scale deployment through GCC-wide waste-to-H2 networks could enable further economies of scale, targeting 10–15% system cost reductions. These developments could potentially achieve costs of $1.50–2.00/kg.
These cost reduction pathways suggest that waste-to-hydrogen could achieve full competitiveness with blue hydrogen ($1.80–2.20/kg) by 2030–2035, particularly when co-benefits are appropriately monetised, and technology learning occurs through early commercial deployment projects.
4.3. Scenario Analysis and Complementary Pathway Requirements
Three demand scenarios were evaluated to assess waste-to-hydrogen’s role under varying hydrogen economy development pathways: base (90,000 tonnes H2/year), moderate (140,000 tonnes), and ambitious (200,000 tonnes). These scenarios reflect uncertainty in hydrogen vehicle adoption rates, industrial expansion trajectories, and export market development through 2040.
4.3.1. Scenario Results and Feedstock Constraints
Table 9 presents comparative results across the three scenarios. Notably, all three scenarios produce identical hydrogen output (21,997 tonnes/year) from identical facility configurations (four facilities totalling 886 TPD capacity). This counterintuitive result reveals a fundamental constraint: waste availability, rather than hydrogen demand, limits production potential.
The identical production across scenarios occurs because available plastic waste (330,279 tonnes/year across all five hubs) can produce a maximum of 49,542 tonnes of H2 annually at 150 kg/tonne yield. The optimisation in the base scenario utilises 42% of this theoretical potential (139,113 tonnes waste), with the remaining 58% either geographically dispersed below economic thresholds or concentrated in Muscat, where single-facility capacity limits (500 TPD) prevent full utilisation.
Increasing demand from 90,000 to 200,000 tonnes of H2 does not trigger additional facility construction because feedstock availability remains constant. Waste generation is determined by population and consumption patterns, which are fixed in the 2040 projections. Unless waste import agreements are established, collection efficiency is enhanced beyond the assumed 75%, or alternative feedstocks such as industrial plastic waste or agricultural residues are introduced, waste-to-H2 production cannot exceed approximately 22,000 tonnes/year regardless of demand levels.
This finding carries critical planning implications: waste-to-hydrogen infrastructure should be sized to utilise available feedstock optimally, rather than attempting to meet hydrogen demand targets. Attempts to scale waste-to-H2 deployment beyond feedstock limitations would result in idle capacity and poor economics, competition with plastic recycling initiatives for feedstock, or dependence on uncertain waste imports from neighbouring regions.
4.3.2. Demand Coverage Trends Across Scenarios
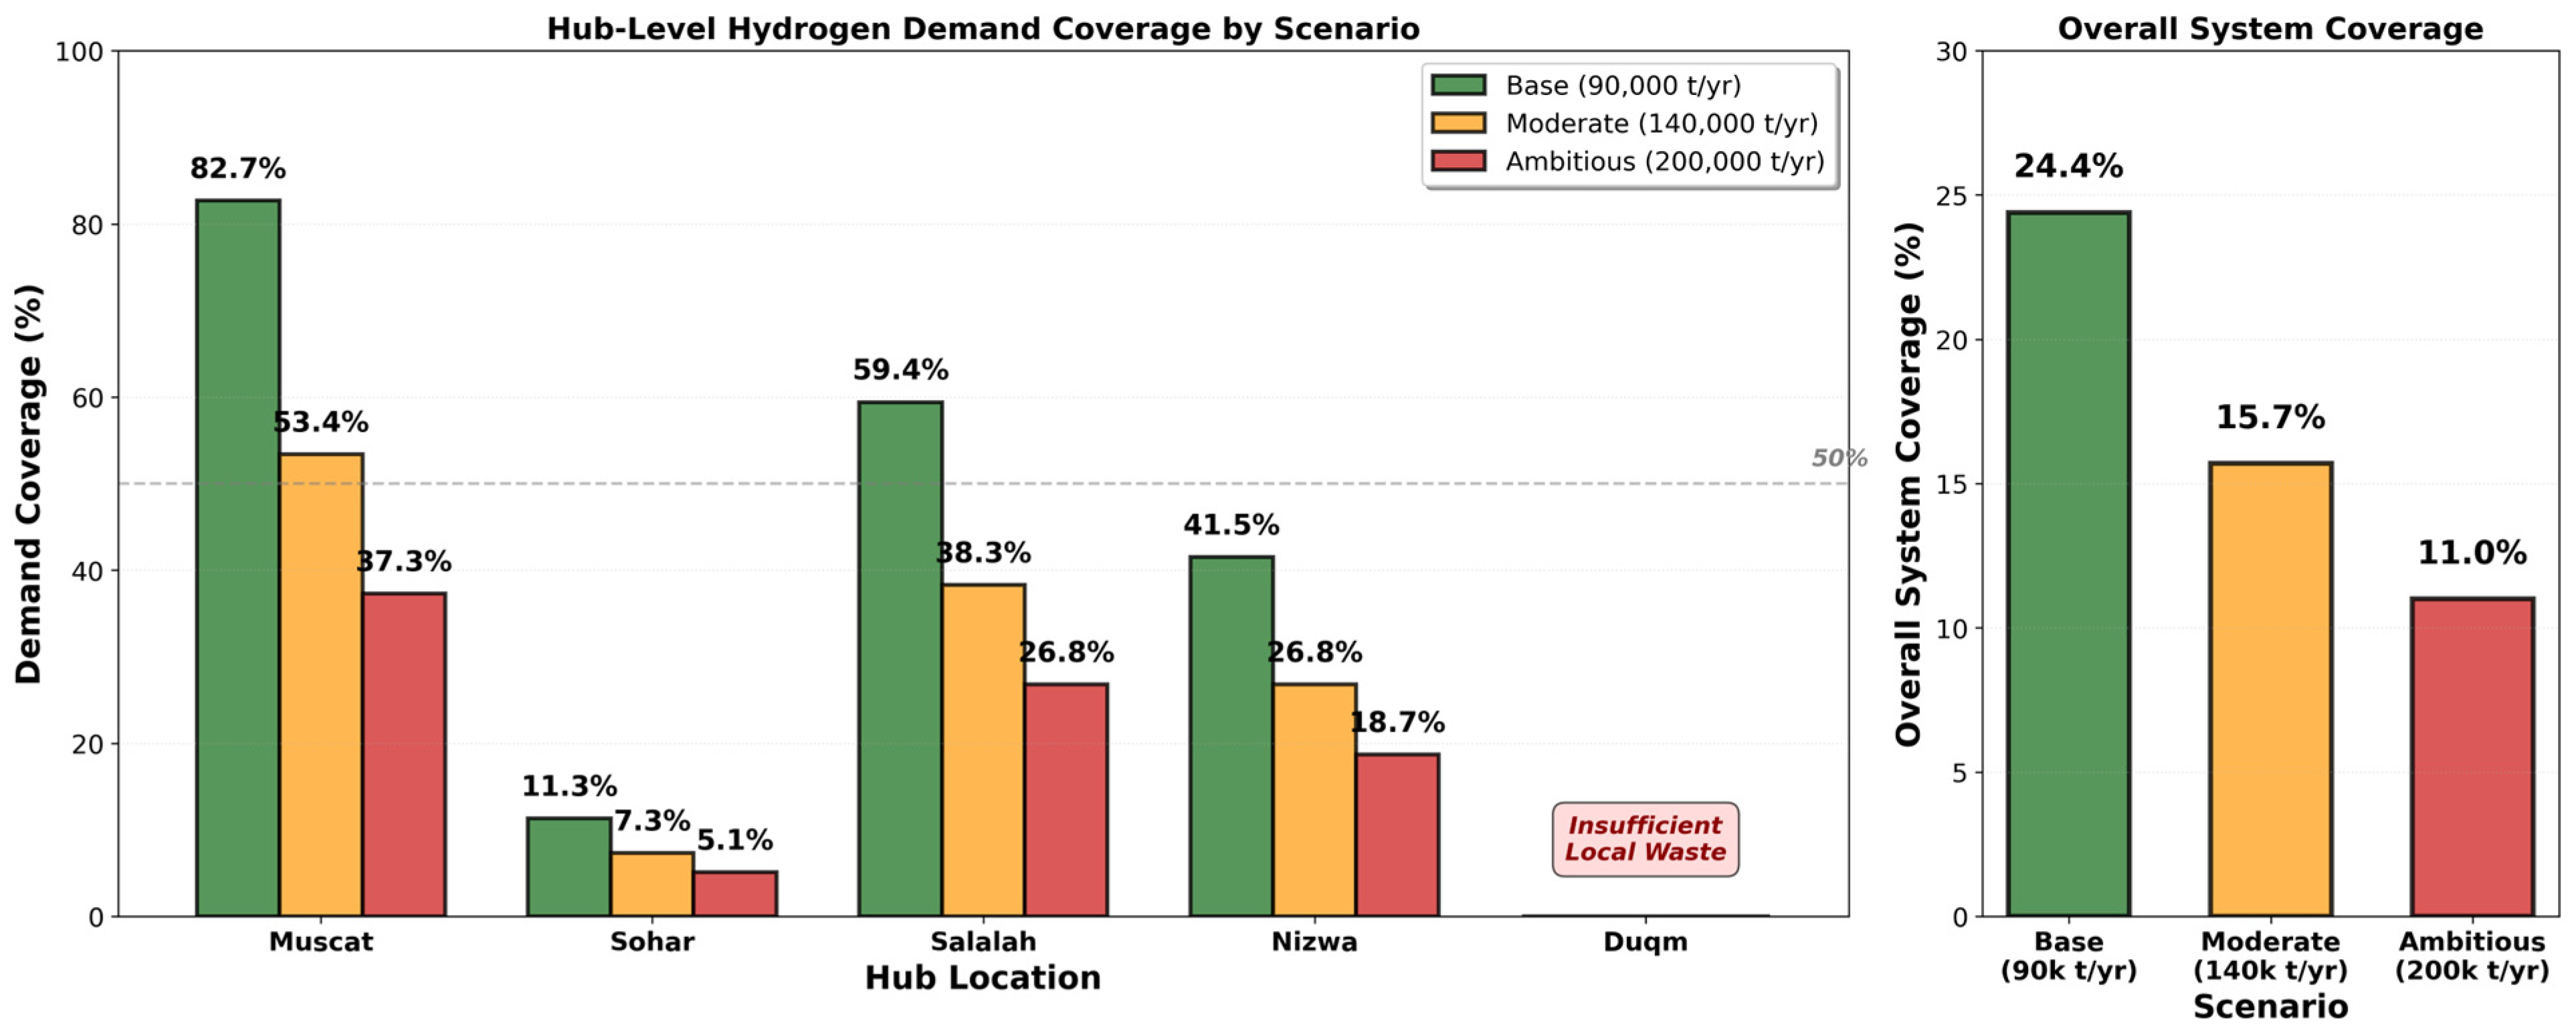
Whilst total production remains constant, demand coverage rates decline systematically as scenario ambition increases: 24.4% (base) → 15.7% (moderate) → 11.0% (ambitious). This trend reflects the growing gap between fixed waste-constrained production and escalating hydrogen demand.
In the base scenario, waste-to-H2 provides meaningful coverage at urban and transport-focused hubs: Muscat (82.7%), Salalah (59.4%), and Nizwa (41.5%). This level of contribution suggests waste-to-hydrogen could serve as a primary supply source for passenger vehicle fleets, municipal transport, and distributed applications in these cities, with complementary pathways addressing the 15–60% coverage gaps.
The moderate scenario assumes 15% hydrogen vehicle penetration (compared to 10% in Base) and 20% industrial expansion. Under these conditions, coverage rates decline to Muscat 53.4%, Salalah 38.3%, and Nizwa 26.8%. At these levels, waste-to-H2 transitions from a primary to a supplementary supply role, requiring substantial blue or green hydrogen capacity even within urban centres.
The ambitious scenario, characterised by 20% vehicle penetration, 40% industrial expansion, and major export contracts, further reduces coverage to Muscat, 37.3%; Salalah, 26.8%; and Nizwa, 18.7%. Under this development pathway, waste-to-H
2 becomes a minor contributor, providing 11% of system-wide hydrogen requirements, whilst other pathways must deliver the remaining 89%.
Figure 4 illustrates these coverage trends, highlighting the declining contribution of waste-to-H
2 as hydrogen demand scales whilst production remains constrained by feedstock availability.
Industrial hubs demonstrate severe coverage deficits across all scenarios. Sohar’s coverage declines from 11.3% (base) to 7.3% (moderate) to 5.1% (ambitious), whilst Duqm registers 0.0% coverage across all scenarios due to insufficient local waste generation. These hubs require dedicated industrial hydrogen production via SMR with CCS regardless of the scenario trajectory. The waste-to-H2 contribution at Sohar (3173 tonnes/year) could offset approximately 11% of refinery hydrogen demand but cannot substitute for large-scale SMR infrastructure required to meet the balance of industrial requirements.
4.3.3. Complementary Pathway Requirements by Scenario
Table 10 quantifies the hydrogen supply gap that must be addressed by complementary production pathways in each scenario, disaggregated by likely production method based on end-use requirements and technical feasibility.
In the base scenario (90,000 t/yr), blue hydrogen dominates at 51% of total supply, primarily serving Sohar and Duqm refineries, which collectively require 56,000 tonnes/year. Existing natural gas infrastructure and refinery co-location make SMR with CCS the most economical pathway for industrial hydrogen applications. Waste-to-H2 and green hydrogen contribute approximately equal shares (~24% each), with waste-derived hydrogen focused on urban centres, whilst green H2 addresses transport demand growth and provides strategic supply diversification. The required investment encompasses approximately $500 M for SMR with CCS capacity and $450 M for green hydrogen electrolysers (assuming $2000/kW CAPEX), with the waste-to-H2 infrastructure ($63 M/year operating cost) already accounted for.
The moderate scenario (140,000 t/yr) sees blue hydrogen scale to 59% (82,000 t/yr), reflecting not only refinery baseload requirements but also industrial expansion in petrochemicals and ammonia production at Sohar and the Duqm Special Economic Zone. Green hydrogen increases to 26% (36,000 t/yr), driven by higher fuel cell vehicle penetration (15% fleet penetration) and potential ammonia export opportunities leveraging Oman’s renewable energy targets (10 GW by 2030). The waste-to-H2 share declines to 16% in relative terms but maintains absolute production levels, continuing to serve as a reliable baseload supply for urban transport applications. Additional investment requirements include approximately $400 M for SMR with CCS expansion and $300 M for enhanced green H2 capacity.
Under the ambitious scenario (200,000 t/yr), blue hydrogen reaches 65% (130,000 t/yr), approaching the practical limit of Oman’s indigenous industrial hydrogen demand plus moderate exports to regional petrochemical facilities. Green hydrogen grows to 24% (48,000 t/yr), positioned to support green ammonia exports and domestic zero-carbon transport fuel supply. Waste-to-H
2 declines to 11% of total supply, highlighting its fundamentally niche role in a mature, large-scale hydrogen economy, where production scale economics favour SMR and electrolysis pathways. Cumulative investment requirements approach
$1.5 B for comprehensive hydrogen infrastructure development across all pathways. Financing mechanisms to secure these investments are discussed in
Section 5.2, including concessional loans, public-private partnerships, government procurement mandates, and capital grants for early deployment.
4.3.4. Integrated System Planning Implications
The scenario analysis reveals several critical insights for Oman’s hydrogen development strategy. First, waste-to-hydrogen deployment should proceed immediately, sized to available feedstock resources (approximately 22,000 t/yr) rather than delayed pending demand certainty. The technology demonstrates economic viability at current costs ($2.88/kg), provides tangible waste management co-benefits, and offers supply portfolio diversification regardless of which demand scenario ultimately materialises.
Second, blue hydrogen infrastructure development is essential across all evaluated scenarios. Refineries require large, concentrated hydrogen supplies that waste-to-H2 systems cannot feasibly provide, given feedstock constraints. Sohar and Duqm should, therefore, prioritise SMR with CCS development, potentially targeting 2027–2030 commissioning to align with refinery expansion timelines and industrial growth projections.
Third, green hydrogen becomes increasingly critical as scenarios progress beyond the base case trajectory. The moderate and ambitious scenarios require 36,000–48,000 tonnes/year of green hydrogen—achievable only through substantial renewable energy deployment (3–4 GW dedicated capacity) and corresponding electrolyser installation. This requirement suggests a phased implementation approach: blue hydrogen addresses near-term industrial demand (2025–2030), with green hydrogen progressively scaling to serve transport applications and export markets (2030–2040).
Fourth, infrastructure coordination across pathways is vital for system efficiency. All three production pathways benefit from shared supporting infrastructure, including hydrogen refuelling stations, pipeline corridors, safety regulations and standards, and workforce training programmes. Early waste-to-H2 deployment in Muscat and Salalah could catalyse this enabling infrastructure development, thereby reducing barriers and deployment costs for subsequent blue and green hydrogen projects.
Fifth, feedstock diversification strategies could meaningfully enhance the waste-to-H2 contribution. GCC-wide waste sharing agreements, improved collection efficiency (increasing from 75% to 85–90%), or incorporation of alternative feedstocks such as agricultural residues and industrial plastic waste could potentially increase waste-to-H2 production to 30,000–35,000 tonnes/year, improving demand coverage rates by 5–8 percentage points across all scenarios.
Sixth, cost competitiveness dynamics create pathway optionality and strategic flexibility. At $2.88/kg, waste-to-hydrogen occupies an intermediate position between blue hydrogen ($1.80–2.50/kg) and current green hydrogen ($4–6/kg, projected $2–3/kg by 2030). Should green hydrogen costs decline more rapidly than projected, waste-to-H2 may face increased competition for urban transport applications by 2035. Conversely, if CCS deployment progress lags expectations or carbon pricing regimes strengthen substantially, waste-to-H2 becomes increasingly attractive relative to blue hydrogen. This inherent uncertainty argues for flexible, modular deployment strategies that preserve optionality across multiple pathways.
The complementary pathway framework positions waste-to-hydrogen as a guaranteed contributor across all evaluated scenarios—neither transformative in scale nor negligible in impact, but reliably providing 11–24% of total hydrogen supply whilst simultaneously delivering waste management and energy security co-benefits. Oman’s hydrogen strategy should, therefore, embrace this multi-pathway approach, leveraging the distinct advantages of waste-to-H2 (waste utilisation, distributed production), blue hydrogen (industrial scale, established technology, lower cost), and green hydrogen (zero emissions, export market potential) within an integrated system optimised for cost-effectiveness, supply reliability, and environmental sustainability.
5. Discussion
This study demonstrates that waste-to-hydrogen can produce 21,997 tonnes of H2 annually from plastic waste in Oman by 2040, meeting 24% of base case demand at a competitive cost of $2.88/kg. Whilst this production capacity is insufficient to serve as Oman’s primary hydrogen pathway, the findings reveal important strategic opportunities for waste-to-H2 within an integrated, multi-pathway hydrogen economy. This section discusses the broader implications for Oman’s energy transition, policy recommendations to enable deployment, comparisons with international initiatives, and study limitations.
5.1. Strategic Role of Waste-to-Hydrogen in Oman’s Energy Transition
The results position waste-to-hydrogen as a complementary rather than primary pathway in Oman’s hydrogen economy, with distinct strategic advantages that justify early deployment despite scale limitations.
Waste management integration provides immediate co-benefits beyond hydrogen production. Oman generates approximately 1.8 million tonnes of municipal solid waste annually [
5], with plastic waste comprising 27% [
6]—amongst the highest fractions in the Middle East. Current waste management practices rely heavily on landfilling, with associated methane emissions, land use conflicts, and groundwater contamination risks. Diverting 275,000 tonnes of plastic waste annually to hydrogen production avoids 137,000 tonnes CO
2-eq through landfill diversion whilst simultaneously addressing a growing waste management challenge. This dual-benefit nature renders waste-to-H
2 economically attractive even where hydrogen demand alone might not justify deployment. The integration of waste management and energy production objectives creates circular economy value that extends beyond conventional hydrogen production economics, as demonstrated in recent assessments of plastic waste gasification systems [
25].
Distributed production architecture aligns with Oman’s dispersed urban geography. Unlike centralised SMR facilities that require pipeline infrastructure or costly hydrogen transport, waste-to-H2 facilities are located at waste generation centres (Muscat, Sohar, Salalah, Nizwa), enabling localised production-consumption patterns. This distributed model reduces infrastructure requirements; enhances supply security through geographic diversification; and creates local employment in waste collection, facility operations, and maintenance. For Oman’s regional development goals—particularly strengthening secondary cities such as Salalah and Nizwa—waste-to-H2 offers a pathway to establish hydrogen economies outside the capital region.
Technology readiness and deployment timeline favour waste-to-H2 for near-term action. Gasification of plastic waste represents a mature technology (TRL 8–9) with commercial demonstrations in Japan, Europe, and North America, whereas large-scale green hydrogen faces renewable energy infrastructure constraints (Oman’s 10 GW renewable target extends to 2030), and blue hydrogen requires CCS infrastructure currently absent in Oman. Waste-to-H2 facilities could achieve financial close by 2026 and operational status by 2028–2029, providing early hydrogen supply to catalyse vehicle adoption, refuelling infrastructure development, and workforce training—creating positive spillovers for subsequent blue and green hydrogen deployment.
Feedstock security and price stability distinguish waste-to-H2 from fossil-dependent pathways. Natural gas prices, whilst currently low in Oman ($2–3/MMBtu), face long-term uncertainty from LNG export commitments, domestic demand growth, and potential depletion of high-quality reservoirs. Electricity prices for green hydrogen depend on renewable energy deployment pace and grid integration costs. In contrast, plastic waste availability is predictable based on population projections and consumption trends, with near-zero marginal feedstock cost (collection costs are fixed operational expenses). This stability supports long-term offtake agreements and project financing.
However, the 11–24% demand coverage limitation across scenarios means waste-to-H2 cannot anchor Oman’s hydrogen economy. Industrial demand at Sohar and Duqm refineries (56,000 tonnes/year combined) necessitates blue hydrogen via SMR with CCS, whilst achieving ambitious export targets or deep transport sector decarbonisation requires green hydrogen at scales (50,000–100,000 tonnes/year) far exceeding waste-to-H2 potential. The appropriate strategic framing positions waste-to-H2 as a guaranteed baseload contributor (analogous to run-of-river hydropower in electricity systems)—reliably providing 20,000+ tonnes/year across all demand scenarios whilst blue and green hydrogen scale to meet marginal demand growth and industrial requirements.
5.2. Policy Recommendations and Enabling Framework
Realising waste-to-hydrogen’s potential requires coordinated policy action across waste management, energy, and industrial development domains. Five priority recommendations emerge from this analysis.
First, integrate waste-to-hydrogen into the national waste management strategy. Oman’s National Waste Management Strategy should explicitly recognise energy recovery through gasification as a preferred pathway for non-recyclable plastic waste. This requires establishing waste hierarchy guidance placing waste-to-energy (including H2) above landfilling but below mechanical recycling for recyclable plastics; developing source separation programmes for plastic waste to improve feedstock quality and gasification efficiency; and implementing extended producer responsibility (EPR) schemes requiring plastic producers and importers to fund collection infrastructure, potentially reducing the $35/tonne collection cost borne by hydrogen producers by 40–60%.
Second, provide targeted financial support for first-mover facilities. The capital-intensive nature of waste-to-H2 (50% of the levelised cost is the annualised CAPEX) creates barriers to initial deployment despite economic viability. Policy mechanisms could include loan guarantees or concessional financing through Oman’s sovereign wealth funds or development banks, reducing discount rates from 8% to 5–6% and lowering costs by $0.30–0.40/kg; capital grant programmes covering 20–30% of CAPEX for the first 2–3 facilities to derisk technology and demonstrate viability; accelerated depreciation for waste-to-energy assets to improve project internal rate of return; and green hydrogen production credits (similar to the U.S. Inflation Reduction Act) of $0.50–1.00/kg for waste-derived hydrogen, recognising carbon-negative lifecycle emissions.
Third, establish hydrogen offtake mechanisms and market structures. Near-term hydrogen demand uncertainty creates circular challenges: vehicle manufacturers hesitate to enter markets without refuelling infrastructure, whilst fuel suppliers require demand certainty. Policy interventions could include government fleet procurement mandates requiring 10–15% hydrogen fuel cell vehicles in municipal, police, and public transport fleets by 2030; hydrogen refuelling station co-investment through public-private partnerships, targeting 20–30 stations in Muscat, Salalah, Sohar, and along major highways; offtake agreements with state-owned enterprises (OQ, OETC, and the Nama Group) for industrial hydrogen at waste-to-H2 facilities; and renewable energy certificates or “green hydrogen” labelling for waste-derived H2 to access premium markets.
Fourth, coordinate multi-pathway hydrogen infrastructure development. The complementary pathway framework requires avoiding stranded assets whilst enabling synergies. This encompasses an integrated hydrogen strategy designating waste-to-H2 for urban centres (Muscat and Salalah), blue H2 for industrial clusters (Sohar and Duqm), and green H2 for export facilities; common technical standards for hydrogen purity, safety, and refuelling to enable multi-source supply; shared infrastructure planning for pipelines, storage, and distribution to avoid duplication; and workforce development programmes creating transferable skills across waste-to-H2, SMR, and electrolysis sectors.
Fifth, enable regional waste and hydrogen trade within the GCC. Oman’s waste availability (330,000 tonnes plastic/year) limits production to approximately 26,000 tonnes H2. Regional cooperation could expand this through a GCC waste trading framework allowing import of plastic waste from the UAE, Saudi Arabia, and Qatar (which have even higher per capita plastic waste generation but less developed waste-to-energy programmes); hydrogen export corridors leveraging Oman’s strategic location between GCC producers (Saudi Arabia and the UAE) and South Asian consumers (India and Pakistan); and joint research and development programmes on advanced gasification, waste logistics, and hydrogen distribution.
Whilst this study focuses on system-level economics, facility-specific financial analysis incorporating discount rates, financing structures, and risk assessments would support investment decisions and public-private partnership negotiations. These policies align with Oman Vision 2040’s emphasis on economic diversification, environmental sustainability, and regional integration. Early action on waste-to-hydrogen can position Oman as a GCC leader in circular economy approaches to energy transition.
5.3. International Context and Comparative Analysis
Oman’s waste-to-hydrogen potential, whilst modest in absolute terms compared to developed economies with established waste-to-energy infrastructure, represents a significant opportunity within the Middle Eastern context. Advanced economies in Europe and East Asia have successfully demonstrated commercial-scale waste-to-hydrogen deployment through gasification technologies, establishing both technical feasibility and operational experience that can inform Oman’s development pathway. These international precedents illustrate how waste management and hydrogen production objectives can be effectively integrated within national energy strategies, providing valuable insights for emerging hydrogen economies.
Oman’s projected production of approximately 22,000 tonnes H
2 annually reflects particularly favourable conditions despite the country’s relatively modest population. This production potential derives from several distinctive characteristics: high per capita plastic consumption (88 kg/year), achievable waste collection efficiency (75% assumed, realistic given urban concentration patterns), and an elevated plastic fraction in municipal solid waste (27%, typical for GCC countries; [
6]). When normalised for population size, these characteristics position Oman competitively relative to international benchmarks, suggesting that scale constraints need not preclude economically viable deployment.
Within the Middle East, Oman possesses distinctive advantages for waste-to-hydrogen leadership. Whilst neighbouring countries such as the UAE and Saudi Arabia generate substantially larger absolute waste quantities owing to their greater populations, these nations have predominantly pursued alternative waste-to-energy pathways centred on electricity generation rather than hydrogen production. Qatar’s smaller population fundamentally constrains achievable scale regardless of technological choices. Oman’s particular combination of attributes—moderate production scale, robust institutional capacity, explicit hydrogen economy ambitions articulated in Vision 2040, and well-documented waste management challenges requiring policy intervention—creates unusually favourable conditions for pioneering integrated waste-to-hydrogen systems within the region. This convergence of drivers suggests Oman could establish regional leadership in circular economy approaches to hydrogen production.
The levelised cost of
$2.88/kg demonstrated in this study falls comfortably within the
$2.00–3.00/kg range reported in recent international techno-economic analyses [
48], indicating genuine cost competitiveness with global benchmarks rather than merely theoretical viability. International variations in production costs naturally reflect differences in environmental regulatory stringency, land availability and associated costs, prevailing labour rates, and achievable facility scale. Oman’s comparatively lower labour costs and abundant land availability partially offset the economic penalties typically associated with smaller initial project scale, yielding production economics that prove competitive with international experience whilst simultaneously delivering localised waste management co-benefits not easily monetised in conventional cost comparisons. This dual-value proposition strengthens the case for deployment beyond purely economic considerations.
5.4. Study Limitations and Uncertainties
Several limitations should be considered when interpreting results. Waste generation projections assume linear population growth (3%/year) and constant per capita plastic consumption (88 kg/year). Actual waste generation may vary due to economic volatility affecting consumption patterns, plastic reduction policies (bans on single-use plastics, deposit-return schemes) potentially reducing feedstock by 10–30%, recycling expansion diverting high-quality plastics from gasification feedstock, or informal sector dynamics affecting collection efficiency below the assumed 75%. Sensitivity analysis suggests ±20% waste availability changes levelised costs by ±12% (through economies of scale effects), but the multi-pathway framework accommodates this uncertainty—lower waste availability reduces waste-to-H2 share from 24% to 20%, which remains valuable.
Technology assumptions employ realistic gasification performance (150 kg H2/tonne waste based on recent experimental studies, 85% capacity factor). Advanced technologies—plasma gasification, supercritical water gasification—could achieve 180–250 kg/tonne yields with higher reliability (90–95% uptime), potentially increasing production by 50–80%. However, these technologies remain at TRL 6–7, with uncertain costs and operational challenges at commercial scale. The conservative baseline protects against over-optimistic projections.
Demand projections rely on policy-driven scenarios (10–20% hydrogen vehicle penetration) with high uncertainty. Actual adoption depends on vehicle availability, refuelling infrastructure, and total cost of ownership relative to battery electric vehicles. If hydrogen vehicles underperform (e.g., 5% penetration), waste-to-H2 coverage would exceed 40%, potentially serving as a primary urban fuel source. Conversely, if industrial demand expands faster than projected (e.g., ammonia exports and new refineries), the waste-to-H2 share could drop below 10%. The analysis demonstrates waste-to-H2 is economically viable across this range, adjusting its strategic role accordingly.
Spatial optimisation simplifies Oman’s geography to five hubs, omitting smaller cities and inter-city distances. A higher-resolution analysis might identify additional optimal facility locations (e.g., Sur, Ibri, and Khasab) or justify inter-hub pipelines at higher production volumes. However, the fundamental finding—that localised production is optimal at current scale—would likely persist.
Competition with recycling is not explicitly modelled. If mechanical recycling becomes economically competitive for all plastic types (requiring significant technological advances), feedstock for gasification could decline to only contaminated and mixed plastics unsuitable for recycling. This would reduce waste-to-H2 to 12,000–15,000 tonnes/year, halving its contribution. However, current recycling economics favour gasification for mixed, contaminated, and low-grade plastics that dominate MSW streams.
Environmental impacts beyond GHG emissions are not quantified. Gasification produces ash residues (5–10% of input mass), requires water (0.01 m
3/kg H
2), and may emit trace pollutants (NO
X, particulates) requiring abatement. Lifecycle assessment would provide fuller environmental accounting, potentially revealing trade-offs between climate benefits and local environmental impacts. The use of US-based landfill emission factors [
7] introduces geographic uncertainty in the absence of Oman-specific data; however, ±20% variation would alter the carbon credit value by
$3–7 million annually without materially affecting core conclusions.
Despite these limitations, the core finding is robust: waste-to-hydrogen can reliably contribute 20,000–25,000 tonnes of H2/year to Oman’s hydrogen economy at competitive costs, providing waste management co-benefits that justify deployment as part of a diversified hydrogen strategy.
The model assumes waste is processed at generation locations without inter-hub transport. Whilst this assumption reflects current waste management practices and avoids feedstock quality degradation, future research incorporating waste flow variables could assess potential benefits of regional consolidation. For instance, Muscat generates 757 TPD of plastic waste, yet facility capacity is constrained to 500 TPD, potentially offering surplus feedstock for smaller hubs. However, such an analysis would require detailed waste logistics cost data and quality control protocols that are not currently available for Oman’s context.
5.5. Future Research Directions
Several research priorities emerge to refine waste-to-hydrogen planning for Oman. A pilot facility demonstration at 25–50 TPD scale in Muscat would validate actual H2 yield from Oman’s plastic waste composition, operational reliability, and maintenance requirements in the GCC climate; feedstock collection logistics and quality control; and integration with refuelling stations or industrial offtakers.
Detailed waste characterisation across Oman regions should verify plastic fraction and composition (PET, HDPE, LDPE, PP, and PS ratios), assess seasonal and geographic variations, identify contamination levels and preprocessing requirements, and quantify competition with the informal recycling sector.
Hybrid production systems analysis could examine co-gasification of plastic waste with biomass, agricultural residues, or MSW organics; integration with waste-to-electricity through combined heat and power with H2 production; and co-location with SMR facilities for shared utilities and H2 purification.
Advanced gasification technologies merit evaluation, including plasma gasification for higher yields and lower emissions, supercritical water gasification for wet and contaminated feedstocks, and modular micro-gasification for distributed deployment in smaller cities. Advances in catalytic systems for plastic waste pyrolysis and gasification offer pathways to improved conversion efficiencies and product selectivity [
49].
Comprehensive lifecycle assessment should quantify the full GHG footprint, including upstream collection, processing, and downstream use; air quality impacts (particulates, VOCs, NOx) relative to landfilling; water stress implications of water-intensive gasification; and land use and habitat impacts of facility siting.
Economic modelling under uncertainty could explore carbon price sensitivity ($10–100/tonne CO2), natural gas price scenarios (affecting blue H2 competitiveness), renewable electricity cost trajectories (affecting green H2 timing), and international hydrogen trade dynamics (Middle East as exporter versus importer).
Policy mechanism design should develop optimal subsidy structures (CAPEX grants versus production credits versus offtake guarantees), waste EPR scheme designs for hydrogen production integration, regional cooperation frameworks for waste and hydrogen trade, and regulatory standards for waste-to-hydrogen environmental performance.
This research agenda can be pursued through academic–industry–government partnerships, positioning Oman as a knowledge leader in waste-to-hydrogen whilst informing evidence-based policy development.
6. Conclusions
This study evaluated the techno-economic feasibility and optimal deployment of waste-to-hydrogen infrastructure in Oman through 2040 using mixed-integer linear programming optimisation. Plastic waste gasification can produce 21,997 tonnes of H2 annually at $2.88/kg, competitive with blue hydrogen ($1.80–2.50/kg) and significantly cheaper than green hydrogen ($4–6/kg) whilst simultaneously diverting 275,000 tonnes of plastic waste annually and avoiding 137,000 tonnes of CO2-eq through landfill methane prevention.
The optimal network comprises four facilities—Muscat (500 TPD), Sohar (128 TPD), Salalah (192 TPD), and Nizwa (67 TPD)—totalling 886 TPD capacity. Duqm is excluded despite significant hydrogen demand due to insufficient local waste availability, highlighting waste availability as the critical constraint in determining viable hub locations. Sensitivity analysis demonstrates that hydrogen yield (±29% LCOH impact) and capital costs (±20% impact) are the most critical parameters.
Waste-derived hydrogen can meet only 24% of base case demand (90,000 tonnes), declining to 11% under ambitious scenarios (200,000 tonnes). This positions waste-to-H2 as a complementary pathway requiring integration with blue and green hydrogen. Early deployment can position Oman as a regional circular economy leader aligned with Vision 2040 objectives.
Recommendations include integrating waste-to-hydrogen into the national waste strategy, targeted financial support for first-mover facilities, government fleet procurement mandates, and multi-pathway infrastructure coordination.
Future work should focus on pilot demonstration, regional waste characterisation, hybrid systems analysis, detailed financial analyses (NPV, IRR, and payback period) to assess economic sustainability, and lifecycle assessment. With appropriate support, waste-to-hydrogen can reliably contribute 20,000–25,000 tonnes of H2 annually whilst addressing plastic waste management through proven gasification technology.