1. Introduction
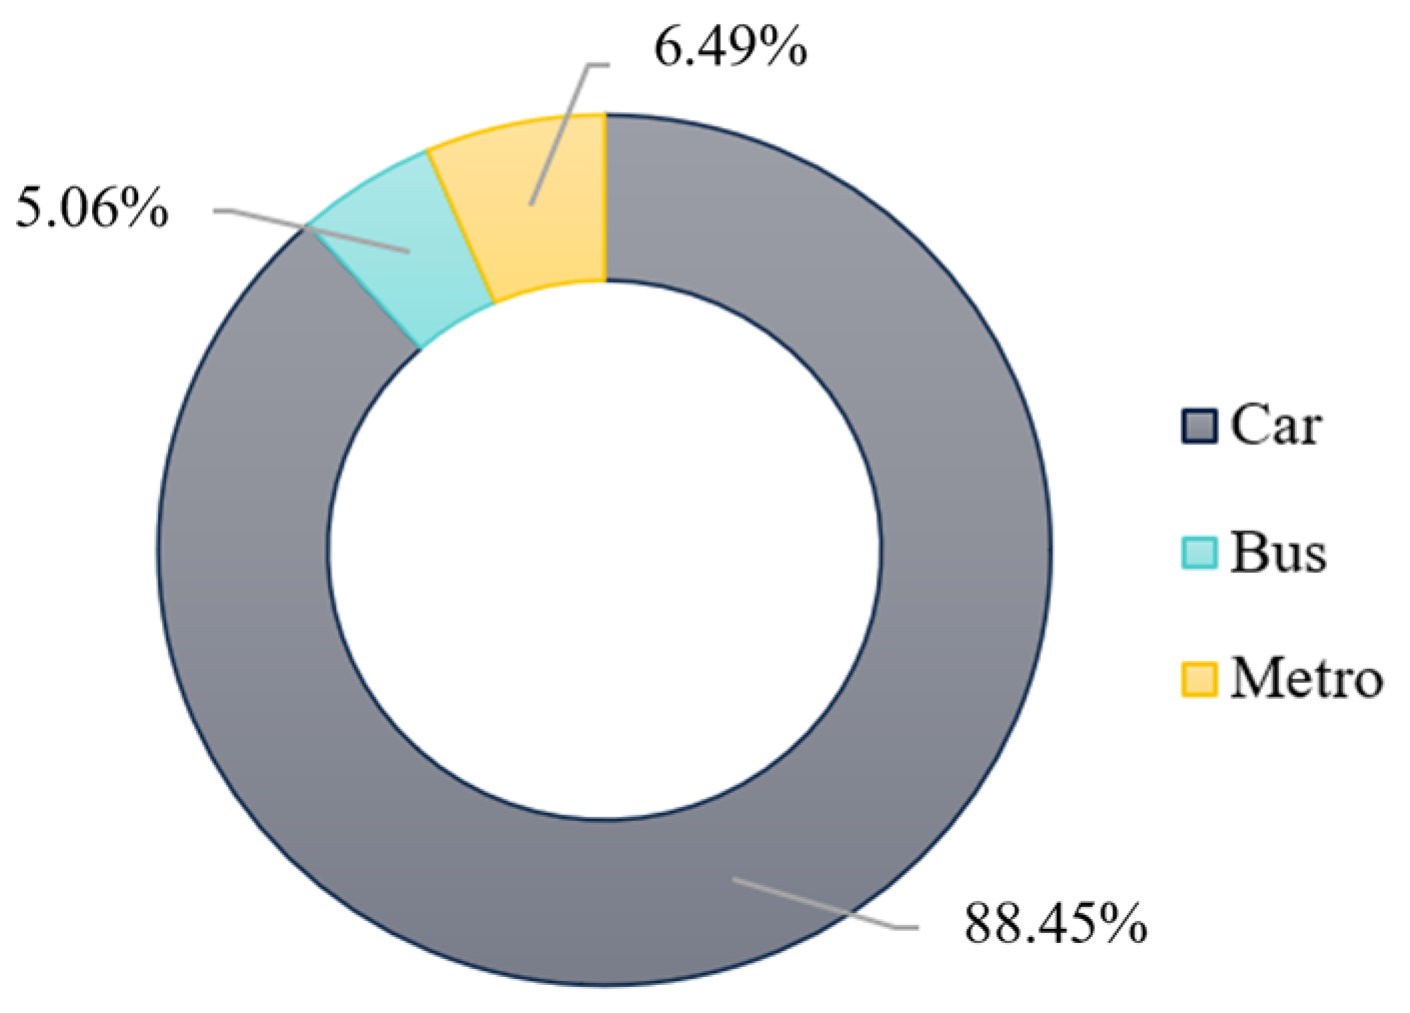
The expansion of urban motorization has fundamentally altered traffic conditions, making recurrent congestion an inherent feature of modern cities. As illustrated in
Figure 1, passenger transport in China is dominated by private vehicles, which contribute nearly 88.44% of total carbon emissions in this sector [
1]. Persistent congestion not only degrades traffic efficiency but also amplifies fuel consumption and pollutant emissions through frequent stopping, idling, and speed fluctuations. Under such circumstances, establishing environmentally sustainable transport systems has become an essential challenge for achieving resilient and low-carbon urban development [
2,
3].
Well-functioning public transit systems are widely recognized as a cornerstone of sustainable urban mobility, as they contribute to emission reduction, support public health, and mitigate congestion in densely populated cities [
4,
5]. Many countries are incorporating improvements to their local public transit systems as part of their sustainable transportation planning and policy-making efforts. Examples include the Metropolitan Transportation Authority (MTA) plan in New York City [
6], Australia’s strategic transport plan in Canberra [
7], and China’s sustainable development plan for transportation [
8]. One shared goal of these strategies is to enhance the efficiency and appeal of public transit systems through innovative solutions while also promoting environmentally friendly operations.
DBLs offer a cost-effective means of providing high-quality transportation services, making them an effective solution for alleviating urban traffic congestion [
9,
10]. However, the success of a bus lane also relies on garnering sufficient public support to regulate its usage and enhance its efficiency [
11]. Research conducted in San Francisco revealed that during peak hours on busy corridors, more than 60% of buses violated the regulations of bus lanes in the peak direction, thereby limiting the effectiveness of these lanes [
12]. During rush hour on Beijing’s highways, cars and buses vie for the right of way, exacerbating traffic congestion [
13].
Early attempts to improve the utilization efficiency of bus-only lanes led to the development of intermittent sharing mechanisms, among which the Intermittent Bus Lane (IBL) concept received considerable attention [
14,
15]. Empirical and simulation-based investigations confirmed that temporarily opening bus lanes to general traffic could increase roadway capacity under light bus demand [
16,
17,
18,
19]. However, deeper analyses revealed that the absence of strict clearance rules before bus arrivals often caused residual vehicles to remain in the lane, creating localized bottlenecks that weakened bus priority and increased operational delays.
To address this issue, the Bus Lane with Intermittent Priority (BLIP) strategy was introduced, enforcing mandatory lane evacuation once a bus is detected [
20]. Although this mechanism effectively protects bus movement, its performance becomes less stable over extended roadway segments. Frequent bus arrivals may trigger repeated capacity interruptions, resulting in inefficient space utilization and reduced throughput for non-bus vehicles [
21]. Seeking a more balanced solution, He et al. [
22] proposed an adaptive pre-signal control framework that redistributes traffic spatially at intersections, thereby alleviating conflicts and reducing average delay.
Parallel to these developments, the pursuit of energy-efficient and low-emission transportation has accelerated the integration of digital technologies into traffic systems. Intelligent Transportation Systems (ITS) have emerged as a comprehensive paradigm that combines sensing, communication, and control to support real-time traffic management. Enabled by advances in wireless communication, modern vehicles can exchange information through Dedicated Short-Range Communication (DSRC) and interact directly with roadside infrastructure via vehicle-to-infrastructure (V2I) connectivity [
23,
24].
The availability of such connectivity fundamentally changes how traffic systems operate. Cooperative information exchange enables more responsive signal control, adaptive routing, and coordinated vehicle behavior, which collectively enhance network efficiency and safety. Prior studies have demonstrated these benefits across diverse applications, including eco-speed optimization under uncertain signal timing [
25], VANET-assisted intersection efficiency improvement [
26], cyber–physical signal control architectures [
27], and energy–emission modeling under signal priority schemes [
28]. Data-driven approaches for maneuver prediction [
29], intelligent vehicle-based traffic assignment [
30], eco-driving-oriented dynamic bus lane control [
31], and networked intermittent bus lane strategies exploiting cooperative vehicle behavior [
32] further highlight the versatility of connected transportation technologies.
Beyond operational improvements, ITS plays a critical role in advancing transport energy sustainability [
33]. By moderating speed fluctuations, reducing unnecessary stopping and idling, and providing drivers and controllers with real-time energy-related information, intelligent traffic systems offer an effective pathway to lowering fuel consumption and emissions at signalized intersections and along urban corridors [
34,
35].
To clarify the position of our work within the current state of the art and highlight its originality, a comparative analysis is presented in
Table 1. First, regarding the control logic, existing studies predominantly rely on heuristic schemes or deterministic models (e.g., [
14,
20]). These approaches often oversimplify the stochastic nature of traffic flow, assuming fixed capacities or neglecting the complex probabilistic impact of lane-changing maneuvers on queue formation. Second, regarding the optimization objective, the primary focus has historically been on capacity maximization or delay reduction. The explicit relationship between dynamic lane configuration and vehicle energy consumption remains largely unexplored. As shown in
Table 1, methods like BLAP or Pre-TSP improve throughput but lack a theoretical mechanism to minimize fuel usage endogenously. Consequently, the innovativeness of this study lies in addressing these dual limitations: we propose a stochastic Markovian framework to capture traffic uncertainty accurately and integrate it with a Genetic Algorithm specifically designed to optimize lane volume for energy efficiency, rather than just capacity.
Despite the advancements highlighted in
Table 1, a unified analytical framework that rigorously quantifies the impact of dynamic lane allocation on vehicle energy consumption under stochastic traffic flows remains absent. Consequently, the primary research goal of this study is to bridge this gap by establishing a robust modeling and optimization framework for the IoT-DBL system. The central research hypothesis is that by leveraging real-time IoT data to accurately model stochastic queue dynamics, the residual capacity of bus lanes can be dynamically allocated to social vehicles to significantly reduce stop-and-go fuel consumption without compromising bus priority. We hypothesize that this stochastic approach will outperform traditional deterministic queuing models in terms of energy efficiency under uncertain traffic demands.
The key contributions of this study can be summarized as follows:
- (i)
A stochastic analytical framework grounded in Markovian queuing theory is established to quantitatively characterize the operational performance of IoT-DBL at signalized intersections subject to uncertain traffic demand.
- (ii)
The sensitivity of the proposed IoT-DBL system to multiple sources of randomness, including traffic fluctuations and operational states, is systematically examined to reveal their effects on system performance.
- (iii)
An optimization scheme based on a genetic algorithm is designed to endogenously determine the appropriate dynamic lane capacity across varying traffic regimes, thereby enhancing the overall effectiveness of the IoT-DBL strategy.
2. IoT-Enabled Dynamic Bus Lane System (IoT-DBL)
2.1. System Architecture
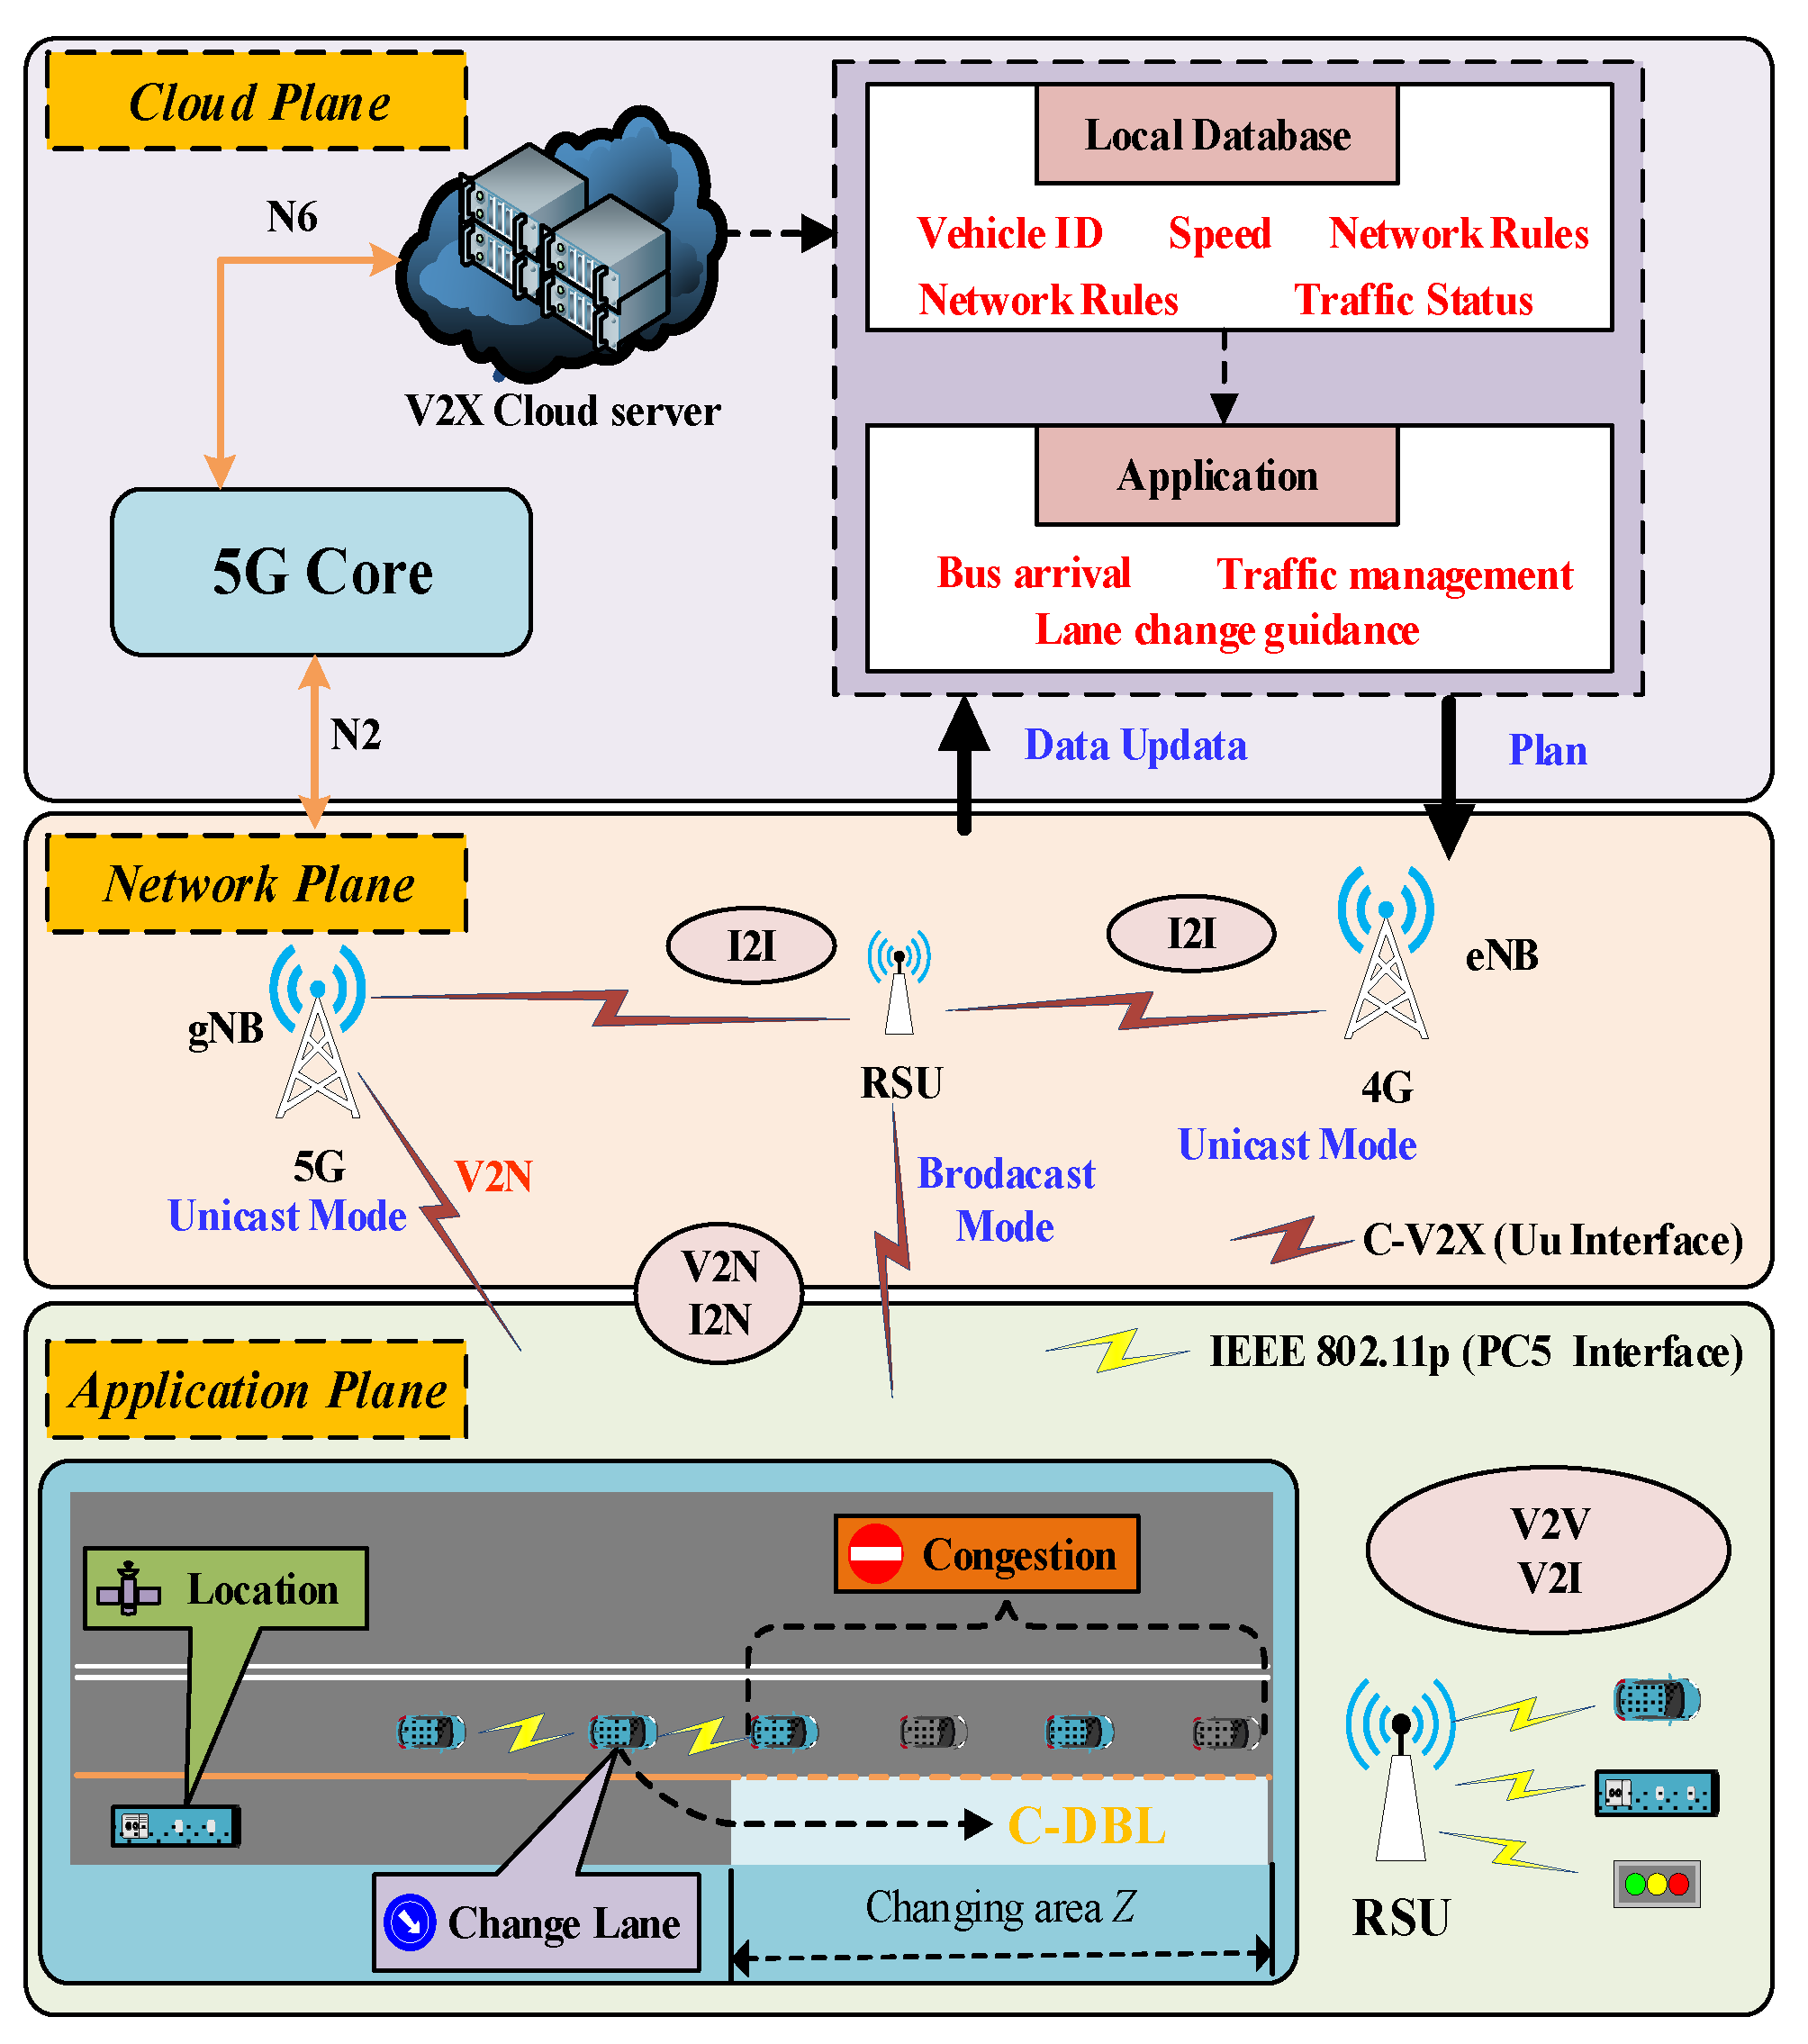
The proposed IoT-DBL system is designed for isolated signalized intersections and adopts a decentralized, edge-oriented architecture, as illustrated in
Figure 2. The system integrates traffic sensing, wireless communication, and real-time control to support dynamic lane allocation while preserving bus priority.
The system architecture, as depicted in
Figure 2, is composed of three hierarchically integrated planes: the Perception Plane, the Network Plane, and the Application Plane.
The Perception Plane functions as the sensory layer located at the intersection. It utilizes roadside units (RSUs) equipped with radar and cameras to capture real-time traffic data, including vehicle queue lengths on social lanes and the precise location of approaching buses. Simultaneously, the signal controller provides current signal phase and timing (SPAT) data.
The Network Plane ensures low-latency data transmission using 5G and C-V2X (Cellular Vehicle-to-Everything) technologies. This layer facilitates the bidirectional flow of information between the roadside infrastructure and the edge computing units. Unlike traditional cloud-based systems, raw data is processed locally at the network edge (Mobile Edge Computing) to minimize delays, which is critical for real-time safety applications.
The Application Plane serves as the decision-making core. Based on the aggregated data, the control algorithm determines the status of the dynamic bus lane. If conditions are met, it broadcasts ‘Lane Open’ commands to connected vehicles via the V2I interface, guiding eligible vehicles into the DBL to maximize intersection capacity without impeding bus transit.
To bridge the gap between the physical sensing layer and the abstract queuing model, a parameter extraction mechanism is implemented within the roadside edge computing units. Specifically, the conversion from raw data to model parameters is executed as follows:
Queue Length : Video sensors or induction loops define a virtual detection zone on both the social lane and the DBL. The system calculates the queue lengths ( and ) at the beginning of each time slot by aggregating the net difference between vehicles entering the detection zone and those discharging past the stop line.
Signal State (): The Signal Phase and Timing (SPaT) messages are retrieved directly from the intersection controller. These messages are parsed to map the current real-time to the discrete slot index within the signal cycle , defining the service availability (Green/Red status) for the queuing model.
Arrival Rate (): Historical and real-time vehicle counting data are processed using a moving average window to estimate the current arrival intensity. This derived serves as the input parameter for the Poisson arrival process assumed in the Markov chain.
Bus Presence: On-board units (OBUs) broadcast Basic Safety Messages (BSMs) containing position and speed. The roadside unit processes these BSMs to calculate the Estimated Time of Arrival (ETA). If the ETA falls within the current cycle, the system triggers the bus priority logic, overriding the social vehicle assignment.
2.2. Operational Mechanism and Activation Logic
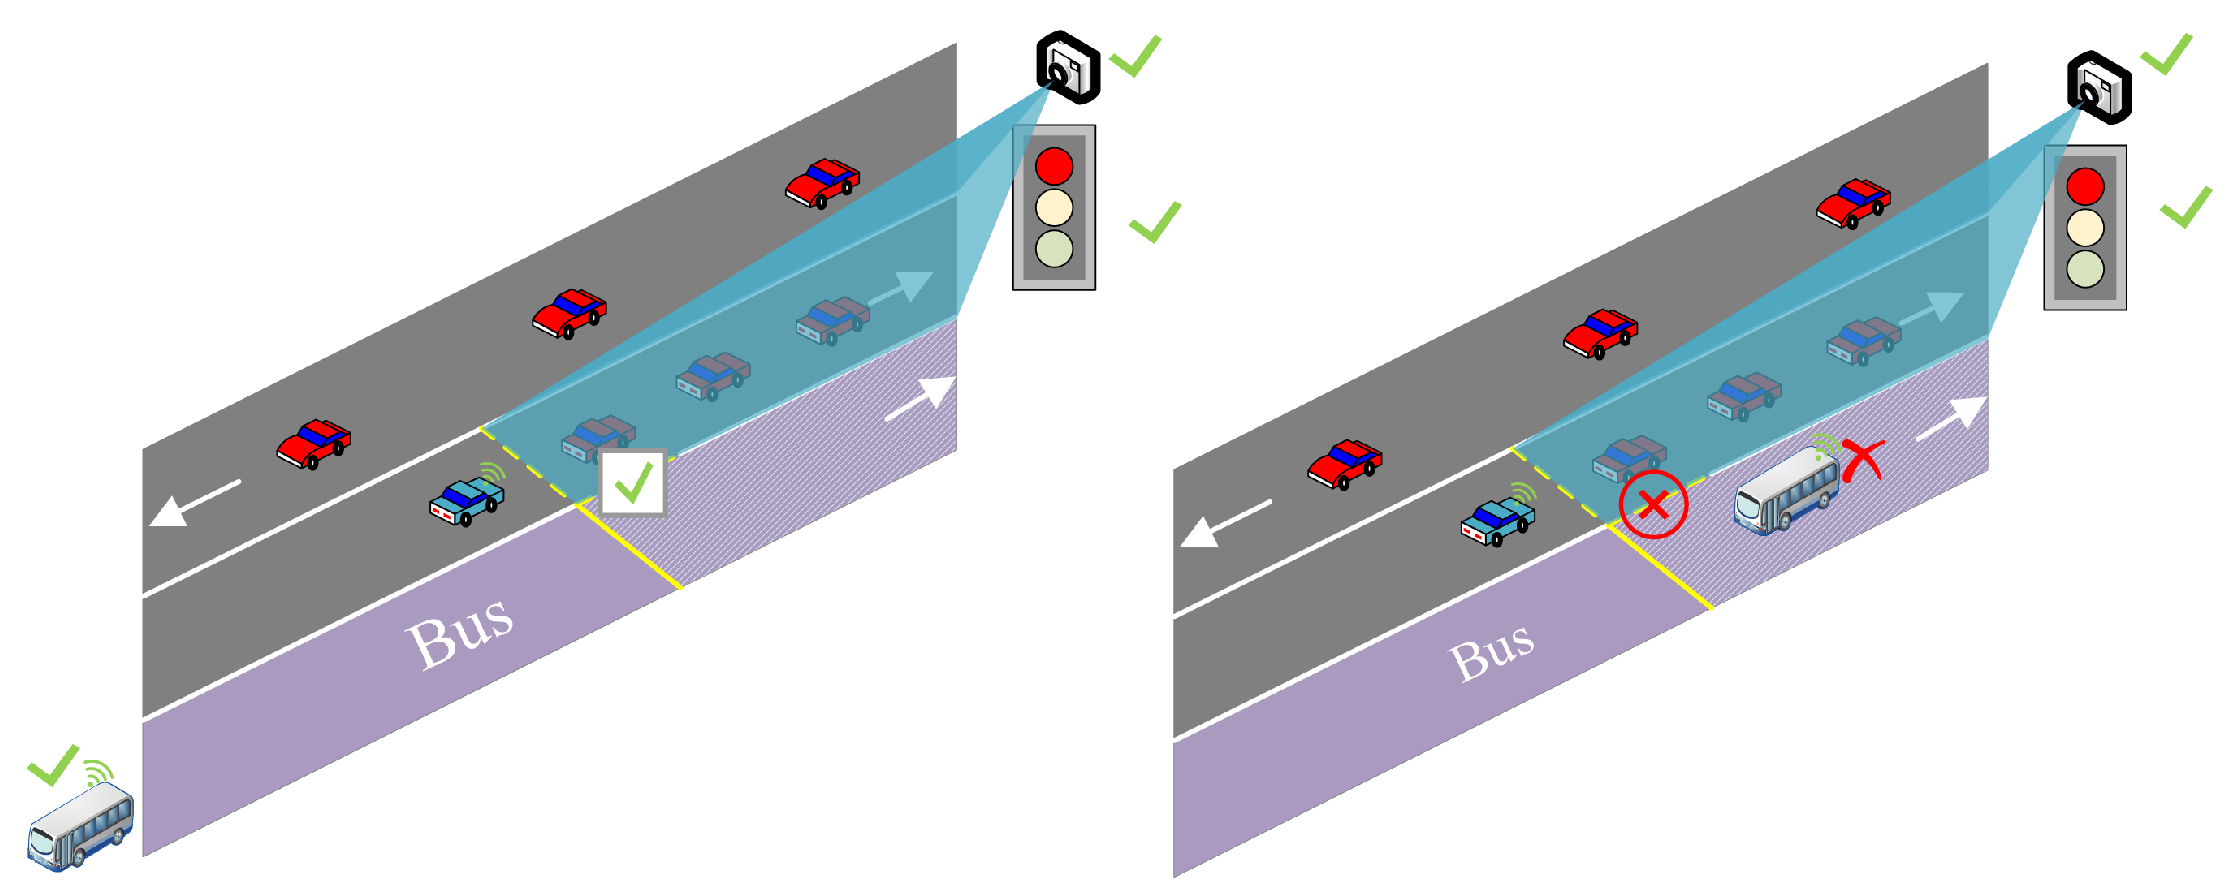
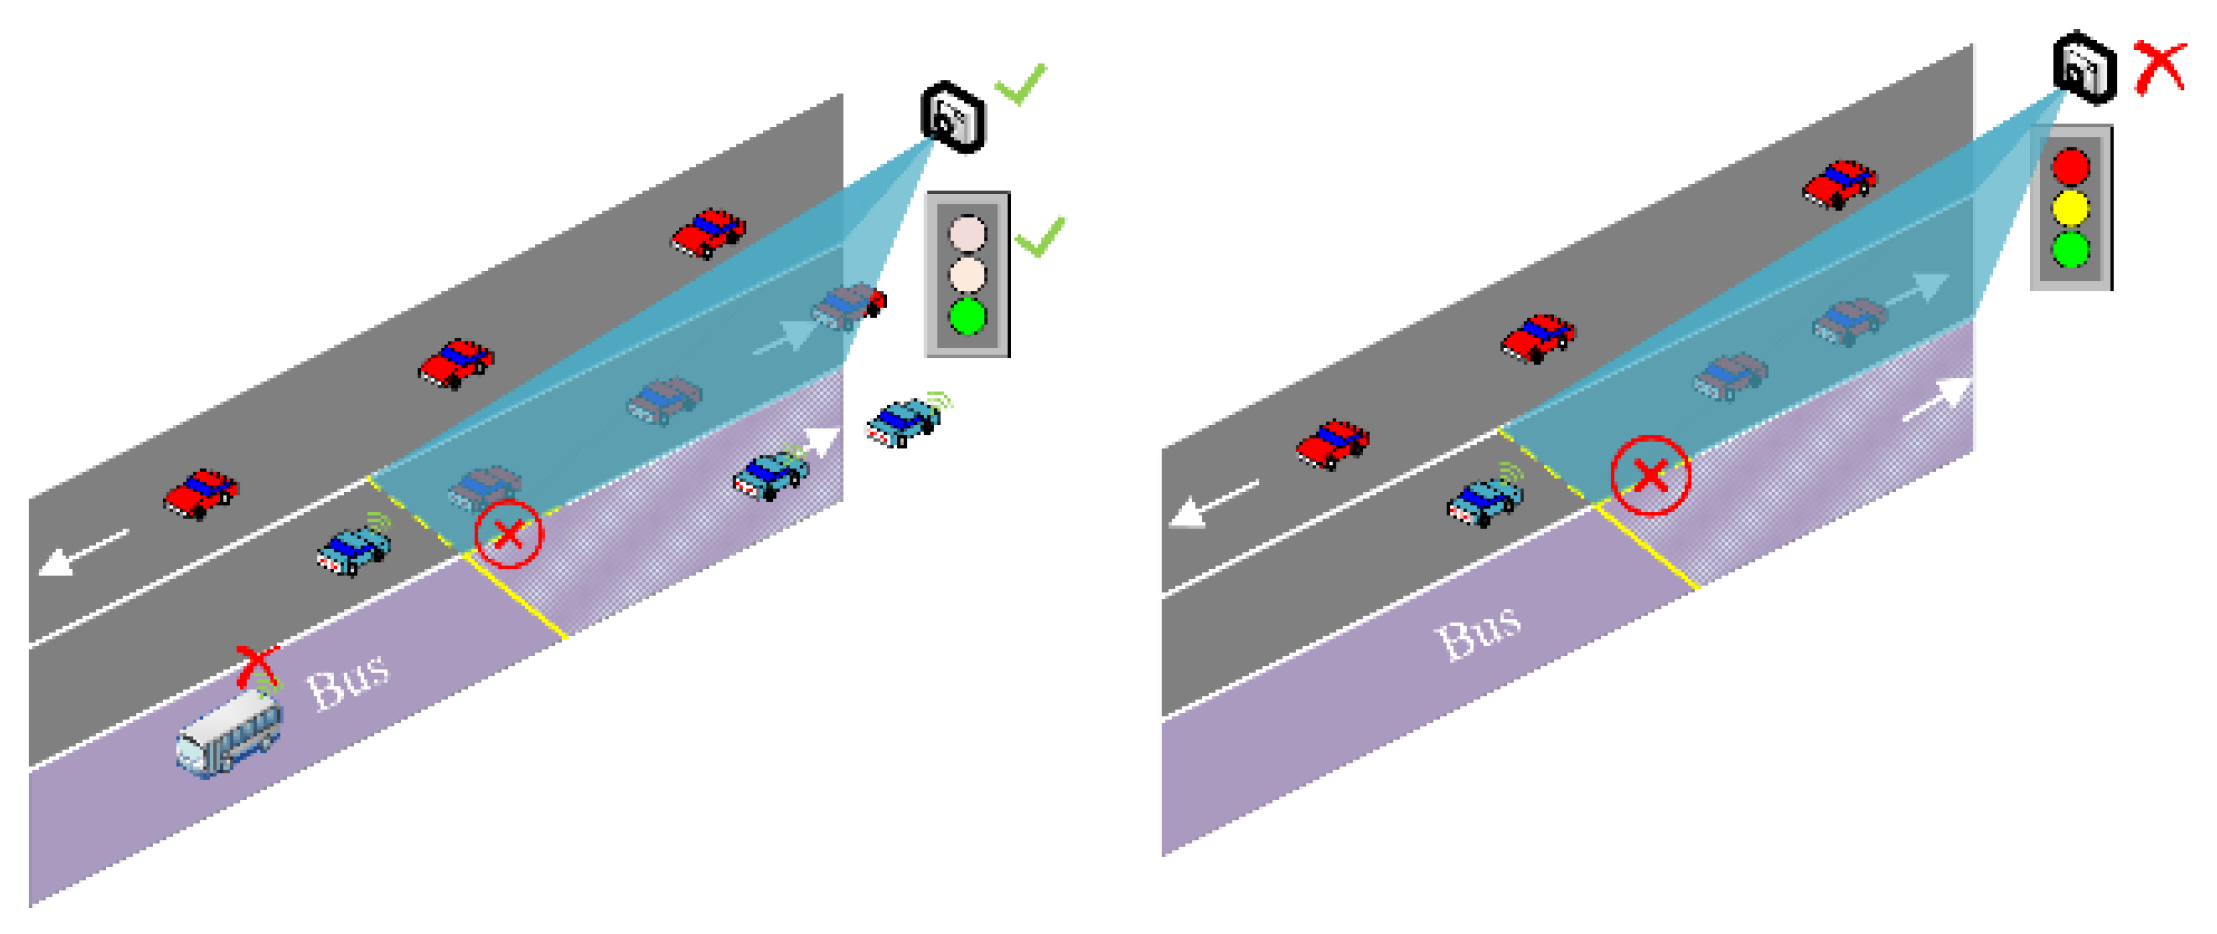
The operational principle of the IoT-DBL system is illustrated in
Figure 3 and
Figure 4. Under congested conditions, when no bus is approaching the intersection and the queue length of social vehicles exceeds a predefined threshold, the bus lane is temporarily opened to selected social vehicles. This shared-use mode increases effective capacity near the stop line and helps dissipate excessive queues. Once a bus is detected within the upstream control range, the system immediately switches the bus lane back to exclusive operation. Social vehicles are no longer allowed to enter the IoT-DBL, and vehicles already using the lane must clear it before the bus arrives, thereby guaranteeing uninterrupted bus movement. Lane access decisions are coordinated with signal phases to ensure smooth and conflict-free transitions.
As shown in
Figure 4, the IoT-DBL remains inactive under two circumstances. First, when traffic demand on the social lane is low and queues remain below the activation threshold, conventional signal control is sufficient and dynamic lane sharing is unnecessary. Second, when the IoT-DBL reaches its capacity limit, additional vehicles are prohibited from entering to prevent internal congestion and maintain operational stability. Through these activation and deactivation rules, the IoT-DBL system ensures that dynamic lane sharing is applied only when it can effectively improve intersection performance without compromising bus priority.
3. Traffic Flow Queuing Modeling Based on Markov Chain
This section develops a discrete-time, Markovian queuing model of the controlled intersection under the IoT-DBL paradigm. The model explicitly represents (i) the interaction between the conventional social lane and the IoT-DBL, (ii) signal phasing resolved at the level of equal time slots, and (iii) capacity limits inside the IoT-DBL. We first state the state representation and transition mechanisms, then describe the matrix-analytic solution strategy used to obtain steady-state probabilities, and finally show how common performance indicators are obtained from the steady state. The presentation follows standard matrix-analytic techniques for M/G/1-type Markov chains and is written to be directly usable in numerical implementation.
3.1. Model Formulation
We discretize time into equal slots of length
chosen to be in the order of typical vehicle headway or a representative service interval. A signal cycle comprises a green interval
and a red interval
, with cycle length
. Let
represent the total counts of time slots associated with the green and red phases of a signal cycle. The cycle is discretized using an integer slot index
, with the initial index
corresponding to the onset of the green interval.
At the beginning of each time slot, we observe the queue lengths on the conventional social lane and inside the DBL. Define the embedded discrete-time stochastic process
where
denotes the queue length of social vehicles on the conventional lane at time slot
, and
represents the number of social vehicles currently using the dynamic bus lane during slot
, which is constrained by the maximum DBL capacity
, and
indicates the slot position within the signal cycle. We assume arrival events occur at slot boundaries and that vehicle movements (service completions through the stop line and DBL transfers) are synchronized with slot transitions. Under these assumptions
is an embedded Markov chain with state space
Three elementary event types govern transitions in a single slot: (a) exogenous arrivals to the social lane, (b) service completions (vehicles departing the head of the queue when the signal permits), and (c) DBL transfer events (vehicles entering or leaving the DBL subject to capacity and policy rules). The transition probabilities for these events depend on the slot index (through whether the slot is green or red), on the arrival statistics, and on the control/assignment policy that moves vehicles between lanes.
It is convenient to organize the embedded chain by
levels corresponding to the conventional lane queue length
. Grouping states by level yields a block-structured one-step transition matrix of M/G/1 type [
36].
where each block
is itself a matrix whose rows and columns index the DBL occupancy
and the within-cycle slot
. Intuitively,
and
capture transitions that decrease, leave unchanged, or increase the conventional-lane queue by one level in a single time step, while
collect the boundary transitions from level 0. The block structure succinctly captures the coupling between conventional and DBLss while keeping the model amenable to matrix-analytic solution methods.
3.2. Steady-State Solution via Matrix-Analytic Methods
Let
be the vector of steady-state level probabilities, where
is itself a row vector whose components are the probabilities of the states with conventional-lane queue length
(i.e., all combinations of
and
). The steady-state balance equations are
with
the all-ones column vector of appropriate dimension
Owing to the M/G/1-type block structure of the transition matrix
, the stationary distribution across levels can be expressed in a matrix-geometric form after determining the associated rate matrix
(commonly referred to as
in related studies). This matrix is defined as the smallest nonnegative solution to a nonlinear matrix equation of the form
where higher-order terms appear if transitions can cross more than one level in a single slot; in many practical formulations the series truncates and only
are nonzero. Given
, level probabilities for
satisfy the geometric recursion
A standard numerical solution procedure therefore proceeds as follows:
1. Construct the block matrices: Use the arrival distribution, slot-dependent service probabilities (green vs. red), DBL capacity , and the lane-assignment policy to assemble the blocks and
2. Compute the rate matrix : Solve Equation (6) for the minimal nonnegative matrix solution . Iterative schemes (e.g., functional iteration, logarithmic reduction, or cyclic reduction variants adapted to M/G/1 structure) are typically used; truncation of negligible higher-order blocks is applied when appropriate and a numerical tolerance controls convergence.
3. Determine boundary vectors: Use Ramaswami’s [
37] recursion or equivalent boundary reduction to compute
from the boundary blocks
and the matrices
. Substituting Equation (7) into the finite set of boundary balance equations yields a linear system for the unknowns
and
.
4. Normalize. Apply the normalization condition in Equation (5) to scale the computed vectors so that probabilities sum to one.
The existence and uniqueness of a stationary distribution depend on a traffic intensity condition. In operational terms one requires the effective arrival rate to be less than the system’s effective service capacity. Denote by
the arrival rate of social vehicles and by
the expected service demand per arrival (accounting for green-time availability and DBL dynamics). A sufficient and intuitive stability condition is
which, in the matrix framework, is equivalent to the spectral radius of
being strictly less than one so that the geometric series in Equation (7) converges.
4. Performance Evaluation Based on Markovian Queuing Analysis
This section introduces the quantitative metrics adopted to assess the operational performance of the proposed C-DBL control and allocation strategy. Let denote the stationary probability distribution associated with the Markov chain , where each element represents the likelihood that social vehicles are queued on the conventional lane and vehicles occupy the IoT-DBL during slot of the signal cycle.
4.1. Mean Queue Length and Delay
Using the stationary distribution of the Markov chain, the expected number of vehicles present at the intersection can be evaluated by summing over all admissible system states.
Once the mean system occupancy is obtained, the corresponding average delay experienced by social vehicles follows directly from Little’s law.
4.2. Queue Characteristics of the Conventional Social Lane
In addition to system-wide congestion, it is important to isolate the queuing behavior on the conventional social lane, as this lane represents the primary bottleneck when the IoT-DBL is inactive or capacity-limited. The expected queue length on the social lane is computed by marginalizing the stationary probabilities over the DBL occupancy and signal phase states.
4.3. Maximum Queue Length Within a Signal Cycle
Vehicle queues at signalized intersections typically build up during red phases and dissipate during green phases. Consequently, the largest queue is most likely to occur at the transition from red to green. Based on this observation, the maximum number of vehicles present in the system can be evaluated by conditioning the steady-state probabilities on the terminal red-phase states.
4.4. Intersection Traffic Efficiency
Intersection efficiency is introduced to characterize the ability of the signalized intersection to serve arriving vehicles within a signal cycle. This metric is defined as the ratio between the effective number of vehicles discharged during the cycle and the total demand imposed on the intersection over the same period.
The total demand consists of vehicles that arrive during the cycle as well as those remaining from the previous cycle.
By combining throughput and residual queue information derived from the steady-state distribution, the intersection efficiency can be analytically expressed as a function of traffic conditions and IoT-DBL operating rules.
4.5. Fuel Consumption Under IoT-DBL Control
Vehicle energy consumption at signalized intersections is primarily driven by interruptions in traffic flow caused by signal timing and congestion. Recurrent stopping, idling, and speed fluctuations substantially intensify fuel usage, especially under saturated conditions.
To quantify this effect, vehicle fuel consumption is evaluated by distinguishing different motion regimes at the intersection, including acceleration, deceleration, idling, and steady cruising. Following the modeling framework proposed by Wu et al. [
38], the total fuel consumption during one signal cycle can be expressed as
where
denotes the aggregate fuel consumption of all vehicles traversing the intersection and
represents the fuel usage of the
-th vehicle. The parameters
,
,
,
correspond to the mean fuel consumption rates under acceleration, deceleration, idling, and cruising, respectively, while
,
,
,
denote the associated average durations.
A key determinant of these durations is the number of vehicles stops experienced within a signal cycle. Stops arise from two sources: vehicles that encounter residual queues during the green phase and vehicles that arrive during the red phase. In particular, the number of vehicles remaining in the system at the end of the green interval plays a critical role. Let
denote the expected number of stranded vehicles at the termination of the green phase, which is given by
Based on this quantity, the total number of stops under the IoT-DBL control scheme can be further characterized by distinguishing different traffic operating states.
(1) Non-Congested
When the queue length in the social lane is below
, the intersection operates under non-congested conditions. The IoT-DBL remains inactive, and social vehicles travel solely on the DBL. The total number of stops is given by
(2) Congested
When the queue length surpasses the threshold
V the IoT-DBL mechanism is activated, allowing temporary lane reassignment. After buses have passed the intersection, a portion of social vehicles is redirected into the IoT-DBL, which induces additional lane-changing maneuvers and reshapes the downstream queue structure. Under this congested operating regime, the total number of vehicles stops can be expressed as
where the first term reflects repeated stopping caused by excess queues beyond the activation threshold, and the second term captures additional stops associated with residual capacity and signal constraints.
Combining the congested and non-congested components, the total number of stops occurring within a single signal cycle is given by
from which the mean stopping frequency per vehicle can be readily obtained as
Based on the estimated stopping behavior, the overall fuel consumption of vehicles traversing the intersection under IoT-DBL control is formulated as
where
denotes the average duration associated with each acceleration–deceleration event.
5. Model Validation
For IoT-DBL configurations with different lane capacities, the Highway Capacity Manual (HCM) [
39] provides an established analytical approach for estimating vehicle delay. Accordingly, the HCM delay formulation is employed in this study as an external benchmark to assess the validity of the proposed queuing-based delay model for intersections equipped with IoT-DBL.
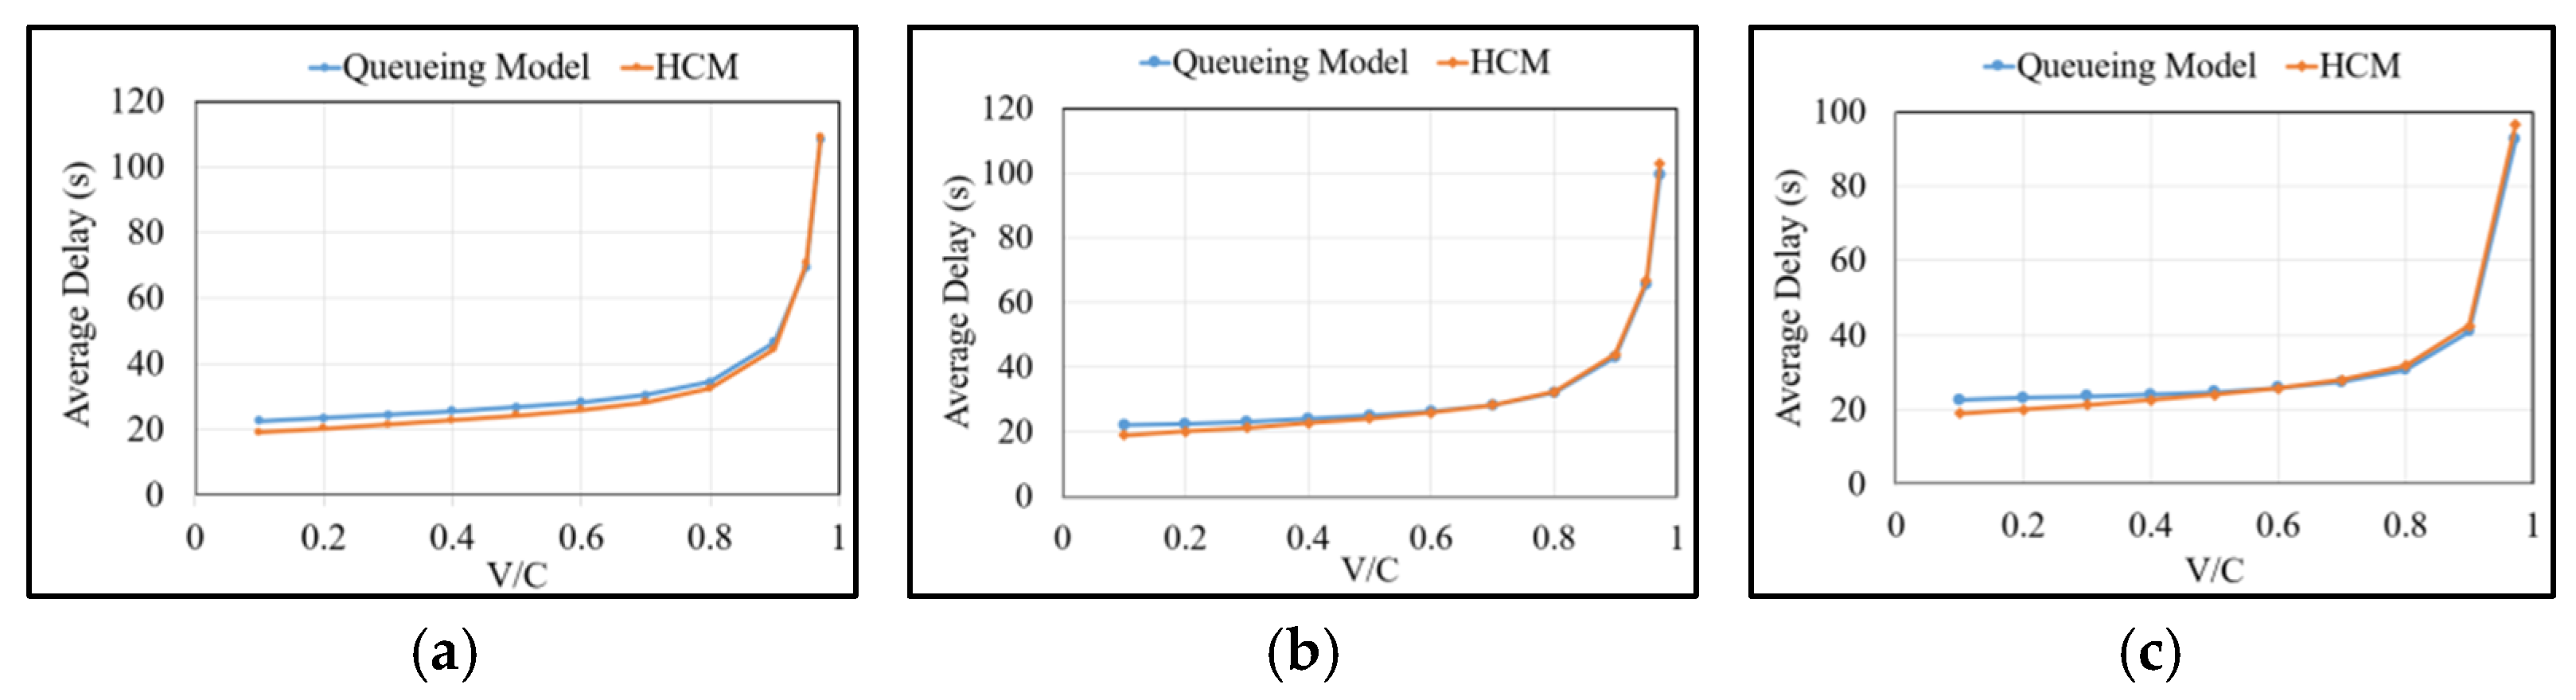
Specifically, IoT-DBL scenarios with different lane storage capacities () are examined, specifically set to 0, 2, and 3 vehicles (pcu). It is important to note that this parameter represents the spatial constraint of the dynamic lane, limiting the maximum number of social vehicles allowed to occupy the DBL simultaneously. In the context of the proposed discrete-time Markov chain, this constraint applies to every time slot , ensuring that the number of vehicles in the DBL () at any given slot satisfies .
Figure 5 presents a comparative analysis of average vehicle delays obtained from the Markovian queuing model and the HCM delay equations under varying traffic saturation levels, assuming a bus arrival rate of 0.9. The results demonstrate a strong agreement between the two approaches across the full range of saturation conditions. Moreover, this consistency persists for different IoT-DBL volumes, indicating that the queuing model reliably reproduces delay trends predicted by the HCM methodology. These findings confirm the accuracy and robustness of the proposed analytical model in capturing intersection delay characteristics under IoT-DBL control.
6. Sensitivity Analysis
6.1. Impact on Vehicle Dynamic Queuing
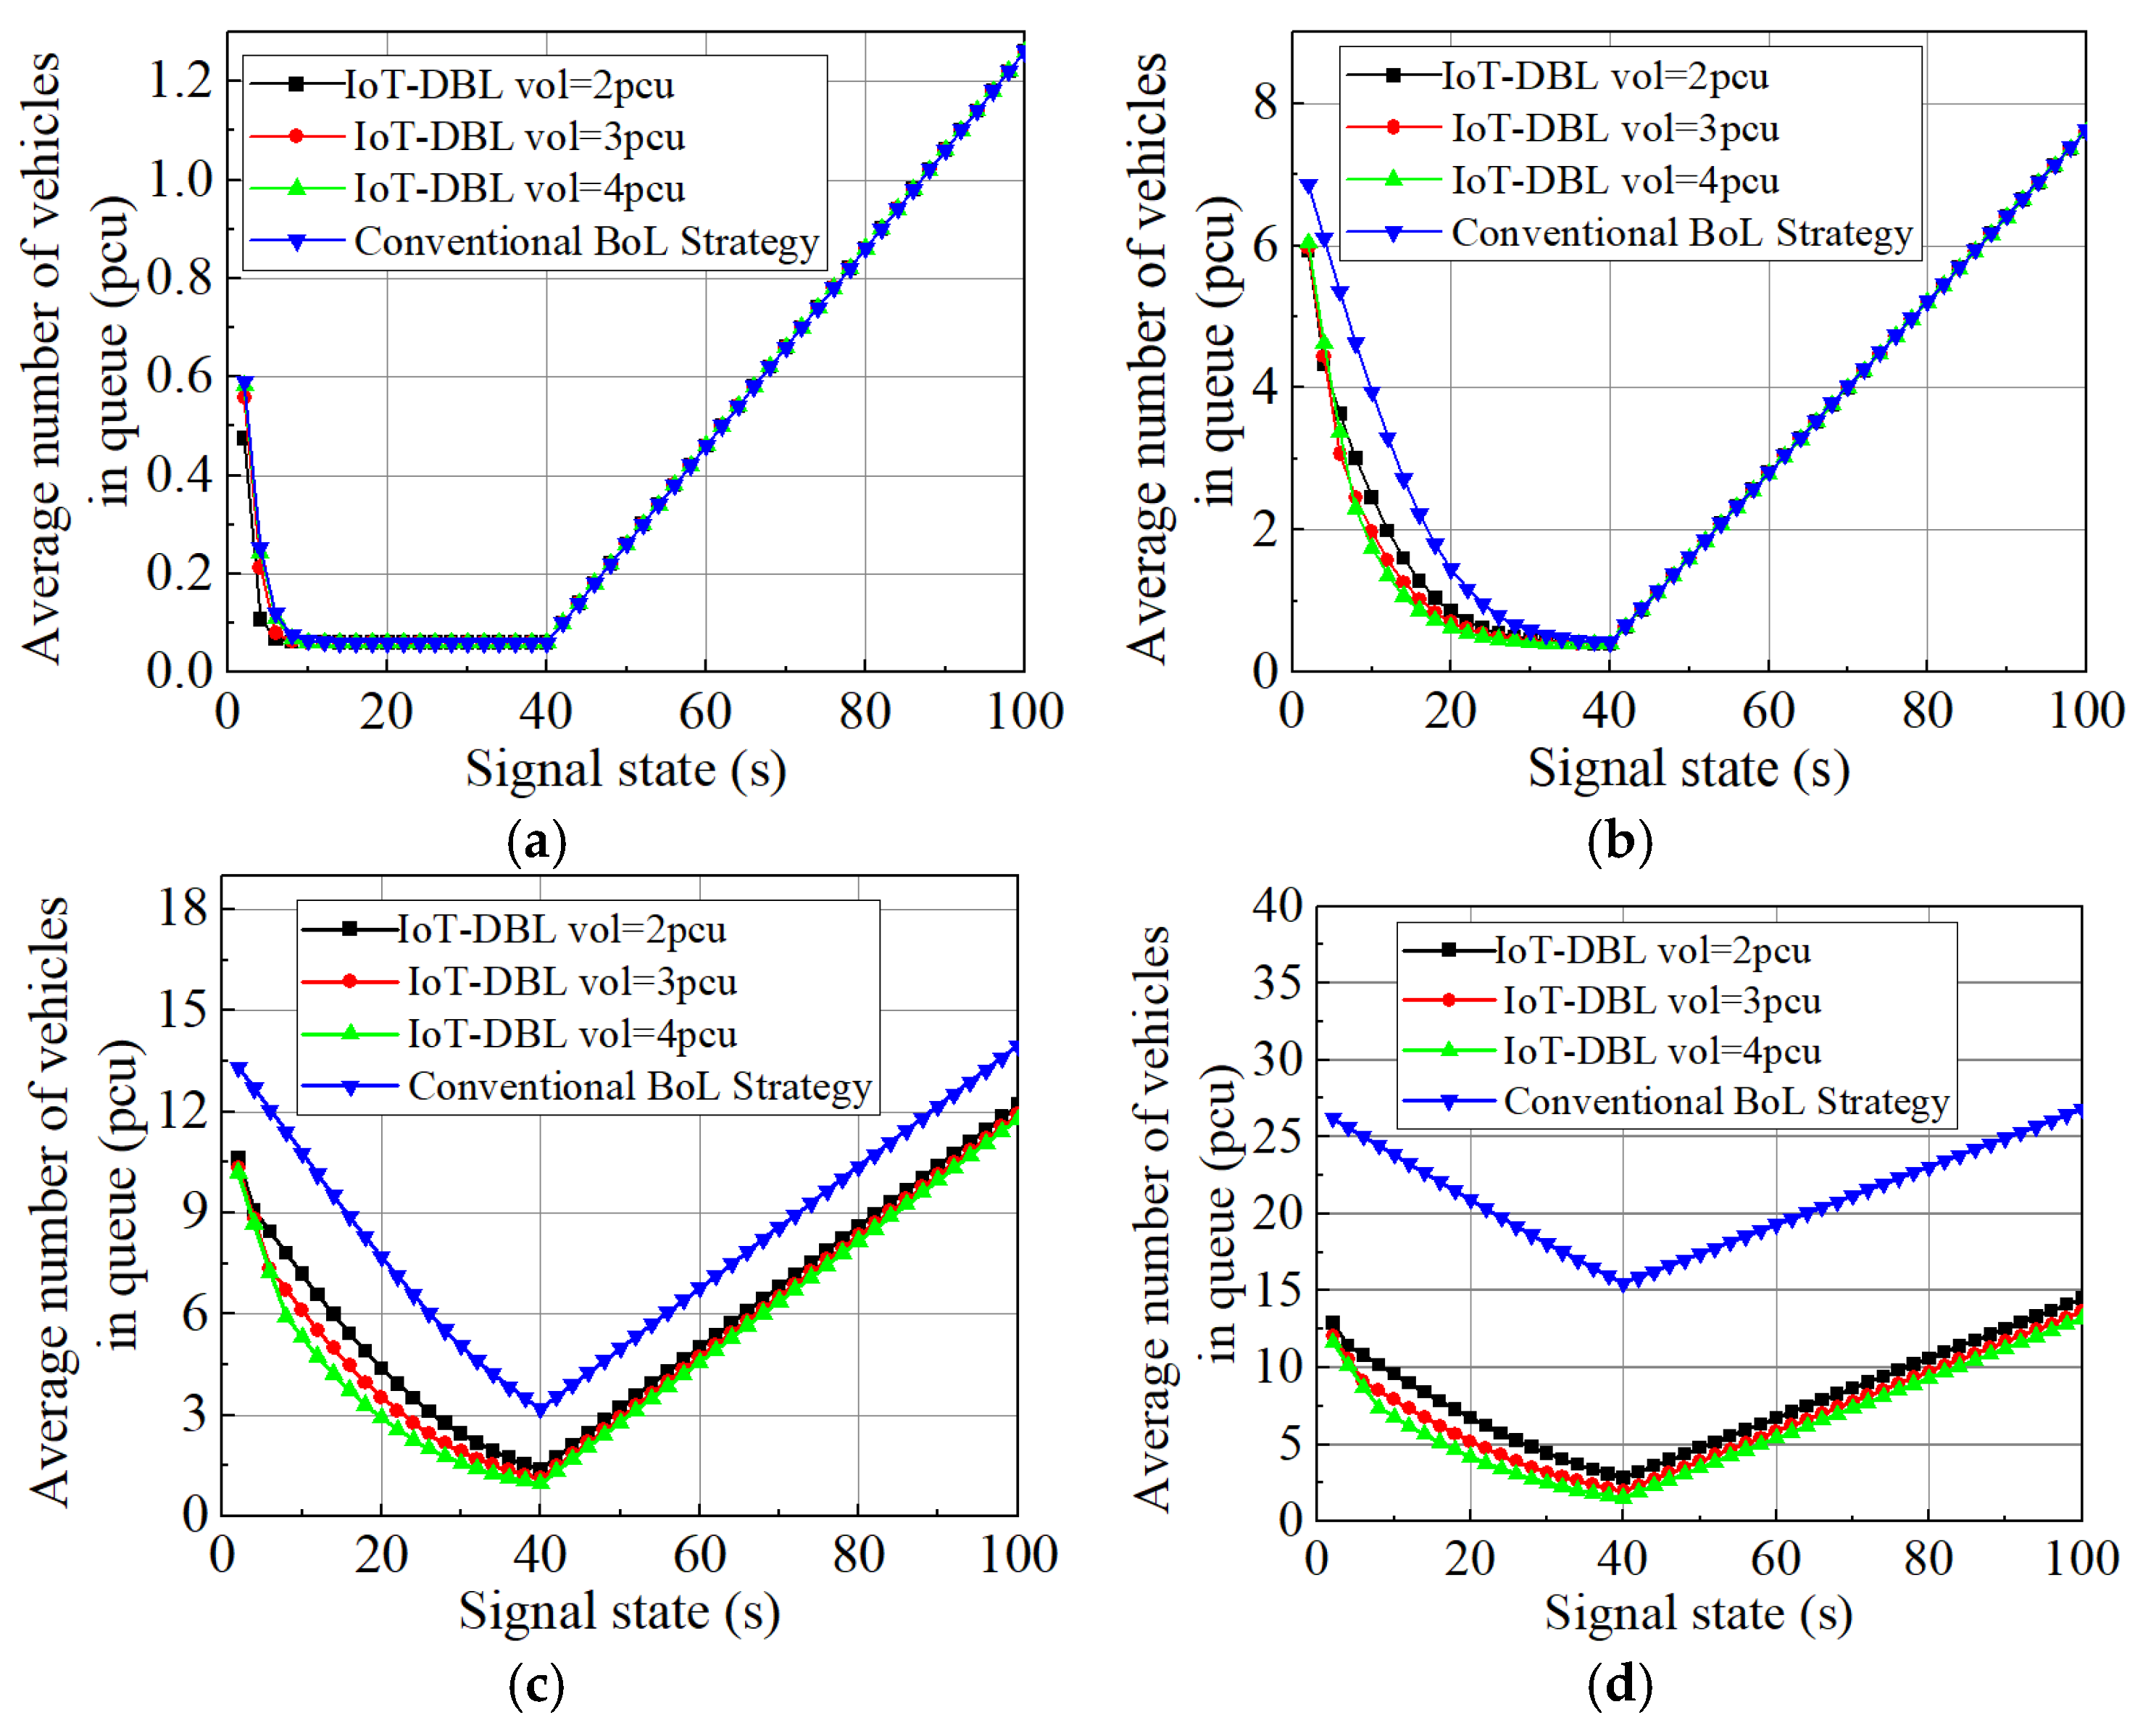
This subsection examines the evolution of social-vehicle queues throughout a signal cycle under the IoT-DBL operating mechanism. A signalized intersection with a cycle length of 100 s is considered, of which 60 s correspond to the red phase.
Figure 6 illustrates the temporal queue profiles obtained under different control strategies across multiple saturation levels.
At a low saturation level of 0.1 (
Figure 6a), the queue trajectories produced by the IoT-DBL and the conventional DBL strategies are nearly indistinguishable, with only marginal improvement observed under IoT-DBL control. As traffic demand intensifies, however, the contrast between the two strategies becomes increasingly pronounced. Specifically, at saturation levels of 0.5, 0.9, and 0.97 (
Figure 6b–d), the IoT-DBL consistently yields shorter queues over the signal cycle, indicating a stronger congestion-mitigation capability under moderate and heavy traffic conditions.
Quantitatively, the reduction in queue length is limited to 2.91% at a saturation of 0.1, whereas it increases dramatically to 71.15% when the saturation reaches 0.97. This pattern is intuitive: under lightly loaded conditions, the existing DBL strategy is sufficient to accommodate traffic demand, rendering dynamic lane reallocation largely unnecessary. In contrast, as the intersection approaches saturation, the conventional DBL becomes increasingly ineffective, while the IoT-DBL mechanism provides substantial relief by reallocating capacity more flexibly.
It should also be noted that the performance gain achieved by the IoT-DBL is closely linked to its allocated volume, which must be adjusted in accordance with prevailing traffic demand to fully exploit its effectiveness.
6.2. Impact on Vehicle Delay
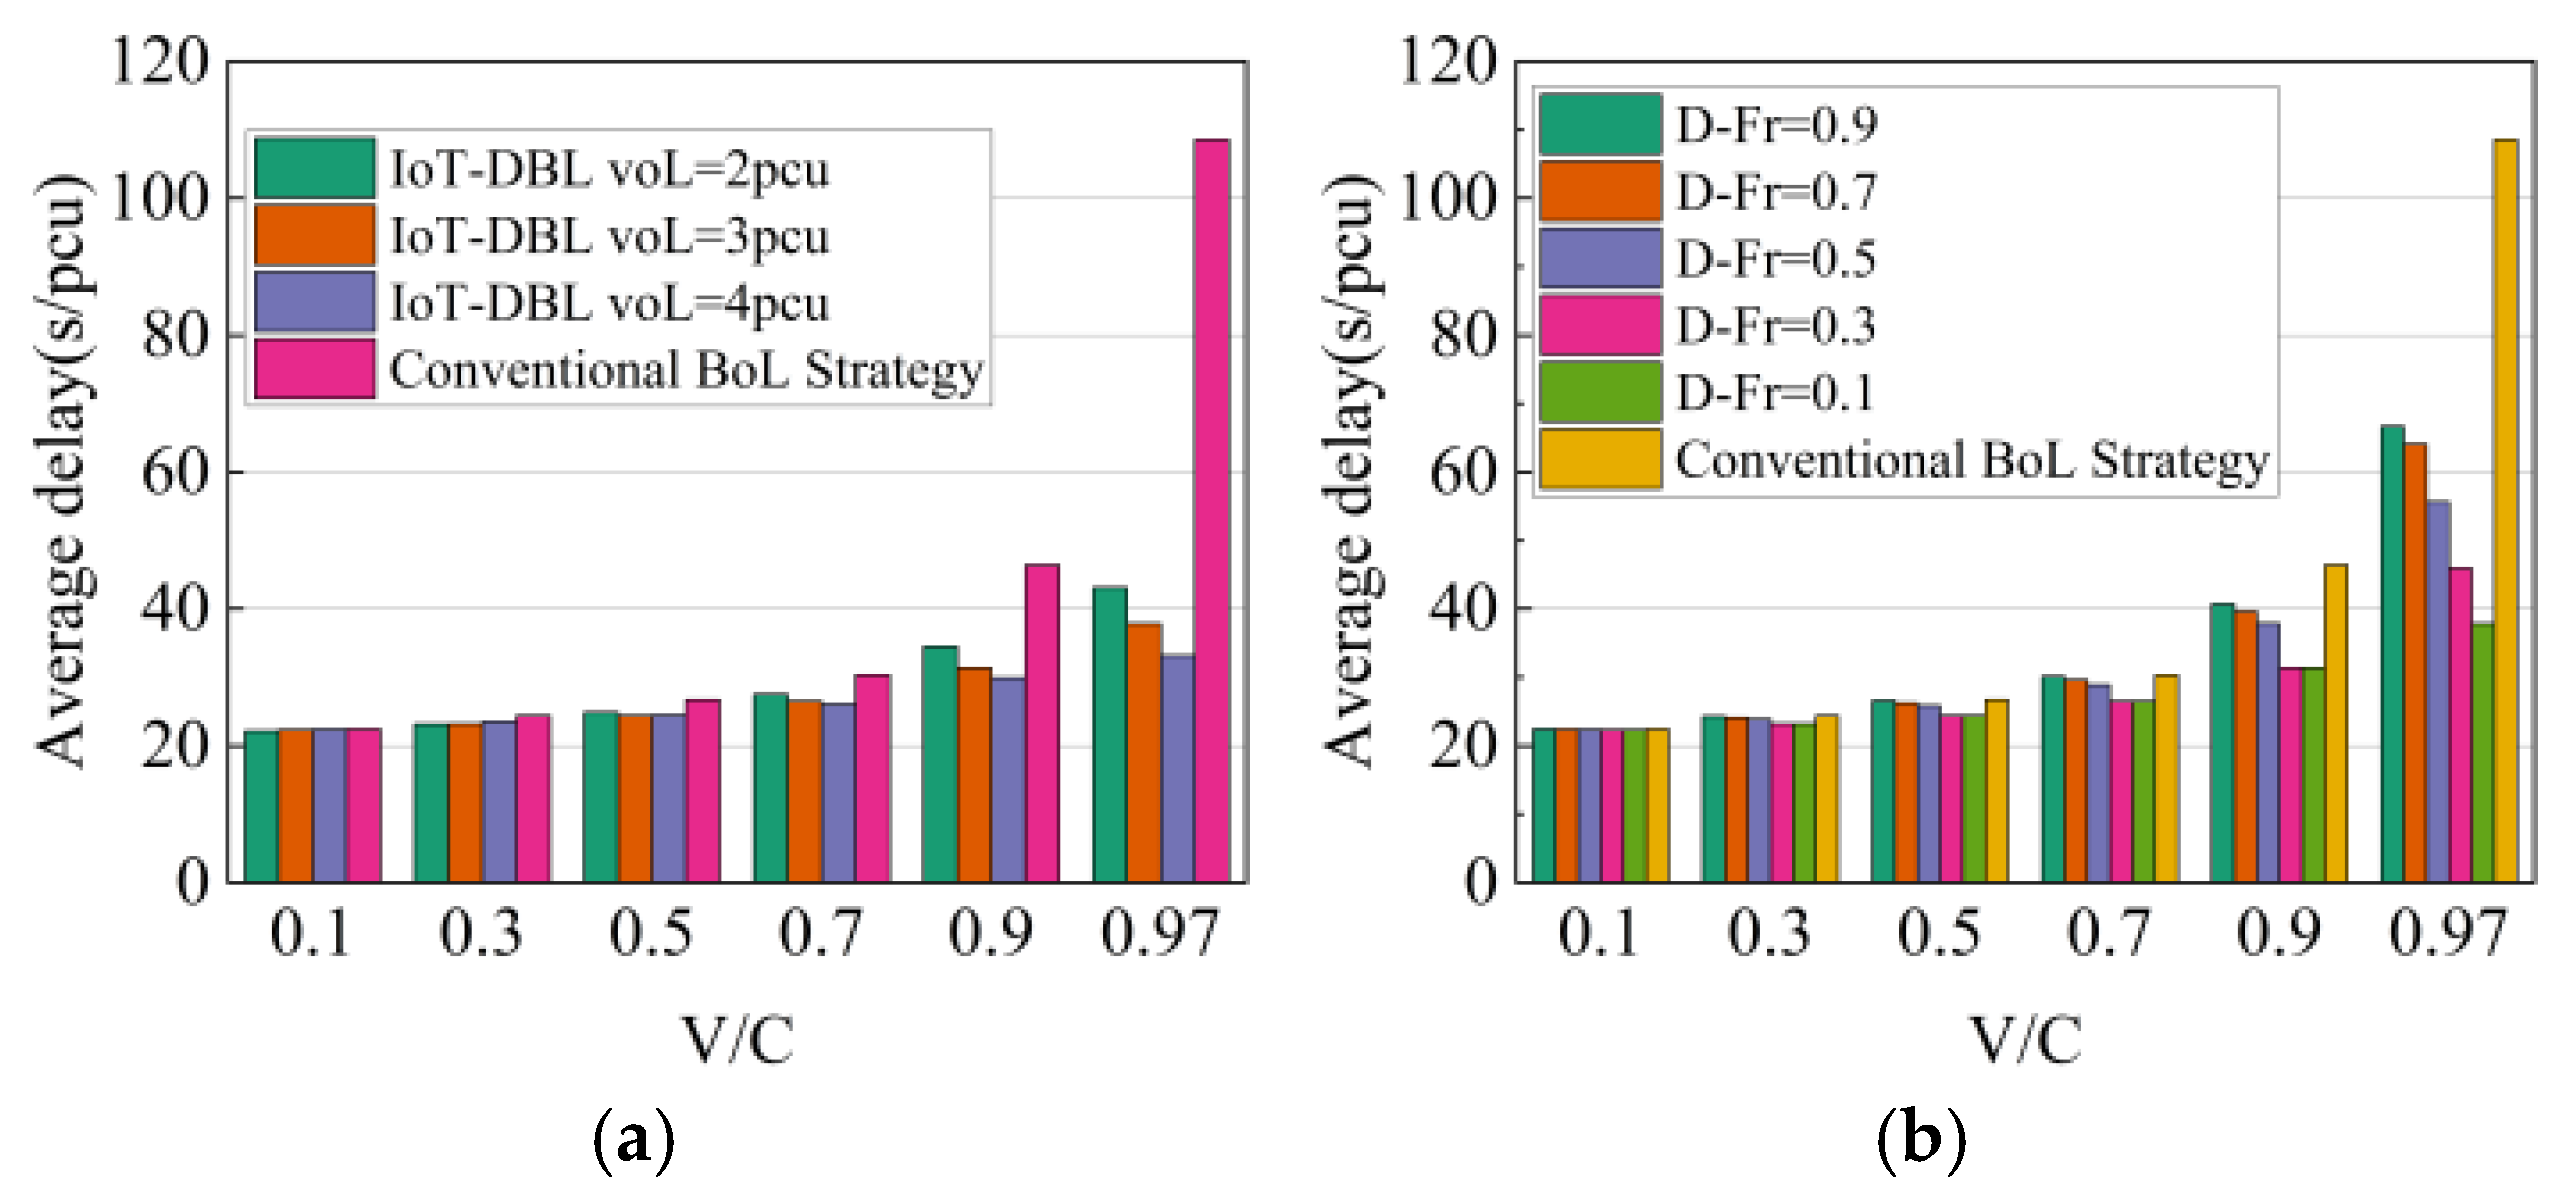
This subsection focuses on quantifying the influence of the IoT-DBL strategy on vehicle delay under different traffic conditions. As illustrated in
Figure 7a, the delay performance of the IoT-DBL and conventional DBL strategies is compared over a wide range of saturation levels. When the saturation ratio remains below 0.5, both strategies exhibit nearly identical delay patterns, indicating that under uncongested conditions the existing signalized intersection operation is sufficient to accommodate traffic demand.
As traffic demand increases beyond this threshold, the distinction between the two strategies becomes increasingly evident. When the saturation approaches 0.97, delays under the conventional DBL strategy rise sharply, reflecting its limited ability to cope with heavy traffic. In contrast, the IoT-DBL maintains vehicle delays within a relatively stable and acceptable range. Quantitatively, the delay reduction achieved by the IoT-DBL is marginal (below 10%) at low saturation, but expands dramatically to 69.48% under near-saturated conditions. These results also reveal a strong dependence on the allocated IoT-DBL volume, underscoring the necessity of selecting an appropriate capacity to fully exploit the benefits of dynamic lane allocation across different saturation regimes.
Figure 7b further examines the role of bus departure frequency. The results indicate that, under high saturation, bus frequency has a pronounced effect on vehicle delay, as frequent bus arrivals restrict the availability of the IoT-DBL in order to preserve bus priority. At identical saturation levels, variations in bus departure frequency led to a maximum difference of 26.59% in average delay. Nevertheless, within the tested range, the IoT-DBL strategy consistently outperforms the conventional DBL, demonstrating robust delay-reduction capability across different bus operation scenarios.
6.3. Impact on Intersection Efficiency
Intersection efficiency reflects the capability of a signalized intersection to serve traffic demand within a single signal cycle.
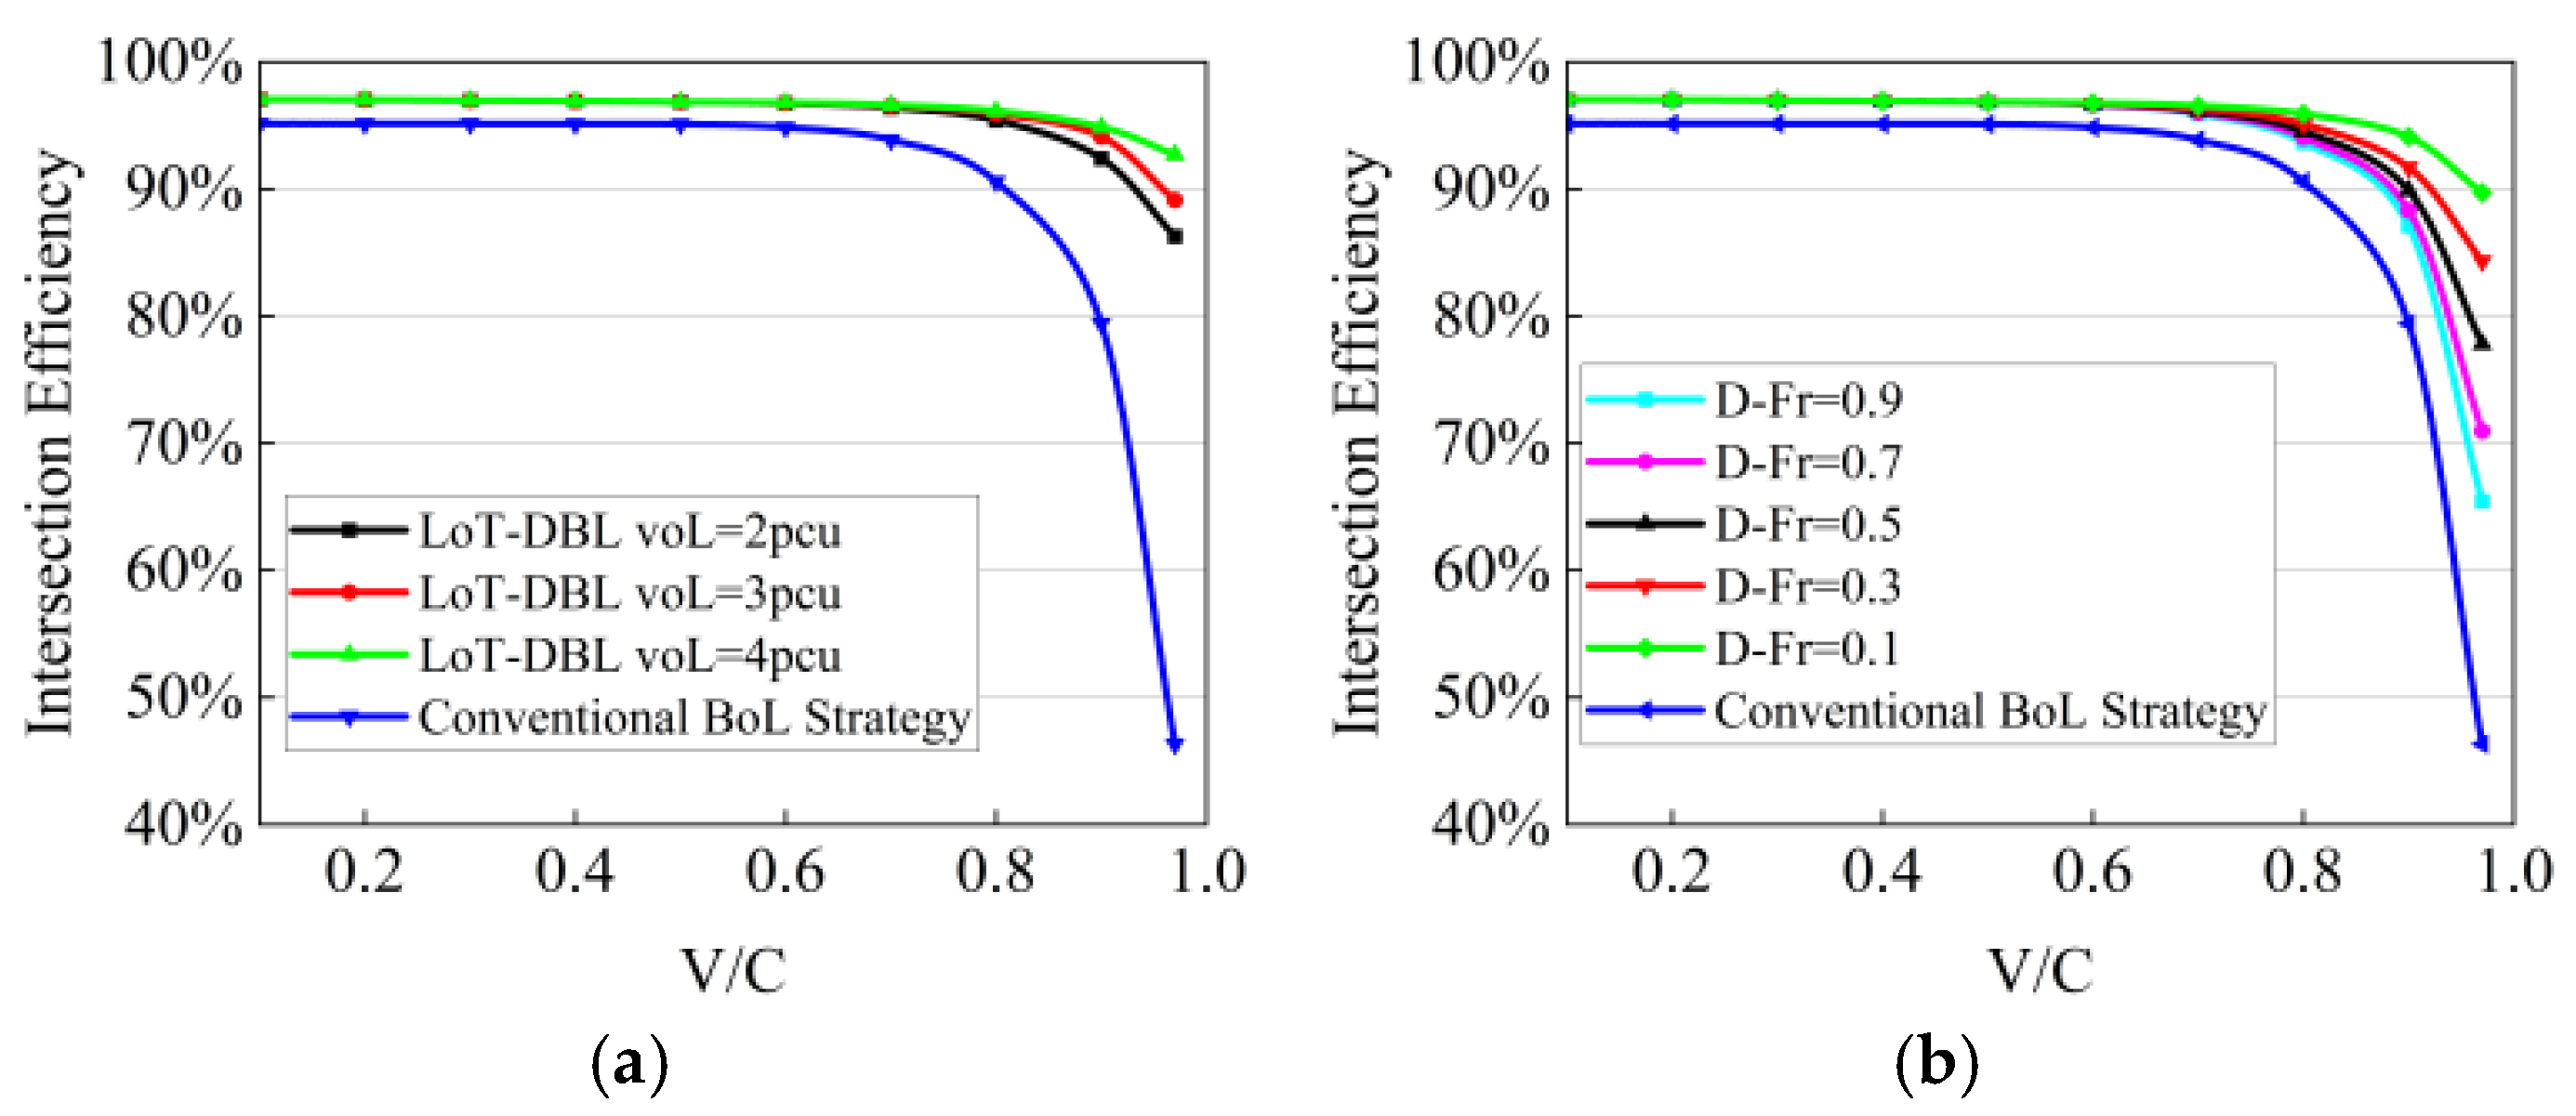
Figure 8 compares the efficiency outcomes of the IoT-DBL strategy under different lane volumes with those obtained from the conventional DBL scheme. When the saturation ratio remains below 0.7, both strategies exhibit similarly high efficiency levels of approximately 95%, indicating that under lightly loaded conditions the existing intersection capacity is sufficient to accommodate traffic demand.
As saturation increases, however, the performance divergence between the two strategies becomes pronounced. Under the conventional DBL scheme, intersection efficiency deteriorates almost linearly with increasing demand and falls below 50% when the saturation reaches 0.97. In contrast, the IoT-DBL strategy sustains a high level of operational efficiency, maintaining values close to 90% even under near-saturated conditions. This highlights the superior ability of IoT-DBL to preserve discharge capacity under heavy traffic.
Additional evidence is provided in
Table 2 and
Table 3, which further quantify the efficiency gains achieved by IoT-DBL. At low saturation levels, the system is rarely activated, and variations in IoT-DBL volume have negligible influence on intersection efficiency. For example, when the saturation is 0.1, the efficiency improvement remains constant at 2.02% across all tested configurations. In contrast, under high saturation conditions (
V/C = 0.97), the improvement becomes highly sensitive to IoT-DBL capacity, ranging from 86.22% to 100.11%, demonstrating that an appropriately chosen dynamic lane volume is critical for maximizing efficiency gains.
Bus departure frequency also plays a non-negligible role. While its impact is minimal at low saturation, significant differences emerge as the system approaches capacity. At a saturation level of 0.97, the enhancement in intersection efficiency varies between 41.22% and 93.62% across different bus frequencies, yielding a spread of 52.4%. This result underscores the importance of jointly considering traffic demand and bus operations when deploying IoT-DBL strategies.
6.4. Impact on Fuel Consumption
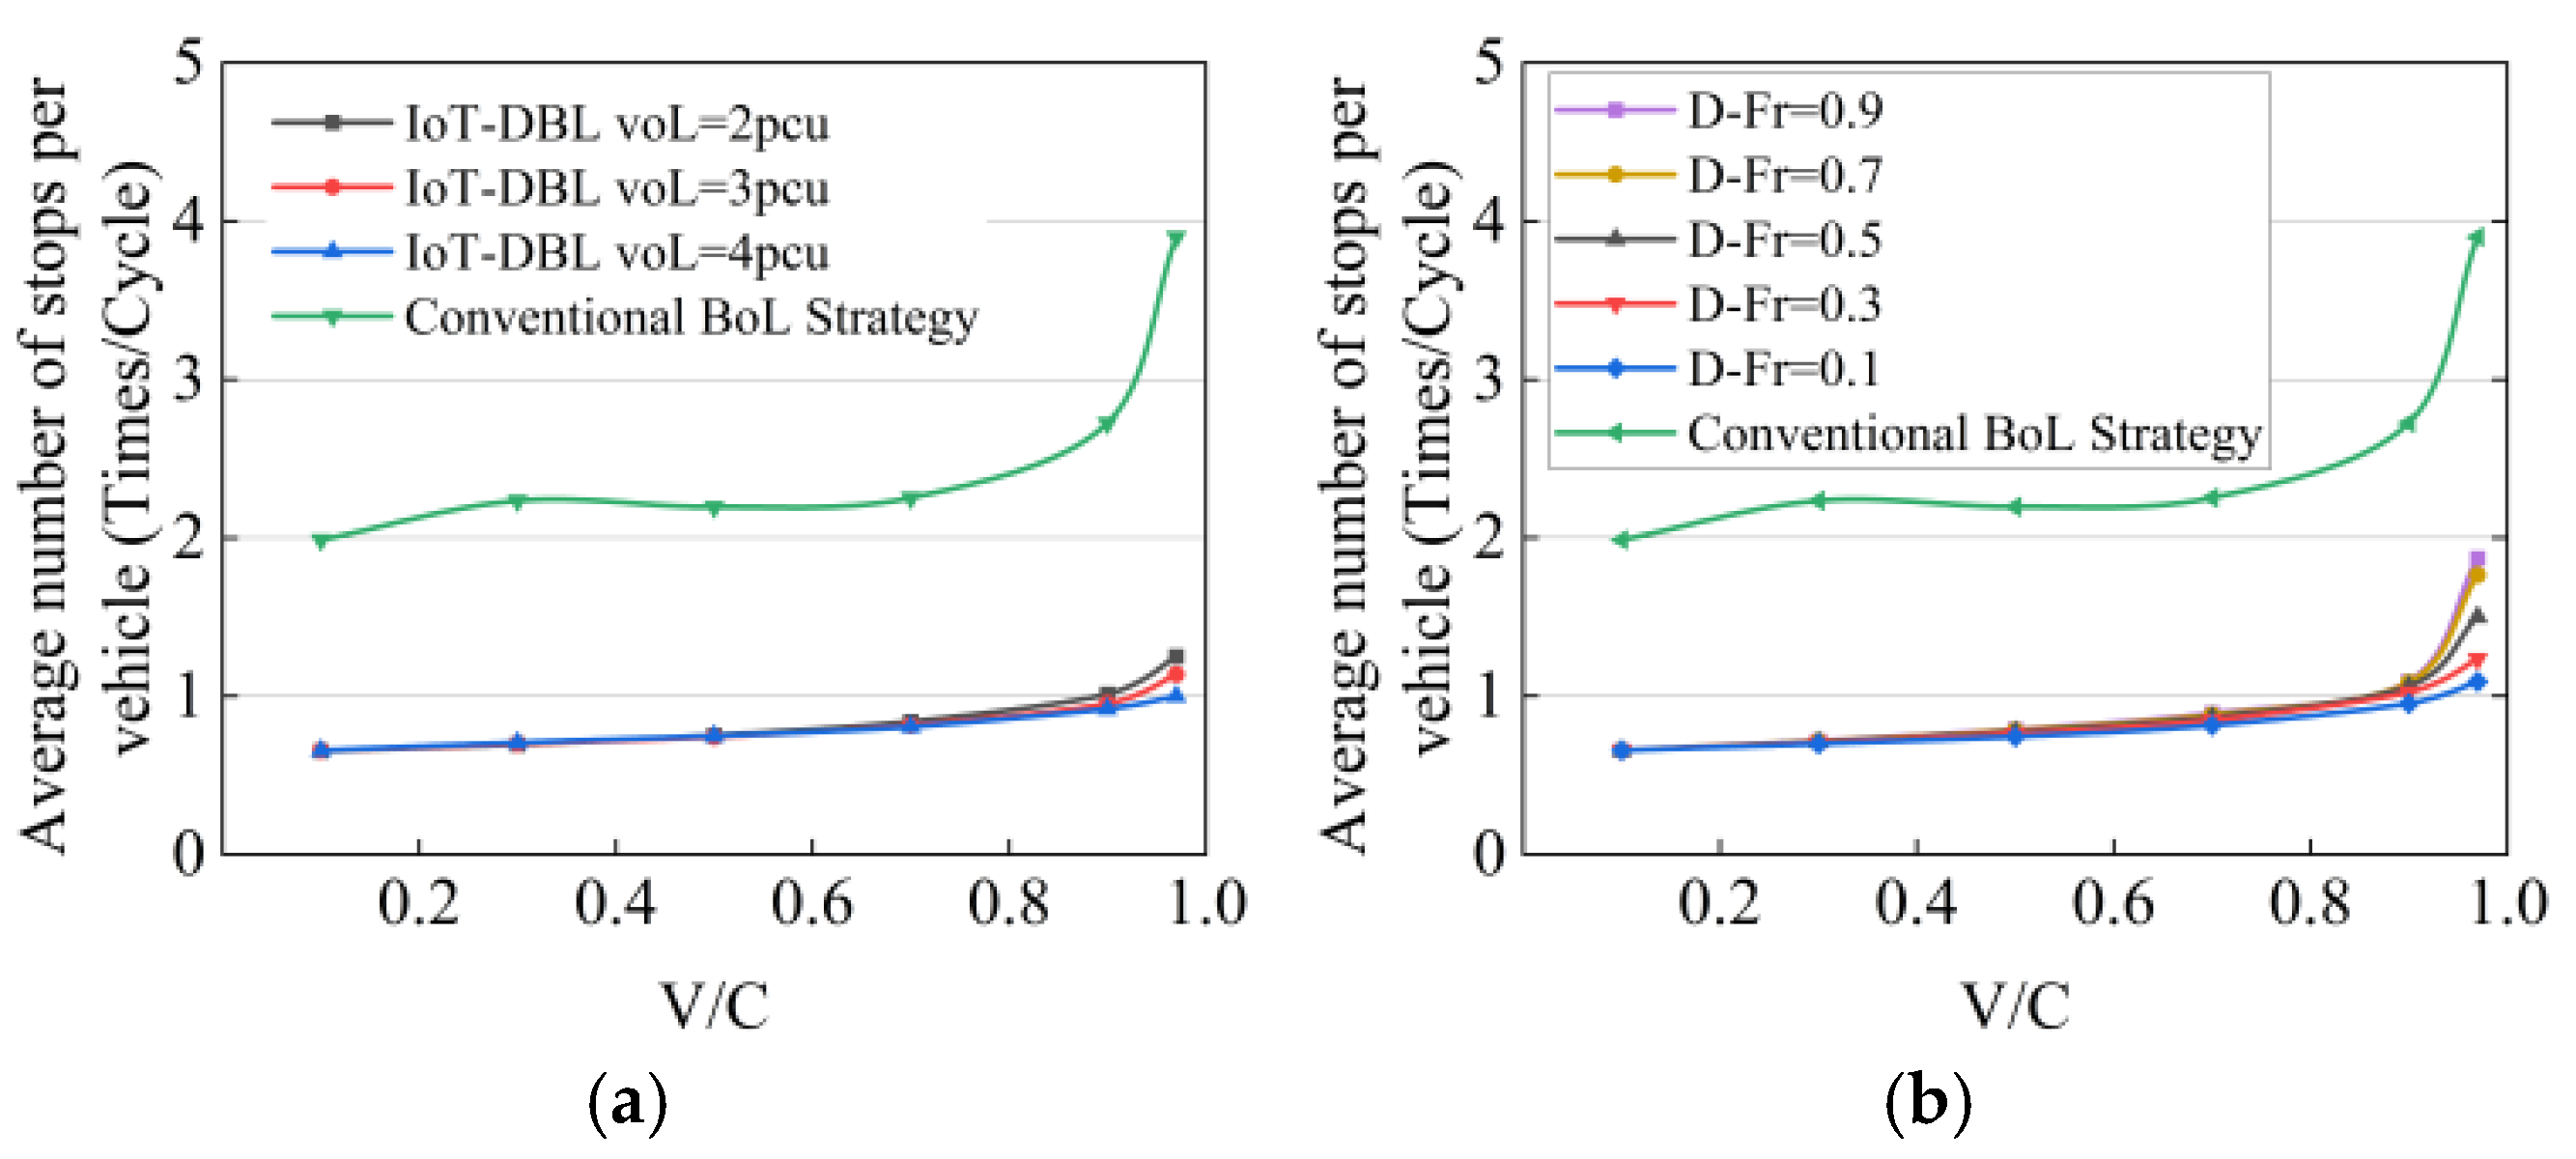
As shown in
Figure 9, the green line represents the vehicle stopping rate under the DBL strategy, while the other lines depict the vehicle stopping rate within the signalized intersection under the IoT-DBL system across different conditions (IoT-DBL volume (
Figure 9a)/bus departure frequency (
Figure 9b)). It is evident that regardless of the conditions, the IoT-DBL system performs well in reducing the stopping rate. For instance, in the current scenario, the stopping rate observed with the DBL strategy indicates that each vehicle stops at least twice on average and up to four times when passing through the signalized intersection, whereas under the IoT-DBL system, each vehicle stops around once, with a maximum of two stops. This clearly demonstrates the strong performance of the IoT-DBL system.
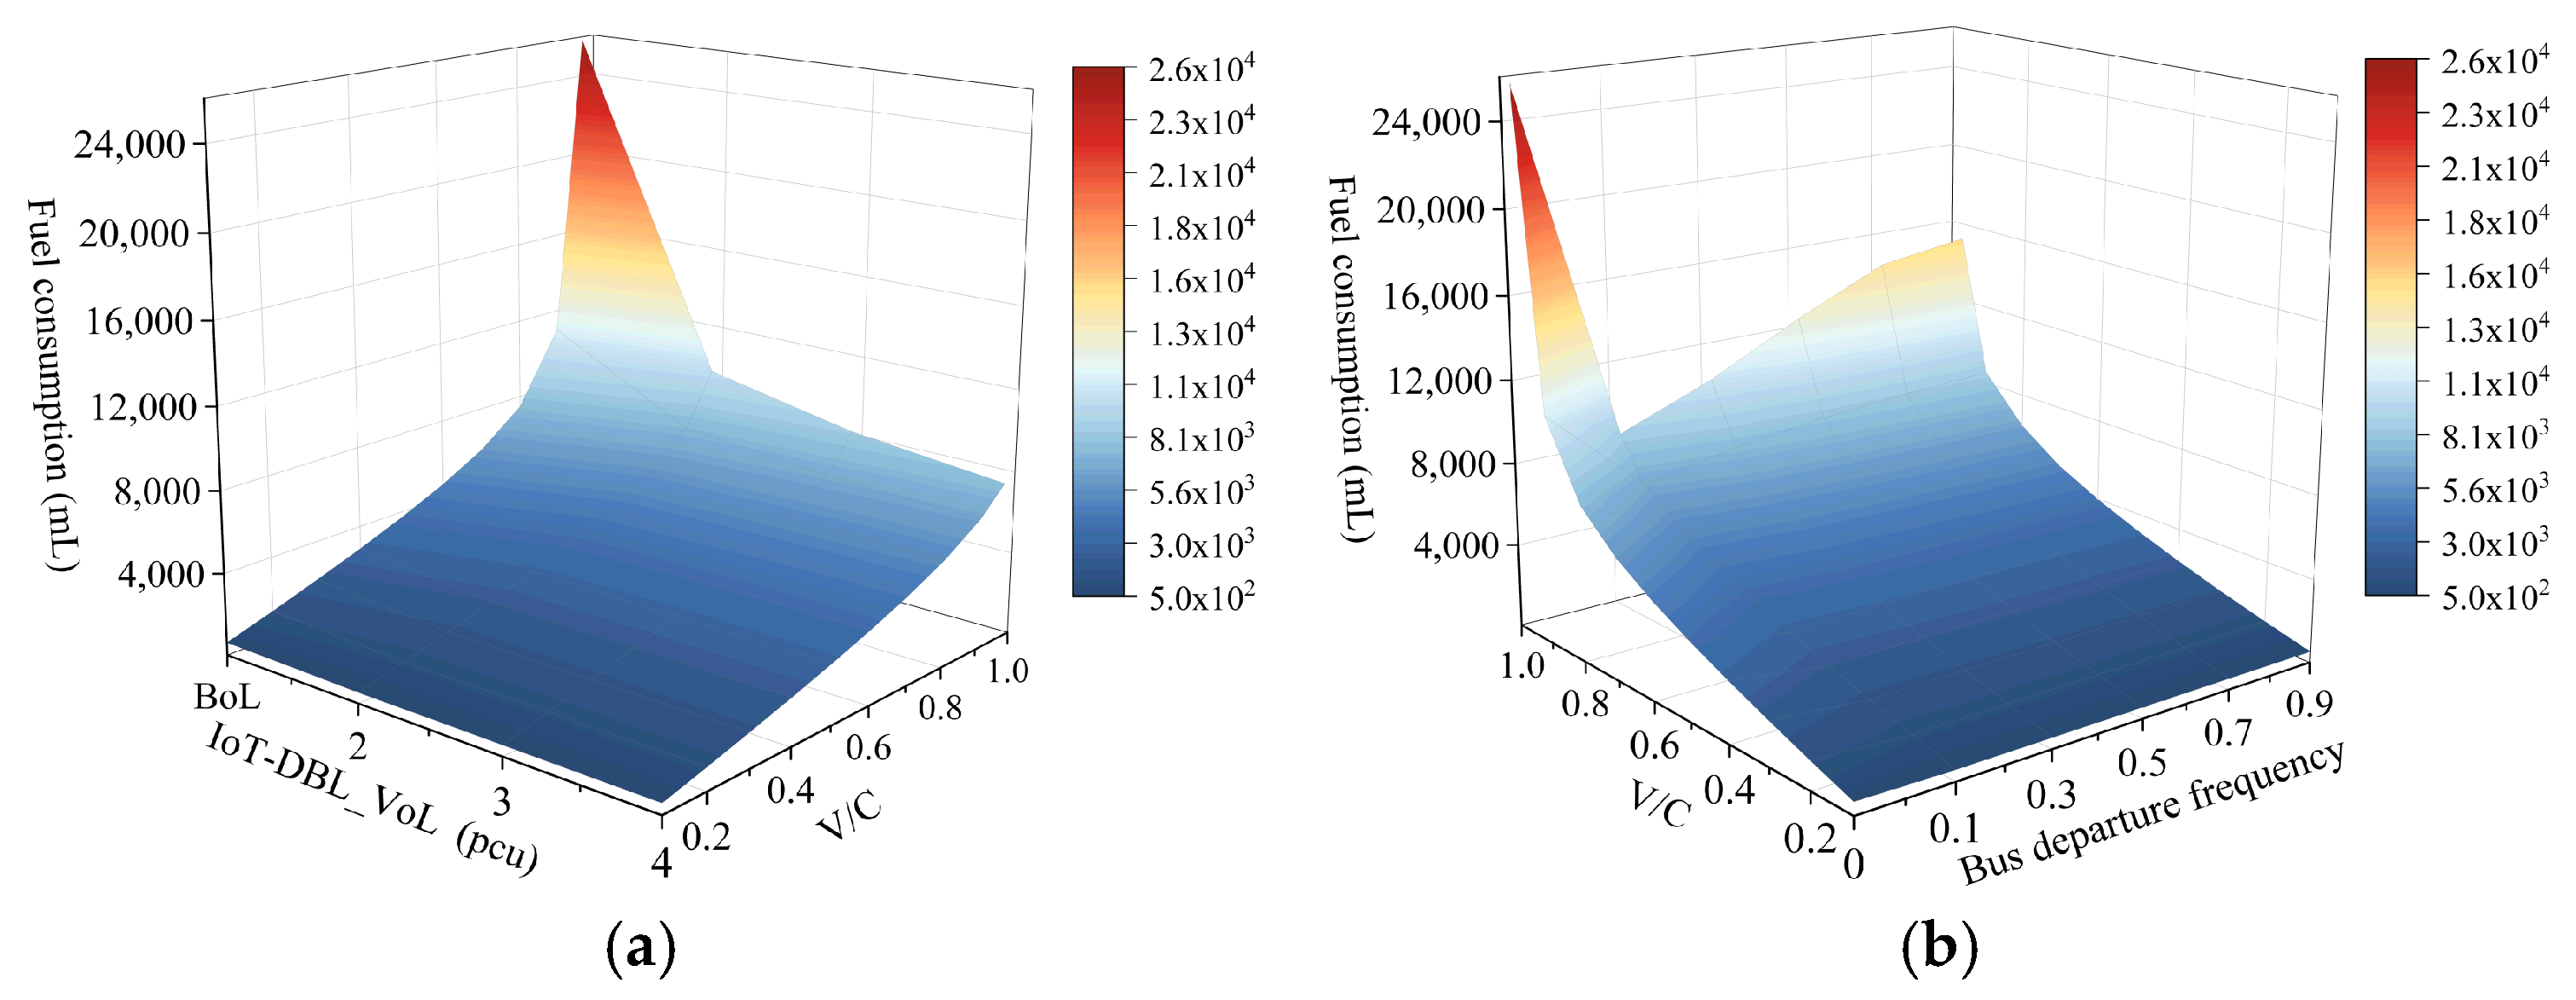
Figure 10 illustrates the comparison of vehicle fuel consumption through the signalized intersection under different saturation levels using varying conditions between the IoT-DBL and the DBL strategy, with parameters
as 1.34 mL/s,
as 0.31 mL/s,
as 0.28 mL/s, and
as 0.64 mL/s. From
Figure 10a, it is evident that under the same condition of low saturation (
V/C < 0.7), the fuel consumption of the vehicle is similar for both strategies. However, under high saturation conditions, the fuel consumption of the vehicle significantly increases with the DBL strategy due to the increased number of stops, resulting in heightened fuel consumption from the repeated starting and stopping of the vehicle. In contrast, the IoT-DBL drastically reduces vehicle fuel consumption.
Figure 10b also demonstrates the impact of bus departure frequency on vehicle fuel consumption. Even at signalized intersection with high bus departure frequency, the IoT-DBL strategy still reduces vehicle fuel consumption by 41.11%. Additionally, at low bus departure frequency, the maximum reduction in vehicle fuel consumption can reach 66.47%.