1. Introduction
According to the International Society for Heart and Lung Transplantation (ISHLT) registry, more than 3000 lung transplants are performed annually, but the majority of these take place in North America, while the number of lung transplants in other regions is relatively low [
1]. Recently, there has been a dramatic increase in the number of deceased lung transplantation (DLT) procedures performed in Japan from 61 to 148 cases-per year during the latest decade [
2,
3]. Japanese medical centers do not form independent lung transplantation teams (personal communications from 11 centers); thus, thoracic surgeons perform both routine lung cancer surgery and transplantation, while the number of lung cancer surgeries is still increasing in Japan [
4,
5]. Because of the increasing number of DLT cases, the capacity limit for DLTs may soon be reached in some transplantation centers, for which the annual number is expected to plateau in spite of an increase in potential recipients who have been registered. In countries where transplant medicine is not well-established, regional disparities in transplant care can sometimes be an issue [
6,
7,
8], but there are few reports indicating that the increasing number of transplants is a problem. The present study was conducted to determine whether a dissociation exists between the number of potential recipients registered and the number of DLT procedures performed in Japanese lung transplantation centers.
2. Materials and Methods
In 2024, there were 11 university hospitals in Japan authorized to perform DLTs. For the present analyses, potential recipients in the registry and DLT cases performed from January 2014 to December 2023 were analyzed. Eight of 11 centers were authorized throughout the entire study period, while the following centers were newly authorized during the period: A in 2014, J in 2020, and K in 2023. The number of individuals at each center registered with the Japan Organ Transplantation Network (JOT) as recipients for DLT was extracted from a database compiled by the Japanese Society of Lung and Heart-lung Transplantation (JSLHT), while the number of DLT procedures performed at each center was extracted from registry reports presented on the JSLHT website [
2]. Personal information of the individuals was not obtained. This study was approved by the Ethics Committee of Dokkyo Medical University (no. 2025-012, 5 September 2025) and research was conducted in accordance with the Declaration of Helsinki 2000 and its later amendment. The requirement for informed consent was waived due to the manner of database study.
The correlation between the number of registrations and transplantations was analyzed at 10-year, 5-year, and 3-year periods in the decade. As the average waiting time after DLT registration in Japan was 2 years and 7 months as of the end of 2023 [
3], the correlation for the 7-year period from the registration period (2014–2020) to the transplantation period (2017–2023) was also analyzed.
Correlation coefficients between the number of DLTs and number of registered individuals were calculated using the Statcel 2 statistical software add-in (OMS Publishing, Tokyo, Japan). “Registration-to-transplantation ratio” was defined as the registration number per transplantation number in each center. When there was a suspected outlier, a Grubbs–Smirnov test [
9] was performed. Statistical significance was defined as
p < 0.05.
3. Results
Data for the numbers of registrations and transplantations in lung transplantation centers are presented in
Table 1. Additionally, the relationship between registration and transplantation numbers at each of the 11 transplantation centers is shown in
Figure 1. The coefficient of determination (R
2) was 0.962 and the slope of the regression line (X coefficient) was 0.407 (
p = 1.016 × 10
−7). The 95% confidence intervals for the X coefficient and the intercept ranged from 0.347 to 0.468 and −12.0 to 12.9, respectively.
Since the facility with the greatest number of registrations showed a low registration-to-transplantation ratio (0.353), the relationships of registration and transplantation numbers at the other 10 facilities are presented in
Figure 2. Exclusion of the facility with the greatest number of registrations increased both the R
2 correlation coefficient and X coefficient values (0.986 and 0.461, respectively). The 95% confidence intervals for the X coefficient and the intercept ranged from 0.415 to 0.506 and −11.4 to 3.9, respectively. The
p value was 1.201 × 10
−8. The X coefficient of 11 centers (0.407) was out of the 95% confidence interval of 10 centers.
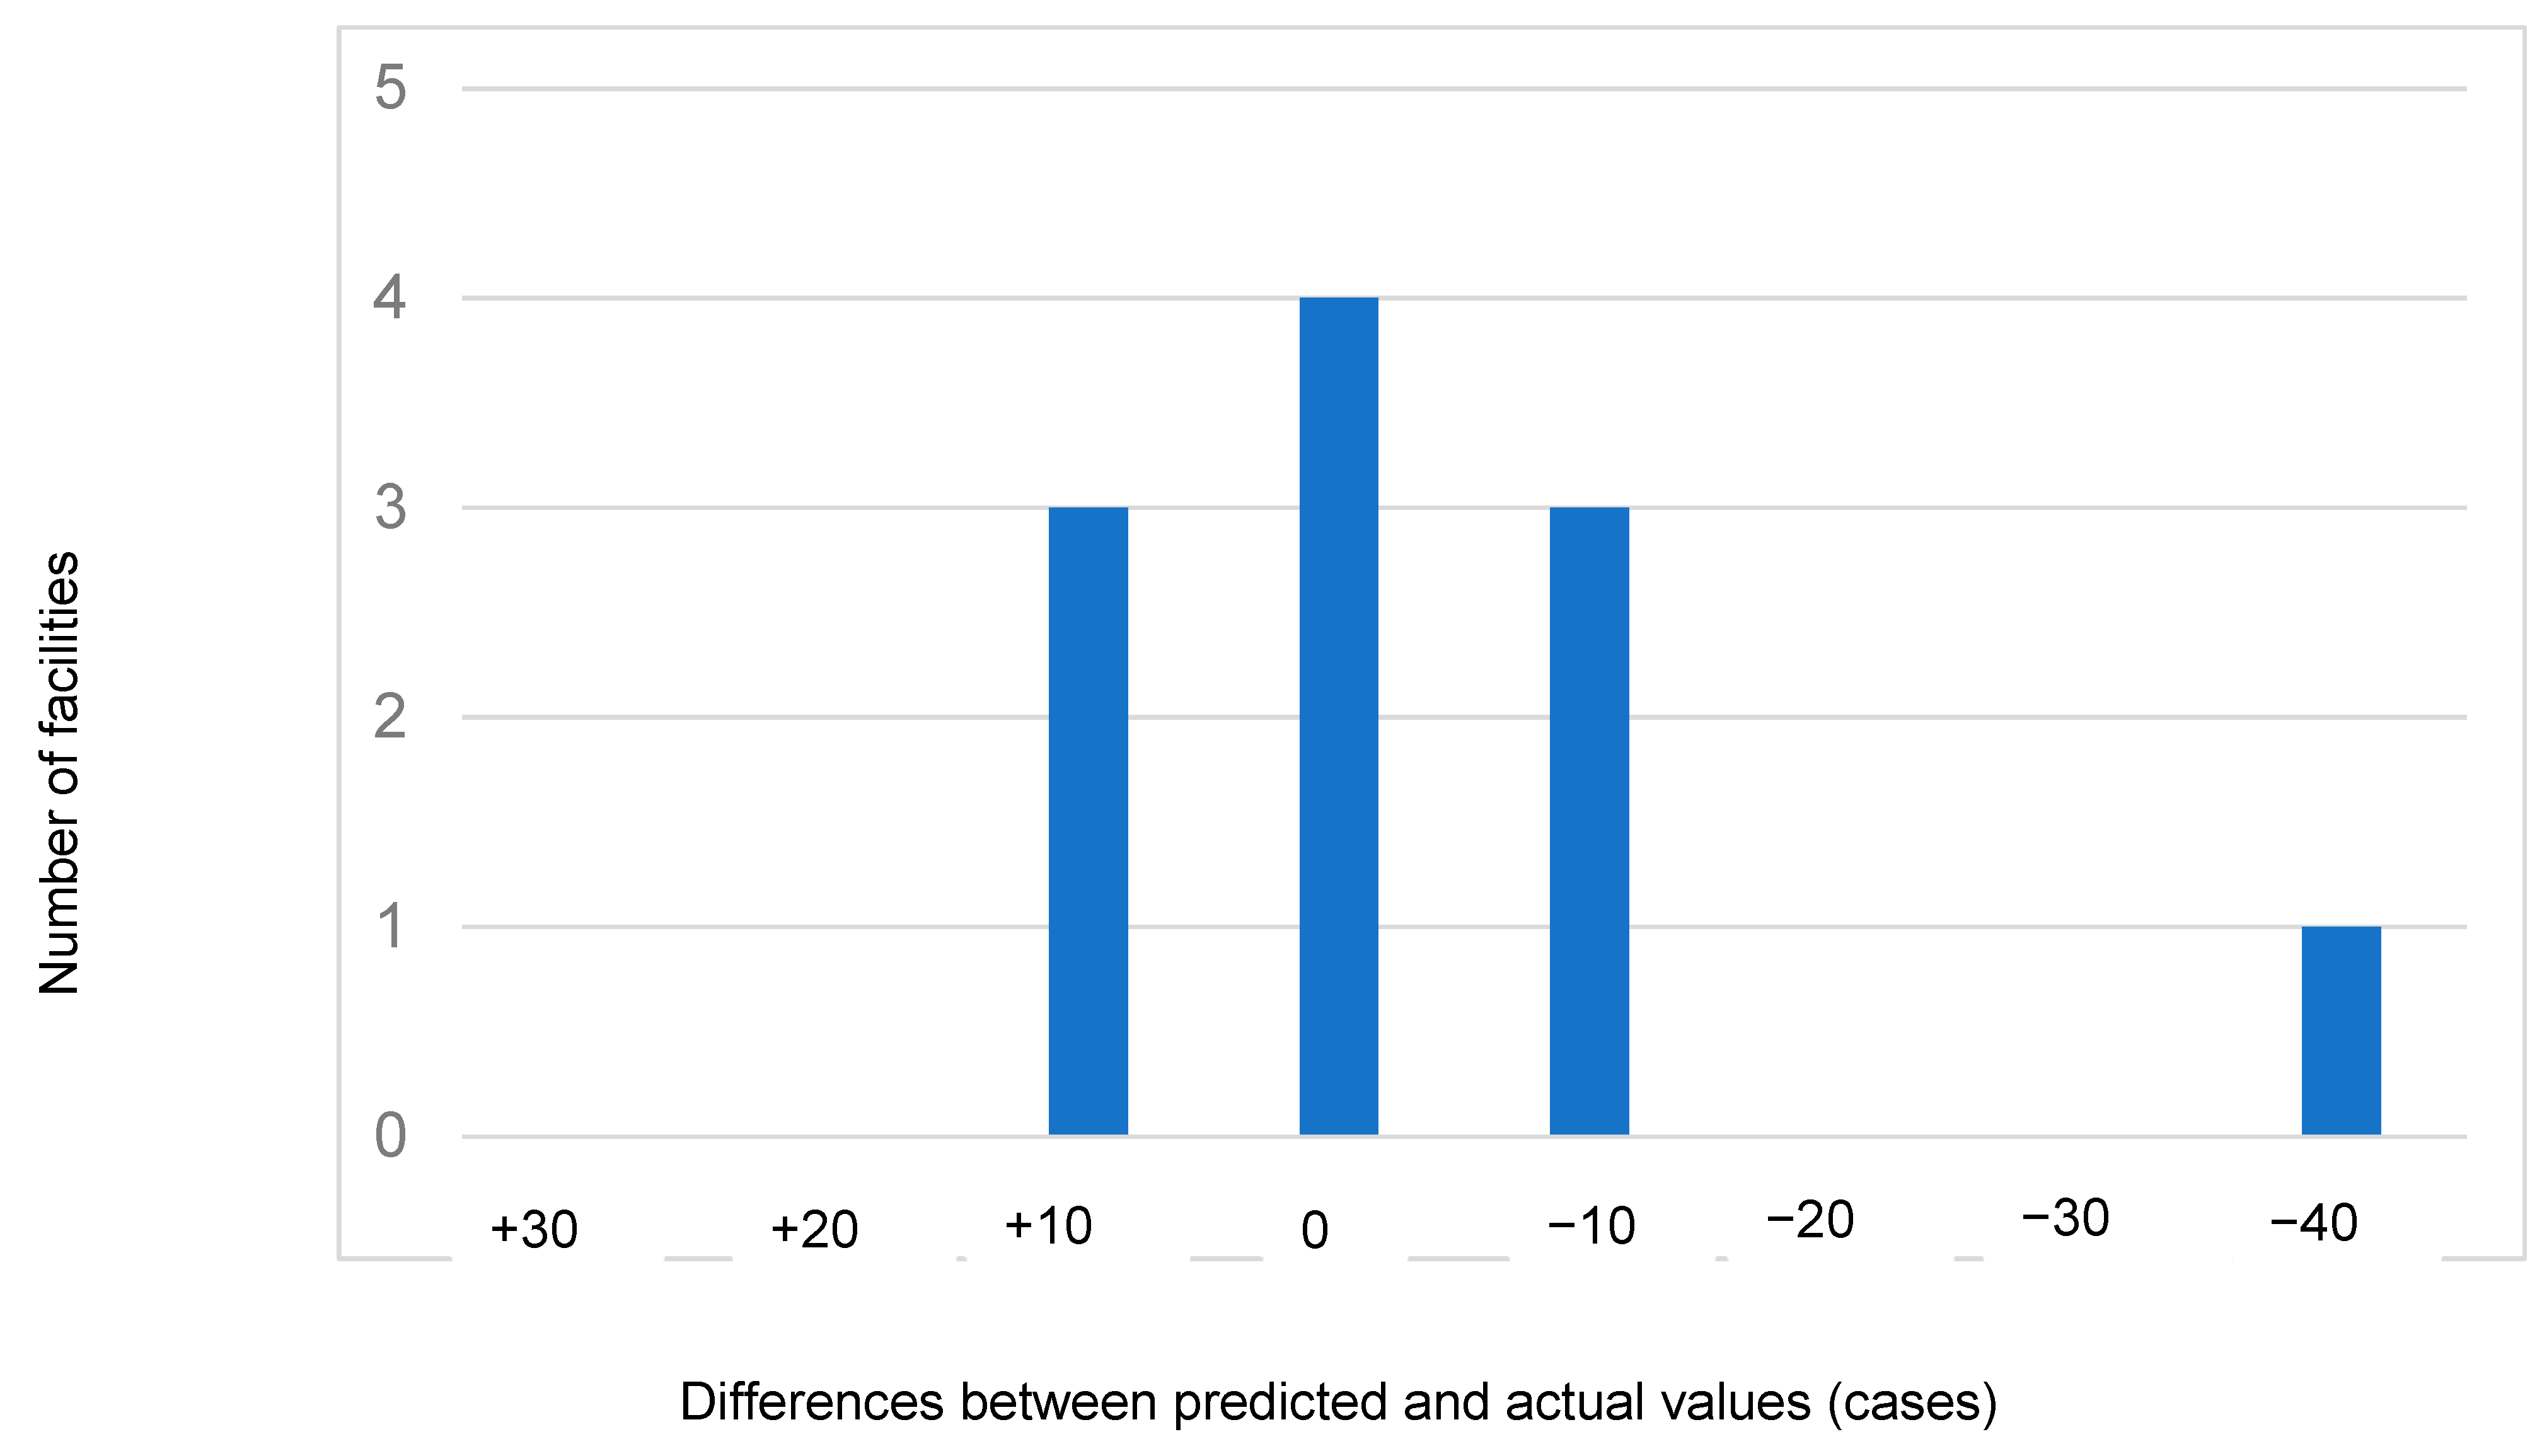
Values for the distribution of residuals (differences between predicted and actual values determined using the calculation formula noted in
Figure 2) for each facility are shown in
Figure 3. The facility with the greatest number of registrations was excluded as an outlier, based on results of a Grubbs–Smirnov test (T value was 2.691,
p < 0.01). The X coefficient and intercept in this analysis of 10 hospitals fell within the 95% confidence intervals of those obtained in the analysis of all 11 hospitals.
The five- and three-year relationships shown in the 11- and 10-facility analyses are presented in
Figure 4 and
Figure 5, respectively. In the five-year analysis, the R
2 and X coefficient values for all 11 hospitals were 0.985 and 0.452, respectively, while those for the group of 10 hospitals were 0.978 and 0.488, respectively. The 95% confidence intervals for the X coefficient of 10 centers ranged from 0.428 to 0.548. As for results of the three-year analysis, the R
2 and X coefficient values for all 11 hospitals were 0.973 and 0.482, respectively, and for the group of 10 hospitals were 0.941 and 0.526, respectively. The 95% confidence intervals for the X coefficient of 10 centers ranged from 0.421 to 0.543. Notably, in both the five- and three-year analysis results, the X coefficient value for the 10 facilities tended to be increased as compared to that for all 11 facilities, even though it was statistically not significant due to the small number of analyses.
The registration numbers per year for 2014–2018, 2019–2020, and 2021–2023 for all 11 facilities were 11.9, 15.7, and 15.6, respectively. The registration number per year increased 1.6-fold in 2021–2023, except for the numbers for the two centers with the fewest registrations, which included a value of zero. The numbers of DLTs per year for 2014–2018, 2019–2020, and 2021–2023 for all 11 facilities were 4.6, 6.2, and 8.7, respectively. The DLT number per year increased 2.5-fold in 2021–2023, except for the numbers for the two centers with the fewest DLT, which included a value of zero. The DLT number per year for the facility with the greatest number of registrations showed the highest value (31.3) during 2021–2023 as compared to those of the other 10 facilities (6.4, range 0.0–20.3). Furthermore, the registration number per year for the facility with the greatest number of registrations also showed the highest value (68.7) during 2021–2023 as compared to those of the other 10 facilities (14.5, range 0.3–41.3).
The correlation considering the time-lag between registration and transplantation was shown in
Table 2 and
Figure 6. The lowest facility had zero registrations during the study period. Over the seven-year analysis, the R
2 and X coefficient values for all 11 hospitals were 0.947 and 0.542, respectively. In this analysis, the registration-to-transplantation ration of facility A was 0.671, exceeding the X coefficient of 0.542.
4. Discussion
This is the first known report indicating a correlation between registration and DLT numbers for patients treated at lung transplantation centers in Japan. The center with the greatest number of registrations showed a low registration-to-transplantation ratio as compared with the other facilities. Analysis limited to the other 10 centers indicated a linear correlation between transplantation and registration, with a higher R2 value as compared to analysis of all 11 centers. Additionally, the X coefficient and intercept from analysis of the 10 hospital analysis were within the 95% confidence intervals of those from analysis of all 11 hospitals. It is therefore considered that the formula Y = 0.461X − 3.761, derived from analysis of the 10 facilities, represents the actual situation of DLT in Japan for the past 10 years. Notably, the one facility excluded as an outlier showed the lowest registration-to-transplantation ratio, yet performed the greatest number of DLTs per year. This phenomenon may be explained by noting that the increase in registrations exceeded the increase in DLTs performed. Alternatively, what has occurred in the outlier facility may occur in all facilities in future.
Results of the five- and three-year analyses showed a similar tendency to that obtained in the 10-year analysis. The registration-to-transplantation ratio for the facility with the highest number of registrations was lower than the X coefficient, while there was an approximate match of the registration-to-transplantation ratio in the other 10. For those 10 facilities, the X coefficient values in the 10-, five- and three-year analyses were 0.461, 0.488, and 0.526, respectively. Since the number of DLT procedures has gradually increased, the value for the expectation of receiving such a transplantation following registration also increased during the recent 10-year period. On the other hand, theR2 value of 10 facilities in the 10-year analysis increased from 0.962 to 0.986 by omitting the outlier facility, while those in the 5- and 3-year analyses decreased. Short observation periods result in smaller sample sizes, making statistical variation more likely. This factor may be influencing the results, or the differences may simply be becoming smaller in recent years.
In Japan, the number of individuals registered for DLT and also of procedures performed are increasing [
2,
3]. From the beginning of 2014 to the end of 2023, the number of DLT cases increased from 61 to 148 (2.4-fold), while registrations for DLT increased from 103 to 304 (3.0-fold) [
2]. Because the number of transplant procedures in Japan was relatively low, Japanese medical centers have not formed independent lung transplantation teams; thus, thoracic surgeons perform both routine lung cancer surgery and transplantation, while the number of lung cancer surgeries is still increasing in Japan [
4,
5]. The capacity of intensive care units and operating rooms, and human resources are already stretched thin by routine patient care, and the capacity available for organ transplantation in Japan is limited. Although the capacity for DLT differs among the registered facilities, it was expected that some may reach their limit in the near future, as indicated by the institution with the greatest number of registrations for DLT, which appears to have reached maximum institutional capacity. Registered candidates in that facility can expect a DLT probability of 0.353, as compared to that of 0.461 at the other facilities, and thus should expect a lower likelihood of undergoing DLT. Even for the final three-year duration period, those probability values were 0.456 and 0.526, respectively. An important question to consider is why the facility with the greatest number of DLTs showed the lowest transplantation-to-registration ratio. One explanation may be because the increase in registrations outpaced the number of DLTs. Another reason may be a time-lag between registration and DLT procedure. The mean waiting time after registration for DLT in Japan was 2 years and 7 months at the end of 2023 [
10]. In a phase of the number of registrations overcoming the number of DLT procedures, this factor may influence the facilities with the higher numbers of registrations more. In fact, the facility with the highest registration number is located in the area with the highest population in Japan and is the only facility in that area. The increase in registrations and the concentration in one facility may be a key to understanding the phenomenon of this outlier. Recently, the Ministry of Health and Labor of Japan has allowed patients to register in two transplantation facilities so as to not to lose the opportunity for undergoing the procedure due to circumstances at a specific institution [
11,
12], though not so many patients have chosen the new dual-registration policy. So, this new system has not worked well yet. Another potential solution for this problem would be to increase the number of authorized transplantation facilities in the same medical area in response to the increase in registrations. Several reports have noted a threshold dividing institutions into high-volume and low-volume groups based on case volume, and the survival rates of high-volume centers were superior to those of low-volume centers. An analysis of the United Network for Organ Sharing national thoracic organ transplantation database performed by Weiss and colleagues showed that high-volume centers had lower rates of 30-day mortality [
13], while Young and colleagues found that 33 lung transplants per year was the threshold of case volume affecting one-year survival [
14]. A review of more than 10,000 patients with LT showed no difference between low-volume (<21.8 LTs per year) and high-volume (>34.2 LTs per year) centers with regard to postoperative complications, but high-volume centers were best able to minimize the adverse effects of theses complications leading to improved short- and long-term survival [
15]. However, we previously reported findings showing that case volume does not correlate with outcome of lung transplantation in Japan [
16]; briefly, “there were no differences of the 90-day and the 1-year mortality between high- and low- volume centers. Additionally, case volume did not reveal a significant difference in long-term survival between high- and low- volume centers, though the low-volume centers had wide differences for long-term outcomes. Because only highly qualified hospitals can be selected as an authorized institution in Japan, survival outcome in low-volume centers was found to be similar to that in high-volume centers.” Given this, it can be one of the solutions to increase new authorized transplantation facility.
To eliminate the impact of the time-lag between registration and DLT procedure, a seven-year analysis was conducted, shifting registrations from 2014 to 2020 and DLT performed from 2017 to 2023 by 3 years. In this analysis, facility A did not show a lower ratio of registrations to transplantations. Therefore, during the phase where the increase in the number of registered patients exceeded the increase in DLTs, the reason the facility with the highest number of registrations showed a low registration-to-transplant ratio is thought to be the very large increase in registrations during the time-lag between registration and DLT.
The limitations of this study include its retrospective design, use of database analysis, and its small number. Removing one center out of only 11 centers may reflect the statistical fragility. Furthermore, though the median waiting time for DLT in Japan ranges from two to three years [
10], transplantation and registration numbers from the same time period without accounting for possible timing shifts due to the waiting period were analyzed.




 ,
,