Article

Body Mass Index and Ovarian Follicular Response in Assisted Reproductive Technology: A Cross-Sectional Analysis

by
Michelle Estefanía Canchig-Aguilar
1,†,
Washington David Guevara-Castillo
1,†,
José Isaac Zablah
2,
José Augusto Durán-Chávez
3,
Nelly Andrade Mejía
4,
Lupe Carolina Espinoza
5,
Lilian Sosa
6,* and
Raynier Zambrano-Villacres
7,8,*
1
Escuela de Nutriología, Facultad de Ciencias Médicas, de la Salud y la Vida, Universidad Internacional del Ecuador, Quito 170411, Ecuador
2
Facultad de Ciencias Médicas, Universidad Nacional Autónoma de Honduras (UNAH), Tegucigalpa 11101, Honduras
3
Centro de Investigación Médica Provida, Provida Nacer Reproducción Humana, Ecuador
4
Facultad de Ciencias de la Salud, Universidad Espíritu Santo, Samborondón 0901952, Ecuador
5
Departamento de Química, Facultad de Ciencias Exactas y Naturales, Universidad Técnica Particular de Loja, San Cayetano Alto, Loja 1101608, Ecuador
6
Instituto de Investigaciones en Microbiología (IIM), Facultad de Ciencias, Universidad Nacional Autónoma de Honduras (UNAH), Tegucigalpa 11101, Honduras
7
Facultad de Ciencias de la Salud y Desarrollo Humano, Universidad Ecotec, Km. 13.5 Samborondón, Samborondón 092302, Ecuador
8
Escuela de Posgrado, Instituto Universitario Italiano de Rosario (IUNIR), Rosario S2000CTT, Argentina
*
Authors to whom correspondence should be addressed.
These authors contributed equally to this work.
Reprod. Med. 2026, 7(3), 35; https://doi.org/10.3390/reprodmed7030035
Submission received: 21 May 2026 / Revised: 14 July 2026 / Accepted: 17 July 2026 / Published: 21 July 2026

Abstract

Background: Excess adiposity has been associated with endocrine and metabolic alterations that may affect ovarian physiology and outcomes in assisted reproductive technology (ART). Objectives: The purpose of this study was to evaluate whether body mass index (BMI) was independently associated with ovarian follicular response in women undergoing assisted reproductive procedures. Methods: A cross-sectional study was conducted including 259 women aged 18 to 43 years. Analyses included nutritional status, diet quality, and follicular response. Associations were analyzed using chi-square and Kruskal–Wallis tests and negative binomial regression adjusted for age and indication. Results: Mean age was 32.8 ± 6.3 years, and mean BMI was 24.7 ± 3.2 kg/m2. Diet quality was not associated with follicle number or morphological quality. Overall, 47.5% of participants had normal weight, 42.9% were overweight, and 6.9% had class I obesity. Follicular yield differed across BMI categories in unadjusted analyses (p = 0.017), but BMI was not independently associated with follicle count after adjustment (IRR = 1.010; 95% CI: 0.983–1.036; p = 0.488). Age remained the only independent predictor, with each additional year associated with a 5.9% reduction in expected follicle count (IRR = 0.941; 95% CI: 0.920–0.963; p < 0.001). Conclusions: BMI was not independently associated with follicular yield after adjustment, whereas age remained the principal determinant of ovarian response. These findings should be confirmed in prospective studies incorporating ovarian reserve markers and stimulation-related variables.

1. Introduction

Obesity has emerged as a pervasive determinant of reproductive morbidity, with prevalence rates among women of childbearing age exceeding 25% in most high- and middle-income countries [1,2]. Clinical evidence increasingly suggests that an elevated body mass index (BMI) negatively affects female fertility through a range of endocrine and metabolic disturbances [3,4]. The extent to which maternal adiposity modifies treatment-specific outcomes remains incompletely characterized [5,6]. Although the impact of BMI on live birth rates has been widely documented, the relationship between BMI and ovarian follicular response—the physiological basis of successful in vitro fertilization (IVF) and intracytoplasmic sperm injection (ICSI)—requires further investigation [7,8].
Ovarian follicular response is a critical surrogate marker of the efficacy of controlled ovarian stimulation (COS) [9]. The efficiency of this gonadotropin-driven process determines the number and developmental competence of retrievable oocytes [10,11,12]. In women with elevated BMI, this process may be impaired by an altered metabolic and hormonal environment [13,14]. Adipose tissue secretes adipokines, pro-inflammatory cytokines, and steroid precursors that modulate hypothalamic–pituitary–ovarian signaling in a depot- and mass-dependent manner [15,16,17]. Excess adiposity is associated with a chronic state of low-grade systemic inflammation and hyperinsulinemia, both of which exert inhibitory effects on the hypothalamic–pituitary–ovarian (HPO) axis [18,19].
The pathophysiological mechanisms linking BMI and follicular dynamics are complex and multifactorial. Elevated leptin levels, an adipocyte-derived hormone, have been shown to directly inhibit the steroidogenic activity of granulosa cells [20,21,22,23]. Previous studies have shown that high leptin concentrations may inhibit the production of estradiol and progesterone, thereby impairing follicular selection and dominance [24,25]. In addition, insulin resistance, one of the hallmarks of obesity, often leads to compensatory hyperinsulinemia [26,27]. Insulin can act synergistically with luteinizing hormone (LH) in theca cells to stimulate androgen synthesis [28]. This hyperandrogenic environment may arrest follicular development at the preantral stage, ultimately reducing the yield of mature oocytes [29,30].
Although much of the available evidence has focused on women with obesity, there is growing interest in understanding the potential impact of being overweight and mild obesity on ovarian response during assisted reproductive treatments. Even moderate increases in BMI can be associated with altered insulin sensitivity, changes in adipokine secretion, and a chronic low-grade inflammatory state—factors that can modify the follicular microenvironment and affect follicular development and oocyte competence. However, the clinical effects of being overweight and mild obesity remain a subject of debate; some studies have reported a reduced response to ovarian stimulation, while others have found no significant differences after adjusting for factors such as age and ovarian reserve. These discrepancies highlight the need for further research into the potential effect of moderate excess body weight on follicular response in women undergoing assisted reproductive techniques [4,31].
Published evidence on ovarian stimulation outcomes in overweight and obese women is conflicting [32]. Some cross-sectional studies have reported a significant reduction in the number of retrieved oocytes and a higher incidence of cycle cancellation due to poor ovarian response [33]. In contrast, other studies suggest that although initial follicular recruitment may be adequate, the subsequent maturation process may be impaired, resulting in a higher proportion of immature or dysmorphic oocytes [34,35]. These discrepancies highlight the need for comprehensive analyses that control for potential confounding variables such as age, baseline anti-Müllerian hormone (AMH) levels, and the specific controlled ovarian stimulation (COS) protocols used [36,37].
Beyond immediate hormonal interference, the follicular microenvironment, particularly the follicular fluid, also undergoes significant alterations. Studies have reported increased concentrations of triglycerides, free fatty acids, and inflammatory markers such as C-reactive protein (CRP) in the follicular fluid of obese women [38,39,40]. This lipotoxic environment may induce mitochondrial dysfunction and oxidative stress in the oocyte and surrounding cumulus cells [41]. Such cellular damage can compromise meiotic spindle assembly and ultimately impair embryo developmental competence [42]. Therefore, follicular response should be interpreted not only in terms of follicle count but also considering the biochemical integrity of the follicular microenvironment [43,44].
The clinical need to optimize assisted reproductive technology (ART) protocols for patients across different BMI categories is increasingly evident. As fertility clinics encounter a growing number of patients with obesity, the demand for evidence-based guidelines regarding gonadotropin dosing continues to increase [45]. Cross-sectional analyses provide valuable insights into these associations, enabling clinicians to identify patterns that might not be readily apparent in longitudinal studies. By examining the follicular response in relation to BMI, researchers may better identify patients at risk of suboptimal reproductive outcomes and support the implementation of preconception weight management strategies or pharmacological interventions to improve reproductive outcomes [46].
Assisted reproductive technologies (ARTs) play a fundamental role in the management of couples with complex infertility, particularly when factors such as advanced maternal age, metabolic disorders, diminished ovarian reserve, or multiple causes of infertility coexist. In these scenarios, optimizing ovarian stimulation protocols and identifying factors that may influence follicular response are essential for improving oocyte yield and enhancing reproductive outcomes. Understanding the impact of modifiable variables—such as nutritional status and body mass index—can contribute to better treatment individualization and the development of strategies to optimize assisted reproduction outcomes [47].
In Ecuador, the intersection of nutrition and reproductive health is an important public health concern [48]. National health surveys (ENSANUT) have reported a steady increase in the prevalence of overweight and obesity among women of reproductive age, reflecting global trends but also influenced by local dietary patterns and sedentary lifestyles [49,50]. Despite these rising figures, there is still limited local evidence on how these metabolic changes affect Ecuadorian women undergoing fertility treatments [51]. Additionally, socioeconomic conditions and potential genetic predispositions in populations from the Andean and coastal regions may influence the phenotypic expression of polycystic ovary syndrome (PCOS) and other metabolic disorders associated with BMI. These factors underscore the need for focused research in this population to inform and tailor clinical interventions [52].
The present study aimed to determine whether BMI independently predicts the number and morphological quality of retrieved follicles—after adjustment for age and clinical indication—in women undergoing assisted reproductive procedures at a tertiary center in Ecuador.

2. Materials and Methods

2.1. Study Design

A cross-sectional observational study was conducted to examine the association between BMI and ovarian follicular response in women undergoing assisted reproductive treatments. Ovarian response was assessed using two outcomes recorded in clinical records: (i) the number of follicles retrieved following controlled ovarian stimulation and oocyte retrieval, and (ii) the morphological quality of the retrieved follicular complex, classified as high, medium, or low according to the routine embryological assessment performed immediately after follicular aspiration by a single experienced embryologist at the study center. The assessment was based on the overall macroscopic appearance of the aspirated follicular complex, including follicular appearance during aspiration, characteristics of the follicular fluid, ease of oocyte retrieval, and the general morphology of the recovered cumulus–oocyte complex (COC). Based on this global assessment, each retrieved follicular complex was assigned to one of three ordinal categories: high, medium, or low quality (Supplementary Table S1). Because this classification reflected routine clinical practice rather than a prospectively defined research protocol or a validated grading system, it should be interpreted as a center-specific morphological assessment. Since all evaluations were performed by the same embryologist throughout the study period, interobserver variability was minimized [51].

2.2. Setting, Study Period, and Data Source

The study was conducted at Hospital de Especialidades Provida Nacer, Reproducción Humana (Latacunga, Ecuador), using secondary data obtained from clinical records of women treated with assisted reproductive techniques between 2021 and 2024. Data were collected through a retrospective review of medical records.
The unit of analysis was the clinical record associated with each patient or treatment cycle during the study period, per the data collection protocol. Before data extraction, all records were anonymized by removing direct identifiers (names, identification numbers, and contact information). The extracted information was compiled into a structured database developed specifically for this study.

2.3. Population, Sample, and Sampling

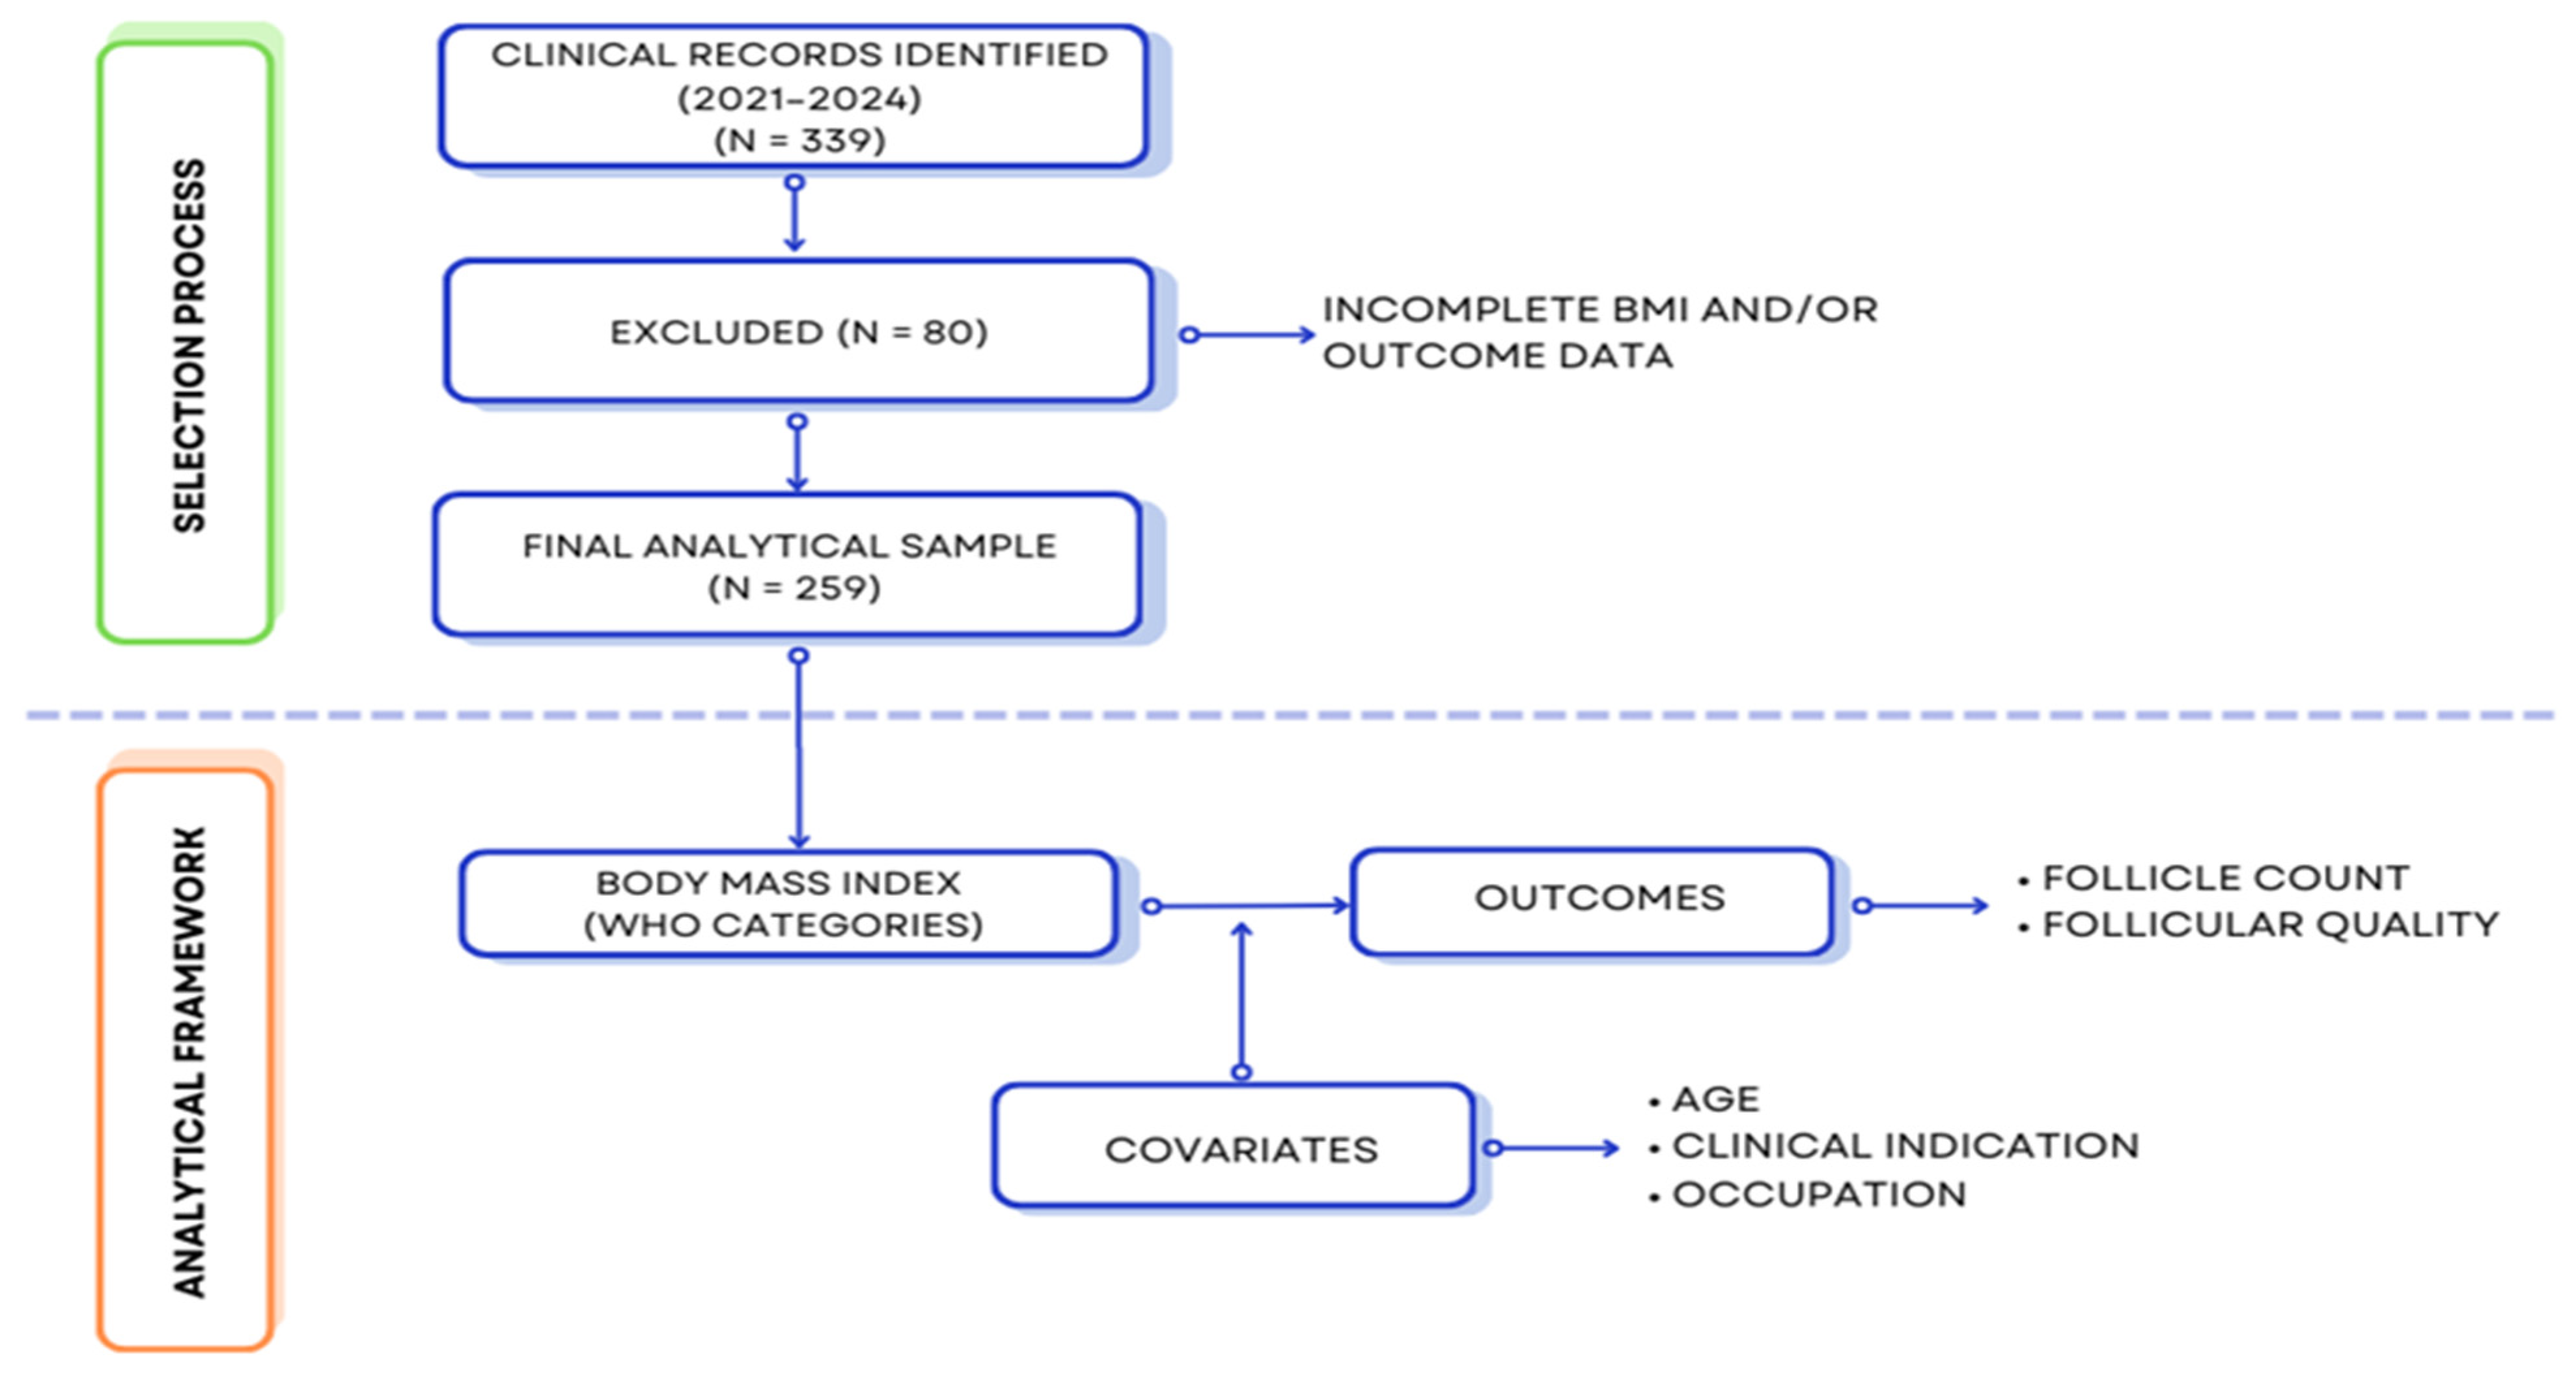
The study population consisted of 339 medical records of women aged 18 to 49 who received care for infertility and/or related procedures between 2021 and 2024. Medical records were identified through the institutional electronic database and screened sequentially according to predefined inclusion and exclusion criteria. A census of all eligible records available during the study period was performed to minimize selection bias. After applying the exclusion criteria, 80 records were excluded because of incomplete information on the exposure variable (BMI) and/or the primary study outcomes. The final analytical sample comprised 259 medical records. The participant selection process is summarized in Figure 1.

2.3.1. Inclusion Criteria

Clinical records of women aged 18–49 years who underwent infertility evaluation and/or assisted reproductive treatments between 2021 and 2024 were included if the variables required by the study protocol were available, including weight and height for BMI calculation and records needed to assess ovarian follicular response.

2.3.2. Exclusion Criteria

The following protocol-defined exclusion criteria: prior bariatric surgery, documented premature ovarian insufficiency, current use of medications known to affect ovarian function (e.g., GnRH agonists for non-ART indications), or chart-documented conditions independently associated with altered follicular dynamics (e.g., severe endometriosis stage III–IV). Endocrine and metabolic disorders were not considered automatic exclusion criteria. Women were included provided they met the predefined eligibility criteria and had sufficient clinical information available for analysis. Conversely, patients with concurrent medical conditions judged to substantially affect fertility through mechanisms unrelated to the objectives of this study were excluded. Because the study was based on retrospective clinical records, endocrine and metabolic comorbidities were not systematically available and therefore were not included as study variables.

2.4. Variables and Operational Definitions

The primary exposure variable was BMI, calculated as weight (kg) divided by height (m) squared (kg/m2), based on anthropometric data recorded in the clinical records. BMI was categorized according to the World Health Organization (WHO) classification as underweight (<18.50 kg/m2), normal weight (18.50 to 24.99 kg/m2), overweight (25.00 to 29.99 kg/m2), and obesity (≥30.00 kg/m2) [53].
Ovarian follicular response was evaluated using two outcomes documented in the clinical records: (i) the number of follicles retrieved following ovarian stimulation and oocyte retrieval, analyzed as a discrete count variable [54]; and (ii) the morphological quality of the retrieved follicular complex, classified as high, medium, or low and analyzed as a categorical variable.
For descriptive and comparative analyses, follicle count was additionally categorized into five groups (≤5, 6–10, 11–15, 16–20, and ≥21), based on the distribution observed in the dataset.
Covariates included age, occupation, indication for the procedure, type of infertility (primary or secondary), and procedures performed (aspiration and vitrification), as recorded in the clinical records. Given its established association with ovarian response, age was prioritized as an adjustment variable in multivariable analyses. For the descriptive and comparative analyses, age was also categorized as ≤35 years and ≥36 years, using the 35-year cutoff because it is widely accepted as a threshold associated with a decline in ovarian reserve and reproductive response in women undergoing assisted reproductive techniques. Clinical indication was classified according to the primary reason for the assisted reproductive procedure recorded in the medical records, including primary infertility, secondary infertility, donor oocyte retrieval, and oocyte vitrification. Nutritional status was determined from anthropometric measurements (weight and height) recorded in the medical records and classified according to the World Health Organization BMI classification.

2.5. Data Collection Procedure and Bias Control

Data were obtained through a retrospective review of clinical records for the period 2021 to 2024. Only records containing a documented nutritional assessment before treatment were included to obtain weight and height measurements for BMI calculation. Clinical variables and ovarian response outcomes were extracted and recorded in a standardized data collection template developed for the study. No personal identifiers were recorded during data extraction, and the analytical dataset was managed in anonymized form. To reduce information bias, predefined operational definitions were applied to both exposure (BMI) and outcome variables. The database was reviewed and cleaned before analysis. Records lacking sufficient information to classify the exposure and/or outcomes were excluded from the analytical sample. Given the observational design, potential confounding was addressed by including available clinical covariates in adjusted or stratified analyses, with particular emphasis on age and clinical indication for the procedure.

2.6. Statistical Analysis

All statistical analyses were performed using standard statistical software. Categorical variables are summarized as frequencies and percentages. In contrast, continuous variables are reported as mean ± standard deviation for normally distributed data or as median and interquartile range (IQR) for non-normally distributed data. In bivariate analyses, associations between categorical variables, including BMI categories, categorized follicle count, and morphological quality of the retrieved follicular complex, were assessed using the chi-square test or Fisher’s exact test, depending on expected cell frequencies. Statistical significance was defined as p < 0.05. The number of retrieved follicles was modeled as a discrete count variable using multivariable negative binomial regression. This approach was selected over Poisson regression to accommodate the overdispersion observed in the follicular-count distribution. Variables were entered simultaneously into a single multivariable model based on a pre-specified analytical plan; no automated variable selection was performed. BMI (continuous, per kg/m2) and age (continuous, per year) were entered as numerical predictors, while ART indication was entered as a categorical variable with donor oocyte aspiration as the reference category. Model adequacy was assessed by (i) verifying overdispersion through the estimated dispersion parameter (α) and its 95% confidence interval, (ii) comparing the negative binomial fit against an equivalent Poisson model through a likelihood ratio test, and (iii) examining the Akaike (AIC) and Bayesian (BIC) information criteria. Regression coefficients were exponentiated to yield incidence rate ratios (IRRs) with 95% confidence intervals. All inferential analyses were performed using Python (statsmodels v0.14) and R (v4.3).
To assess the robustness of the primary regression model to the structural heterogeneity introduced by donor oocyte cycles, a pre-specified sensitivity analysis was performed, restricting the dataset to non-donor cycles (primary infertility, secondary infertility, and oocyte vitrification; n = 196). The multivariable negative binomial regression was refitted in this restricted cohort using the same covariate structure, with primary infertility set as the reference category for ART indication.

2.7. Ethical Considerations

This observational study was conducted in accordance with ethical standards for research involving human subjects. The study protocol was reviewed and approved by the Comité de Ética de Investigación en Seres Humanos de la Universidad Central del Ecuador (CEISH-UCE) (Protocol Code: 004-EXT-2025; approval granted during Session No. 041-CEISH-UCE-2025, 18 November 2025).
The study used secondary data obtained from clinical records. All data were anonymized before analysis, and no personal identifiers were included in the analytical dataset.

3. Results

3.1. Participant Characteristics and Clinical Indications

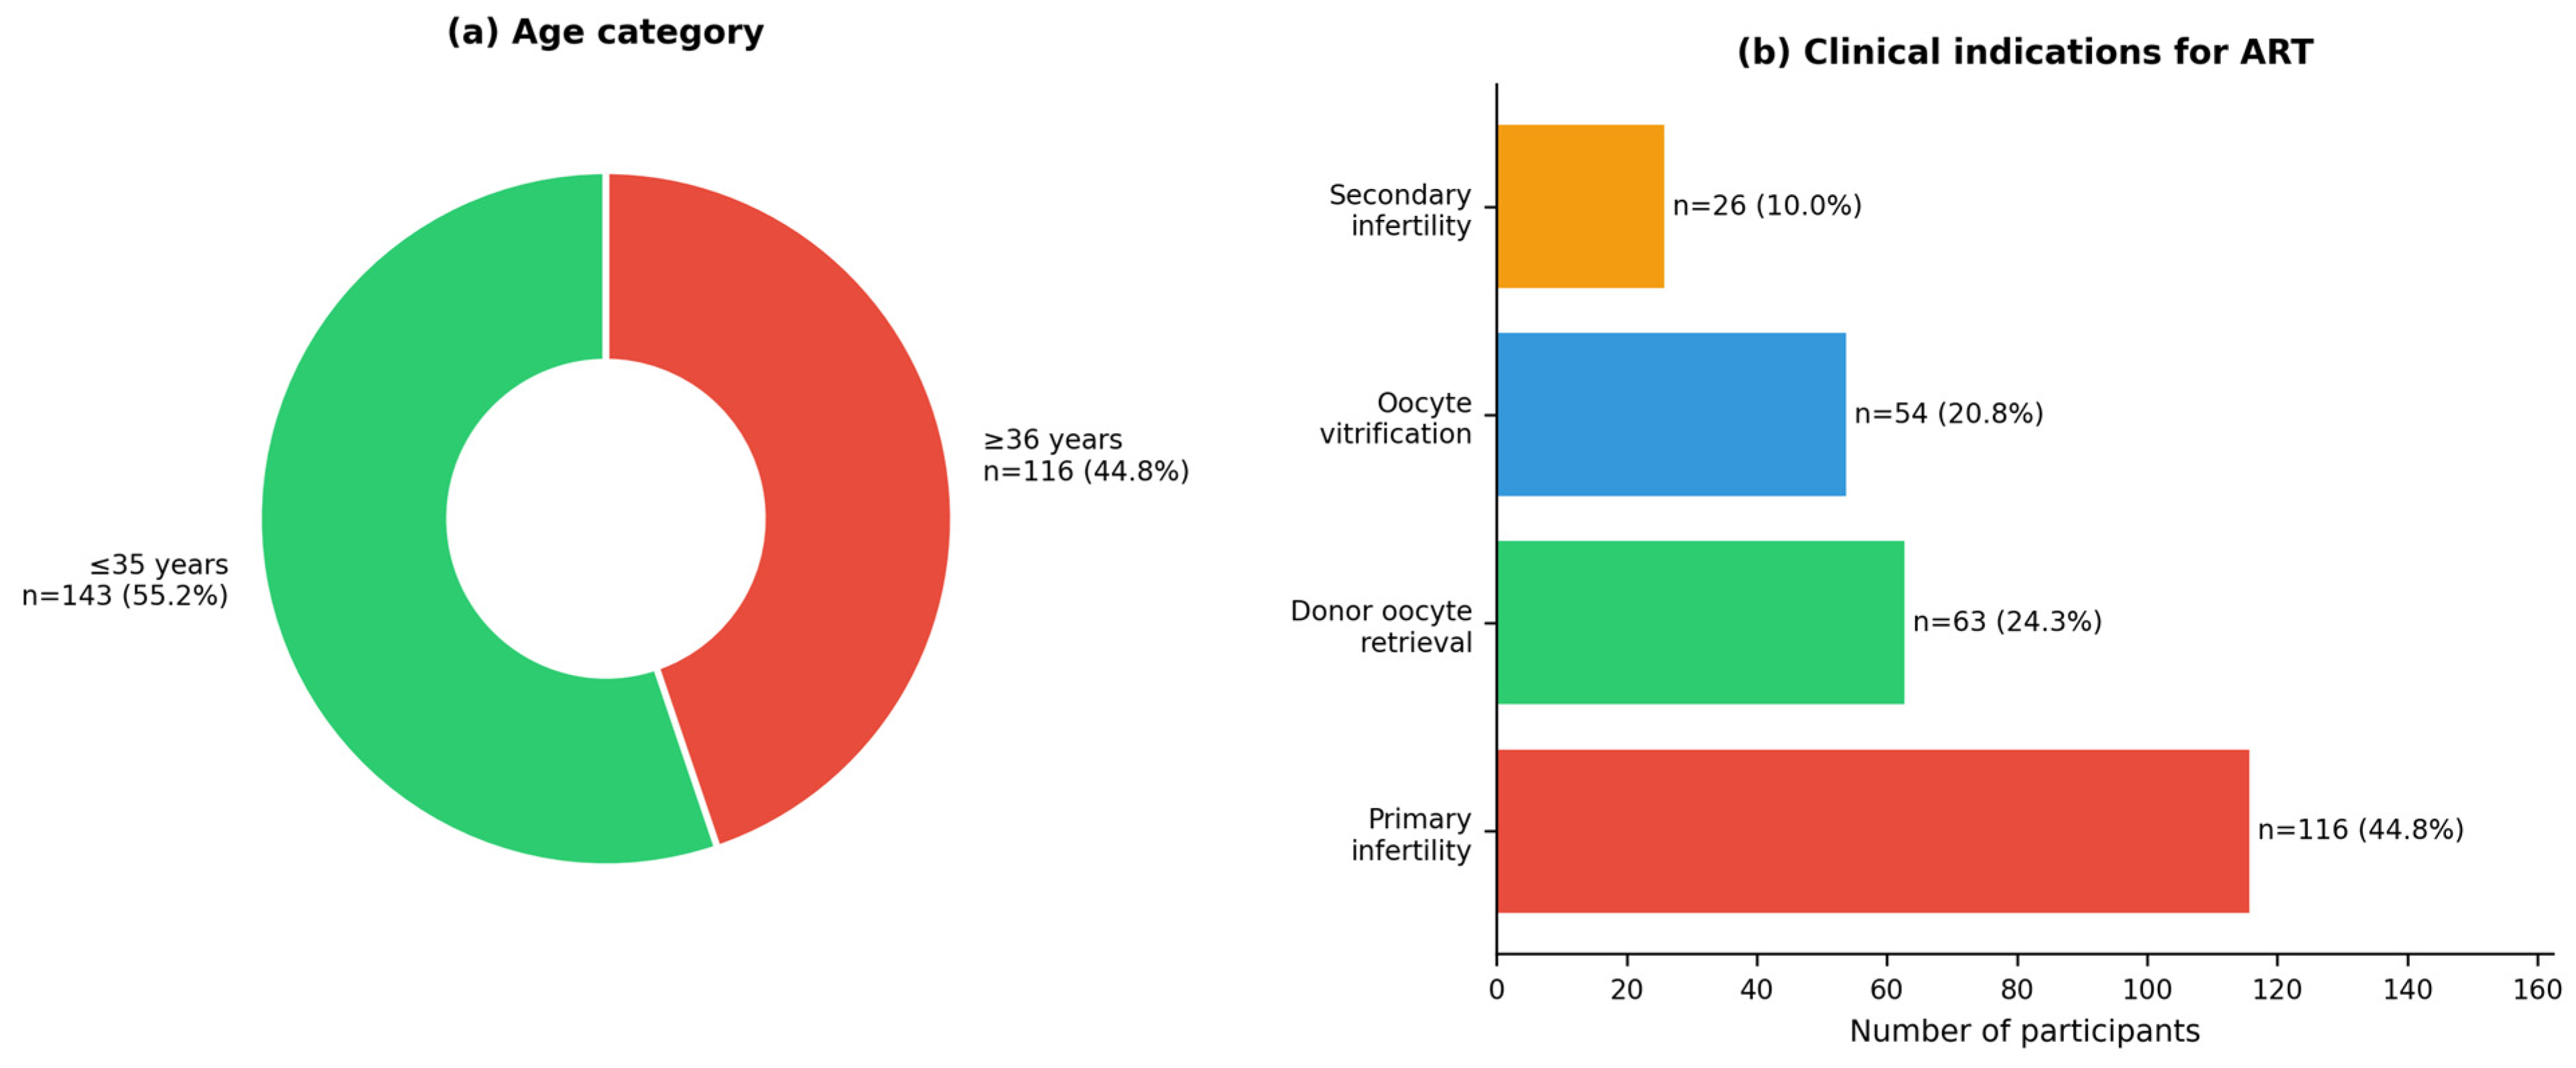
Figure 2 summarizes the demographic distribution and clinical indications of the analytical cohort. A total of 259 clinical records fulfilled all eligibility criteria and were included in the final analysis. The baseline anthropometric characteristics of the study population are summarized in Table 1. The mean age was 32.8 ± 6.3 years. Mean body weight, height, and body mass index (BMI) were 61.5 ± 8.8 kg, 1.58 ± 0.05 m, and 24.7 ± 3.2 kg/m2, respectively. Mean waist circumference was 84.3 ± 7.1 cm, abdominal circumference was 85.2 ± 7.1 cm, hip circumference was 107.6 ± 8.2 cm, waist-to-hip ratio was 0.784 ± 0.044, and waist-to-height ratio was 0.535 ± 0.049.
Participant age ranged from 18 to 43 years, with a mean age of 32.8 ± 6.3 years and a median of 35 years (IQR: 28–38 years). Using the predefined age threshold, 55.2% of participants were aged ≤ 35 years (n = 143), whereas 44.8% were aged ≥ 36 years (n = 116), as illustrated in Figure 2a. Regarding the clinical indications for assisted reproductive technology (ART) procedures (Figure 2b), primary infertility was the most frequent indication, representing 44.8% of the cohort (n = 116; mean age 35.6 years). Donor oocyte aspiration accounted for 24.3% of records (n = 63; mean age 24.8 years), while oocyte vitrification represented 20.8% (n = 54; mean age 33.1 years). Secondary infertility comprised 10.0% of cases (n = 26; mean age 38.8 years). The marked age differences observed between participants undergoing donor oocyte cycles (mean age 24.8 years) and those receiving treatment for primary or secondary infertility (mean ages 35.6 and 38.8 years, respectively) reflect the distinct selection criteria inherent to each clinical pathway and represent a structural source of confounding that was prioritized in all multivariable analyses.

3.2. BMI Distribution and Nutritional Status Categories

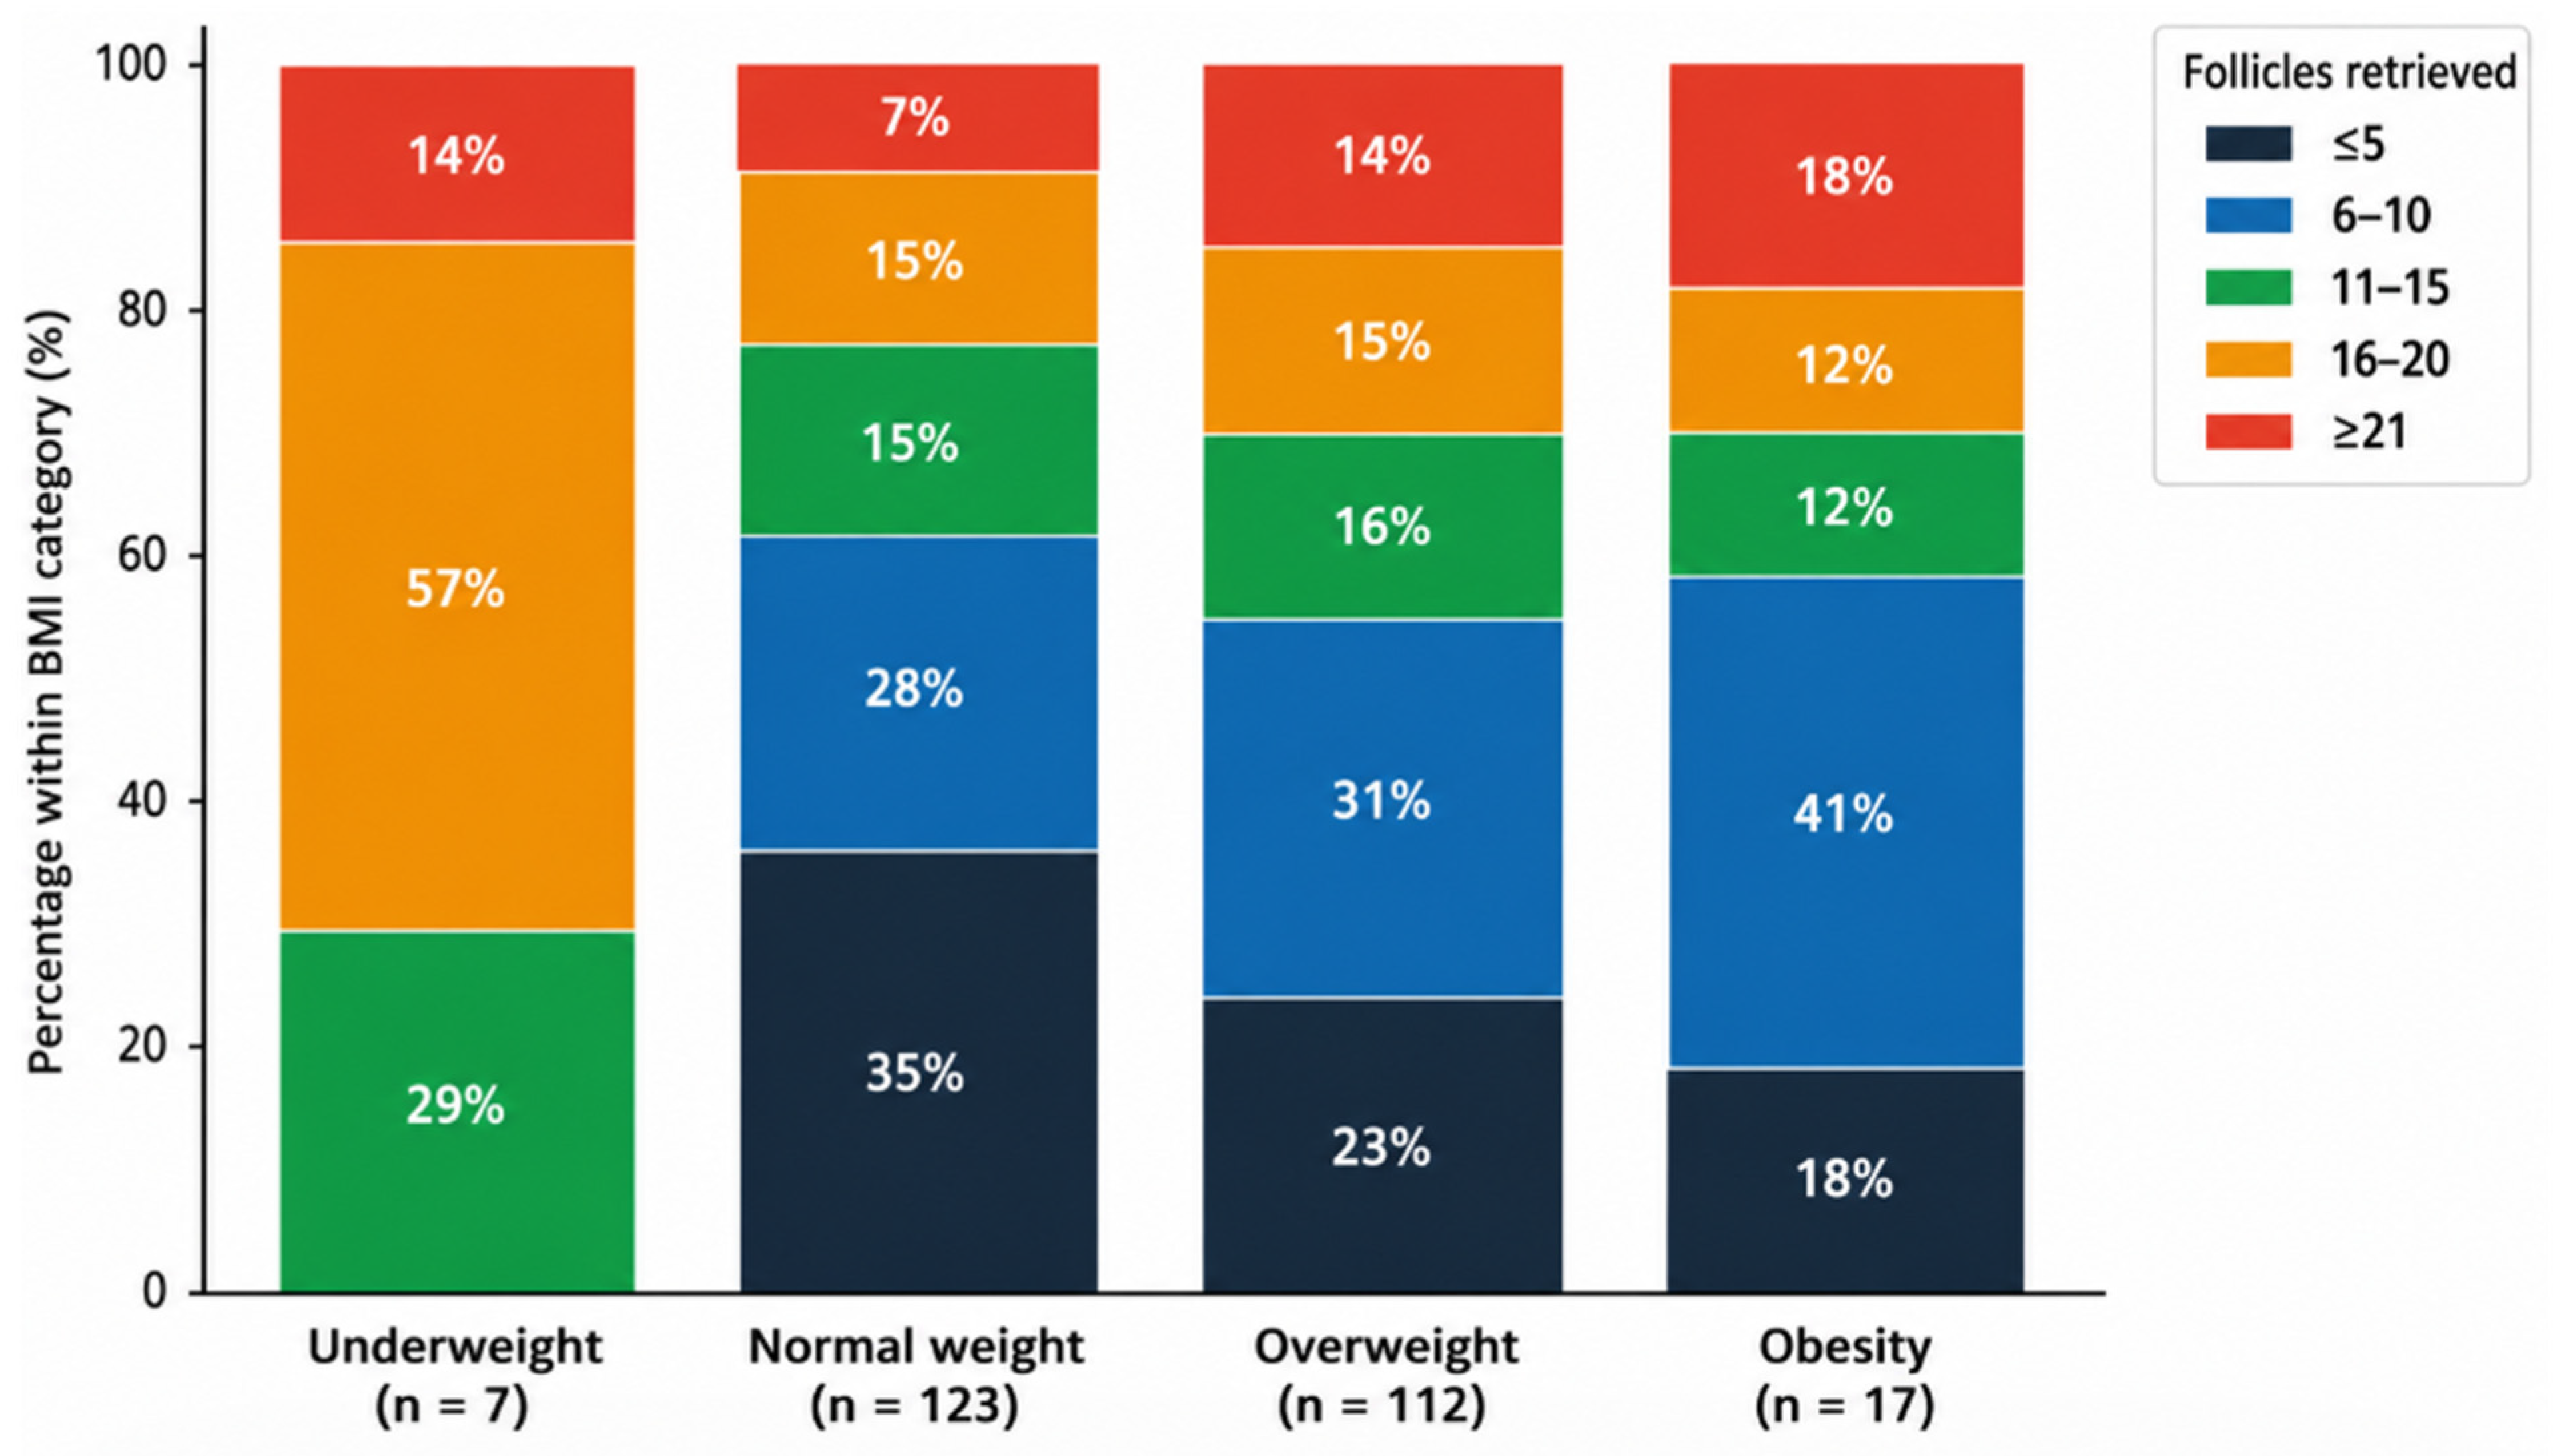
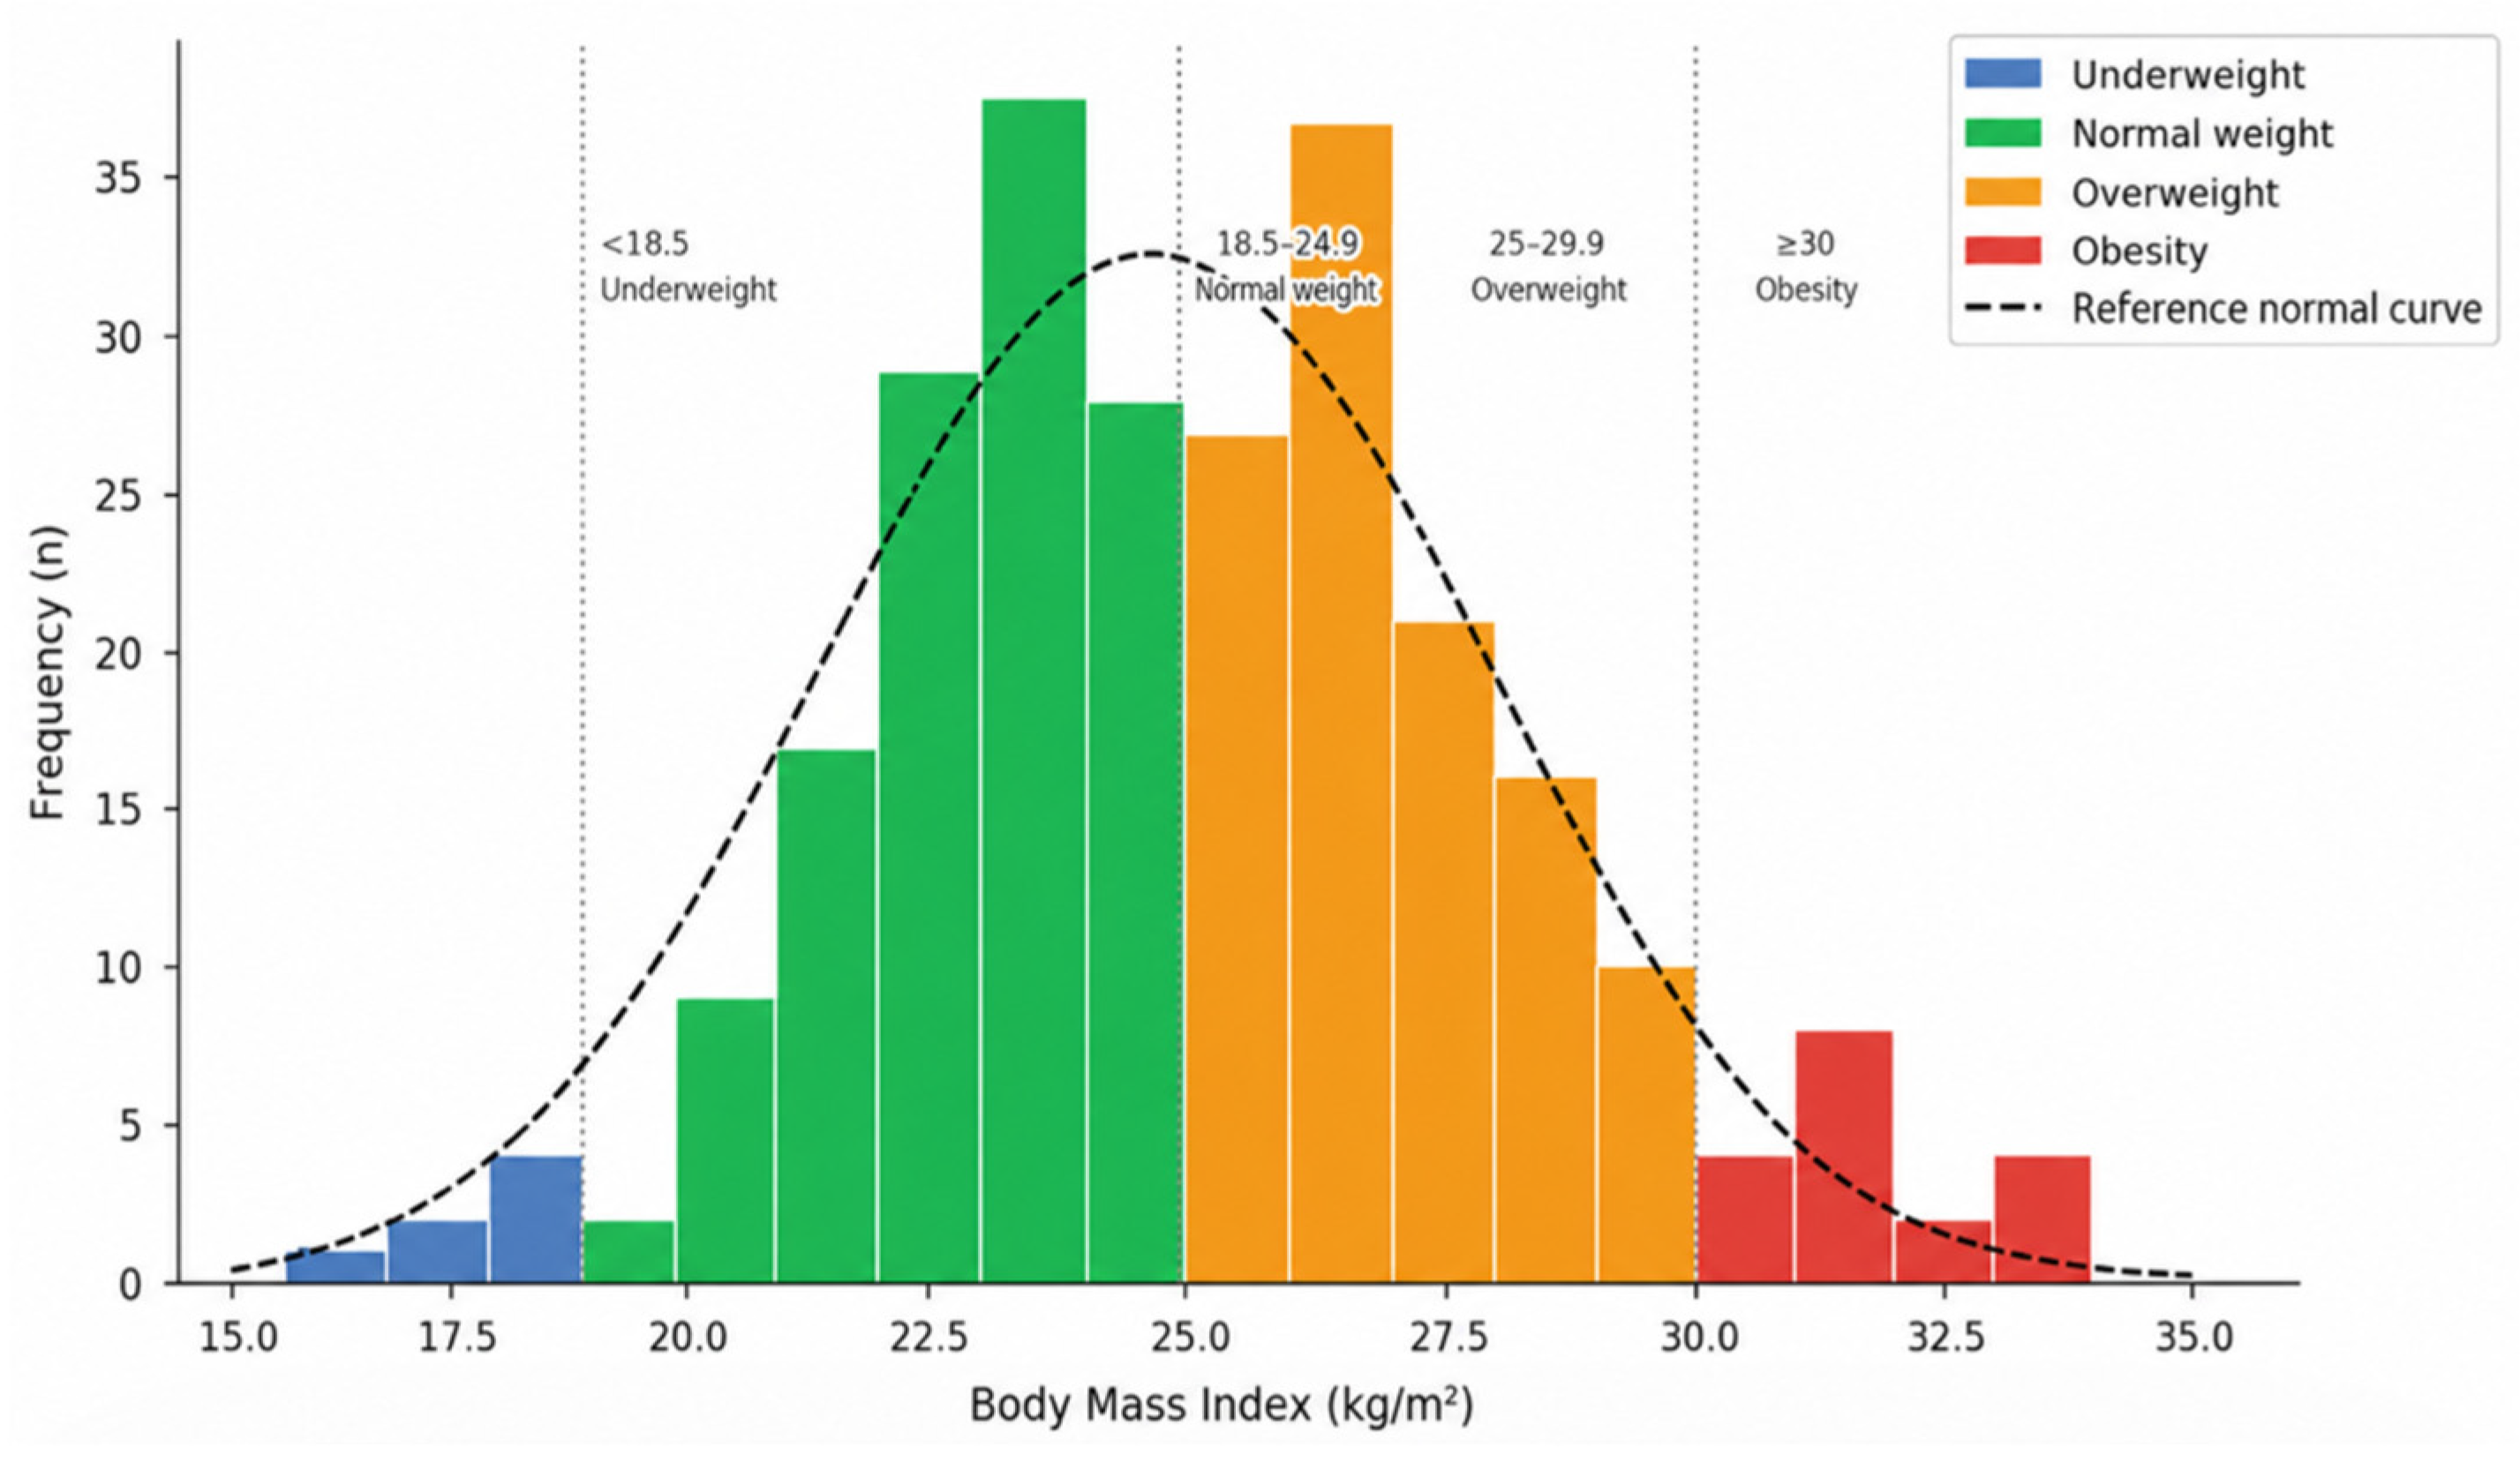
BMI values ranged from 16.0 to 34.0 kg/m2, with a mean of 24.67 ± 3.18 kg/m2 and a median of 24.0 kg/m2 (IQR: 23.0–26.5 kg/m2). Analysis of a random subsample using the Shapiro–Wilk test confirmed that the BMI distribution deviated significantly from normality (W = 0.906, p < 0.001), with moderate positive skewness, consistent with the right-sided tail observed in Figure 3. According to the World Health Organization (WHO) classification criteria, 47.5% of participants were categorized as normal weight (18.5–24.9 kg/m2; n = 123), followed by overweight (25.0–29.9 kg/m2; n = 111, 42.9%), underweight (<18.5 kg/m2; n = 7, 2.7%), and class I obesity (≥30.0 kg/m2; n = 18, 6.9%). Overall, 49.8% of the cohort presented a BMI ≥ 25 kg/m2, encompassing both overweight and obesity categories. This distribution is broadly consistent with national epidemiological data reporting an increasing prevalence of excess adiposity among Ecuadorian women of reproductive age. It provides a clinically relevant range of BMI variation for examining associations with ovarian follicular response.

3.3. Indication of Infertility and Diet Quality as Contextual Correlates of BMI-Related Follicular Response

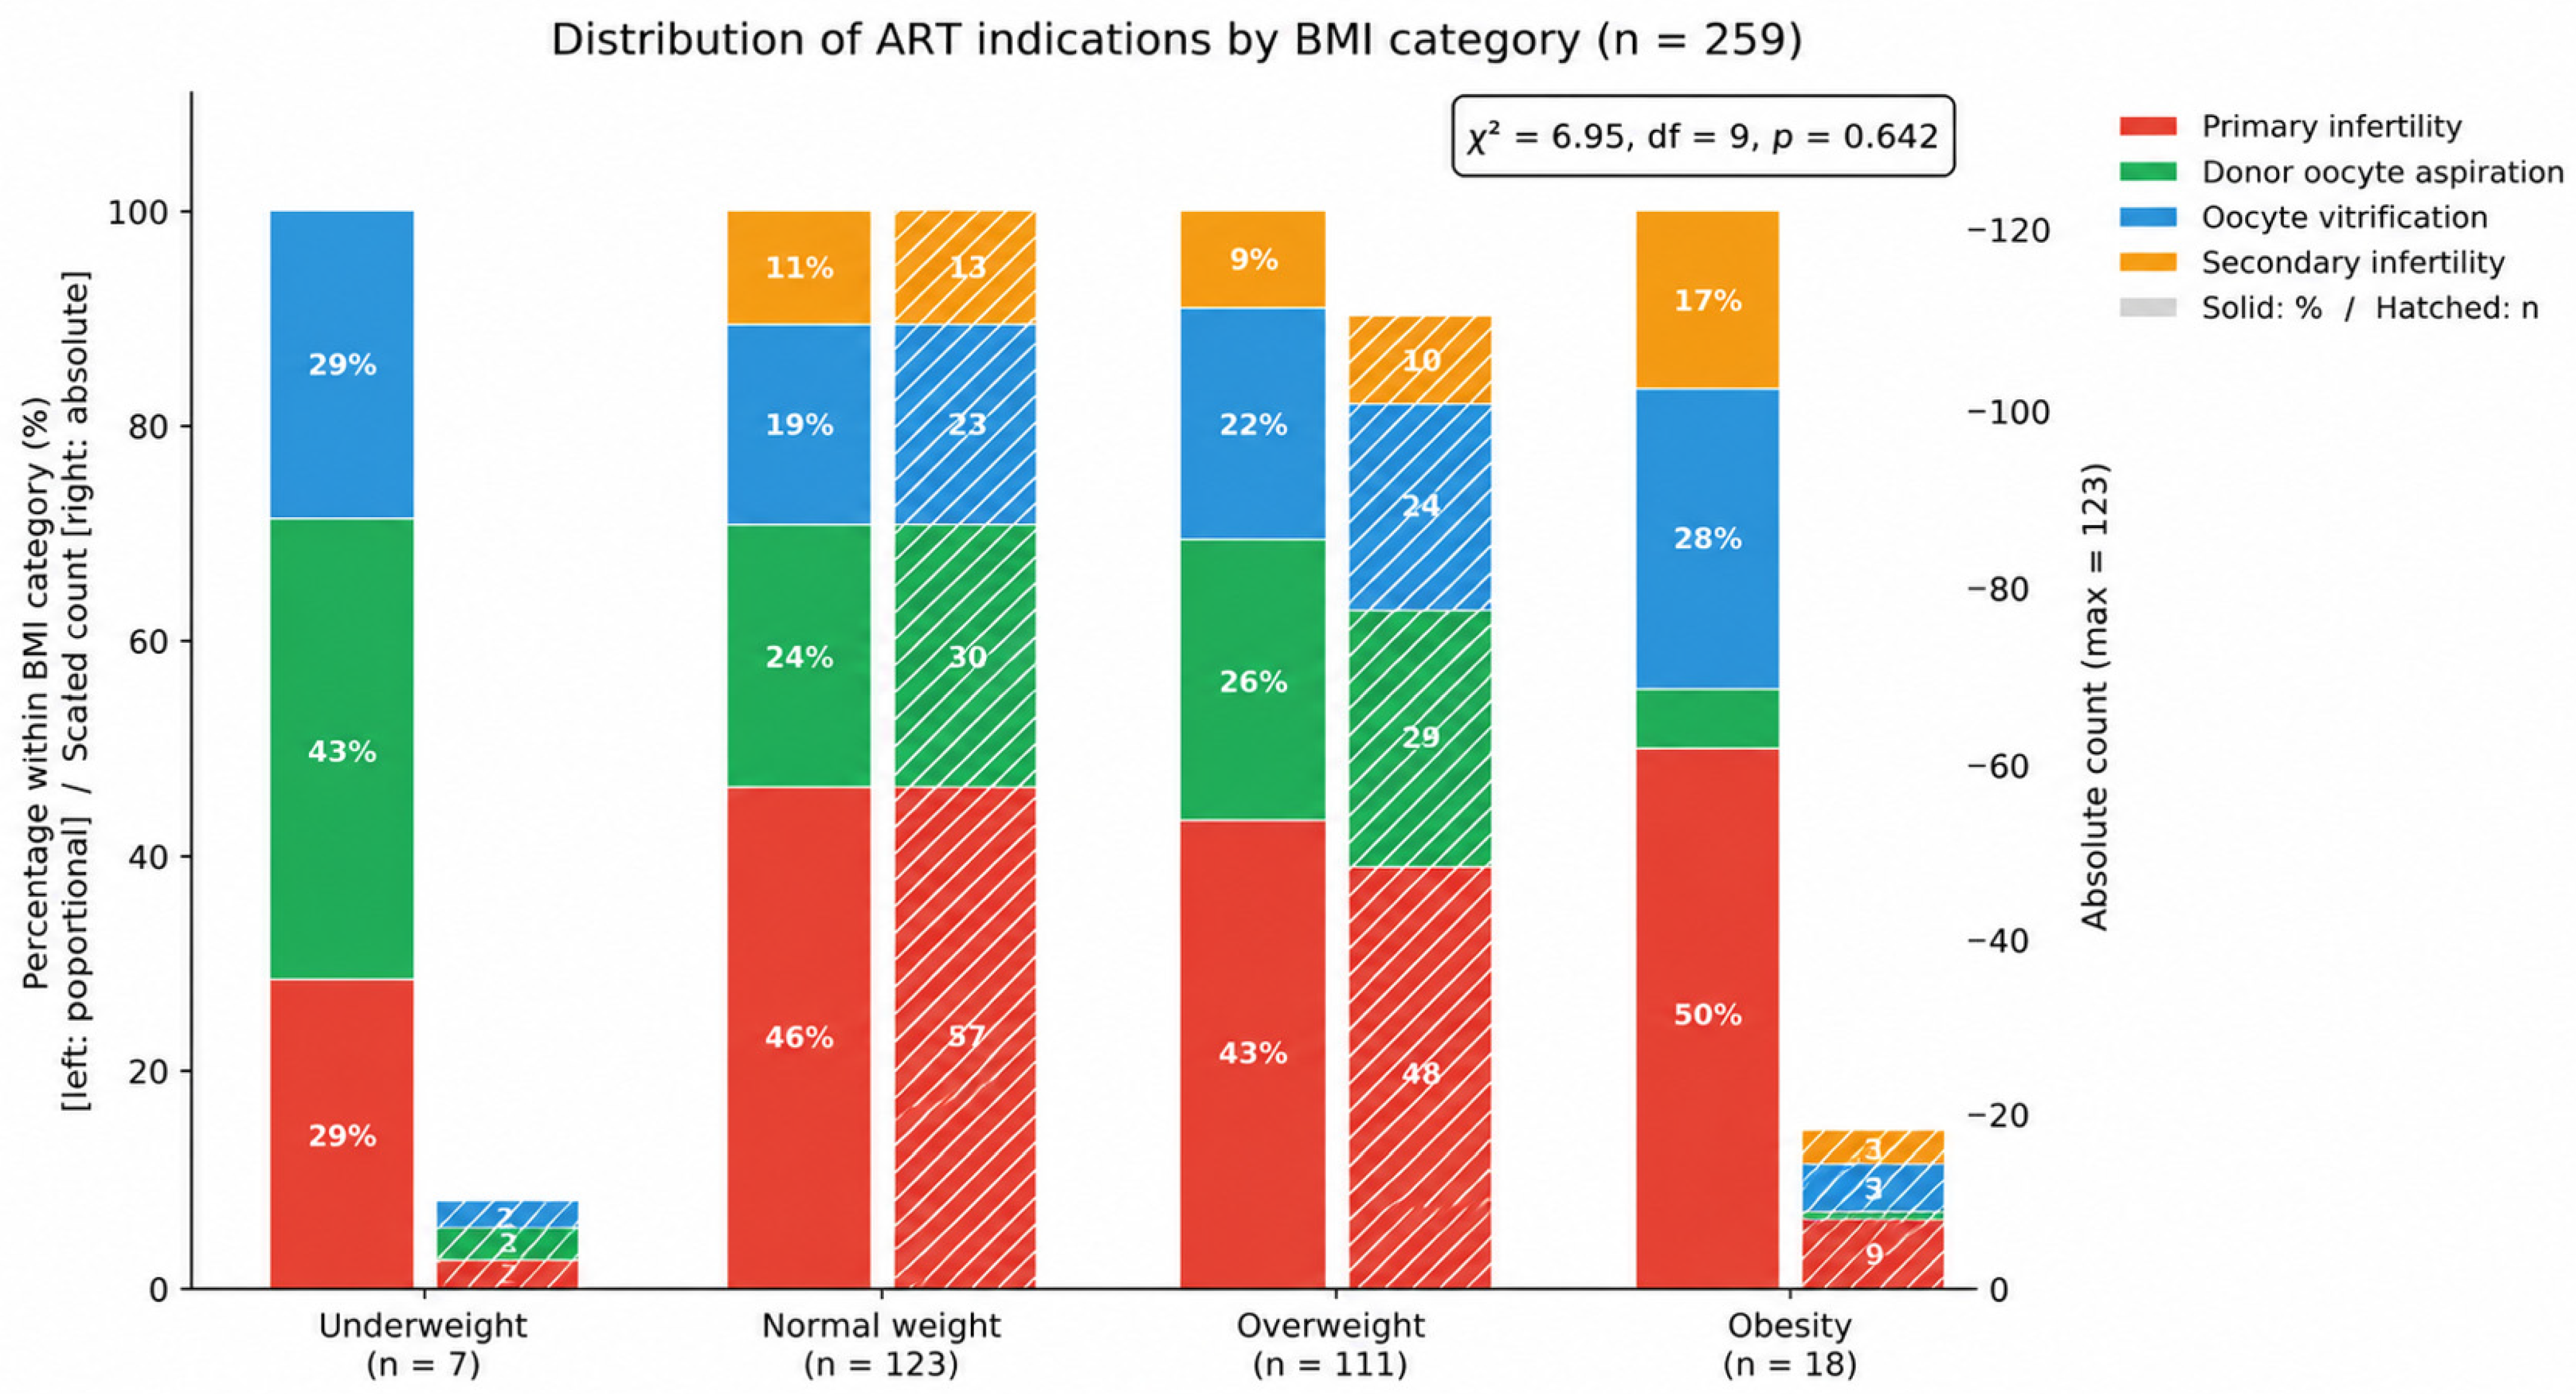
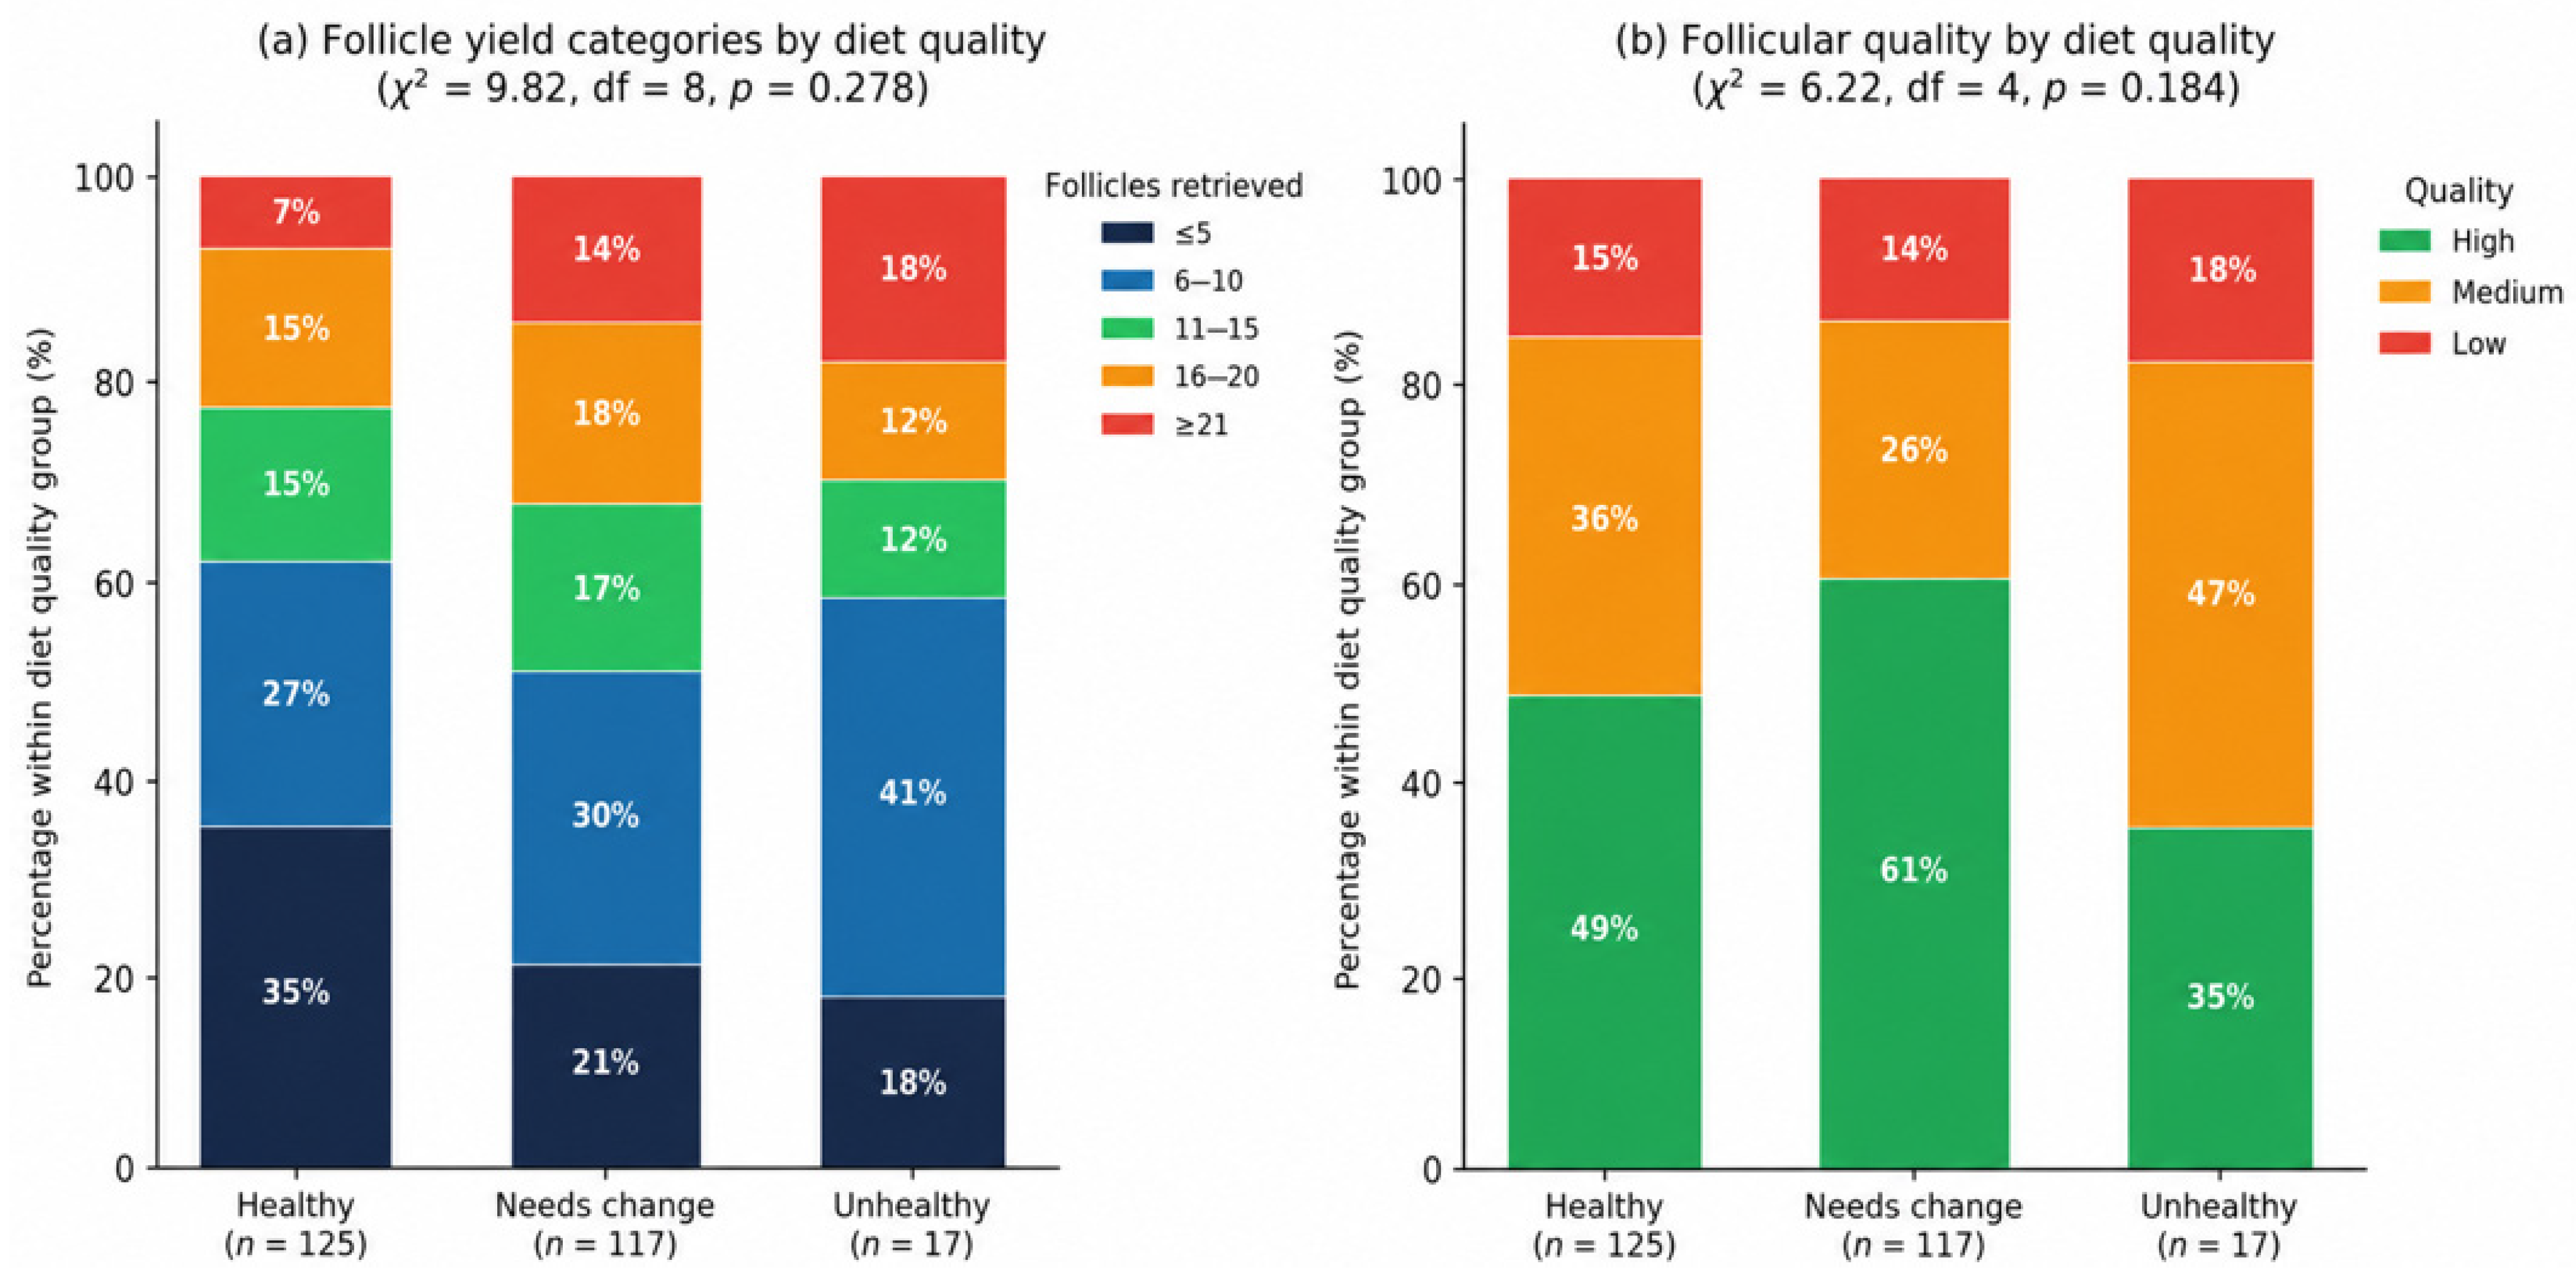
Neither BMI category nor DQI-I-based diet-quality classification was significantly associated with ART indication type (χ2 = 6.95, p = 0.643) or with follicular outcomes (follicle-yield category: χ2 = 9.82, p = 0.278; mean follicle count: ANOVA F = 1.52, p = 0.221; morphological quality: χ2 = 6.22, p = 0.184). Detailed distributions are presented in Figure 4 and Figure 5.
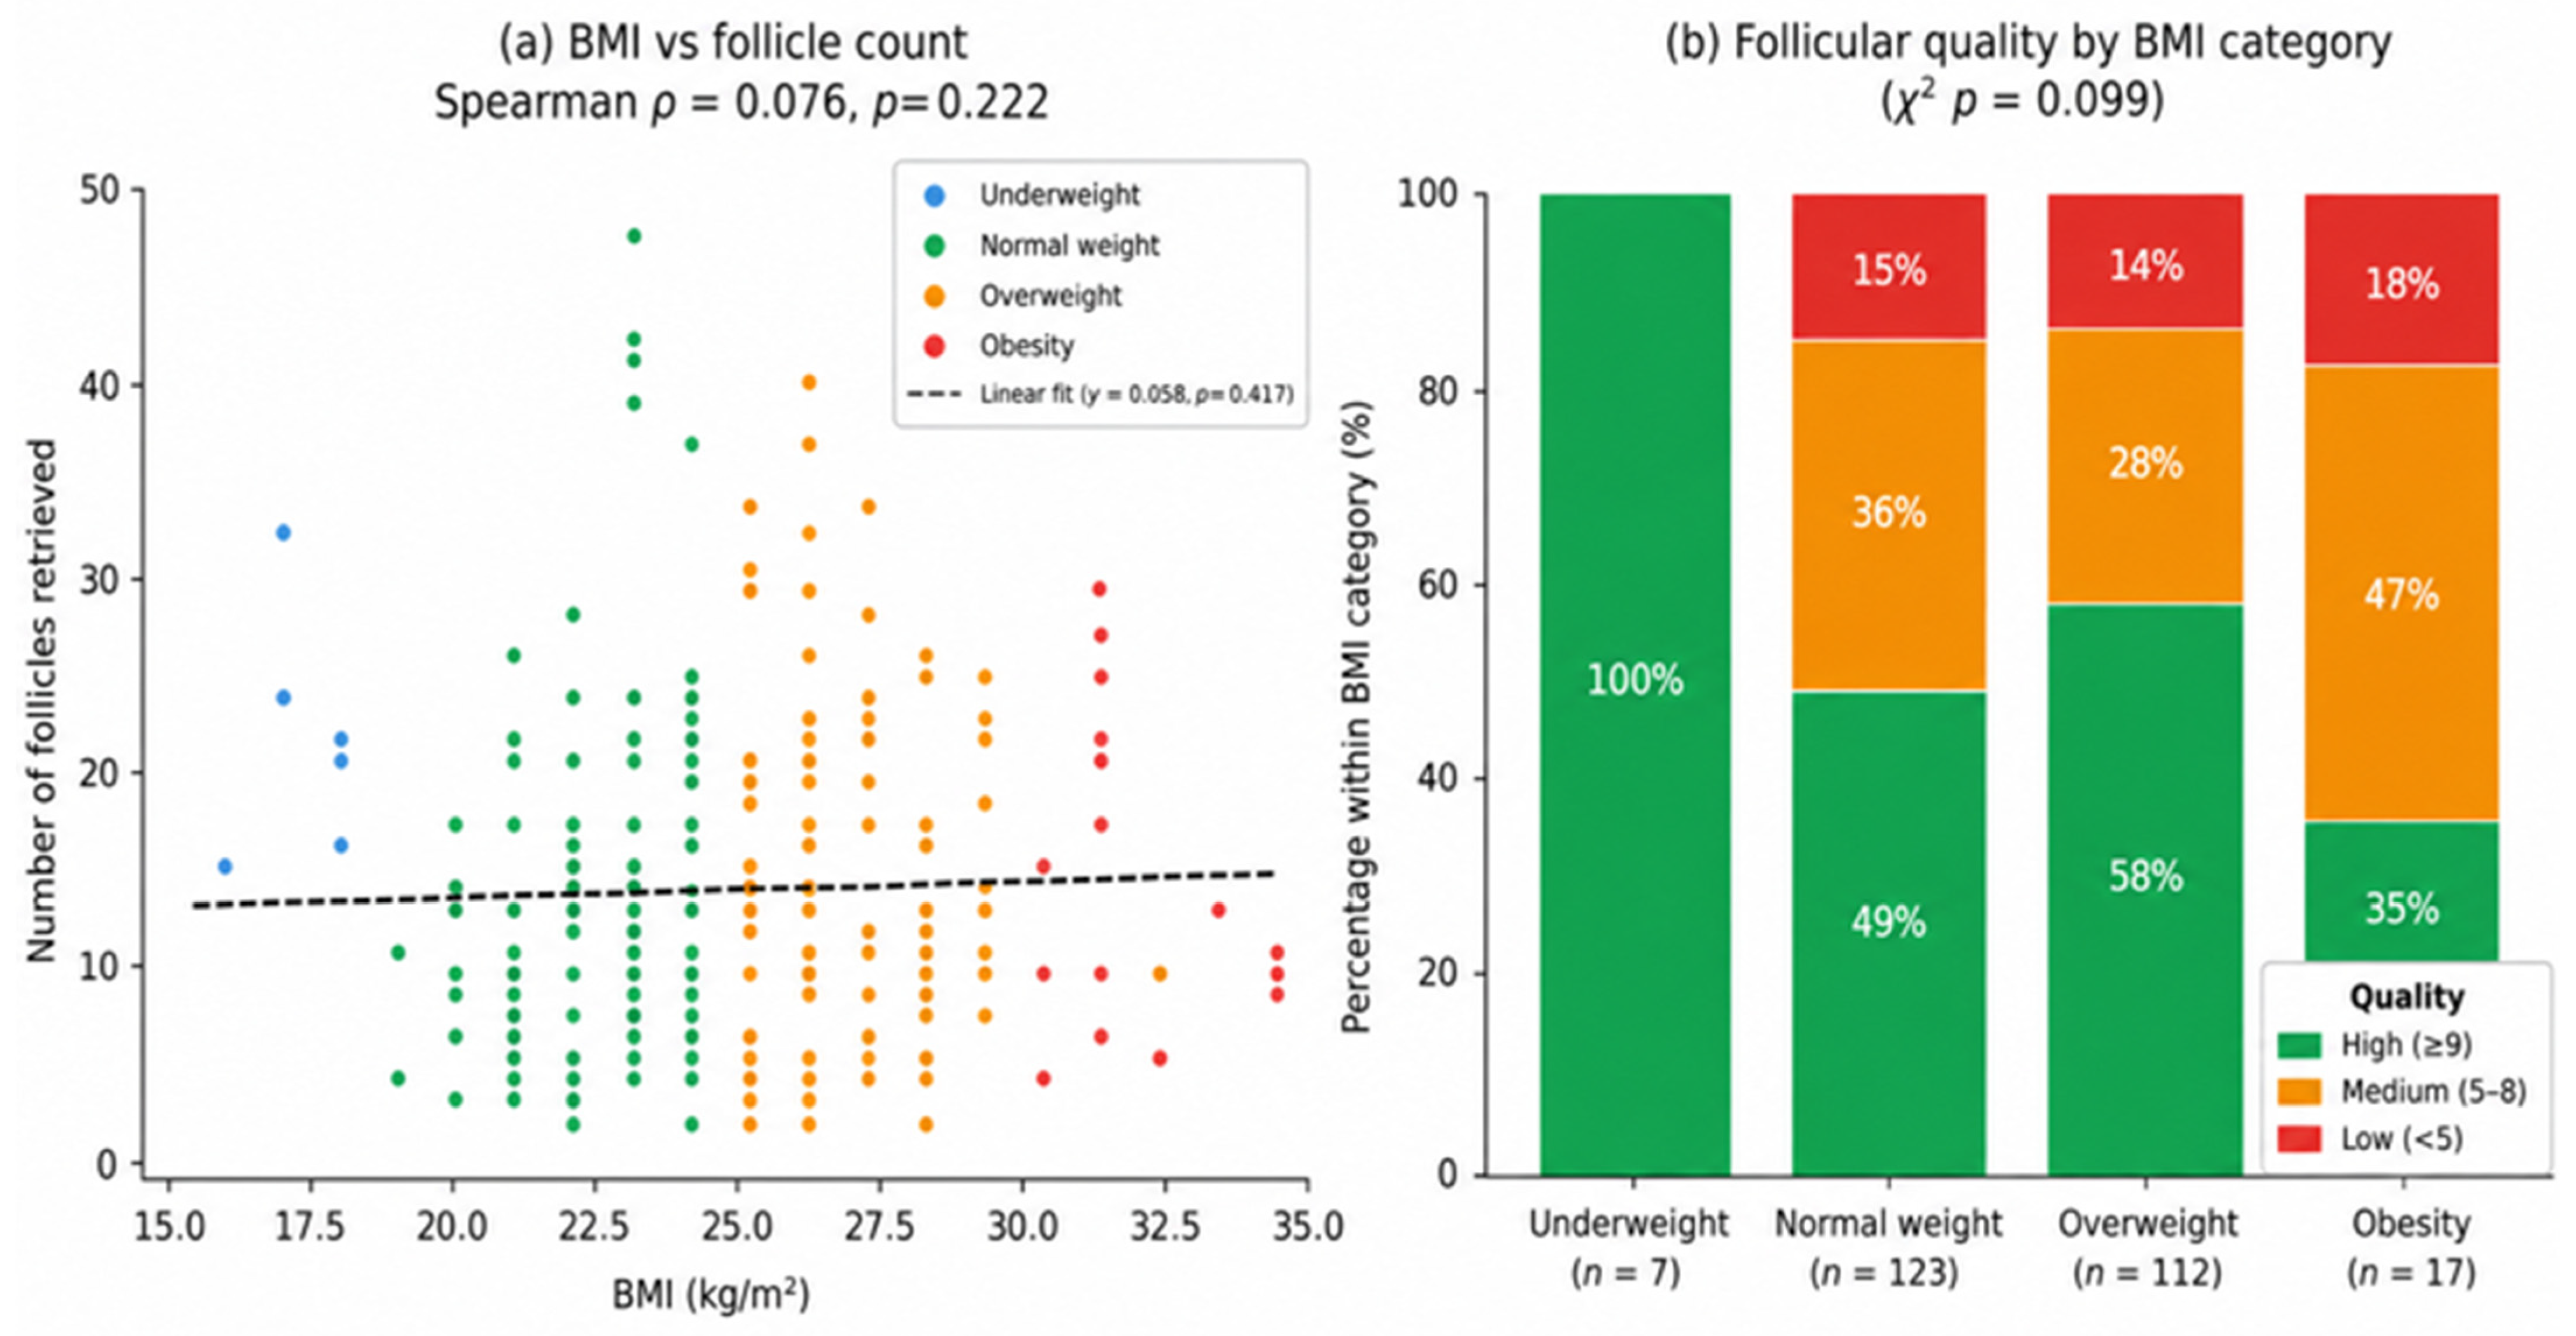
Diet quality was evaluated using the Diet Quality Index—International (DQI-I) and categorized as healthy, needs change, or unhealthy. Among the 259 participants included in the analysis, 48.3% had a healthy diet (n = 125), 45.2% required dietary changes (n = 117), and 6.6% had an unhealthy dietary pattern (n = 17). No statistically significant association was observed between diet-quality category and follicle-yield category (χ2 = 9.82, df = 8, p = 0.278), nor between diet quality and mean follicle count, as confirmed by both one-way ANOVA (F = 1.52, p = 0.221) and the Kruskal–Wallis test (H = 4.51, p = 0.105). Mean follicle counts were 9.99 ± 8.11 in the healthy-diet group, 11.78 ± 8.02 in the group requiring dietary changes, and 11.24 ± 7.19 in the unhealthy-diet group, with no significant gradient observed across categories. Similarly, diet quality was not significantly associated with morphological follicular quality (χ2 = 6.22, df = 4, p = 0.184), as illustrated in Figure 5. Collectively, these findings suggest that the categorical dietary-intake patterns captured by the DQI-I instrument were not associated with detectable differences in either the quantitative or qualitative dimensions of ovarian follicular response in this cohort. This observation is consistent with the possibility that BMI-related metabolic status, rather than diet quality itself, may represent the more proximal mediator of alterations in folliculogenesis.

3.4. Follicle Count by BMI Category

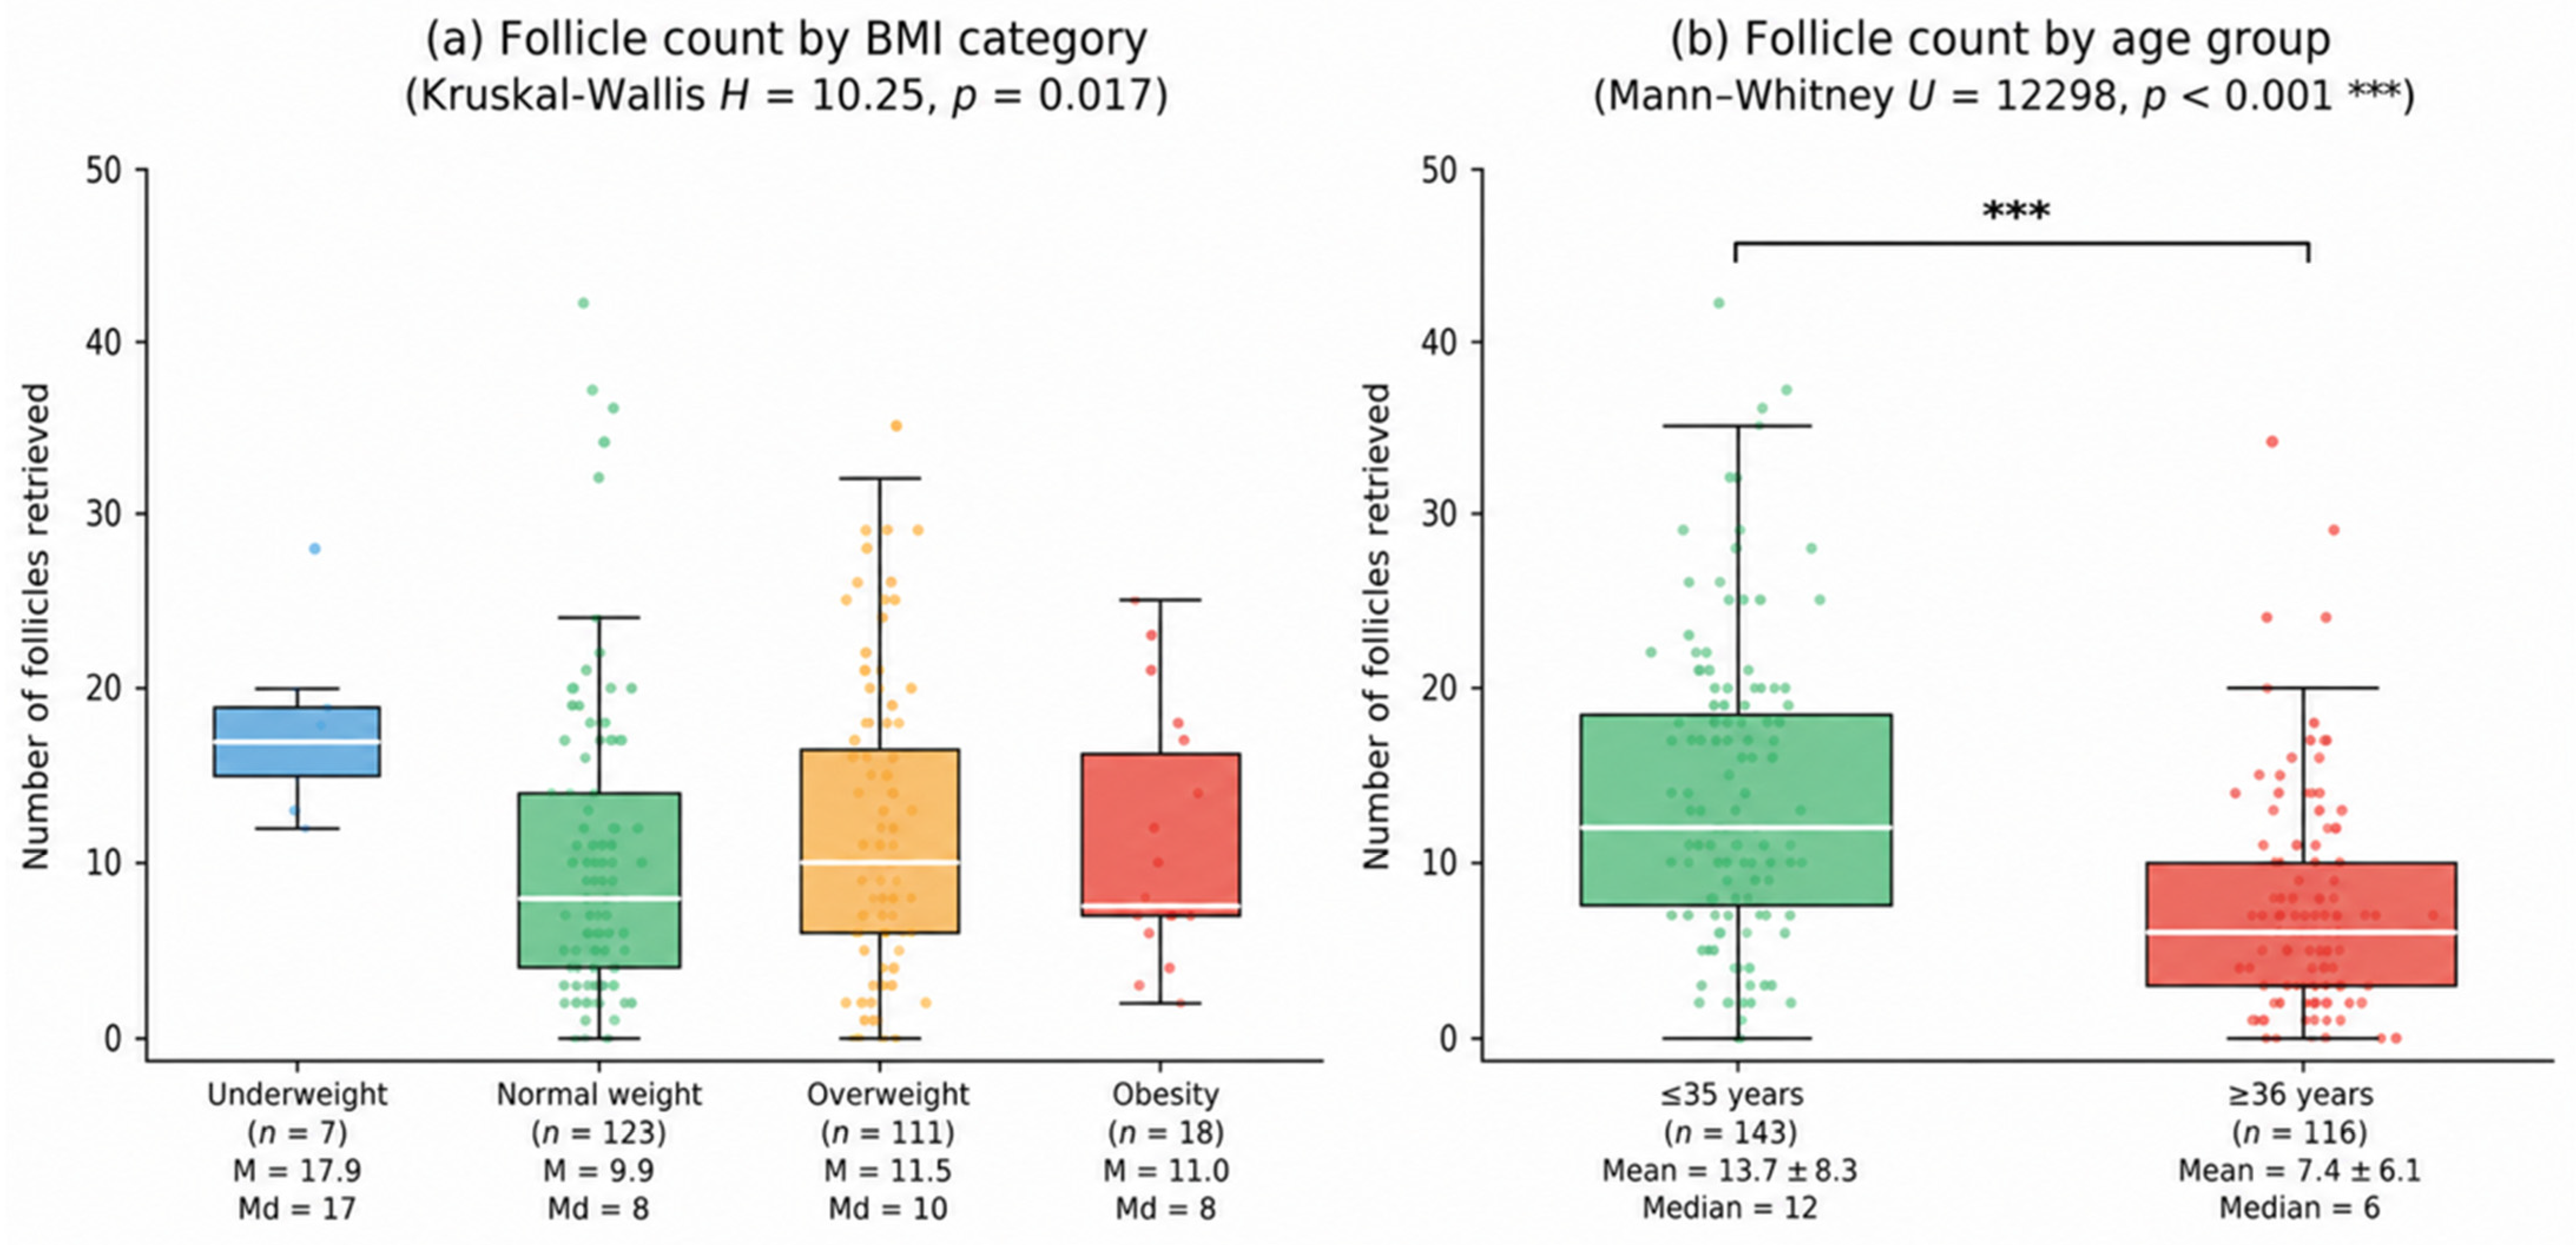
Ovarian response was evaluated using two outcomes: the number of follicles retrieved following controlled ovarian stimulation and the morphological classification of the morphological quality of the retrieved follicular complex (high, medium, or low). The number of retrieved follicles according to BMI categories is presented in Figure 6a. Mean follicle counts were 17.86 ± 5.27 among underweight participants (n = 7), 9.91 ± 8.01 in the normal-weight group (n = 123), 11.46 ± 8.13 among overweight participants (n = 112), and 11.24 ± 7.19 in the obesity group (n = 17). Because follicle-count distribution deviated significantly from normality, as confirmed by the Shapiro–Wilk test (W = 0.906, p < 0.001), between-group comparisons were primarily assessed using the nonparametric Kruskal–Wallis test. This analysis identified a statistically significant difference in follicular yield across BMI categories (H = 10.26, df = 3, p = 0.017). In contrast, one-way ANOVA yielded a borderline non-significant result (F = 2.61, p = 0.052), highlighting the importance of applying a distribution-appropriate nonparametric approach given the data’s skewness. Consistent with these omnibus analyses, the distribution of participants across follicle-yield categories (≤5, 6–10, 11–15, 16–20, and ≥21 follicles) also differed significantly according to BMI classification (χ2 = 21.46, df = 12, p = 0.044), as illustrated in Figure 6b. However, neither Pearson correlation (r = 0.030, p = 0.627) nor Spearman rank correlation (ρ = 0.076, p = 0.222) demonstrated a significant linear or monotonic association between continuous BMI values and follicle count. In a complementary stratified analysis by age category, women aged ≤ 35 years (n = 143) retrieved a significantly higher number of follicles (mean 13.7 ± 8.3; median 12) than those aged ≥ 36 years (n = 116; mean 7.4 ± 6.2; median 6). The Mann–Whitney U test confirmed this difference (U = 12,298; p < 0.001), with a large effect size (Cohen’s d = 0.844). This pattern is illustrated in Figure 6b.

3.5. Follicle Count by ART Indication

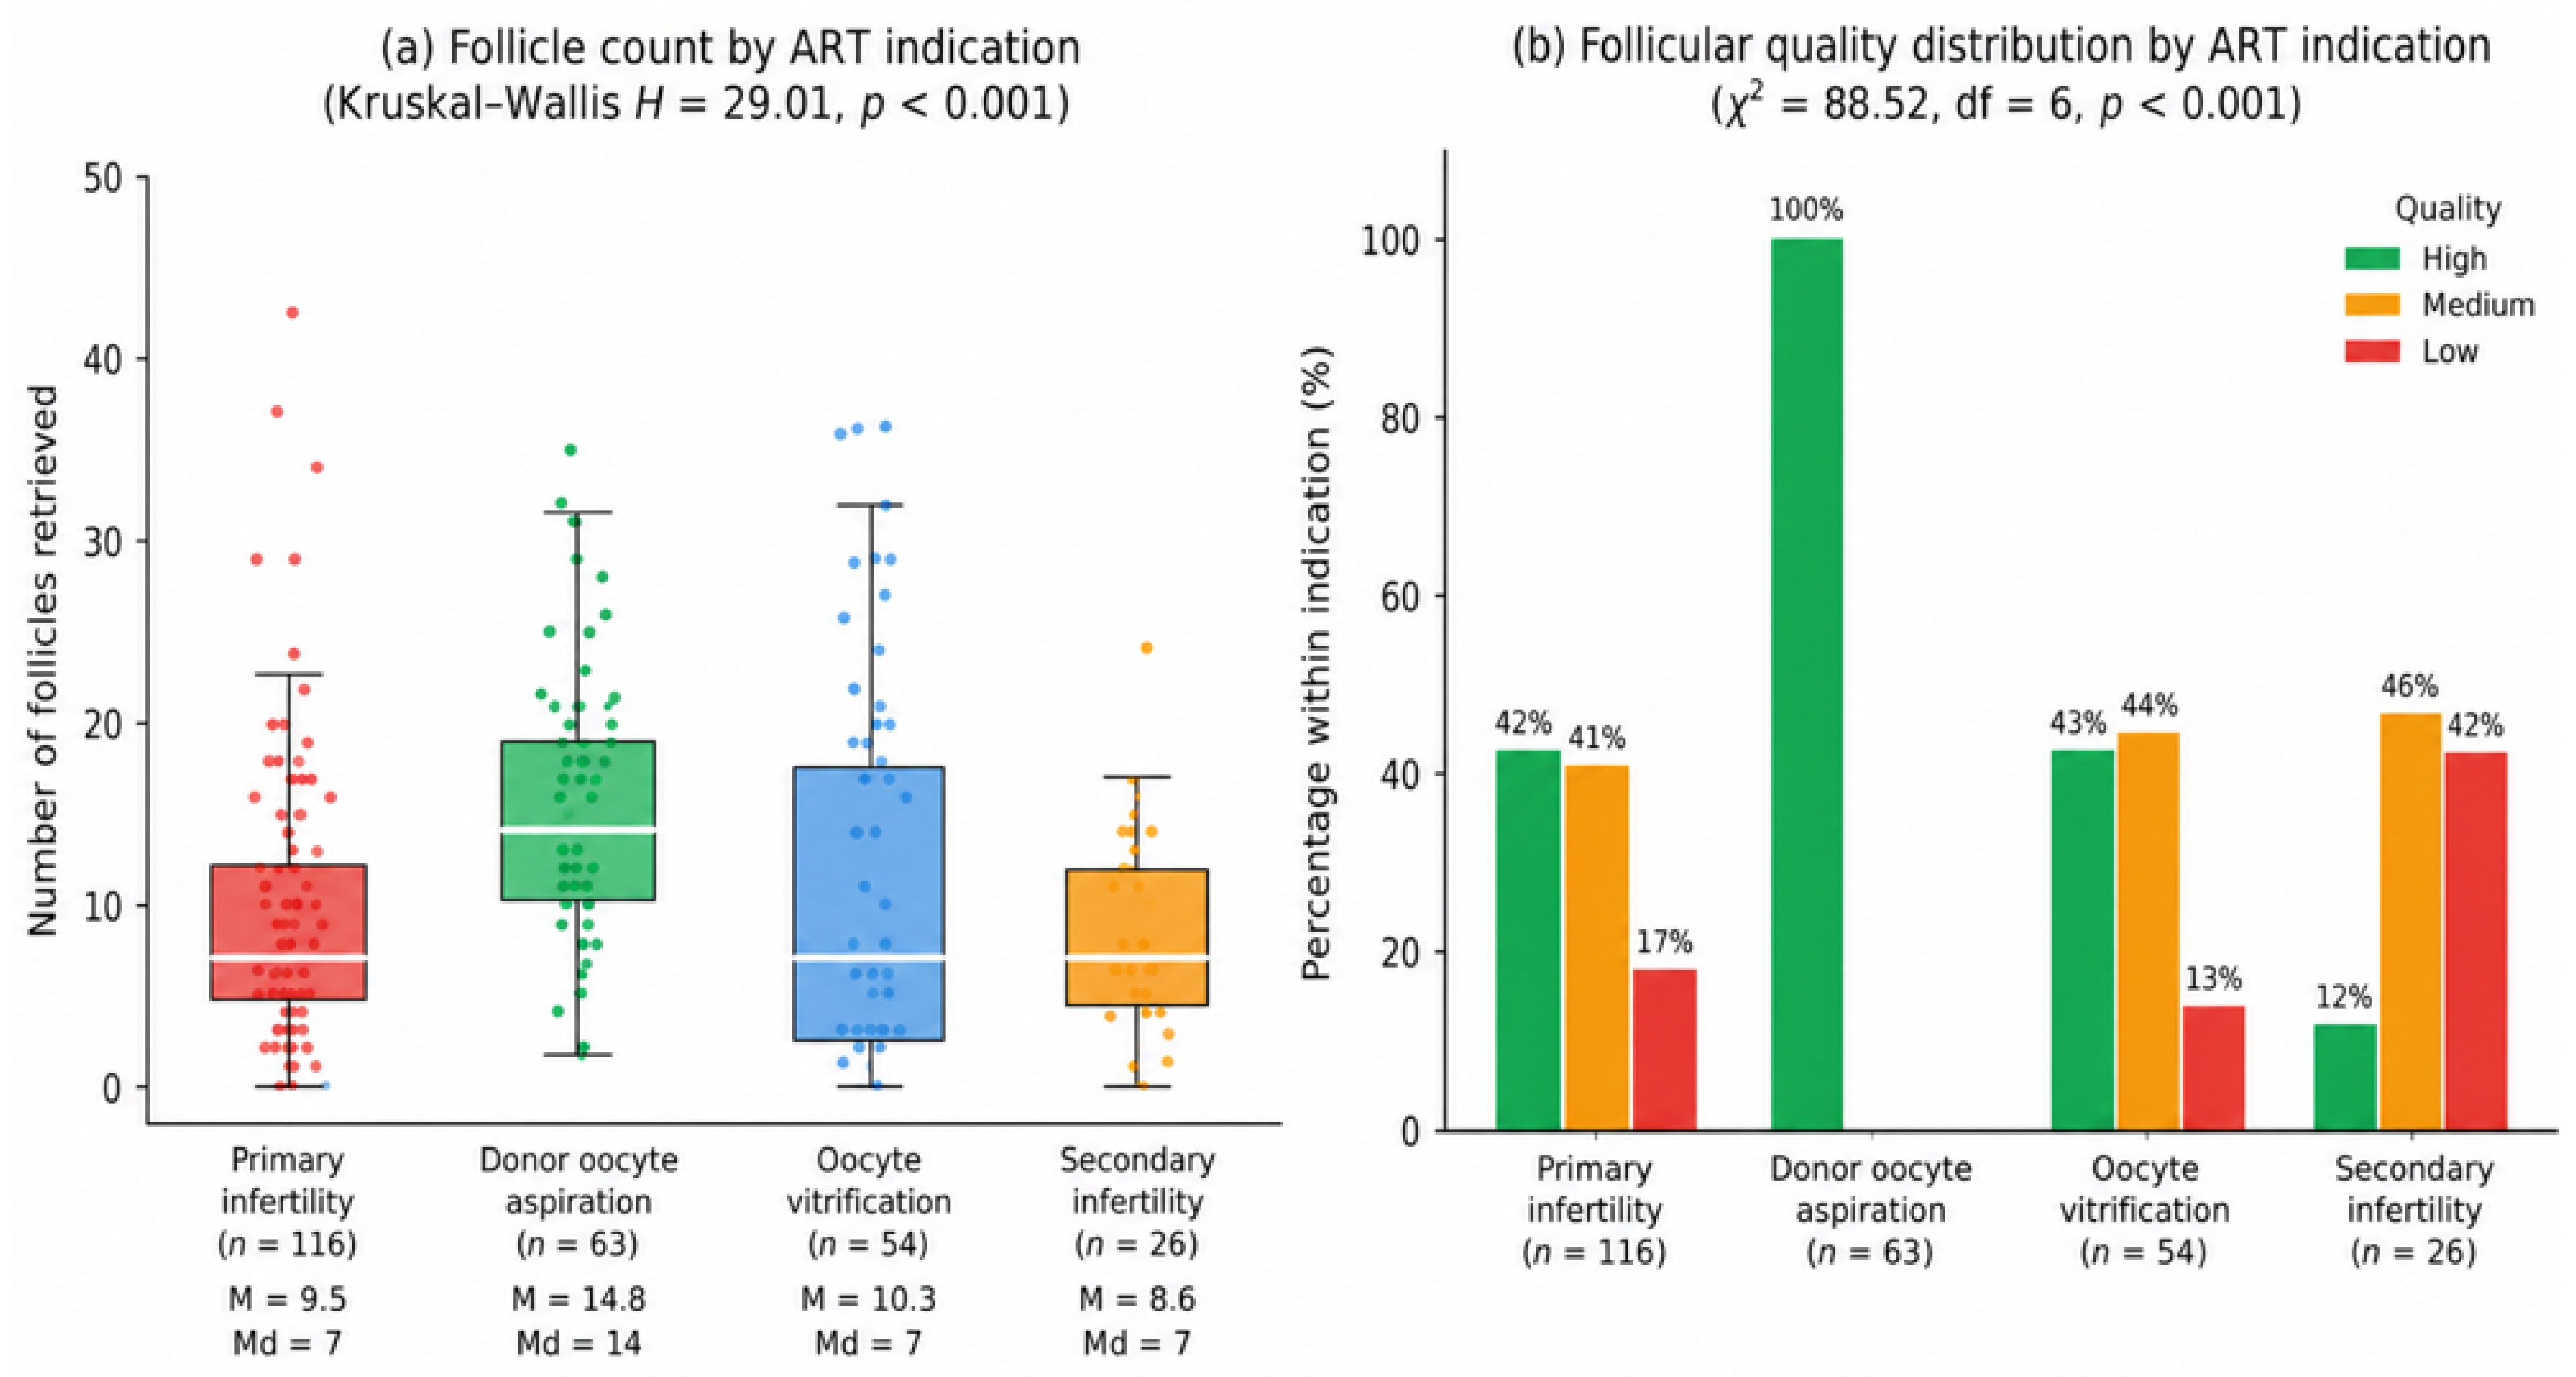
Follicular yield varied markedly and significantly across ART indication groups (Kruskal–Wallis H = 29.01, p < 0.001), as shown in Figure 7a. Donor oocyte aspiration cycles exhibited the highest mean follicle count (14.8 ± 6.9; median 16), consistent with the younger age profile and the higher stimulation targets inherent to donor protocols. Primary infertility cycles yielded a mean of 9.5 ± 7.7 follicles (median 8), secondary infertility cycles 8.6 ± 5.4 follicles (median 7), whereas oocyte vitrification cycles showed a mean of 10.3 ± 9.6 follicles (median 7). The observed gradient in follicular yield across indication groups is biologically and clinically plausible. Donor cycles typically involve younger women with preserved ovarian reserve. They are designed to maximize oocyte retrieval, whereas vitrification cycles often reflect individualized fertility-preservation decisions among women with heterogeneous ovarian reserve profiles and age-related constraints. These indication-dependent differences reinforce the importance of controlling for clinical indication in all analytical models, as it serves as a composite proxy variable that integrates age, ovarian reserve status, and stimulation objectives. The distribution of morphological follicular quality also differed significantly across ART indication groups (χ2 = 88.52, df = 6, p < 0.001; Figure 7b), driven primarily by the uniformly high-quality classification observed in donor oocyte cycles. This pattern reflects the selection of healthy, predominantly young donors with optimal ovarian profiles.

3.6. Morphological Follicular Quality

The morphological quality of the retrieved follicular complex was classified as high, medium, or low in all 259 participants. High-quality morphology was the most prevalent category, observed in 53.3% of cases (n = 138), followed by medium quality in 32.0% (n = 83) and low quality in 14.7% (n = 38). The distribution of follicular-quality grades across BMI categories did not differ significantly (χ2 = 10.67, df = 6, p = 0.099), suggesting that the overall morphological classification of follicles at retrieval was not substantially influenced by BMI category within the range observed in this cohort (Figure 8b). This apparent dissociation between BMI and morphology-based follicular quality is biologically plausible. Whereas quantitative follicular yield, which reflects earlier processes of follicular recruitment and growth, showed a significant association with BMI category (p = 0.017), morphology-based quality assessments at later developmental stages may lack sufficient sensitivity to detect more subtle metabolic alterations in the follicular microenvironment associated with increased adiposity. Important determinants of ovarian response, including gonadotropin dose, stimulation duration, baseline anti-Müllerian hormone levels, antral follicle count, and specific controlled ovarian stimulation protocols, were not available in the dataset and therefore could not be incorporated into the adjusted analyses of lipotoxicity or oxidative stress in the follicular fluid.

3.7. Multivariable Negative Binomial Regression

To identify independent predictors of follicular yield while accounting for the overdispersion inherent to count data, a multivariable negative binomial regression model was fitted, including BMI (continuous), age, and ART indication as covariates (Figure 9). Overdispersion was confirmed by the estimated dispersion parameter (alpha = 0.400; 95% CI: 0.311–0.488), supporting the use of negative binomial regression over a Poisson model. In the adjusted model, age was the only statistically significant independent predictor of follicular yield (Incidence Rate Ratio [IRR] = 0.941 per additional year of age; 95% CI: 0.920–0.963; p < 0.001), indicating that each additional year of age was associated with a 5.9% reduction in the expected follicle count after adjustment for BMI and clinical indication. In contrast, BMI did not independently predict follicular yield when age and indication were considered in the model (IRR = 1.010 per kg/m2; 95% CI: 0.983–1.036; p = 0.488). None of the ART indication contrasts relative to the reference category, donor oocyte aspiration, remained statistically significant after adjustment, suggesting that the differences in follicular yield observed across indication groups in unadjusted analyses were largely mediated by age differences between groups. Overall, model fit was acceptable (AIC = 1702.7; BIC = 1727.6). Model diagnostics supported the adequacy of the negative binomial specification. The dispersion parameter confidence interval excluded zero, confirming overdispersion. A likelihood ratio test against the equivalent Poisson model (LR = 507.0; p < 0.001) favored the negative binomial fit, and residual examination did not reveal influential observations affecting the parameter estimates. These findings indicate that chronological age and its influence on ovarian reserve are the dominant determinants of follicular response to controlled ovarian stimulation in this cohort. In contrast, the contribution of BMI, although statistically significant at the categorical level, did not remain an independent effect after adjustment for age (Table 2).

3.8. Sensitivity Analysis Excluding Donor Oocyte Cycles

To address the structural heterogeneity introduced by donor cycles, the multivariable negative binomial regression was refitted in a restricted cohort comprising only women undergoing treatment for primary infertility, secondary infertility, or oocyte vitrification (n = 196). In this sensitivity analysis, BMI remained non-significant as an independent predictor of follicle count (IRR = 1.004; 95% CI: 0.971–1.038; p = 0.823). Age retained its strong independent association, with each additional year of age associated with a 7.0% reduction in the expected follicle count (IRR = 0.930; 95% CI: 0.906–0.954; p < 0.001). Neither oocyte vitrification (IRR = 0.803; 95% CI: 0.618–1.045; p = 0.103) nor secondary infertility (IRR = 1.184; 95% CI: 0.838–1.672; p = 0.337) differed significantly from primary infertility after adjustment. The dispersion parameter (α = 0.481; 95% CI: 0.362–0.600) confirmed the appropriateness of the negative binomial specification in the restricted cohort (AIC = 1260.6; BIC = 1280.2). These results align with the primary analysis and support the robustness of the conclusion that age, rather than BMI, is the principal determinant of follicular response in this population.

4. Discussion

The central finding of this study is the discordance between unadjusted and adjusted analyses of BMI and follicular yield. Although the BMI category was significantly associated with follicular-yield distribution at the group level (Kruskal–Wallis p = 0.017), this association did not remain significant after adjustment for age and clinical indication in the negative binomial regression model. This pattern underscores a distinction that is often underappreciated in observational ART research: crude associations between anthropometric exposures and reproductive outcomes may reflect confounding by age and indication-related selection rather than independent biological effects of adiposity [28,55].
The cohort analyzed in this study was structurally heterogeneous by design, encompassing primary infertility, secondary infertility, donor oocyte aspiration, and oocyte vitrification cycles. Although this composition reflects the patient population typically encountered in a tertiary fertility center, it also introduces an important age-related confounding structure. Women undergoing donor cycles were substantially younger and consistently exhibited the highest follicular yields, whereas infertility-treatment groups were older and showed lower ovarian response. Consequently, unadjusted comparisons of follicular outcomes across BMI categories inevitably capture age-related biological effects in addition to BMI-related differences. This confounding structure underscores the importance of the multivariable regression model for disentangling the independent contributions of age, BMI, and clinical indication to follicular response [55]. To further evaluate the potential influence of donor cycles, a prespecified sensitivity analysis restricted to non-donor cycles (n = 196) was performed. The findings remained unchanged, confirming both the absence of an independent BMI effect (IRR = 1.004; p = 0.823) and the persistent dominant role of age (IRR = 0.930; p < 0.001) after exclusion of the donor subgroup (Section 3.8). These results strengthen the robustness of the primary findings and indicate that the main conclusions were not driven by the inclusion of donor cycles.
The distribution of BMI in this cohort was centered around the threshold between normal weight and overweight, with nearly half of the participants presenting BMI ≥ 25 kg/m2. This pattern is consistent with national and international epidemiological trends showing increasing rates of excess adiposity among women of reproductive age [50]. Although the BMI category was associated with the distribution of follicular yield at the group level, no significant linear or monotonic relationship was observed between continuous BMI values and follicle count. Moreover, the adjusted regression model demonstrated that BMI did not independently predict follicular yield after controlling for age and clinical indication. The principal finding of this study is the absence of an independent association between BMI and follicular yield once age and clinical indication are accounted for. Within the BMI range observed in this cohort (18.5–34.0 kg/m2, predominantly normal weight to mildly overweight), the data do not support an independent role for adiposity as a determinant of follicular response. Whether non-linear effects, threshold effects at higher BMI strata not represented in this sample, or interactions with unmeasured metabolic covariates exist remains an open question for adequately powered prospective studies. Notably, the statistically significant group-level difference was largely driven by the small underweight subgroup, which exhibited unexpectedly high follicular yields despite its limited sample size. Across the normal-weight, overweight, and obese strata, follicular counts were relatively similar, supporting the absence of a consistent BMI gradient [4,56].
From a broader clinical perspective, the management of women undergoing assisted reproductive technology (ART) must also address pregnancy-related complications in high-risk patients, particularly when excess adiposity co-occurs with other thromboembolic risk factors. Recent studies have examined the potential role of the soluble fibrin monomer complex and D-dimer as complementary laboratory markers for assessing the risk of venous thromboembolism prior to delivery in high-risk pregnancies. Although these biomarkers were not evaluated in the present study, considering them could prove relevant for future research and the multidisciplinary monitoring of high-risk pregnancies following ART [57].
The absence of an independent BMI effect after adjustment is consistent with the broader literature, which describes a complex and heterogeneous relationship between BMI and ART outcomes [4]. Although overweight and obese women often require higher gonadotropin doses [18], several observational studies have failed to detect reductions in retrieved oocyte counts or ongoing pregnancy rates once age and ovarian reserve are controlled for. A multicenter study of Chinese women with polycystic ovary syndrome reported greater FSH requirements at higher BMI but no significant reduction in retrieved oocytes [58], and retrospective European cohorts have shown that BMI-related effects on intermediate stimulation parameters are typically attenuated or eliminated after adjustment for age and ovarian reserve markers [59]. Our adjusted estimate (IRR = 1.010; 95% CI: 0.983–1.037; p = 0.488), confirmed by the sensitivity analysis excluding donor cycles (IRR = 1.004; p = 0.823), is fully aligned with this pattern and does not provide statistical support for an independent association between BMI and follicular yield within the BMI range observed in this cohort.
A particularly relevant finding of this study was the magnitude and consistency of the age effect across all analytical approaches. Women aged ≤ 35 years retrieved nearly twice as many follicles as those aged ≥ 36 years, with a large effect size (Cohen’s d = 0.860). Furthermore, the multivariable negative binomial model demonstrated that each additional year of age was independently associated with a 5.9% reduction in expected follicle count after adjustment for BMI and clinical indication. This observation is biologically coherent with the progressive depletion of the ovarian follicular pool and declining granulosa-cell responsiveness that occur during reproductive aging [10]. As women approach their late thirties, both the quantity and functional competence of recruitable follicles decline substantially, limiting responsiveness to exogenous gonadotropins regardless of BMI status. These findings reinforce the importance of prioritizing age and validated ovarian reserve markers, such as anti-Müllerian hormone and antral follicle count, as the primary framework for individualized ovarian stimulation strategies, rather than relying disproportionately on BMI-based stratification alone [36].
The absence of a significant association between BMI and morphological follicular quality may reflect the limited discriminating power of broad grading systems applied retrospectively. Standardized assessments—such as oocyte maturity staging or cumulus-cell expansion scoring—might capture metabolic perturbations in the follicular microenvironment that categorical morphology-based grading systems overlook [60]. Obesity-related mechanisms, including chronic low-grade inflammation, insulin resistance, altered adipokine signaling, and lipotoxicity, have been proposed to impair granulosa-cell steroidogenesis and disrupt follicular dynamics [17]. In parallel, studies have shown increased concentrations of triglycerides, free fatty acids, and oxidative stress markers in the follicular fluid of women with elevated adiposity, potentially compromising mitochondrial function and oocyte competence [44].
Within this dataset, no statistical evidence of a differential effect of BMI on morphological grading was detected. The mechanistic pathways outlined above, derived from external biochemical and cellular studies, are presented as contextual background and were not directly tested in the present analysis. Whether subtle metabolic perturbations remain undetected by broad morphology-based grading is a hypothesis that requires direct evaluation in studies incorporating follicular fluid biochemistry, oocyte maturity staging, or oxidative stress biomarkers.
Diet quality, evaluated using the DQI-I, was not significantly associated with follicular-yield categories, mean follicle counts, or follicular-quality grades in this cohort. Several explanations may account for this null finding. First, the DQI-I is a categorical instrument that aggregates complex dietary patterns into broad summary scores and may therefore lack the granularity required to detect nutrient-specific effects on folliculogenesis [4,56]. Second, the cohort’s dietary distribution was relatively concentrated in the healthy and needs-change categories, limiting statistical power at the unhealthy extreme of the spectrum. Third, and perhaps most importantly, the relationship between diet and ovarian response may be mediated through long-term metabolic adaptations, including insulin sensitivity, adipokine profiles, and systemic inflammation—rather than through categorical dietary patterns captured at a single time point. These findings therefore suggest that BMI-related metabolic status may be a more proximal mediator of alterations in ovarian response than diet-quality classifications alone [56].
A significant limitation of this study is the lack of information on key predictors of ovarian response, including baseline anti-Müllerian hormone (AMH) levels, antral follicle count, gonadotropin dose, ovarian stimulation protocol, and stimulation duration. Since these variables were not consistently available in the retrospective clinical records, they could not be included in the adjusted analyses. Likewise, endocrine and metabolic comorbidities were not systematically recorded, preventing their evaluation as potential confounders. Consequently, residual confounding cannot be ruled out, and the observed association between body mass index (BMI) and follicular response should be interpreted with caution. Another limitation was that the morphological quality of the retrieved follicular complex was based on routine embryological assessment performed at the study center rather than on a standardized or externally validated grading system, which may have introduced some degree of outcome misclassification. Future prospective studies incorporating standardized ovarian reserve markers, metabolic profiling, validated embryological assessments, and clinically relevant reproductive outcomes are warranted to better define the independent contribution of BMI to ovarian function and ART performance.
Several methodological strengths and limitations of this study should be considered. The use of an anonymized institutional dataset derived from real-world clinical practice provides ecological validity and reduces recall bias. The application of a multivariable negative binomial regression model, supported by confirmed overdispersion, represents a statistically robust approach for modeling follicular-count outcomes and constitutes an important methodological strength of the study. In addition, the consistent use of nonparametric analyses was justified by the confirmed non-normality of the follicular-count data and contributed to appropriate statistical inference. Nevertheless, the cross-sectional retrospective design precludes causal inference and introduces the possibility of residual confounding by unmeasured variables. Important determinants of ovarian response, including gonadotropin dose, stimulation duration, baseline anti-Müllerian hormone levels, antral follicle count, and specific controlled ovarian stimulation protocols, were not available in the dataset and therefore could not be incorporated into the adjusted analyses.
Future prospective multicenter studies incorporating standardized ovarian-reserve markers, metabolic profiling, stimulation characteristics, and competence-related reproductive outcomes, including oocyte maturity, fertilization rates, embryo development, and live birth outcomes, will be essential to better characterize the relationship between adiposity and ovarian function in Latin American ART populations.

5. Conclusions

Within the BMI range observed in this cohort, BMI showed no independent association with follicle count after adjustment, whereas age remained the primary determinant of follicular response. A sensitivity analysis excluding donor cycles confirmed this pattern. These findings should not be extrapolated to higher BMI strata not represented in this sample. Given the lack of data on key predictors of ovarian response, such as anti-Müllerian hormone, antral follicle count, gonadotropin dose, stimulation protocol, and stimulation duration, residual confounding cannot be ruled out.

Supplementary Materials

The following supporting information can be downloaded at: https://www.mdpi.com/article/10.3390/reprodmed7030035/s1. Table S1. Detailed Operational criteria used for the routine morphological assessment of retrieved follicular complexes.

Author Contributions

Conceptualization, R.Z.-V. and M.E.C.-A.; methodology, M.E.C.-A., W.D.G.-C., J.A.D.-C. and N.A.M.; software, J.I.Z. and L.S.; formal analysis, L.C.E., R.Z.-V., J.I.Z. and L.S.; investigation, M.E.C.-A., W.D.G.-C. and R.Z.-V.; data curation, J.I.Z., R.Z.-V., L.S. and L.C.E.; writing—original draft preparation, M.E.C.-A., W.D.G.-C., J.A.D.-C. and N.A.M.; writing—review and editing, L.C.E., J.I.Z., L.S. and R.Z.-V.; supervision, R.Z.-V. All authors have read and agreed to the published version of the manuscript.

Funding

This research received no external funding.

Institutional Review Board Statement

The study was conducted in accordance with the Declaration of Helsinki and approved by the Comité de Ética de Investigación en Seres Humanos de la Universidad Central del Ecuador (CEISH-UCE) (Protocol Code: 004-EXT-2025, date of approval on 18 November 2025).

Informed Consent Statement

Informed consent was obtained from all subjects involved in the study.

Data Availability Statement

The data presented in this study are available in this article.

Acknowledgments

The authors acknowledge the support received from Universidad Nacional Autónoma de Honduras (UNAH) for financing the APC of the publication.

Conflicts of Interest

The authors declare no conflicts of interest.

Abbreviations

The following abbreviations are used in this manuscript:
ARTAssisted Reproductive Technology
BMIBody Mass Index
COSControlled Ovarian Stimulation
IVFIn Vitro Fertilization
DQI-IDiet Quality Index–International
STROBEStrengthening the Reporting of Observational Studies in Epidemiology
ICSIIntracytoplasmic Sperm Injection
AMHAnti-Müllerian Hormone
AFCAntral Follicle Count

References

  1. James, W.P.T. Obesity: A Global Public Health Challenge. Clin. Chem. 2018, 64, 24–29. [Google Scholar] [CrossRef] [Scilit] [PubMed]
  2. Ahmed, B.; Konje, J.C. The epidemiology of obesity in reproduction. Best Pract. Res. Clin. Obstet. Gynaecol. 2023, 89, 102342. [Google Scholar] [CrossRef] [Scilit] [PubMed]
  3. Xie, Q.; Jiang, W.; Wei, Y.; Ni, D.; Yan, N.; Yang, Y.; Zhao, C.; Shen, R.; Ling, X. Increasing dominant follicular proportion was associated with adverse IVF/ICSI outcomes in low-prognosis women undergoing GnRH antagonist protocol: A retrospective cohort study. J. Ovarian Res. 2024, 17, 179. [Google Scholar] [CrossRef] [Scilit] [PubMed]
  4. Iavarone, I.; Mele, D.; Caprio, F.; Andreoli, G.; Vastarella, M.G.; de Franciscis, P.; Ronsini, C. Obesity may impair response to ovarian stimulation. A retrospective observational study on oocyte quality. Front. Cell Dev. Biol. 2024, 12, 1461132. [Google Scholar] [CrossRef] [Scilit] [PubMed]
  5. Liu, Y.; Lin, J.; Shen, X.; Zhu, Q.; Kuang, Y. Letrozole cotreatment improves the follicular output rate in high-body-mass-index women with polycystic ovary syndrome undergoing IVF treatment. Front. Endocrinol. 2023, 14, 1072170. [Google Scholar] [CrossRef] [Scilit] [PubMed]
  6. Luu, T.H.; Kuhn, K.; Bradford, A.P.; Wempe, M.F.; Wittenburg, L.; Johnson, R.L.; Carlson, N.E.; Kumar, T.R.; Polotsky, A.J. Effects of pulsatile intravenous follicle-stimulating hormone treatment on ovarian function in women with obesity. Fertil. Steril. 2023, 120, 890–898. [Google Scholar] [CrossRef] [Scilit] [PubMed]
  7. Liu, D.; Li, L.; Sun, N.; Zhang, X.; Yin, P.; Zhang, W.; Hu, P.; Yan, H.; Zhang, Q. Effects of body mass index on IVF outcomes in different age groups. BMC Women’s Health 2023, 23, 416. [Google Scholar] [CrossRef] [Scilit] [PubMed]
  8. Kocur, O.M.; Xie, P.; Cheung, S.; Ng, L.; De Jesus, A.; Rosenwaks, Z.; Palermo, G.D. The intricate “ART” of ICSI. J. Assist. Reprod. Genet. 2025, 42, 349–365. [Google Scholar] [CrossRef] [Scilit] [PubMed]
  9. Salari, N.; Hasheminezhad, R.; Sedighi, T.; Zarei, H.; Shohaimi, S.; Mohammadi, M. The global prevalence of sexual dysfunction in obese and overweight women: A systematic review and meta-analysis. BMC Women’s Health 2023, 23, 375. [Google Scholar] [CrossRef] [Scilit] [PubMed]
  10. Zheng, L.; Yang, L.; Guo, Z.; Yao, N.; Zhang, S.; Pu, P. Obesity and its impact on female reproductive health: Unraveling the connections. Front. Endocrinol. 2024, 14, 1326546. [Google Scholar] [CrossRef] [Scilit] [PubMed]
  11. Lonardo, M.S.; Cacciapuoti, N.; Guida, B.; Di Lorenzo, M.; Chiurazzi, M.; Damiano, S.; Menale, C. Hypothalamic-Ovarian axis and Adiposity Relationship in Polycystic Ovary Syndrome: Physiopathology and Therapeutic Options for the Management of Metabolic and Inflammatory Aspects. Curr. Obes. Rep. 2024, 13, 51–70. [Google Scholar] [CrossRef] [Scilit] [PubMed]
  12. Oldfield, A.L.; Carter, F.E.; Reeves, R.E.; Jarrett, B.Y.; Vanden Brink, H.; Lujan, M.E. Impact of a hypocaloric dietary intervention on antral follicle dynamics in eumenorrheic women with obesity. Hum. Reprod. 2024, 39, 801–811. [Google Scholar] [CrossRef] [Scilit] [PubMed]
  13. Li, X.; Li, C.; Yang, J.; Lin, M.; Zhou, X.; Su, Z.; Zhang, Y.; Li, X.; Chen, X. Associations of the levels of adipokines and cytokines in individual follicles with in vitro fertilization outcomes in women with different ovarian reserves. J. Ovarian Res. 2025, 18, 11. [Google Scholar] [CrossRef] [Scilit] [PubMed]
  14. Sfakianoudis, K.; Zikopoulos, A.; Grigoriadis, S.; Seretis, N.; Maziotis, E.; Anifandis, G.; Xystra, P.; Kostoulas, C.; Giougli, U.; Pantos, K.; et al. The Role of One-Carbon Metabolism and Methyl Donors in Medically Assisted Reproduction: A Narrative Review of the Literature. Int. J. Mol. Sci. 2024, 25, 4977. [Google Scholar] [CrossRef] [Scilit] [PubMed]
  15. He, Y.; Li, R.; Yin, J.; Yang, Z.; Wang, Y.; Chen, L.; Yang, S.; Qiao, J. Influencing of serum inflammatory factors on IVF/ICSI outcomes among PCOS patients with different BMI. Front. Endocrinol. 2023, 14, 1204623. [Google Scholar] [CrossRef] [Scilit] [PubMed]
  16. Liu, Y.; Zhao, Y.; Zhou, C.; Zhu, H.; Pan, J.; Fu, J.; Huang, H.; Lin, H.; Jin, L. Immune imbalance in the pre-ovulatory follicular microenvironment of overweight and obese women during IVF. J. Ovarian Res. 2025, 18, 23. [Google Scholar] [CrossRef] [Scilit] [PubMed]
  17. Chauvin, S. Role of Granulosa Cell Dysfunction in Women Infertility Associated with Polycystic Ovary Syndrome and Obesity. Biomolecules 2025, 15, 923. [Google Scholar] [CrossRef] [Scilit] [PubMed]
  18. Ruiz-González, D.; Cavero-Redondo, I.; Hernández-Martínez, A.; Baena-Raya, A.; Martínez-Forte, S.; Altmäe, S.; Fernández-Alonso, A.M.; Soriano-Maldonado, A. Comparative efficacy of exercise, diet and/or pharmacological interventions on BMI, ovulation, and hormonal profile in reproductive-aged women with overweight or obesity: A systematic review and network meta-analysis. Hum. Reprod. Update 2024, 30, 472–487. [Google Scholar] [CrossRef] [Scilit] [PubMed]
  19. Kim, J.J. Obesity and Polycystic Ovary Syndrome. JOMES 2024, 33, 289–301. [Google Scholar] [CrossRef] [Scilit] [PubMed]
  20. Childs, G.V.; Odle, A.K.; MacNicol, M.C.; MacNicol, A.M. The Importance of Leptin to Reproduction. Endocrinology 2020, 162, bqaa204. [Google Scholar] [CrossRef] [Scilit] [PubMed]
  21. Yong, W.; Wang, J.; Leng, Y.; Li, L.; Wang, H. Role of Obesity in Female Reproduction. Int. J. Med. Sci. 2023, 20, 366–375. [Google Scholar] [CrossRef] [Scilit] [PubMed]
  22. Su, W.; Zhang, L.; Cheng, J.; Fu, Y.; Zhao, J.; Chen, H. Impact of BMI on pregnancy outcomes in PCOS patients undergoing ultralong GnRH—A protocol with blastocyst transfer. Eur. J. Med. Res. 2025, 30, 849. [Google Scholar] [CrossRef] [Scilit] [PubMed]
  23. Ren, Y.; Yang, C.; Tian, T.; Li, R.; Wang, L.; Zhen, X. Effect of body mass index on pregnancy outcomes in young women with low-prognosis POSEIDON criteria after in vitro fertilization/intracytoplasmic sperm injection. J. Ovarian Res. 2025, 18, 59. [Google Scholar] [CrossRef] [Scilit] [PubMed]
  24. Richard, S.; Zhou, Y.; Jasoni, C.L.; Pankhurst, M.W. Ovarian follicle size or growth rate can both be determinants of ovulatory follicle selection in mice. Biol. Reprod. 2023, 110, 130–139. [Google Scholar] [CrossRef] [Scilit] [PubMed]
  25. Carosso, A.R.; Revelli, A.; Ruffa, A.; Carosso, M.; Contangelo, G.; Benedetto, C.; Gennarelli, G. Impact of Body Fat Distribution and Insulin Sensitivity on In Vitro Fertilization Outcomes: A Prospective Observational Study. J. Clin. Med. 2025, 14, 3848. [Google Scholar] [CrossRef] [Scilit] [PubMed]
  26. Houston, E.J.; Templeman, N.M. Reappraising the relationship between hyperinsulinemia and insulin resistance in PCOS. J. Endocrinol. 2025, 265, e240269. [Google Scholar] [CrossRef] [Scilit] [PubMed]
  27. Poretsky, L.; Yeshua, A.; Cantor, T.; Avtanski, D.; Stojchevski, R.; Ziskovich, K.; Singer, T. The effects of irisin and leptin on steroidogenic enzyme gene expression in human granulosa cells: In vitro studies. Metab. Open 2023, 17, 100230. [Google Scholar] [CrossRef] [Scilit] [PubMed]
  28. Oldfield, A.L.; Vanden Brink, H.; Carter, F.E.; Jarrett, B.Y.; Lujan, M.E. Obesity is associated with alterations in antral follicle dynamics in eumenorrheic women. Hum. Reprod. 2023, 38, 459–470. [Google Scholar] [CrossRef] [Scilit] [PubMed]
  29. Vale-Fernandes, E.; Moreira, M.V.; Bernardino, R.L.; Sousa, D.; Brandão, R.; Leal, C.; Barreiro, M.; Monteiro, M.P. Polycystic ovary syndrome and excessive body weight impact independently and synergically on fertility treatment outcomes. Reprod. Biol. Endocrinol. 2025, 23, 97. [Google Scholar] [CrossRef] [Scilit] [PubMed]
  30. Gambini, S.; Sonigo, C.; Robin, G.; Cedrin-Durnerin, I.; Vinolas, C.; Sifer, C.; Boumerdassi, Y.; Mayeur, A.; Gallot, V.; Grynberg, M.; et al. Risk factors for poor oocyte yield and oocyte immaturity after GnRH agonist triggering. Hum. Reprod. 2024, 39, 963–973. [Google Scholar] [CrossRef] [Scilit] [PubMed]
  31. Ribeiro, L.M.; Sasaki, L.M.P.; Silva, A.A.; Souza, E.S.; Oliveira Lyrio, A.; Figueiredo, A.C.M.G.; Gottems, L.B.D. Overweight, obesity and assisted reproduction: A systematic review and meta-analysis. Eur. J. Obstet. Gynecol. Reprod. Biol. 2022, 271, 117–127. [Google Scholar] [CrossRef] [Scilit] [PubMed]
  32. Broughton, D.E.; Moley, K.H. Obesity and female infertility: Potential mediators of obesity’s impact. Fertil. Steril. 2017, 107, 840–847. [Google Scholar] [CrossRef] [Scilit] [PubMed]
  33. Gonzalez, M.B.; Robker, R.L.; Rose, R.D. Obesity and oocyte quality: Significant implications for ART and emerging mechanistic insights. Biol. Reprod. 2021, 106, 338–350. [Google Scholar] [CrossRef] [Scilit] [PubMed]
  34. Rittenberg, V.; Seshadri, S.; Sunkara, S.K.; Sobaleva, S.; Oteng-Ntim, E.; El-Toukhy, T. Effect of body mass index on IVF treatment outcome: An updated systematic review and meta-analysis. Reprod. Biomed. Online 2011, 23, 421–439. [Google Scholar] [CrossRef] [Scilit] [PubMed]
  35. Machtinger, R.; Combelles, C.M.; Missmer, S.A.; Correia, K.F.; Fox, J.H.; Racowsky, C. The association between severe obesity and characteristics of failed fertilized oocytes. Hum. Reprod. 2012, 27, 3198–3207. [Google Scholar] [CrossRef] [Scilit] [PubMed]
  36. Jungheim, E.S.; Schon, S.B.; Schulte, M.B.; DeUgarte, D.A.; Fowler, S.A.; Tuuli, M.G. IVF outcomes in obese donor oocyte recipients: A systematic review and meta-analysis. Hum. Reprod. 2013, 28, 2720–2727. [Google Scholar] [CrossRef] [Scilit] [PubMed]
  37. Provost, M.P.; Acharya, K.S.; Acharya, C.R.; Yeh, J.S.; Steward, R.G.; Eaton, J.L.; Goldfarb, J.M.; Muasher, S.J. Pregnancy outcomes decline with increasing body mass index: Analysis of 239,127 fresh autologous in vitro fertilization cycles from the 2008–2010 Society for Assisted Reproductive Technology registry. Fertil. Steril. 2016, 105, 663–669. [Google Scholar] [CrossRef] [Scilit] [PubMed]
  38. Tian, Y.; Wang, A.; Li, F.; Wang, S.; Shang, J.; Zhang, K.; Bai, X. Fatty acid metabolism of granulose cells and follicular fluid and their associations with embryo quality in normal-weight women with PCOS. J. Ovarian Res. 2025, 18, 130. [Google Scholar] [CrossRef] [Scilit] [PubMed]
  39. Luti, S.; Fiaschi, T.; Magherini, F.; Modesti, P.A.; Piomboni, P.; Semplici, B.; Morgante, G.; Amoresano, A.; Illiano, A.; Pinto, G.; et al. Follicular microenvironment: Oxidative stress and adiponectin correlated with steroids hormones in women undergoing in vitro fertilization. Mol. Reprod. Dev. 2021, 88, 175–184. [Google Scholar] [CrossRef] [Scilit] [PubMed]
  40. Chen, Y.; Yang, J.; Zhang, L. The Impact of Follicular Fluid Oxidative Stress Levels on the Outcomes of Assisted Reproductive Therapy. Antioxidants 2023, 12, 2117. [Google Scholar] [CrossRef] [Scilit] [PubMed]
  41. Begum, I.A. Oxidative stress: Oocyte quality and infertility. Reprod. Toxicol. 2025, 137, 109011. [Google Scholar] [CrossRef] [Scilit] [PubMed]
  42. Leary, C.; Leese, H.J.; Sturmey, R.G. Human embryos from overweight and obese women display phenotypic and metabolic abnormalities. Hum. Reprod. 2015, 30, 122–132. [Google Scholar] [CrossRef] [Scilit] [PubMed]
  43. Korkmaz, O.; Karabulut, S.; Macit, P.; Cakici, C. Follicular fluid oxidative stress and antioxidant defense in relation to maternal age, ovarian reserve, and in vitro fertilization outcomes. Free Radic. Res. 2026, 60, 147–156. [Google Scholar] [CrossRef] [Scilit] [PubMed]
  44. Wang, T.; Xu, P.; Yuan, J.; Chen, H.; Guo, X.; Gao, J.; Wang, Y.; Yao, D.; Li, X.; Liu, B.; et al. Mitochondrial dysfunction in oocytes: Implications for fertility and ageing. J. Ovarian Res. 2025, 18, 186. [Google Scholar] [CrossRef] [Scilit] [PubMed]
  45. Luke, B.; Brown, M.B.; Stern, J.E.; Missmer, S.A.; Fujimoto, V.Y.; Leach, R. Female obesity adversely affects assisted reproductive technology (ART) pregnancy and live birth rates. Hum. Reprod. 2011, 26, 245–252. [Google Scholar] [CrossRef] [Scilit] [PubMed]
  46. Silvestris, E.; de Pergola, G.; Rosania, R.; Loverro, G. Obesity as disruptor of the female fertility. Reprod. Biol. Endocrinol. 2018, 16, 22. [Google Scholar] [CrossRef] [Scilit] [PubMed]
  47. Ovarian Stimulation, T.; Bosch, E.; Broer, S.; Griesinger, G.; Grynberg, M.; Humaidan, P.; Kolibianakis, E.; Kunicki, M.; La Marca, A.; Lainas, G.; et al. ESHRE guideline: Ovarian stimulation for IVF/ICSI. Hum. Reprod. Open 2020, 2020, hoaa009. [Google Scholar] [CrossRef] [Scilit] [PubMed]
  48. Ko, Y.R.; Kim, M.K.; Kim, J.W.; Han, E.J.; Kim, S.J.; Park, J.K.; Ahn, S.Y.; Lee, M.; Oh, S.; Hwang, S.; et al. Impact of obesity on follicular fluid lipid composition and IVF/ICSI outcomes in Korean women: A lipidomic study. PLoS ONE 2025, 20, e0324511. [Google Scholar] [CrossRef] [Scilit] [PubMed]
  49. Iorio, G.G.; Conforti, A.; Vallone, R.; Carbone, L.; Matarazzo, M.; De Rosa, A.; De Rosa, P.; Picarelli, S.; Fedele, F.; Perruolo, G.; et al. Reproductive function of long-term treated patients with hepatic onset of Wilson’s disease: A prospective study. Reprod. Biomed. Online 2021, 42, 835–841. [Google Scholar] [CrossRef] [Scilit] [PubMed]
  50. Li, Y.-L.; Yan, E.-Q.; Zhao, G.-N.; Jin, L.; Ma, B.-X. Effect of body mass index on ovarian reserve and ART outcomes in infertile women: A large retrospective study. J. Ovarian Res. 2024, 17, 195. [Google Scholar] [CrossRef] [Scilit] [PubMed]
  51. Zarezadeh, R.; Nouri, M.; Hamdi, K.; Shaaker, M.; Mehdizadeh, A.; Darabi, M. Fatty acids of follicular fluid phospholipids and triglycerides display distinct association with IVF outcomes. Reprod. Biomed. Online 2021, 42, 301–309. [Google Scholar] [CrossRef] [Scilit] [PubMed]
  52. Chang, Q.; Wang, S.; Mai, Q.; Zhou, C. Impact of obesity on proteomic profiles of follicular fluid-derived small extracellular vesicles: A comparison between PCOS and non-PCOS women. J. Ovarian Res. 2025, 18, 121. [Google Scholar] [CrossRef] [Scilit] [PubMed]
  53. WHO Consultation. Obesity: Preventing and managing the global epidemic. Report of a WHO consultation. World Health Organ. Tech. Rep. Ser. 2000, 894, i–xii, 1–253. [Google Scholar] [PubMed]
  54. Zegers-Hochschild, F.; Adamson, G.D.; Dyer, S.; Racowsky, C.; de Mouzon, J.; Sokol, R.; Rienzi, L.; Sunde, A.; Schmidt, L.; Cooke, I.D.; et al. The International Glossary on Infertility and Fertility Care, 2017. Hum. Reprod. 2017, 32, 1786–1801. [Google Scholar] [CrossRef] [Scilit] [PubMed]
  55. Moslehi, N.; Shab-Bidar, S.; Ramezani Tehrani, F.; Mirmiran, P.; Azizi, F. Is ovarian reserve associated with body mass index and obesity in reproductive aged women? A meta-analysis. Menopause 2018, 25, 1046–1055. [Google Scholar] [CrossRef] [Scilit] [PubMed]
  56. Ziaei, R.; Ghasemi-Tehrani, H.; Movahedi, M.; Kalatehjari, M.; Vajdi, M.; Mokari-Yamchi, A.; Elyasi, M.; Ghavami, A. The association between Diet Quality Index–International score and risk of diminished ovarian reserve: A case–control study. Front. Nutr. 2023, 10, 1277311. [Google Scholar] [CrossRef] [Scilit] [PubMed]
  57. Vuong, A.D.B.; Tran, N.H.; Pham, T.H.; Le, H.A.M.; Nguyen, P.N. Soluble Fibrin Monomer Complex and D-Dimer Concentrations Between Patients at Low and High Risk of Venous Thromboembolism Before Delivery According to RCOG Score Assessment: An Observational Study Among 100 Third-Trimester Vietnamese Pregnancies. J. Clin. Med. 2025, 14, 1399. [Google Scholar] [CrossRef] [Scilit] [PubMed]
  58. Sheng, Y.; Lu, G.; Liu, J.; Liang, X.; Ma, Y.; Zhang, X.; Zhang, S.; Sun, Y.; Sun, Y.; Chen, W.; et al. Effect of body mass index on the outcomes of controlled ovarian hyperstimulation in Chinese women with polycystic ovary syndrome: A multicenter, prospective, observational study. J. Assist. Reprod. Genet. 2017, 34, 61–70. [Google Scholar] [CrossRef] [Scilit] [PubMed]
  59. Aguiar, A. The Influence of Female Body Mass Index on Ovarian Stimulation Efficiency, Embryo Quality, and Reproductive Outcomes: A Retrospective Cohort Study from a Tertiary Care Center. J. Reprod. Med. Gynaecol. Obstet. 2025, 10, 1–8. [Google Scholar] [CrossRef] [Scilit] [PubMed]
  60. Field, S.L.; Dasgupta, T.; Cummings, M.; Orsi, N.M. Cytokines in ovarian folliculogenesis, oocyte maturation and luteinisation. Mol. Reprod. Dev. 2014, 81, 284–314. [Google Scholar] [CrossRef] [Scilit] [PubMed]
Figure 1. Study selection and analytical framework for the analytical sample (n = 259).
Reprodmed 07 00035 g001
Figure 2. Distribution of baseline characteristics in the study cohort (n = 259): (a) age category and (b) clinical indications for assisted reproduction procedures.
Reprodmed 07 00035 g002
Figure 3. Histogram of BMI (kg/m2), showing the frequency distribution in the study cohort with an overlaid reference normal curve.
Reprodmed 07 00035 g003
Figure 4. Distribution of assisted reproductive technology (ART) indications by BMI category (n = 259). Each BMI group displays both the proportional representation of clinical indications (left sub-bar, %) and the absolute counts (right sub-bar, n). Indications are color-coded: primary infertility (red), donor oocyte aspiration (green), oocyte vitrification (blue), and secondary infertility (orange). The chi-square test of independence showed no significant association between BMI category and ART indication (χ2 = 6.95, df = 9, p = 0.642). ART, assisted reproductive technology; BMI, body mass index.
Reprodmed 07 00035 g004
Figure 5. Follicular results according to diet quality category (n = 259): (a) follicle yield categories by diet quality and (b) morphological quality of the retrieved follicular complex by diet quality.
Reprodmed 07 00035 g005
Figure 6. Follicle count according to BMI category and age group (n = 259). Boxplots show the median, interquartile range (IQR), 1.5 × IQR whiskers, and overlaid individual data points: (a) Follicle count according to BMI category. (b) Follicle count according to age group (≤35 vs. ≥36 years).
Reprodmed 07 00035 g006
Figure 7. Follicle count and follicular-quality distribution according to ART indication (n = 259): (a) Boxplots of retrieved follicle counts stratified by ART clinical indication, with overlaid individual data points (Kruskal–Wallis H = 29.01, df = 3, p < 0.001). (b) Proportional distribution of morphological follicular quality (high, medium, low) within each ART indication group, presented as grouped bar charts. Percentages were calculated within each indication category (χ2 = 88.52, df = 6, p < 0.001). ART, assisted reproductive technology; M, mean; Md, median.
Reprodmed 07 00035 g007
Figure 8. Relationship between BMI and follicular outcomes: scatterplot and morphological-quality distribution (n = 259): (a) Scatterplot of BMI (kg/m2) versus retrieved follicle count. Data points are color-coded according to BMI category: underweight (blue), normal weight (green), overweight (orange), and obesity (red). The dashed line represents the ordinary least-squares linear regression fit. (b) Proportional distribution of morphological follicular quality (high, medium, and low) across BMI categories, presented as 100% stacked bar charts. Percentage values are displayed within segments when ≥8%.
Reprodmed 07 00035 g008
Figure 9. Proportional distribution of follicular-yield categories according to BMI classification (n = 259). Each bar represents the percentage of participants within a given BMI category distributed across predefined follicular-yield intervals: ≤5, 6–10, 11–15, 16–20, and ≥21 follicles, color-coded from darkest (≤5) to brightest (≥21). Percentage values are displayed within segments when ≥7%.
Reprodmed 07 00035 g009
Table 1. Baseline characteristics of the study population (n = 259).
VariableTotal (n = 259)
Age (years)32.78 ± 6.31
Height (m)1.58 ± 0.05
Weight (kg)61.53 ± 8.75
Body mass index (kg/m2)24.67 ± 3.18
Waist circumference (cm)84.29 ± 7.11
Abdominal circumference (cm)85.24 ± 7.08
Hip circumference (cm)107.57 ± 8.22
Waist-to-hip ratio0.784 ± 0.044
Waist-to-height ratio0.535 ± 0.049
Table 2. Unadjusted (univariable) and adjusted (multivariable) negative binomial regression models for the number of retrieved follicles (n = 259). Unadjusted models include each predictor separately; the adjusted model includes BMI, age, and ART indication simultaneously. IRR, incidence rate ratio; CI, confidence interval; AIC, Akaike information criterion; BIC, Bayesian information criterion.
PredictorUnadjusted IRR (95% CI)pAdjusted IRR (95% CI)p
BMI (per kg/m2)1.007 (0.978–1.037)0.6431.010 (0.983–1.037)0.488
Age (per year)0.952 (0.939–0.966)<0.0010.941 (0.920–0.962)<0.001
ART indication (ref: donor oocyte aspiration)
 Primary infertility0.645 (0.515–0.808)<0.0011.202 (0.882–1.636)0.244
 Oocyte vitrification0.699 (0.535–0.914)0.0091.006 (0.750–1.349)0.969
 Secondary infertility0.580 (0.412–0.817)0.0021.351 (0.864–2.115)0.187
Dispersion parameter (α)0.400 (0.311–0.488)
AIC/BIC (adjusted model)1702.7/1727.6
Disclaimer/Publisher’s Note: The statements, opinions and data contained in all publications are solely those of the individual author(s) and contributor(s) and not of MDPI and/or the editor(s). MDPI and/or the editor(s) disclaim responsibility for any injury to people or property resulting from any ideas, methods, instructions or products referred to in the content.