Article

Echocardiographic Diagnosis of Postcapillary Pulmonary Hypertension: A RIGHT1 Substudy

1
Department of Medical Sciences, Division of Internal Medicine, Hypertension Unit, University Hospital ‘S. Giovanni Battista’, University of Torino, 10126 Torino, Italy
2
Hemodynamic Laboratory, Division of Cardiology, Department of Medical Sciences, AOU Città Salute e Scienza of Turin, University of Turin, 10126 Torino, Italy
*
Author to whom correspondence should be addressed.
Corrado Magnino and Andrea Iannaccone contributed equally to this work.
Hearts 2020, 1(2), 38-49; https://doi.org/10.3390/hearts1020006
Submission received: 4 June 2020 / Revised: 21 July 2020 / Accepted: 27 July 2020 / Published: 29 July 2020

Abstract

:
Background: Pulmonary hypertension is observed in 70% of patients with left ventricular (LV) dysfunction. Right heart catheterization is the gold standard for a complete evaluation of Pulmonary Hypertension (PH); however, echocardiography represents a powerful initial diagnostic tool. The aim of our study was to evaluate the accuracy of echocardiography for the diagnosis of postcapillary PH, i.e., due to increased left ventricular filling pressures. Methods and Results: We recruited patients with a diagnosis of PH from the RIGHT1 study (Right heart invasive and echocardiographic hemodynamic evaluation in Turin 1). Transthoracic echocardiography was performed within 60 min of cardiac catheterization. High LV filling pressures were defined by a pulmonary arterial wedge pressure (PAWP) greater than 15 mmHg. We assessed numerous morphological and functional features of LV, and their association with PAWP. 128 patients were diagnosed with PH. We observed a significant association between PAWP, the left atrial volume indexed by BSA (LAVi, R2 = 0.27; p < 0.0001) and the E/e’ ratio (R2 = 0.27; p < 0.0001). With these parameters, we implemented a diagnostic algorithm to identify high ventricular filling pressures in PH patients. The application of this algorithm could help identify patients with a diagnosis of postcapillary PH due to high ventricular filling pressures (E/E’ > 15). Conclusions: The echocardiographic parameters with the best association with PAWP in PH patients are E/e’ and LAVi. For these patients, our diagnostic algorithm could improve the diagnostic precision for the definition of subgroups.

1. Introduction

Congestive heart failure (HF) affects 10% of people aged 75 and older, and it represents one of the main causes of hospitalization in subjects over 65 years old [1,2]. Pulmonary hypertension (PH), defined as a mean arterial pressure in the pulmonary artery (PAPm) ≥25 mmHg, is observed in 70% of patients with left ventricular (LV) dysfunction (systolic or diastolic), and in this subset it has been associated with increased mortality [3]. In these patients, PH is caused by an increase of left ventricular filling pressures, as defined by increased pulmonary arterial wedge pressure (PAWP) measured by right heart catheterization (PAWP > 15) [4,5]. Another form of PH, i.e., precapillary PH, shows low values of wedge pressure (PAWP ≤ 15) and is not causally related to heart disease. The correct differential diagnosis has a deep impact on patient management, as different therapeutic strategies are needed for the two forms of PH [4,5,6,7]. As has been well underlined by the latest international guidelines, there is currently no specific therapy for PH resulting from left heart disease [4]. On the contrary, different drugs are available for the treatment of pulmonary arterial hypertension (PAH). For that reason, it is crucial to accurately identify postcapillary PH patients, in order to avoid possible ineffective therapies.
Transthoracic echocardiography is the most widely used non-invasive method for the evaluation of patients affected by HF [2] and PH [8], and, as was recently published, it can reliably identify patients with an elevated LV filling pressure [9]. Two different previous studies have proposed echocardiographic scores, in order to diagnose precapillary PH with echocardiography [10,11]. However, both scores have low overall specificity and positive predictive values, compromising their use as diagnostic tools.
Therefore, the aim of our study was to evaluate the accuracy of echocardiography for the diagnosis of postcapillary PH, i.e., resulting from increased left ventricular filling pressures.

2. Methods

Patients with an invasive diagnosis of PH from the RIGHT1 study (Right heart invasive and echocardiographic hemodynamic evaluation in Turin 1) were recruited for the present analysis.

2.1. Study Design and Patient

The Right1 study is a prospective cohort trial involving patients who were referred to the Division of Cardiology of the University of Turin with an indication for a right heart’s hemodynamic study [12]. Patients were enrolled starting from July 2011 until November 2013. The study was approved by the ethics committees of our institution. The exclusion criteria were: no echocardiographic windows, insufficient quality of obtained pressure curves during catheterism, use of any drug affecting the hemodynamic parameter during catheterization and major hemodynamic variations between echocardiography and invasive evaluation. We enrolled 200 subjects; the data of 190 were considered adequate for data analysis. 10 enrolled patients were excluded due to technical issues during catheterization, inconclusive catheterization results or impossibility to perform an echocardiography. A total of 128 patients were diagnosed with PH, considering a cut-off value of ≥25 mmHg for PAPm: 38 of these were affected by precapillary PH (PAWP ≤ 15), and 90 showed postcapillary PH (PAWP > 15), based on cath data. Moreover, we also performed a sub-analysis including patients with a PAPm between 21 mmHg and 25 mmHg, in order to evaluate the performance of echocardiography with a lower cut-off value of diagnosis of PH, as suggested by some experts and the last guidelines [4,7]. 23 patients presented a PAPm between 21 and 25 mmHg: six patients showed a PAWP > 15, while 17 presented a PAWP ≤ 15.

2.2. Heart Catheterization

The Right Heart Catheterization (RHC) was performed in the Laboratory of Interventional Cardiology of the University Cardiology Division. A femoral or jugular access was used, and the measurements were made with the Swan–Ganz catheter. the central venous pressure and PAWP were assessed at the end expiration with a balloon-tipped catheter at a steady state, with the patient in a supine position. The investigator working in the cath lab was blinded to the echocardiographic measurements.

2.3. Transthoracic Echocardiography

Transthoracic echocardiography was performed with a Philips IE33, within 60 min of the catheterization procedure–immediately before or after. Whenever possible, the patients were examined in the left decubitus. All standard two-dimensional and Doppler data were digitally stored in a cine-loop format. An offline analysis was then performed with a dedicated software, in agreement with the latest International Guidelines for echocardiographic quantification, by expert EACVI (European Association of Cardiovascular Imaging) accredited staff [13,14,15].
The LV morphology was assessed using 2D-targeted M-mode echocardiography, in agreement with the Guidelines of the American Society of Echocardiography [14]. The LV end-diastolic internal diameter (LVIDd), the LV end-systolic internal diameter (LVIDs) and the end diastolic septal and inferolateral wall thickness (SWT and ILWT) were measured. The LV geometry was defined through the relative wall thickness (RWT = 2xILWT/LVIDd) and the LV mass. The calculation of the LV mass was made through the Devereux formula and indexed for the body surface area (BSA); normal values of LV mass were considered to be <115 g/m2 for men and <95 g/m2 for women (Lang 2015). The BSA was calculated through the Du Bois and Du Bois formula (BSA [m2] = 0.20247 × Height0.725 [m] × Weight0.425 [kg]). The systolic function was quantified with the Ejection Fraction (EF) computed by Simpson’s method.
In agreement with the current International Recommendations [13], the assessment of the LV diastolic function was made by use of a multiparametric assessment: in particular, we focused our attention on the left atrial volume assessment and Doppler evaluation. The Doppler assessment was made using a trans-mitral flow sampled with PW Doppler [E wave peak Velocity (m/s); A wave peak Velocity (m/s); E wave deceleration time (DTE, ms); E/A ratio; A wave duration (ms)], the isovolumetric relaxation time (IVRT), the evaluation of the pulmonary venous flow sampled with PW Doppler, tissue Doppler [S’ peak velocity (cm/s); E’ peak velocity (cm/s); A’ peak velocity (cm/s)], the left atrial dimensions and the trans-pulmonary venous flow (Acceleration time; Time Velocity Integral (VTI)).

2.4. Statistical Analysis

The statistical analysis was performed using SAS 9.2 (SAS Institute Inc., Cary, NC, USA). Continuous data are presented as the mean ± SD, or median [25th–75th centile], where appropriate. The difference between two groups was performed with a T-test, Mann Whitney test or χ2 test, when appropriate. Correlations among different variables were performed using Person or Spearman’s test, where appropriate. The sensitivity, specificity, positive and negative predictive values, and the accuracy for PAWP > 15 mmHg, were computed by use of standard definitions. We performed a linear regression analysis for the evaluation of association. We considered an alpha-error <0.05 significant.

3. Results

The clinical characteristics of the study population are listed in Table 1. The only difference between the two groups was a higher age in the postcapillary patients. We did not find any differences in the drugs between the two groups (antihypertensive drugs, aspirin, diuretics, statins, anticoagulants).

3.1. Hemodynamic Parameters

The average PAWP in the PH patients was 20.7 mmHg (SD 7.6) (Table 1). Considering only patients with postcapillary PH, the average PAWP was 24.4 mmHg (SD 5.8). The pulmonary resistances were increased in the general population, with an average value of the pulmonary arteriolar resistance of 3.7 WU. As expected, the PAWP, pulmonary resistances, cardiac output and cardiac index were statistically different between the two groups.

3.2. Echocardiographic Parameters

The echocardiographic parameters in the global population and in the specific subgroups are listed in Table 2.
Briefly, patients with postcapillary PH showed an increased ventricular mass (p = 0.006) and significantly reduced systolic function (p = 0.0002) when compared to precapillary patients. When considering diastolic dysfunction, the LAVi and E/e’ ratios were significantly increased in the postcapillary PH subgroup. Interestingly, the right ventricle (RV) systolic function was normal in the general population, with lower values of TAPSE and S’ tricuspidalic in postcapillary patients when compared with precapillary patients (p = 0.0016, p < 0.0001, respectively). The percentage of MV disorders, defined as moderate/severe mitral regurgitation or stenosis, was higher in the postcapillary patients. On the contrary, AV disorder (moderate/severe aortic regurgitation or stenosis) were similar in the two groups.

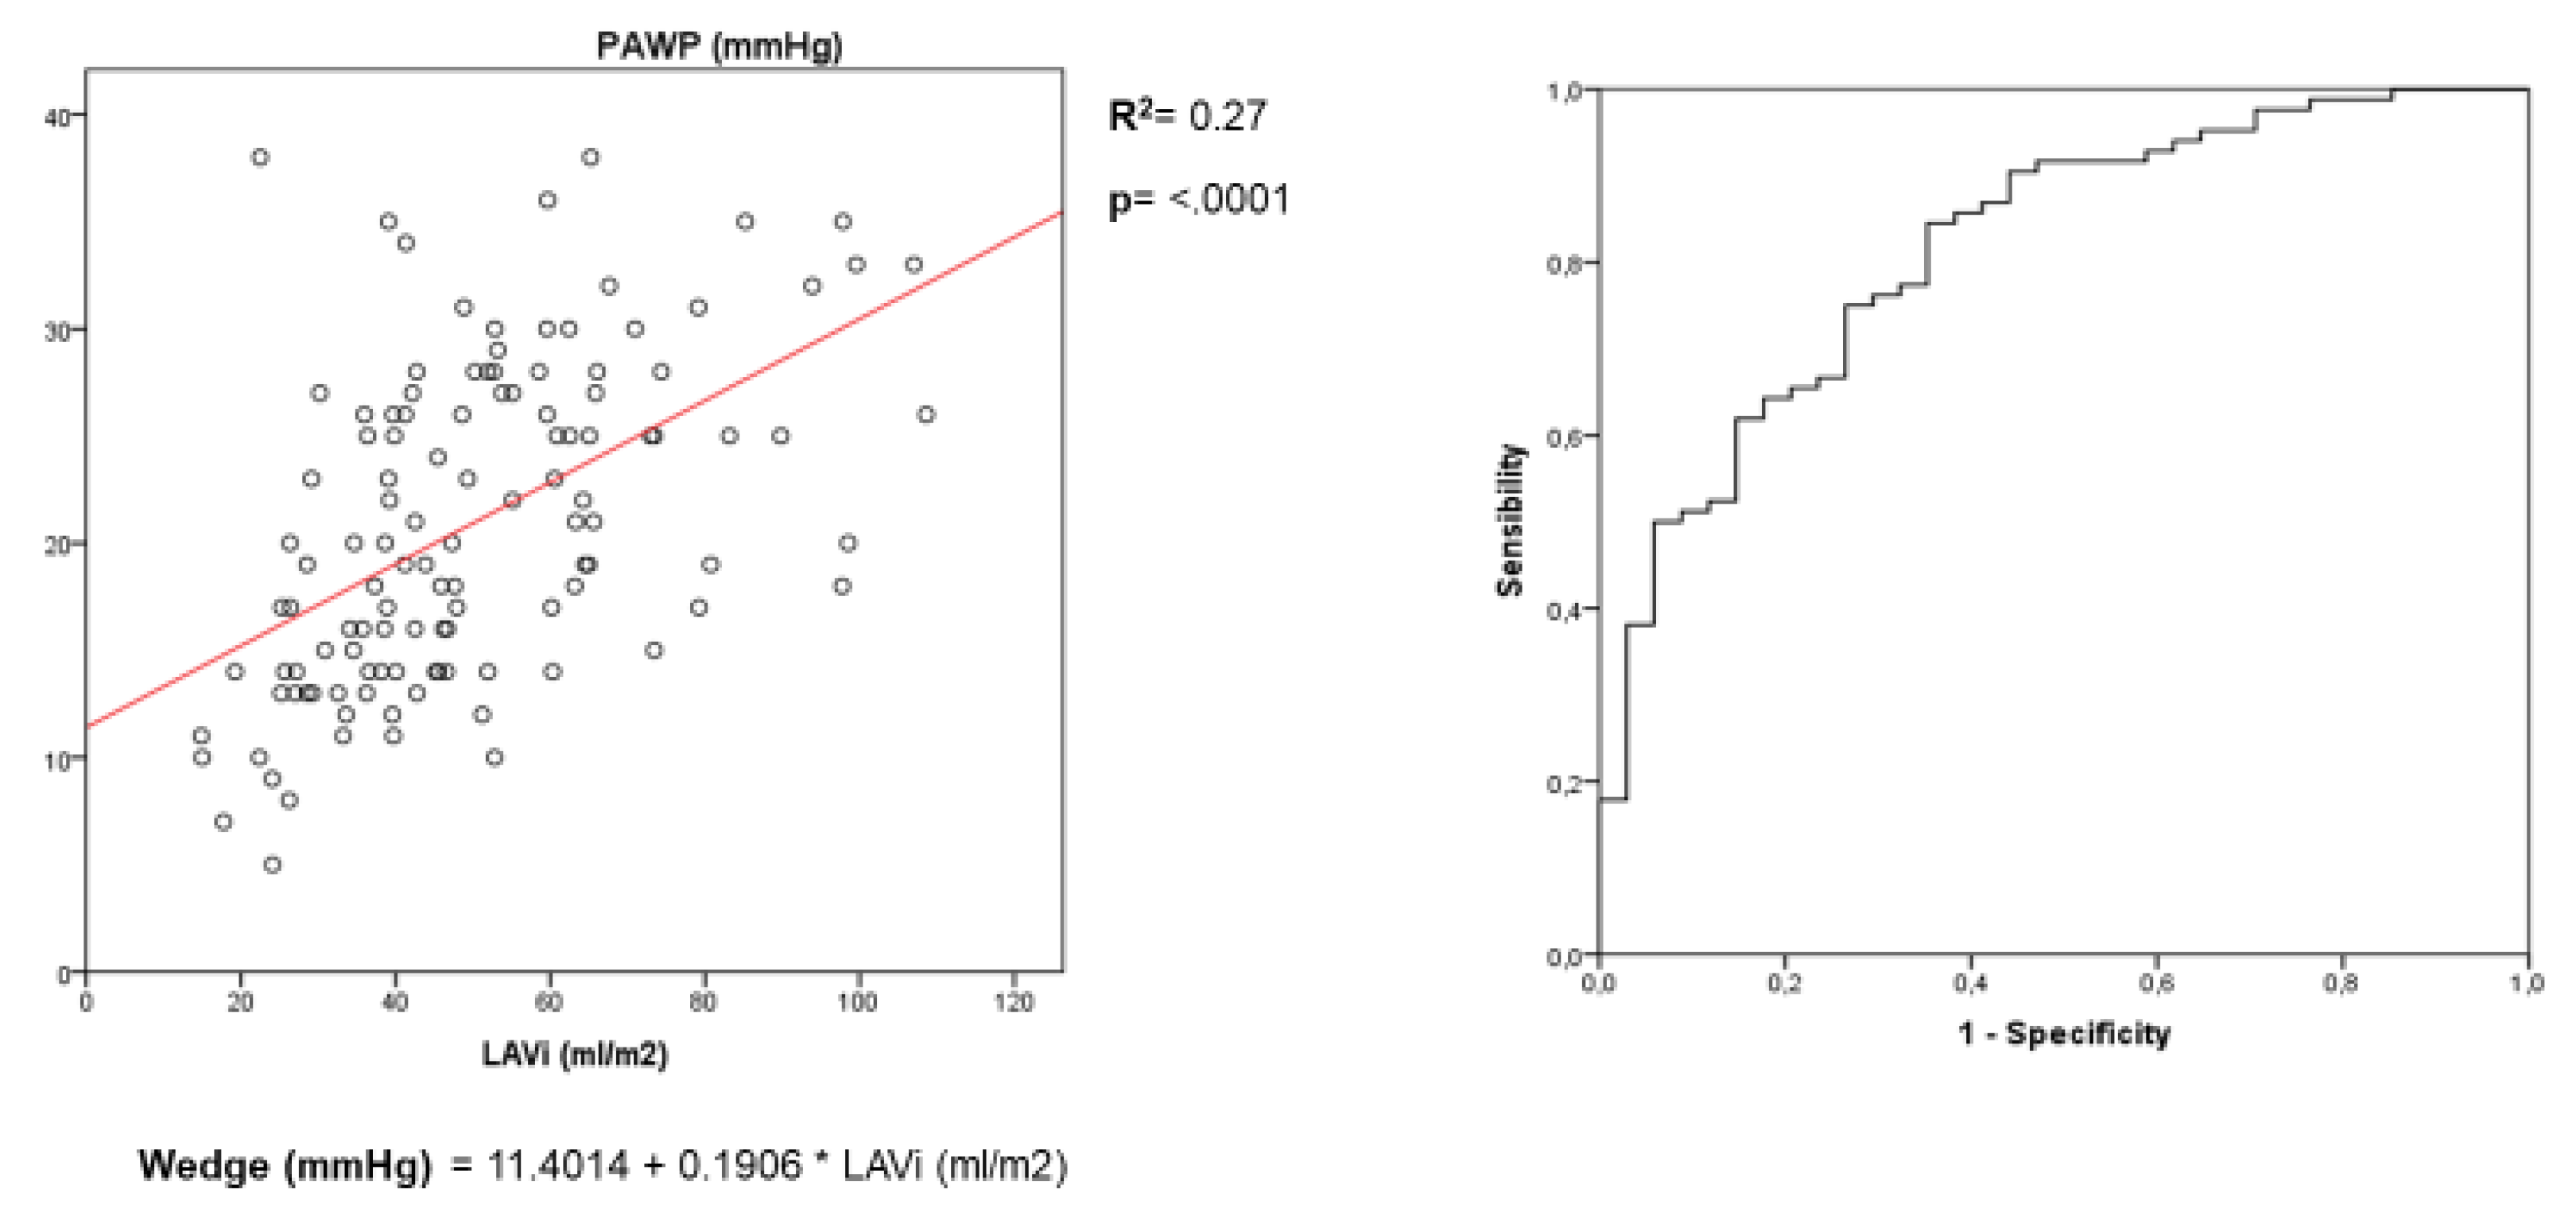
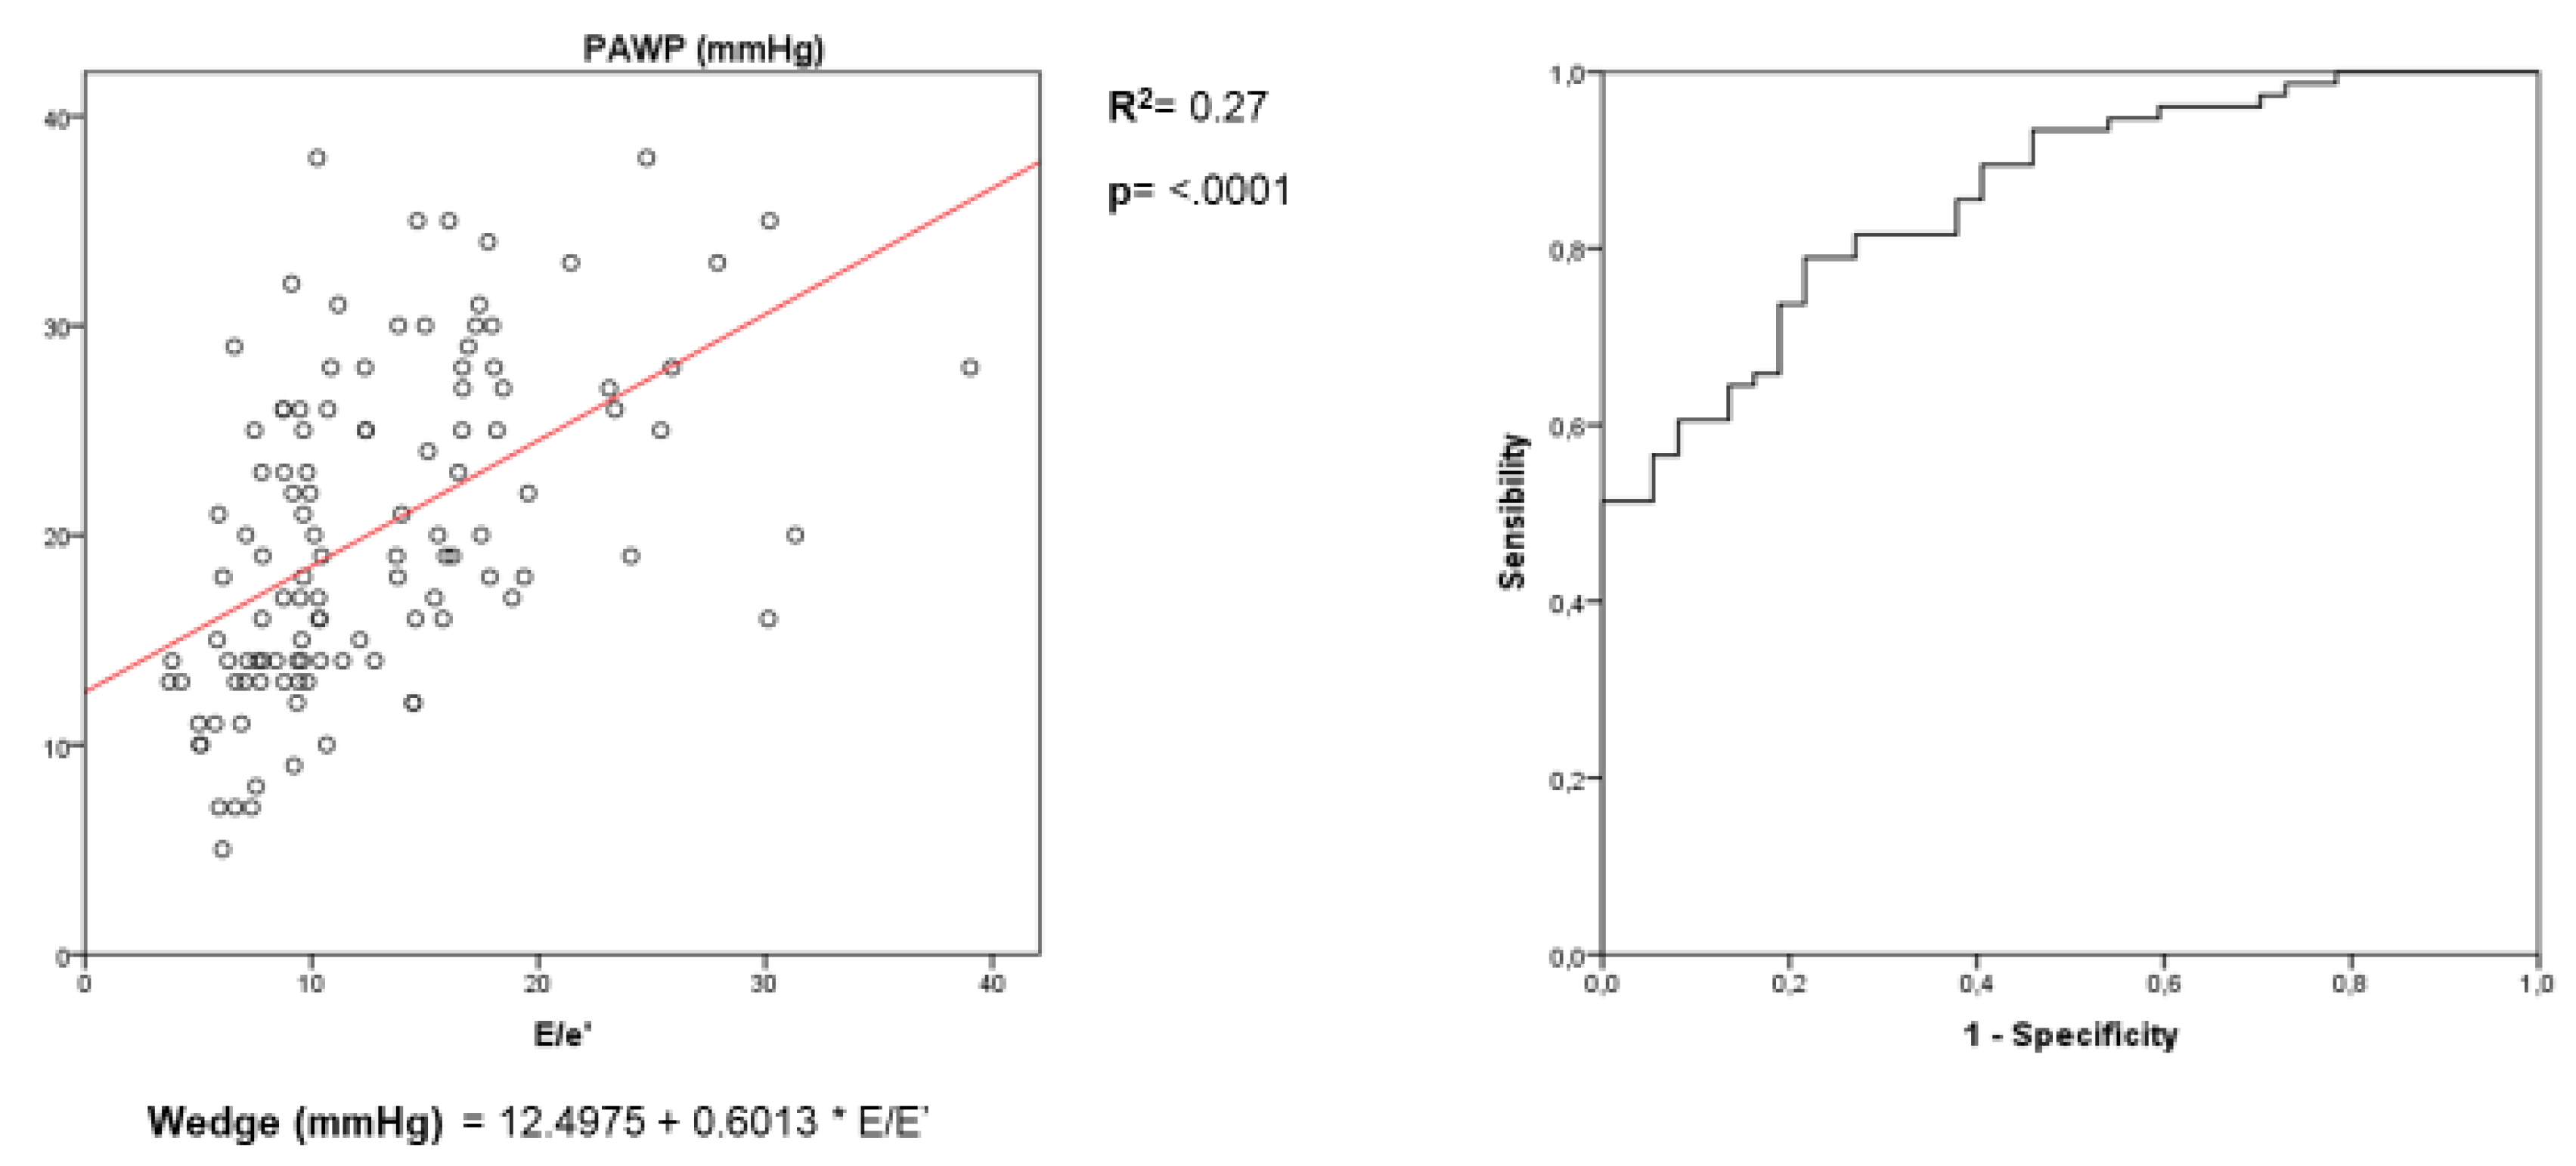
3.3. Assessment of LV Filling Pressures

The association between the cardiac morpho-functional echocardiographic parameters and PAWP was tested. The results are listed in Table 3.
In the linear regression analysis, the LAVi, E/e’, E/A, Ejection Fraction and Vein Pulmonary Doppler Ratio S/D were significantly associated with PAWP. In the subsequent performed Stepwise analysis, the parameters more significantly associated with PAWP were LAVi and E/e’ (E/e’: B = 0.43, p = 0.008; LAVi: B = 0.11, p = 0.029).
LAVi and E/E’ were easily obtained for most of our population (92% and 88%, respectively). They showed a significant association with PAWP (Figure 1 and Figure 2).
Through a ROC analysis, we identified the cutoffs values for a higher sensitivity and specificity for both parameters. With these cutoffs, we could safely rule out and, respectively, rule in the diagnosis of increased PAWP (>15 mmHg) in our population. An E/e’ > 15 showed a very good specificity (100%) for the definition of increased LV filling pressures in the study population; the values of specificity and sensitivity for increased LV filling pressures are listed in Table 4.

3.4. Subanalysis with Cutoff Value of PAPm > 20 mmHg for PH Definition

When considering a cutoff value for the PH definition at PAPm > 20 mmHg, we added 23 patients to the previous population. 151 patients were therefore available for analysis; 55 patients presented a PAWP ≤ 15, and 96 showed a PAWP > 15 and were considered as being affected by postcapillary PH. There were no differences in the results found in the main analysis. Considering the echo parameters, LVMi, ejection fraction, E/e’ and LAVi maintained a significant difference between the two groups (Table 5), with a significant association with PAWP in the regression analysis. However, while LAVi maintained almost the same specificity and sensitivity when compared with the main analysis, E/e’ slightly decreased its specificity, even if it maintained a good positive predictive value (93%).

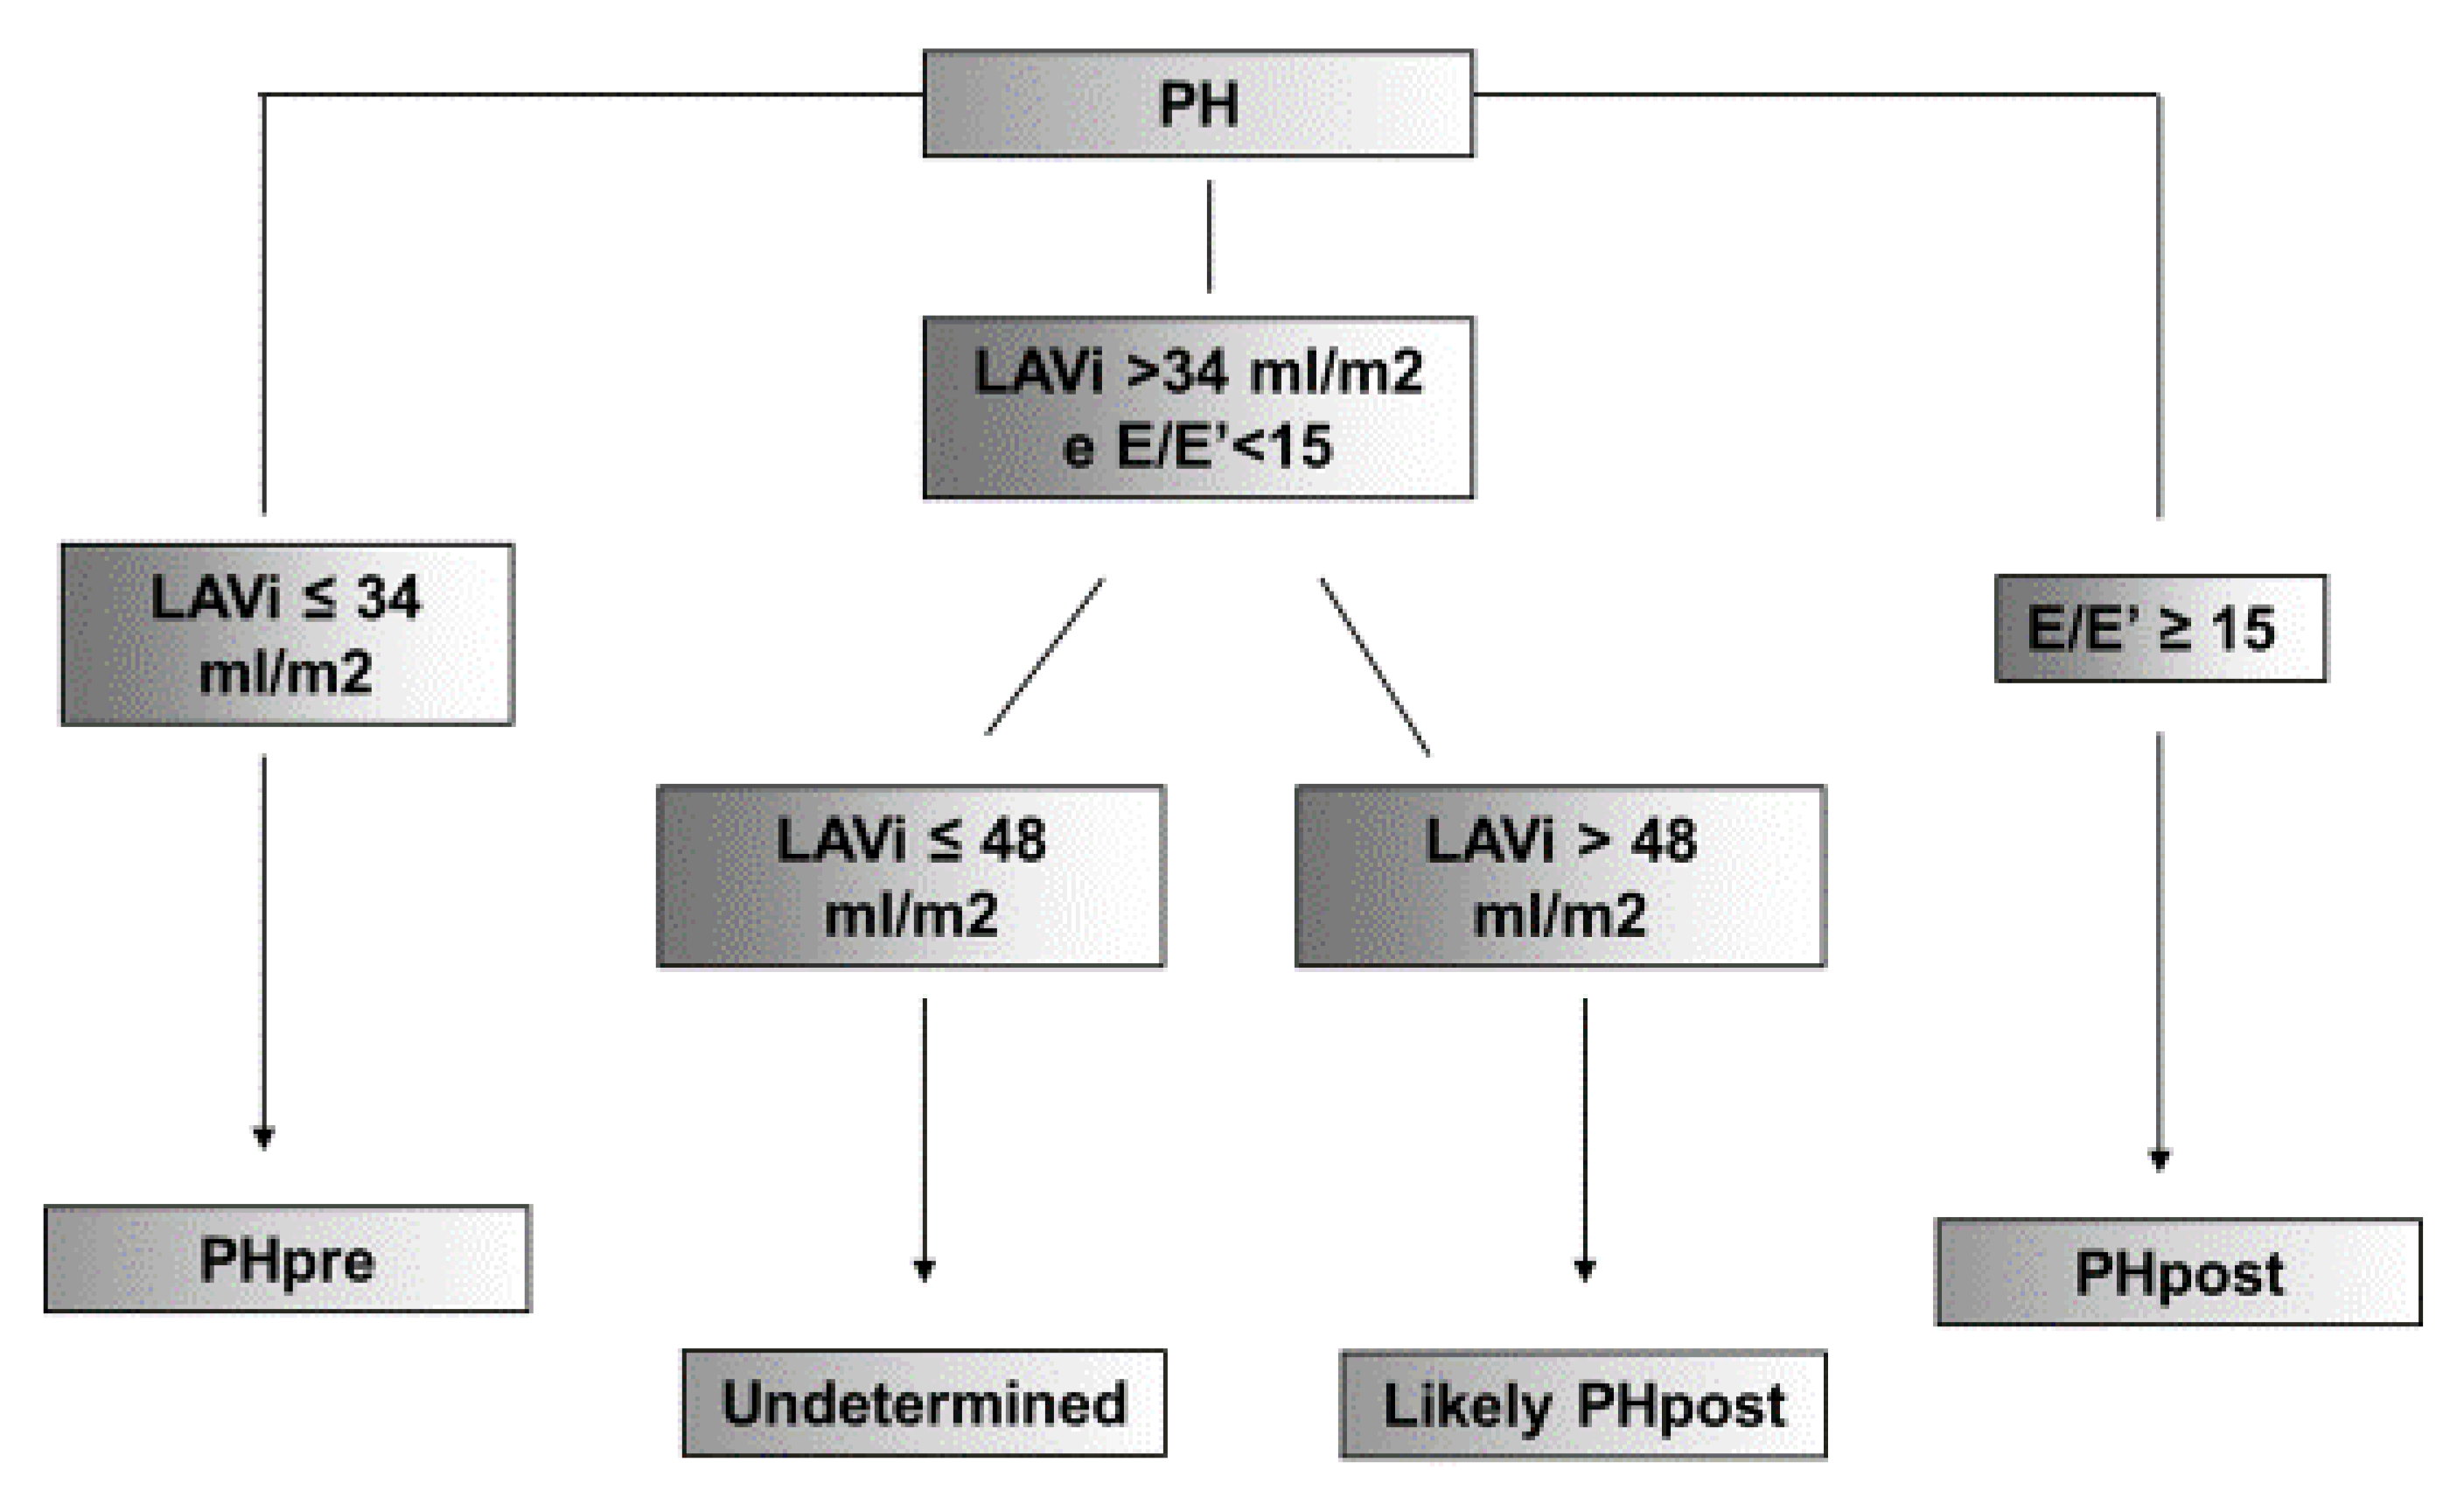
3.5. Proposal for Diagnostic Algorithm for Increased LV Filling Pressures

Based on these results, an algorithm for the echocardiography-based identification of increased LV filling pressure in PH patients (i.e., postcapillary PH) was designed. Such an algorithm was designed using the two variables more strongly associated with PAWP: E/e’ and LAVi; the cutoff values necessary for both to be used were derived by ROC analysis. For a diagnosis of an increased LV filling pressure, the algorithm requires a PAWP > 15 mmHg, in agreement with the International Guidelines [4].
Due to the previously demonstrated high specificity of E/e’ in identifying increased filling pressures (100%), a value of E/e’ ≥ 15 was used to directly confirm the presence of PAWP > 15 mmHg. The second parameter strongly associated with PAWP was LAVi, with a good sensitivity in excluding an increased LV filling pressure for normal LAVi values (LAVi ≤ 34 mL/m2; sensitivity 92%). Therefore, patients with LAVi ≤ 34 mL/m2 were classified as having normal PAWP. Instead, the patients with a LAVi > 34 mL/m2 and an E/e’ < 15 were further stratified according to LAVi values. Patients with LAVi > 48 mmHg were classified as patients likely to have increased filling pressures, whereas the ability of a transthoracic echocardiogram to define PAWP was considered unsatisfactory when a less dilated LAVi was detected (i.e., LAVi ≤ 48 mL/m2). The algorithm was tested in the study population of patients with an invasive diagnosis of PH, and every patient was assigned a diagnostic category (Table 6).
When applying the algorithm (summed up in Figure 3), 36 patients were classified in a straightforward manner as having postcapillary PH due to an E/e’ ≥ 15; all of them showed an increased LV filling pressure at cardiac catheterization. Among the 24 patients with LAVi ≤ 34 mL/m2, who were echocardiographically considered as having a normal filling pressure, 18 (75%) were correctly diagnosed. The remaining 56 patients had values of E/e’ < 15 and LAVi > 34 mL/m2 and were subclassified based on left atrial dimensions, as previously described. A dichotomic approach was used, based on the presence or absence of a severe LAV dilatation (LAVi > 48 mL/m2, n = 29 or LAVi ≤ 48 m2, n = 27). Increased filling pressures were correctly diagnosed in 24 of the 29 patients with a severely dilated left atrium (83%; LAVi > 48 mL/m2), while five patients (17%) were wrongly diagnosed as having postcapillary PH. When considering the 27 patients who had a less severe left atrial dilatation (LAVi > 34 and ≤ 48 mL/m2) and E/e’ < 15, the algorithm was adequately able to correctly identify the appropriate subgroup.

4. Discussion

Our study confirmed that, in the PH population, the echo parameters more strongly associated with wedge pressure are the E/e’ ratio and the atrial volume indexed by BSA. Moreover, our data demonstrated that those same parameters may help to significantly distinguish between pre- and postcapillary PH
Our results are comparable to the recent study by Andersen et al., in which the E/e’ ratio and LAVi were strongly associated with the LV filling pressure [9]. However, Andersen and colleagues focused their attention on the diastolic evaluation and categorization, while our focus was on the correct identification of the appropriate subgroup of PH patients.
International recommendations for the evaluation of diastolic function [13] consider the left atrial volume indexed to the body surface area as one of the parameters for the estimation of LV filling pressures. The left atrial dimensions reflect the cumulative effects of the ventricular pressures over time. In the absence of atrial pathologies or congenital or acquired valvular pathologies, the increased atrial dimensions reflect the increase in the ventricular filling pressures [16]. In fact, during ventricular diastole, the left atrium is exposed to the ventricular pressures: if the ventricle is stiff, there is an increase of atrial pressure to maintain an adequate filling; the increased parietal tension leads to an atrial dilatation, as previously demonstrated [17,18].
Our study demonstrates the role of LAVi in the definition of LV filling pressure, in particular as a useful parameter for excluding increased LV filling pressures; however, the positive predictive value of LAVi, if one does not consider extreme dilatations (>61 mL/m2), is not sufficient for diagnosing increased PAWP.
The same international guidelines for the assessment of the diastolic function indicate E/e’, in patients with an EF > 50%, as one of the most important parameter for the evaluation of left ventricular filling pressures, and it is less age dependent [13], based on the findings of numerous previous studies [19,20,21]. We confirmed a good association between E/e’ and the left ventricular filling pressure when assessed invasively by PAWP. Moreover, this parameter was demonstrated to be widely applicable to the study population (88%), obviating the lack of complete sets of transmitral flow Doppler data, due to the high prevalence of atrial fibrillation. On the other hand, the low negative predictive value of E/e’ in the study population seriously puts into question its role as a screening method for the identification of patients with high LV filling pressures.
Based on these results, an algorithm for the echocardiography-based identification of increased LV filling pressure in PH patients (i.e., postcapillary PH) was designed. The algorithm aims at non-invasively diagnosing postcapillary PH, thus limiting the invasive diagnosis (by catheterization) to dubious cases. In our population, the use of this algorithm led to a correct individuation of all patients with increased filling pressures (PAWP > 15), potentially sparing them an invasive assessment; at the same time, 75% of patients with normal left ventricular end-diastolic pressure were correctly identified (LAVi ≤ 34 mL/m2). In the patients (48%) who fell in the grey zone (intermediate characteristics), using the LAVi once again allowed for further stratification. In particular, the patients with severe left atrial dilatation (LAVi > 48 mL/m2) could, with a fair accuracy, be classified as patients with increased PAWP. For patients with mild to moderate atrial dilatation (between 34 and 48 mL/m2), echocardiography alone could not correctly define the PH etiology, and a diagnostic definition would require an invasive evaluation with cardiac catheterization.
As suggested in the last European Guidelines and recently by experts such as Vachiery et al. in their review [4,7], we performed a sub-analysis considering a different cutoff value of PAPm. Normal PAPm at rest is 14 + 3 mmHg, with an upper normal limit of approximately 20 mmHg, rendering the clinical significance of PAPm between 21 and 24 mmH unclear [22,23]. In our analysis, even when considering a PAPm > 20 mmHg for the diagnosis of PH, the two variables most associated with PAWP were E/e’ and LAVi, with a slight decrease in the overall specificity of our algorithm.
As mentioned above, two studies have developed two different scores in order to diagnose precapillary PH with echocardiography [10,11]. However, there are important differences between these studies and our analysis. First of all, our aim was to identify patients with postcapillary PH, while those studies focused on correctly identifying primitive PH. A correct individuation of patients with increased filling pressures potentially spares them an invasive assessment; on the contrary, an echocardiographic diagnosis of precapillary PH needs to be completed by a further invasive evaluation and test, i.e., a vasoreactivity test. Second, even if simple, echocardiographic scores are more complex to use in a clinical setting. On the other hand, our algorithm, using just two parameters, is easier and quicker. Moreover, E/e’ and LAVi are widely used and easy to obtain in almost all echocardiographic examinations. Third, our population is different when compared to that of the above-mentioned studies. We recruited patients with a general indication for an invasive hemodynamic evaluation, without limitations of age or pathology, in order to obtain a sample that was as representative as possible of the population that may be commonly encountered in daily clinical practice. Conversely, D’Alto et al. excluded patients with an estimated systolic PAP < 37 mmHg from echocardiography, in this way introducing a selection bias and rendering their score appropriate only to this setting. Furthermore, our population, considering both the whole group of patients and only the postcapillary patients, showed lower pulmonary vascular resistances when compared to those reported by Opotowsky and D’Alto. This could be explained by a greater percentage of reactive postcapillary PH in their population, a subgroup of patients with mixed characteristics between pre- and post-capillary PH. Finally, Opotowsky’s score is more correctly aimed at identifying increased PVR, using a pulmonary vascular resistance >3 Wood units as a diagnostic criteria for identifying precapillary PH.
In conclusion, our study confirms that the echocardiographic parameters more strictly associated with LV filling pressures in PH patients are E/e’ and LAVi. Moreover, we tested a new diagnostic algorithm based only on an echocardiographic assessment, aimed at identifying patients with postcapillary PH. The use of this diagnostic algorithm based on the E/e’ and atrial volume can be used as an adjunct to improve the diagnostic accuracy of echocardiography in the nosological definition of pulmonary hypertension.

5. Limitations

Our study presents at least two main limitations.
Selection bias: we recruited the subjects among the patients referred to the cath lab for an invasive hemodynamic evaluation, without limitations of age or pathology, in order to obtain a sample that was as representative as possible of the population that may be commonly encountered in daily clinical practice. However, our observations may not be automatically extendable to the general population, though our population is more heterogeneous than the ones described in other similar studies.
Method of assessment of ventricular filling pressures: in our study, we used the PAWP as the gold standard for the assessment of ventricular filling pressures, as suggested by international guidelines. However, in a recent study, Halpern et al. [24] have shown that the estimation of ventricular filling pressures by PAWP, in place of a directly measured LV end diastolic pressure, may lead to an erroneous differential diagnosis between precapillary and postcapillary PH. This may obviously affect the evaluation of the diagnostic performance of the proposed echocardiographic model.
Finally, we did not perform a provocative test (i.e., exercise or fluid challenge) for the further stratification of the diagnosis for pre-capillary PH. This may introduce a case selection mistake, even if the latest guidelines suggest that a further evaluation before such a test can be considered for routine clinical practice.

Author Contributions

Conceptualization, C.M.(Corrado Magnino) and A.M.; Methodology, C.M. (Corrado Magnino) and A.M.; Formal analysis, A.I.; Investigation, A.I., C.M. (Corrado Magnino), P.O., E.A., C.M. (Claudio Moretti), D.L.; Data curation, A.I., C.M. (Corrado Magnino), L.S., D.L., F.V., A.A., G.M., M.C., L.A.; Writing—original draft preparation, A.I.; Writing—review and editing, A.I., A.M. and E.A..; Supervision, F.V., F.G.; Project administration, A.M. All authors have read and agreed to the published version of the manuscript.

Funding

This research received no external funding

Conflicts of Interest

The authors declare no conflict of interest

References

  1. Jessup, M.; Brozena, S. Heart failure. N. Engl. J. Med. 2003, 348, 2007–2018. [Google Scholar] [CrossRef] [PubMed]
  2. Dickstein, K.; Cohen-Solal, A.; Filippatos, G.; McMurray, J.J.; Ponikowski, P.; Poole-Wilson, P.A.; Strömberg, A.; Van Veldhuisen, D.J.; Atar, D.; Hoes, A.W.; et al. Esc guidelines for the diagnosis and treatment of acute and chronic heart failure 2008: The task force for the diagnosis and treatment of acute and chronic heart failure 2008 of the European society of cardiology. Developed in collaboration with the heart failure association of the esc (hfa) and endorsed by the European society of intensive care medicine (esicm). Eur. J. Heart Fail. 2008, 10, 933–998. [Google Scholar] [PubMed]
  3. Bursi, F.; McNallan, S.M.; Redfield, M.M.; Nkomo, V.T.; Lam, C.S.; Weston, S.A.; Jiang, R.; Roger, V.L. Pulmonary pressures and death in heart failure: A community study. J. Am. Coll. Cardiol. 2012, 59, 222–231. [Google Scholar] [CrossRef] [PubMed] [Green Version]
  4. Galiè, N.; Humbert, M.; Vachiéry, J.-L.; Gibbs, S.; Lang, I.M.; Kamiński, K.A.; Simonneau, G.; Peacock, A.; Noordegraaf, A.V.; Beghetti, M.; et al. 2015 ESC/ERS Guidelines for the diagnosis and treatment of pulmonary hypertension. Eur. Heart J. 2016, 37, 67–119. [Google Scholar] [CrossRef]
  5. Rosenkranz, S.; Lang, I.M.; Blindt, R.; Bonderman, D.; Bruch, L.; Diller, G.P.; Felgendreher, R.; Gerges, C.; Hohenforst-Schmidt, W.; Holt, S.; et al. Pulmonary hypertension associated with left heart disease: Updated recommendations of the Cologne Consensus Conference 2018. Int. J. Cardiol. 2018, 272, 53–62. [Google Scholar] [CrossRef] [Green Version]
  6. Oudiz, R.J. Pulmonary hypertension associated with left-sided heart disease. Clin. Chest Med. 2007, 28, 233–241. [Google Scholar] [CrossRef]
  7. Vachiéry, J.-L.; Tedford, R.J.; Rosenkranz, S.; Palazzini, M.; Lang, I.; Guazzi, M.; Coghlan, G.; Chazova, I.; De Marco, T. Pulmonary hypertension due to left heart disease. Eur. Respir. J. 2019, 53, 1801897. [Google Scholar] [CrossRef] [Green Version]
  8. Milan, A.; Magnino, C.; Veglio, F. Echocardiographic indexes for the non-invasive evaluation of pulmonary hemodynamics. J. Am. Soc. Echocardiogr. 2010, 23, 225–239. [Google Scholar] [CrossRef]
  9. Andersen, O.S.; Smiseth, O.A.; Dokainish, H.; Abudiab, M.M.; Schutt, R.C.; Kumar, A.; Sato, K.; Harb, S.; Gude, E.; Remme, E.W.; et al. Estimating left ventricular filling pressure by echocardiography. Eur. J. Heart Fail. 2018, 20, 38–48. [Google Scholar] [CrossRef]
  10. D’Alto, M.; Romeo, E.; Argiento, P.; Pavelescu, A.; Melot, C.; D’Andrea, A.; Correra, A.; Bossone, E.; Calabrò, R.; Russo, V.; et al. Echocardiographic prediction of pre- versus postcapillary pulmonary hypertension. J. Am. Soc. Echocardiogr. 2015, 28, 108–115. [Google Scholar] [CrossRef]
  11. Opotowsky, A.R.; Ojeda, J.; Rogers, F.; Prasanna, V.; Clair, M.; Moko, L.; Vaidya, A.; Afilalo, J.; Forfia, P.R. A simple echocardiographic prediction rule for hemodynamics in pulmonary hypertension. Circ. Cardiovasc. Imaging 2012, 5, 765–775. [Google Scholar] [CrossRef] [PubMed] [Green Version]
  12. Magnino, C.; Omedè, P.; Avenatti, E.; Presutti, D.; Iannaccone, A.; Chiarlo, M.; Moretti, C.; Gaita, F.; Veglio, F.; Milan, A. Inaccuracy of Right atrial pressure estimates through inferior vena cava indices. Am. J. Cardiol. 2017, 120, 1667–1673. [Google Scholar] [CrossRef] [PubMed]
  13. Nagueh, S.F.; Smiseth, O.A.; Appleton, C.P.; Byrd, B.F., 3rd; Dokainish, H.; Edvardsen, T.; Flachskampf, F.A.; Gillebert, T.C.; Klein, A.L.; Lancellotti, P.; et al. Recommendations for the evaluation of left ventricular diastolic function by echocardiography. J. Am. Soc. Echocardiogr. 2016, 29, 277–314. [Google Scholar] [CrossRef] [PubMed] [Green Version]
  14. Lang, R.M.; Badano, L.P.; Mor-Avi, V.; Afilalo, J.; Armstrong, A.; Ernande, L.; Flachskampf, F.A.; Foster, E.; Goldstein, S.A.; Kuznetsova, T.; et al. Recommendations for cardiac chamber quantification by echocardiography in adults. J. Am. Soc. Echocardiogr. 2015, 28, 1–39. [Google Scholar] [CrossRef] [Green Version]
  15. Rudski, L.G.; Lai, W.W.; Afilalo, J.; Hua, L.; Handschumacher, M.D.; Chandrasekaran, K.; Solomon, S.D.; Louie, E.K.; Schiller, B. Guidelines for the echocardiographic assessment of the right heart in adults: A report from the American Society of Echocardiography endorsed by the European Association of Echocardiography, a registered branch of the European Society of Cardiology, and the Canadian Society of Echocardiography. J. Am. Soc. Echocardiogr. 2010, 23, 685–713. [Google Scholar]
  16. Abhayaratna, W.P.; Seward, J.B.; Appleton, C.P.; Douglas, P.S.; Oh, J.K.; Tajik, A.J.; Tsang, T.S. Left atrial size: Physiologic determinants and clinical applications. J. Am. Coll. Cardiol. 2006, 47, 2357–2363. [Google Scholar] [CrossRef] [Green Version]
  17. Pritchett, A.M.; Mahoney, D.W.; Jacobsen, S.J.; Rodeheffer, R.J.; Karon, B.L.; Redfield, M.M. Diastolic dysfunction and left atrial volume: A population-based study. J. Am. Coll. Cardiol. 2005, 45, 87–92. [Google Scholar] [CrossRef] [Green Version]
  18. Lim, T.K.; Ashrafian, H.; Dwivedi, G.; Collinson, P.O.; Senior, R. Increased left atrial volume index is an independent predictor of raised serum natriuretic peptide in patients with suspected heart failure but normal left ventricular ejection fraction: Implication for diagnosis of diastolic heart failure. Eur. J. Heart Fail. 2006, 8, 38–45. [Google Scholar] [CrossRef] [Green Version]
  19. Ommen, S.R.; Nishimura, R.A.; Appleton, C.P.; Miller, F.A.; Oh, J.K.; Redfield, M.M.; Tajik, A.J. Clinical utility of doppler echocardiography and tissue doppler imaging in the estimation of left ventricular filling pressures: A comparative simultaneous doppler-catheterization study. Circulation 2000, 102, 1788–1794. [Google Scholar] [CrossRef]
  20. Nagueh, S.F.; Middleton, K.J.; Kopelen, H.A.; Zoghbi, W.A.; Quinones, M.A. Doppler tissue imaging: A noninvasive technique for evaluation of left ventricular relaxation and estimation of filling pressures. J. Am. Coll. Cardiol. 1997, 30, 1527–1533. [Google Scholar] [CrossRef]
  21. Dokainish, H.; Zoghbi, W.A.; Lakkis, N.M.; Al-Bakshy, F.; Dhir, M.; Quinones, M.A.; Nagueh, S.F. Optimal noninvasive assessment of left ventricular filling pressures: A comparison of tissue doppler echocardiography and b-type natriuretic peptide in patients with pulmonary artery catheters. Circulation 2004, 109, 2432–2439. [Google Scholar] [CrossRef] [PubMed] [Green Version]
  22. Hoeper, M.M.; Bogaard, H.J.; Condliffe, R.; Frantz, R.; Khanna, D.; Kurzyna, M.; Langleben, D.; Manes, A.; Satoh, T.; Torres, F.; et al. Definitions and diagnosis of pulmonary hypertension. J. Am. Coll. Cardiol. 2013, 62, D42–D50. [Google Scholar] [CrossRef] [PubMed] [Green Version]
  23. Kovacs, G.; Berghold, A.; Scheidl, S.; Olschewski, H. Pulmonary arterial pressure during rest and exercise in healthy subjects a systematic review. Eur. Respir. J. 2009, 34, 888–894. [Google Scholar] [CrossRef] [PubMed] [Green Version]
  24. Halpern, S.D. Misclassification of pulmonary hypertension due to reliance on pulmonary capillary wedge pressure rather than left ventricular end-diastolic pressure. Chest J. 2009, 136, 37. [Google Scholar] [CrossRef]
Figure 1. Linear regression analysis between LAVi and PAWP and ROC curve (AUC = 0.82).
Hearts 01 00006 g001
Figure 2. Linear regression analysis between E/e’ and PAWP and ROC curve (AUC = 0.86).
Hearts 01 00006 g002
Figure 3. Diagnostic algorithm to identify high ventricular filling pressures in PH patients.
Hearts 01 00006 g003
Table 1. Clinical characteristics and hemodynamic parameters in the general population and in the postcapillary and precapillary subgroups.
Clinical Characteristics
PHPrecapillaryPostcapillaryP
n1283890
Age (y)61.9 ± 14.256.3 ± 13.964.3 ± 13.70.0039
Male Sex (%)54.7%55.3%54.4%0.93
BMI (Kg/m2)26.6 ± 5.227.4 ± 5.726.2 ± 4.90.3
Weight (Kg)73.6 ± 15.875.8 ± 15.372.7 ± 16.00.3
Height (cm)166.3 ± 10.2166.8 ± 10.6166.1 ± 10.10.7
SBP (mmHg)131.7 ± 27.4128.4 ± 22.8133.1 ± 29.10.3
DBP (mmHg)71.8 ± 12.572.2 ± 12.571.7 ± 12.50.8
HR (beats/min)73.6 ± 13.372.2 ± 12.574.2 ± 13.60.4
Hemodynamics Parameters
PHPrecapillaryPostcapillaryP
n1283890
sPAP (mmHg)54 [43–66]55 [43–73.5]52.5 [43–65]0.32
PAPm (mmHg)35 [30–43]35.5 [28.7–49]35 [30–43]0.9
RAP (mmHg)11 [8–14]10 [8–12]12 [9–15]0.04
PAWP (mmHg)20.7 ± 7.612.1 ± 2.624.4 ± 5.8<0.0001
Pulmonary arteriolar resistances (Wood Unit) 2.7 [1.9–4.3]4.3 [2.2–7]2.4 [1.8–3.5]0.0009
Cardiac Output (L/min)5.2 ± 2.06.1 ± 2.04.9 ± 1.80.003
Cardiac Index (L/min/m2)2.6 [2–3.5]2.9 [2.5–3.8]2.4 [2–3–2]0.012
Data are expressed as the mean ± SD, percentage or median (25°–75° percentile). sPAP = systolic pulmonary artery pressure; PAPm = mean pulmonary artery pressure; RAP = right atrial pressure; PAWP = pulmonary artery wedge pressure.
Table 2. Echocardiographic parameters in the general population and in the postcapillary and precapillary subgroups.
Pulmonary Hypertension
PHPrecapillaryPostcapillaryP
N°1283890
LEFT HEART
Left ventricle—Morphology
LVMi (g/m2)109 [90–136]98 [76–120]115 [96–143]0.006
RWT0.4 ± 0.10.4 ± 0.10.4 ± 0.10.3
LV ESV (mL)40 [27–80]31.5 [24–43]52 [30–105]0.002
LV EDV (mL)97 [67–144]82.5 [65–103]104 [67–159]0.03
MR disorder (%)19.4%027%0.01
AV disorder (%)14%15%13.7%0.5
Left Ventricle—Systolic function
Stroke Volume (mL/b)46 [34–60]52.2 [39–57]43 [32–63]0.7
Cardiac Output (L/min)3.3 [2.4–4.4]3.3 [2.5–4.3]3.3 [2.2–4.4]0.2
Ejection Fraction (%)55 [35–64]59 [55–66]47 [28–61]0.0002
Left Ventricle—Diastolic Function
E’ Septal (cm/s)5.1 [3.7–6.8]5.8 [4.3–7.7]4.6 [3.5–6–6]0.015
E’ Lateral (cm/s)7.5 [5.5–9.8]9.1 [5.6–10.7]7 [5–9.5]0.02
E/A1.02 [0.7–1.5]0.6 [1.1]1.3 [0.9–1.9]<0.0001
E (m/s)0.8 ± 0.30.6 ± 0.20.9 ± 0.3<0.0001
A (m/s)0.7 ± 0.30.7 ± 0.20.6 ± 0.30.3
Deceleration Time E (ms)184 ± 86213 ± 75170.9 ± 88.50.009
E/e’10.4 [8–16.5]7.6 [6–9.5]14.6 [9.7–18]<0.0001
Left atrium
LAVi (mL/m2)50 ± 20.735 ± 1356 ± 20<0.0001
RIGHT HEART
Right Ventricle—Systolic function
TAPSE (mm)19.9 ± 622 ± 5.218.9 ± 5.90.0016
S’ tricuspidalic (m/s)10.4 ± 3.112.1 ± 2.99.7 ± 2.9<0.0001
FAC (%)39 [32–45]39 [32–43]39 [30–45]0.9
Right Ventricle—Morphology
RVD 1 (mm)45.2 ± 7.746.3 ± 5.744.7 ± 8.30.3
Right Ventricle—Diastolic function
E’ tricuspidalic (cm/s)9.1 ± 3.28.5 ± 2.99.4 ± 3.30.13
E/E’ tricuspidalic (cm/s)4.6 [4–6]4.2 [3.6–5.8]4.8 [3.9–6.5]0.22
TR velocity (cm/s)3.1 ± 0.73.1 ± 0.73.0 ± 0.60.7
Data are expressed as the mean ± SD or percentage or median (25°–75° percentile). PH = Pulmonary Hypertension; LVMi = Left Ventricular Mass indexed by BSA; RWT = relative wall thickness; LV ESV = left ventricular end systolic volume; LV EDV = left ventricular end diastolic volume; MV = mitral valve; AV = aortic valve; LAVi = left atrial volume indexed by BSA; FAC = fractional area change; RVD1 = basal right ventricular dimension; TR = tricuspid regurgitation.
Table 3. Association between echocardiographic parameters and PAWP.
Echocardiographic ParametersRR2P
LV Morphology
LVMi (g/m2) 0.320.100.0003
LV ESV (mL) 0.340.110.0004
LV EDV (mL) 0.270.070.003
LV Systolic Function
Ejection Fraction, (%) −0.370.15<0.0001
LV Diastolic Function
E/A0.530.25<0.0001
E’ Septal (cm/s)−0.200.040.02
E’ Lateral (cm/s) −0.200.050.01
E/e’0.590.27<0.0001
PV S/D ratio−0.450.20<0.0001
Deceleration Time E (ms)−0.170.030.06
IVRT (ms)−0.020.00060.8
Left Atrium
LAVi (mL/m2)0.520.27<0.0001
Echo Pulmonary Resistance (WU)0.1110.0120.23
LVMi = Left Ventricular Mass indexed by BSA; LV ESV = left ventricular end systolic volume; LV EDV = left ventricular end diastolic volume; PV S/D ratio = Vein Pulmonary Doppler Ratio S/D; IVRT = isovolumetric relaxation time; LAVi = left atrial volume indexed by BSA.
Table 4. The values of sensitivity, specificity, VPP and VPN for different cutoffs of LAVi and E/E’.
PAWP > 15 mmHg
LAVi (mL/m2)SensitivitySpecificityPPVNPVLR+LR−
≤3492%53%72%78%1.950.15
>4857%85%83%57%3.80.5
<22100%15%100%74%1.170
≥6136%97%97%38%120.66
E/E’SensitivitySpecificityPPVNPVLR+LR−
<889%54%72%81%1.930.2
≥1547%100%100%49%0.53
<5.9100%22%100%72%1.280
≥14.551%100%100%50%0.49
LAVi = left atrial volume indexed by BSA; PPV = positive predictive value; NPV = negative predictive value; LR = likelihood ratio.
Table 5. Echocardiographic parameters, association with PAWP and values of sensitivity and specificity for LAVi and E/E’, considering a cutoff value of PAPm > 20 mmHg for the PH definition.
PrecapillaryPostcapillaryP
N°5596
LVMi (g/m2) 100.3 [74–126]115 [95–143]0.006
Ejection Fraction (%)59.6 [55–66]47.8 [27–62]<0.0001
E/e’8.4 ± 3.117.5 ± 12.5<0.0001
LAVi (mL/m2)35.8 ± 13.655.2 ± 20.30.003
Regression AnalysisRR2P
LVMi (g/m2) 0.340.11<0.0001
Ejection Fraction (%)0.390.15<0.0001
E/e’0.450.20<0.0001
LAVi (mL/m2)0.520.27<0.0001
ROC analysisPAWP > 15 mmHg
LAVi (mL/m2)SensitivitySpecificity
≤3489%50%
>4855%82%
E/E’SensitivitySpecificity
<888%53%
≥1549%96%
Data are expressed as the mean ± SD or percentage or median (25°–75 percentile). PH = pulmonary hypertension; PAPm = mean pulmonary artery pressure; LVMi = Left Ventricular Mass indexed by BSA; LAVi = left atrial volume indexed by BSA.
Table 6. LAVi ≤ 34 mL/m2, sensitivity 92%, specificity 53%; E/e’ ≥ 15, sensitivity 47%, specificity 100%.
Echocardiographic ParametersnEchocardiographic DiagnosisPAWP ≥ 15 mmHgPAWP < 15 mmHg
LAViE/E’
≤34<1524Normal PAWP618
35–48<1527Undetermined1611
>48<1529Likely high PAWP245
-≥1536High PAWP360
LAVi = left atrial volume indexed by BSA; PAWP = pulmonary arterial wedge pressure.

