Article

Exploring the Electrochemical Signatures of Heavy Metals on Synthetic Melanin Nanoparticle-Coated Electrodes: Synthesis and Characterization

1
Chemistry Department, Faculty of Science, Suez Canal University, Ismailia 41522, Egypt
2
Department of Chemistry, Cleveland State University, Cleveland, OH 44115, USA
3
Department of Chemistry, Saddleback College, Mission Viejo, CA 92692, USA
4
Department of Inflammation and Immunity, Cleveland Clinic, Lerner Research Institute, Cleveland, OH 44195, USA
*
Authors to whom correspondence should be addressed.
Appl. Nano 2025, 6(3), 11; https://doi.org/10.3390/applnano6030011
Submission received: 26 May 2025 / Revised: 16 June 2025 / Accepted: 19 June 2025 / Published: 23 June 2025

Abstract

This study investigates the development and sensing profile of synthetic melanin nanoparticle-coated electrodes for the electrochemical detection of heavy metals, including lead (Pb), cadmium (Cd), cobalt (Co), zinc (Zn), nickel (Ni), and iron (Fe). Synthetic melanin films were prepared in situ by the deacetylation of diacetoxy indole (DAI) to dihydroxy indole (DHI), followed by the deposition of DHI monomers onto indium tin oxide (ITO) and glassy carbon electrodes (GCE) using cyclic voltammetry (CV), forming a thin layer of synthetic melanin film. The deposition process was characterized by electrochemical quartz crystal microbalance (EQCM) in combination with linear sweep voltammetry (LSV) and amperometry to determine the mass and thickness of the deposited film. Surface morphology and elemental composition were examined using scanning electron microscopy (SEM) and energy-dispersive X-ray spectroscopy (EDX). In contrast, Fourier-transform infrared (FTIR) and UV–Vis spectroscopy confirmed the melanin’s chemical structure and its polyphenolic functional groups. Differential pulse voltammetry (DPV) and amperometry were employed to evaluate the melanin films’ electrochemical activity and sensitivity for detecting heavy metal ions. Reproducibility and repeatability were rigorously assessed, showing consistent electrochemical performance across multiple electrodes and trials. A comparative analysis of ITO, GCE, and graphite electrodes was conducted to identify the most suitable substrate for melanin film preparation, focusing on stability, electrochemical response, and metal ion sensing efficiency. Finally, the applicability of melanin-coated electrodes was tested on in-house heavy metal water samples, exploring their potential for practical environmental monitoring of toxic heavy metals. The findings highlight synthetic melanin-coated electrodes as a promising platform for sensitive and reliable detection of iron with a sensitivity of 106 nA/ppm and a limit of quantification as low as 1 ppm.

1. Introduction

Heavy metal contamination in the water environment is a significant concern due to its toxic effects on living organisms and the challenges associated with its detection and removal. These metals, including lead, cadmium, chromium, and copper, persist in water sources, leading to severe health and environmental problems [1,2]. Conventional methods for removing heavy metals from aqueous solutions, such as chemical precipitation, ion exchange, and membrane filtration, often suffer from limitations, including high costs, generation of secondary pollutants, and inefficiency at low metal concentrations [3,4]. However, the task becomes more challenging at low concentrations, where detecting and evaluating the presence of heavy metals is difficult. Therefore, developing effective, sustainable, and cost-efficient materials for heavy metal detection is of paramount importance.
Melanin, a natural pigment, is a biopolymer that has been extensively studied for its protective roles in organisms, including UV radiation absorption, free radical scavenging, and metal ion binding. Recently, melanin has garnered significant attention as a potential biomaterial for heavy metal removal due to its high adsorption capacity, biodegradability, and non-toxic nature [5,6,7]. The unique polyphenolic structure of melanin allows it to bind metal ions through various mechanisms, including chelation and ion exchange, making it an excellent candidate for environmental remediation applications. In recent years, the synthesis of melanin nanoparticles has further enhanced their potential as a heavy metal adsorbent, offering higher surface area and more active sites for metal ion interaction [2,8,9,10,11].
The environmental applications of melanin have been explored in various studies. For instance, Nguyen et al. demonstrated that natural melanin extracted from squid ink effectively removed chromium (Cr6+) and manganese (Mn2+) from aqueous solutions, with removal efficiencies exceeding 97% [12]. This study highlighted the potential of melanin as a biomaterial for water treatment, particularly in regions with high heavy metal contamination. The effectiveness of melanin in heavy metal adsorption is largely attributed to its chemical structure, which includes various functional groups such as hydroxyl, carboxyl, and amino groups. These groups facilitate metal ion binding through complexation, ion exchange, and electrostatic interactions. Studies have shown that the adsorption process is influenced by several factors, including pH, temperature, and the presence of competing ions. For example, the adsorption of Cr6+ by melanin was found to be highly pH-dependent, with maximum adsorption occurring at acidic pH values, where the functional groups on melanin are more likely to interact with metal ions [12,13].
Melanin’s strong affinity for Fe(III) ions has been extensively studied due to its significant role in metal homeostasis and oxidative stress regulation. Research on both synthetic and natural DHI melanin has revealed that Fe(III) binds primarily to catechol and quinone-imine groups, with additional interactions involving acetate groups in natural melanin [14]. Further studies have demonstrated that Fe(III) binding to melanin is highly pH-dependent, with complexation occurring through various coordination modes as the pH increases. In particular, Sepia melanin exhibits a high capacity for Fe(III) adsorption, reaching saturation levels of approximately 1.43 mmol/g, and this binding is largely attributed to coordination with o-dihydroxyl groups [15]. Moreover, the interaction between Fe(III) and melanin has been shown to influence the redox properties of iron, potentially modulating its reactivity and availability in biological systems. These findings underscore melanin’s multifaceted role in iron binding and its potential implications in physiological and pathological processes [16].
Beyond its use in adsorption, melanin’s ability to bind metal ions has sparked our interest in its application as a sensor for detecting heavy metals in environmental samples. Synthetic melanin nanoparticles, with their enhanced surface area and tunable properties, are particularly promising for this purpose. These nanoparticles can be engineered to exhibit selective binding to specific metal ions, making them useful for detecting trace levels of heavy metals in water. Interestingly, electrochemically deposited melanin can be used to develop sensors capable of real-time detection of heavy metal concentrations [17,18,19].
This study investigates synthetic melanin nanoparticles as electrochemical sensors for detecting toxic heavy metals. Synthetic melanin films were deposited on glassy carbon electrodes and indium tin oxide substrates using the CV technique, then evaluated for their sensitivity and selectivity. Melanin-based sensors were tested against several environmentally relevant metals, including lead, cadmium, cobalt, zinc, nickel, and iron. To the best of our knowledge, this is the first paper on melanin-based films being used as sensors for heavy metal detection. Particular attention was given to the sensors’ performance in detecting and quantifying iron (III), highlighting the potential of synthetic melanin films as a reliable platform for heavy metal monitoring.

2. Materials and Methods

2.1. Chemicals and Reagents

Sodium hydroxide (NaOH, 99%), ethanol, and 5,6-diacetoxyindole were analytical-grade and used without further purification. The following metal nitrate salts were used to prepare stock solutions of their respective metal ions: (Cd(NO3)2·4H2O, ≥98%), (Co(NO3)2·6H2O, ≥98%), (Ni(NO3)2·6H2O, ≥98%), (Pb(NO3)2, ≥99%), (Zn(NO3)2·6H2O, ≥98%), and (Fe(NO3)3·9H2O, ≥98%). Additionally, sodium nitrate (NaNO3, ≥99%) was used as an electrolyte solution for all amperometry experiments at a concentration of 100 mM. Phosphate buffer solution (PBS) (100 mM, pH = 7.4) was used for melanin preparation. All chemicals were analytical-grade and were purchased from Sigma-Aldrich (St. Louis, MO, USA). Deionized (DI) water was used throughout the preparation of solutions. Indium Tin Oxide (ITO)-coated glass slides were from Delta Technologies, Ltd. (Loveland, CO, USA).

2.2. Preparation of Heavy Metal Stock Solutions

Stock solutions of each metal nitrate were prepared by dissolving the appropriate amount of each salt in deionized water. The molecular weights of the metal nitrate salts were divided by the atomic weights of the respective metal ions to calculate the required mass to achieve a final concentration of 1000 ppm of the metal ion. The typical preparations were as follows: Cd2+ (Cd(NO3)2·4H2O, 2.74 g/L), Co2+ (Co(NO3)2·6H2O, 4.93 g/L), Ni2+ (Ni(NO3)2·6H2O, 4.95 g/L), Pb2+ (Pb(NO3)2, 1.60 g/L), Zn2+ (Zn(NO3)2·6H2O, 4.55 g/L), and Fe3+ (Fe(NO3)3·9H2O, 7.23 g/L). However, since the volume was reduced to 50 mL, the calculated masses for each metal salt were divided by 20 to achieve a stock solution of 1000 ppm in 50 mL. The following dilution equation was used to prepare the desired concentrations:
S t o c k   s o l u t i o n   v o l u m e   ( mL )   =   R e q u i r e d   c o n c e n t r a t i o n ppm   ×   R e q u i r e d   v o l u m e   ( mL ) S t o c k   c o n c e n t r a t i o n   ( ppm )
For each metal nitrate, the calculated mass of salt was accurately weighed using an analytical balance. The prepared metal nitrate solutions and all reagents were stored in clean, labeled polyethylene bottles and glass vials at room temperature and kept in a drawer to protect them from light until experimental use. Triplicate measurements were performed to ensure accuracy and reproducibility.

2.3. Polishing and Preparation of Electrodes

The surface of the GCE was restored by thoroughly polishing on different pads using different sizes of alumina powder. The electrodes were rinsed several times with DI water and then dried under nitrogen. ITO electrodes were used after being sonicated in ethanol for 15 s, rinsed with water, and dried under nitrogen. After use, they were discarded, and the surface was not restored. EQCM gold electrodes (Au-QC, CH Instruments, Austin, TX, USA) were used as received after rinsing with DI water, followed by ethanol, then discarded after a single use.

2.4. Synthetic Melanin Films

Melanin film synthesis was conducted in a sealed 50 mL three-necked round flask under continuous nitrogen flow. First, 12.5 mL of ethanol was purged with nitrogen gas for 10 min before being introduced to 3.0 mg of DAI (0.001 M, 12.5 μmol). Deacetylation of DAI to generate DHI was achieved by adding 0.25 mL of 0.1 M NaOH (25 μmol), delivering a two-fold molar excess of base. The reaction mixture was allowed to proceed for 10 min, after which it was diluted with 25 mL of nitrogen-degassed phosphate buffer (100 mM, pH 7.4). Melanin films were then electrochemically deposited on GCEs using CV, sweeping the potential from −0.8 V to +0.40 V vs. Ag/AgCl at a scan rate of 0.05 V/s for 10 cycles. This same electropolymerization method was used for the ITO slides and Au-QC electrodes. Throughout the procedure, the solution remained clear, confirming the absence of bulk DHI-melanin autoxidation—a common limitation in other synthesis routes.

2.5. Instrumentations

The electrochemical characterization of the synthesized DHI-melanin films was conducted using a CHI 1030B Multi-Mode Potentiostat workstation (CH Instruments, Austin, TX, USA). CV was performed in an electrochemical cell consisting of GCE or ITO as the working electrode, an Ag/AgCl reference electrode, and a platinum wire as the counter electrode. Additionally, the thickness of the DHI-melanin film was calculated based on data obtained from EQCM. In this method, a gold-coated quartz crystal, Au-QC, served as the working electrode, while the reference and auxiliary electrodes remained the same as in the voltammetry setup. The mass per unit area (Г) of the electropolymerized melanin film was determined using the Sauerbrey equation [20]:
Г   =   C   ×   ( Δ f υ / υ ) d   =   Г / ρ
In this equation, the proportionality constant (C) is provided by the quartz crystal, and the frequency shift (Δf) is monitored over time using an oscillator. The thickness (d) of the film is calculated by dividing the mass per unit area (Г) by the density (ρ) of melanin (ρ = 1.2 ± 0.1 g/cm2), as previously determined in other studies [21].
SEM and EDX were obtained using a Hitachi S-4500 Field Emission Scanning Electron Microscope (FESEM) (Hitachi High-Technologies Corporation, Tokyo, Japan). X-ray Photoelectron Spectroscopy (XPS) analysis was carried out using a PHI Versaprobe 5000 Scanning Spectrometer (Physical Electronics (PHI), Chanhassen, MN, USA) under a vacuum pressure of approximately 10−9 millibar. A monochromatic Al Kα X-ray source was used for both survey scans and high-resolution analyses, with a focused area of approximately 0.35 mm2. The pass energy was set to 93.9 eV for wide-range scans (0–800 eV) and reduced to 11.75 eV for high-resolution scans of the C1s region (278–298 eV). Attenuated Total Reflectance Fourier-transform infrared (ATR-FTIR) spectroscopy was conducted using a PerkinElmer instrument with a crystal as the ATR element. The sample was placed directly onto the crystal surface, and spectra were collected over a wavenumber range from 4000 cm−1 to 450 cm−1. This technique provided surface-level insights into the functional groups present in the sample. UV–Visible absorbance spectra were recorded with an Agilent 8453 spectrophotometer (Agilent Technologies, Santa Clara, CA, USA) using a 1 cm path-length quartz cuvette, and all measurements were taken at room temperature. pH measurements were performed using an Accumet AB15 pH meter (Fisher Scientific, Pittsburgh, PA, USA).

3. Results and Discussion

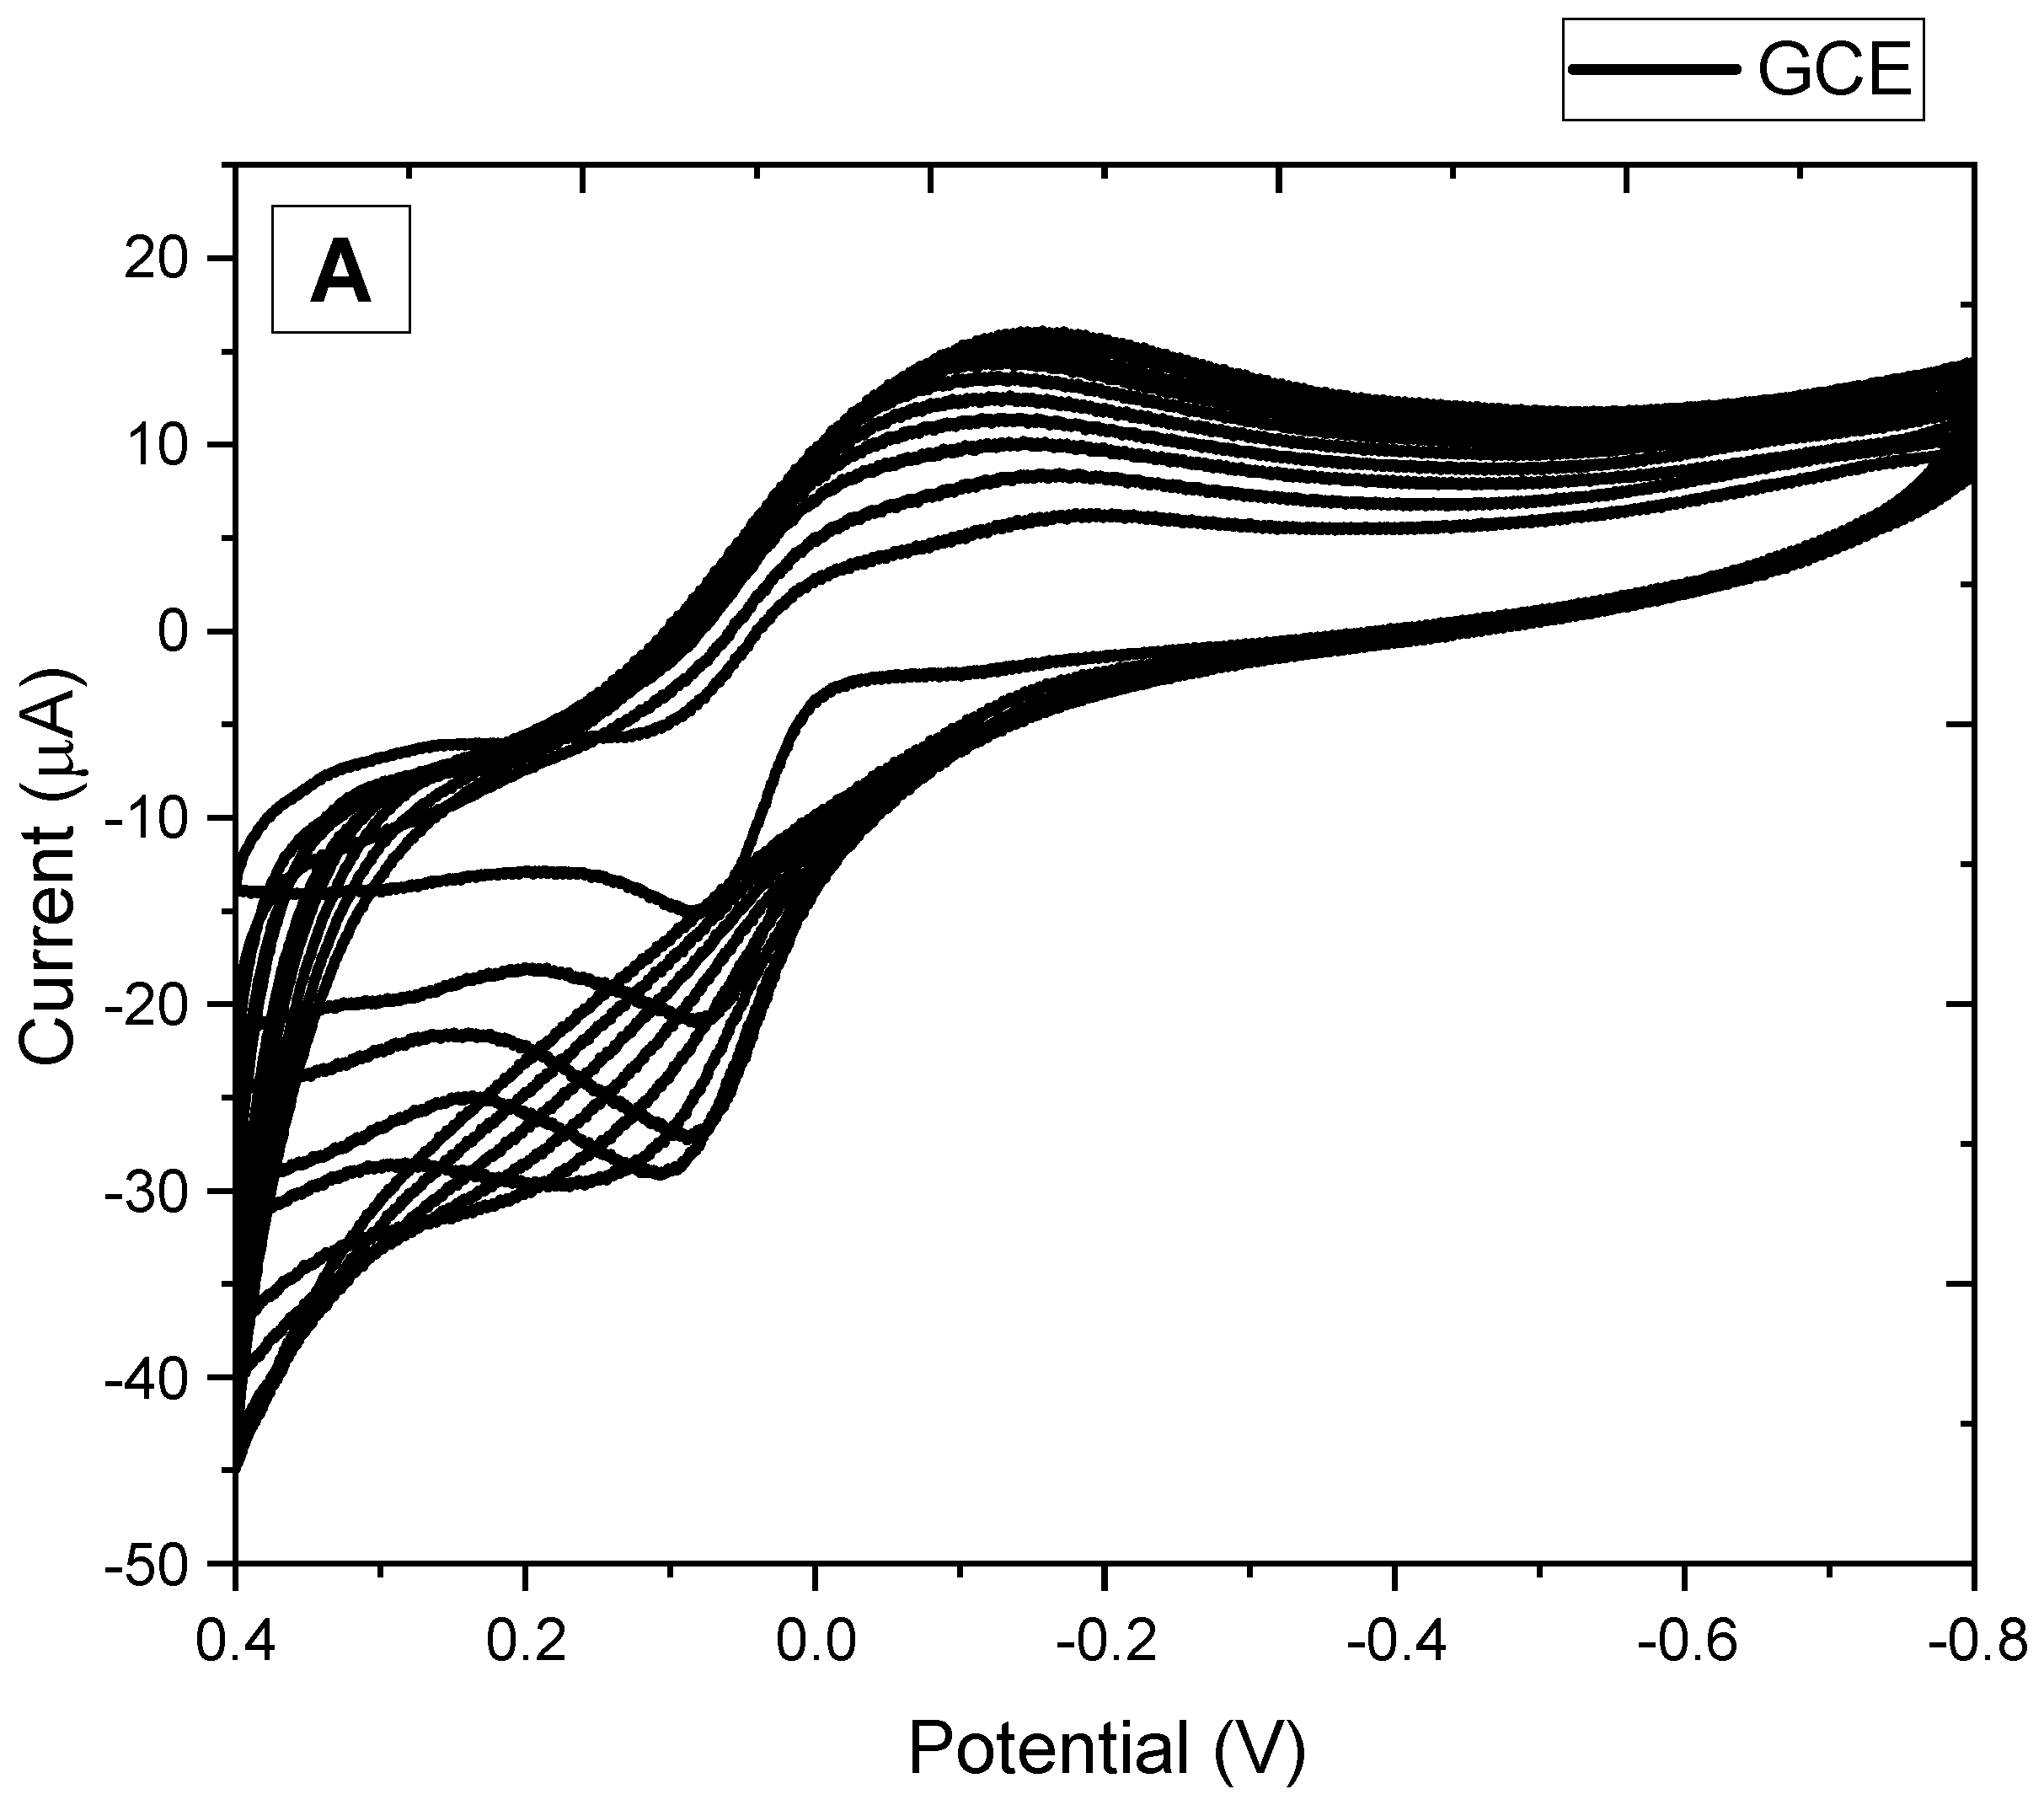
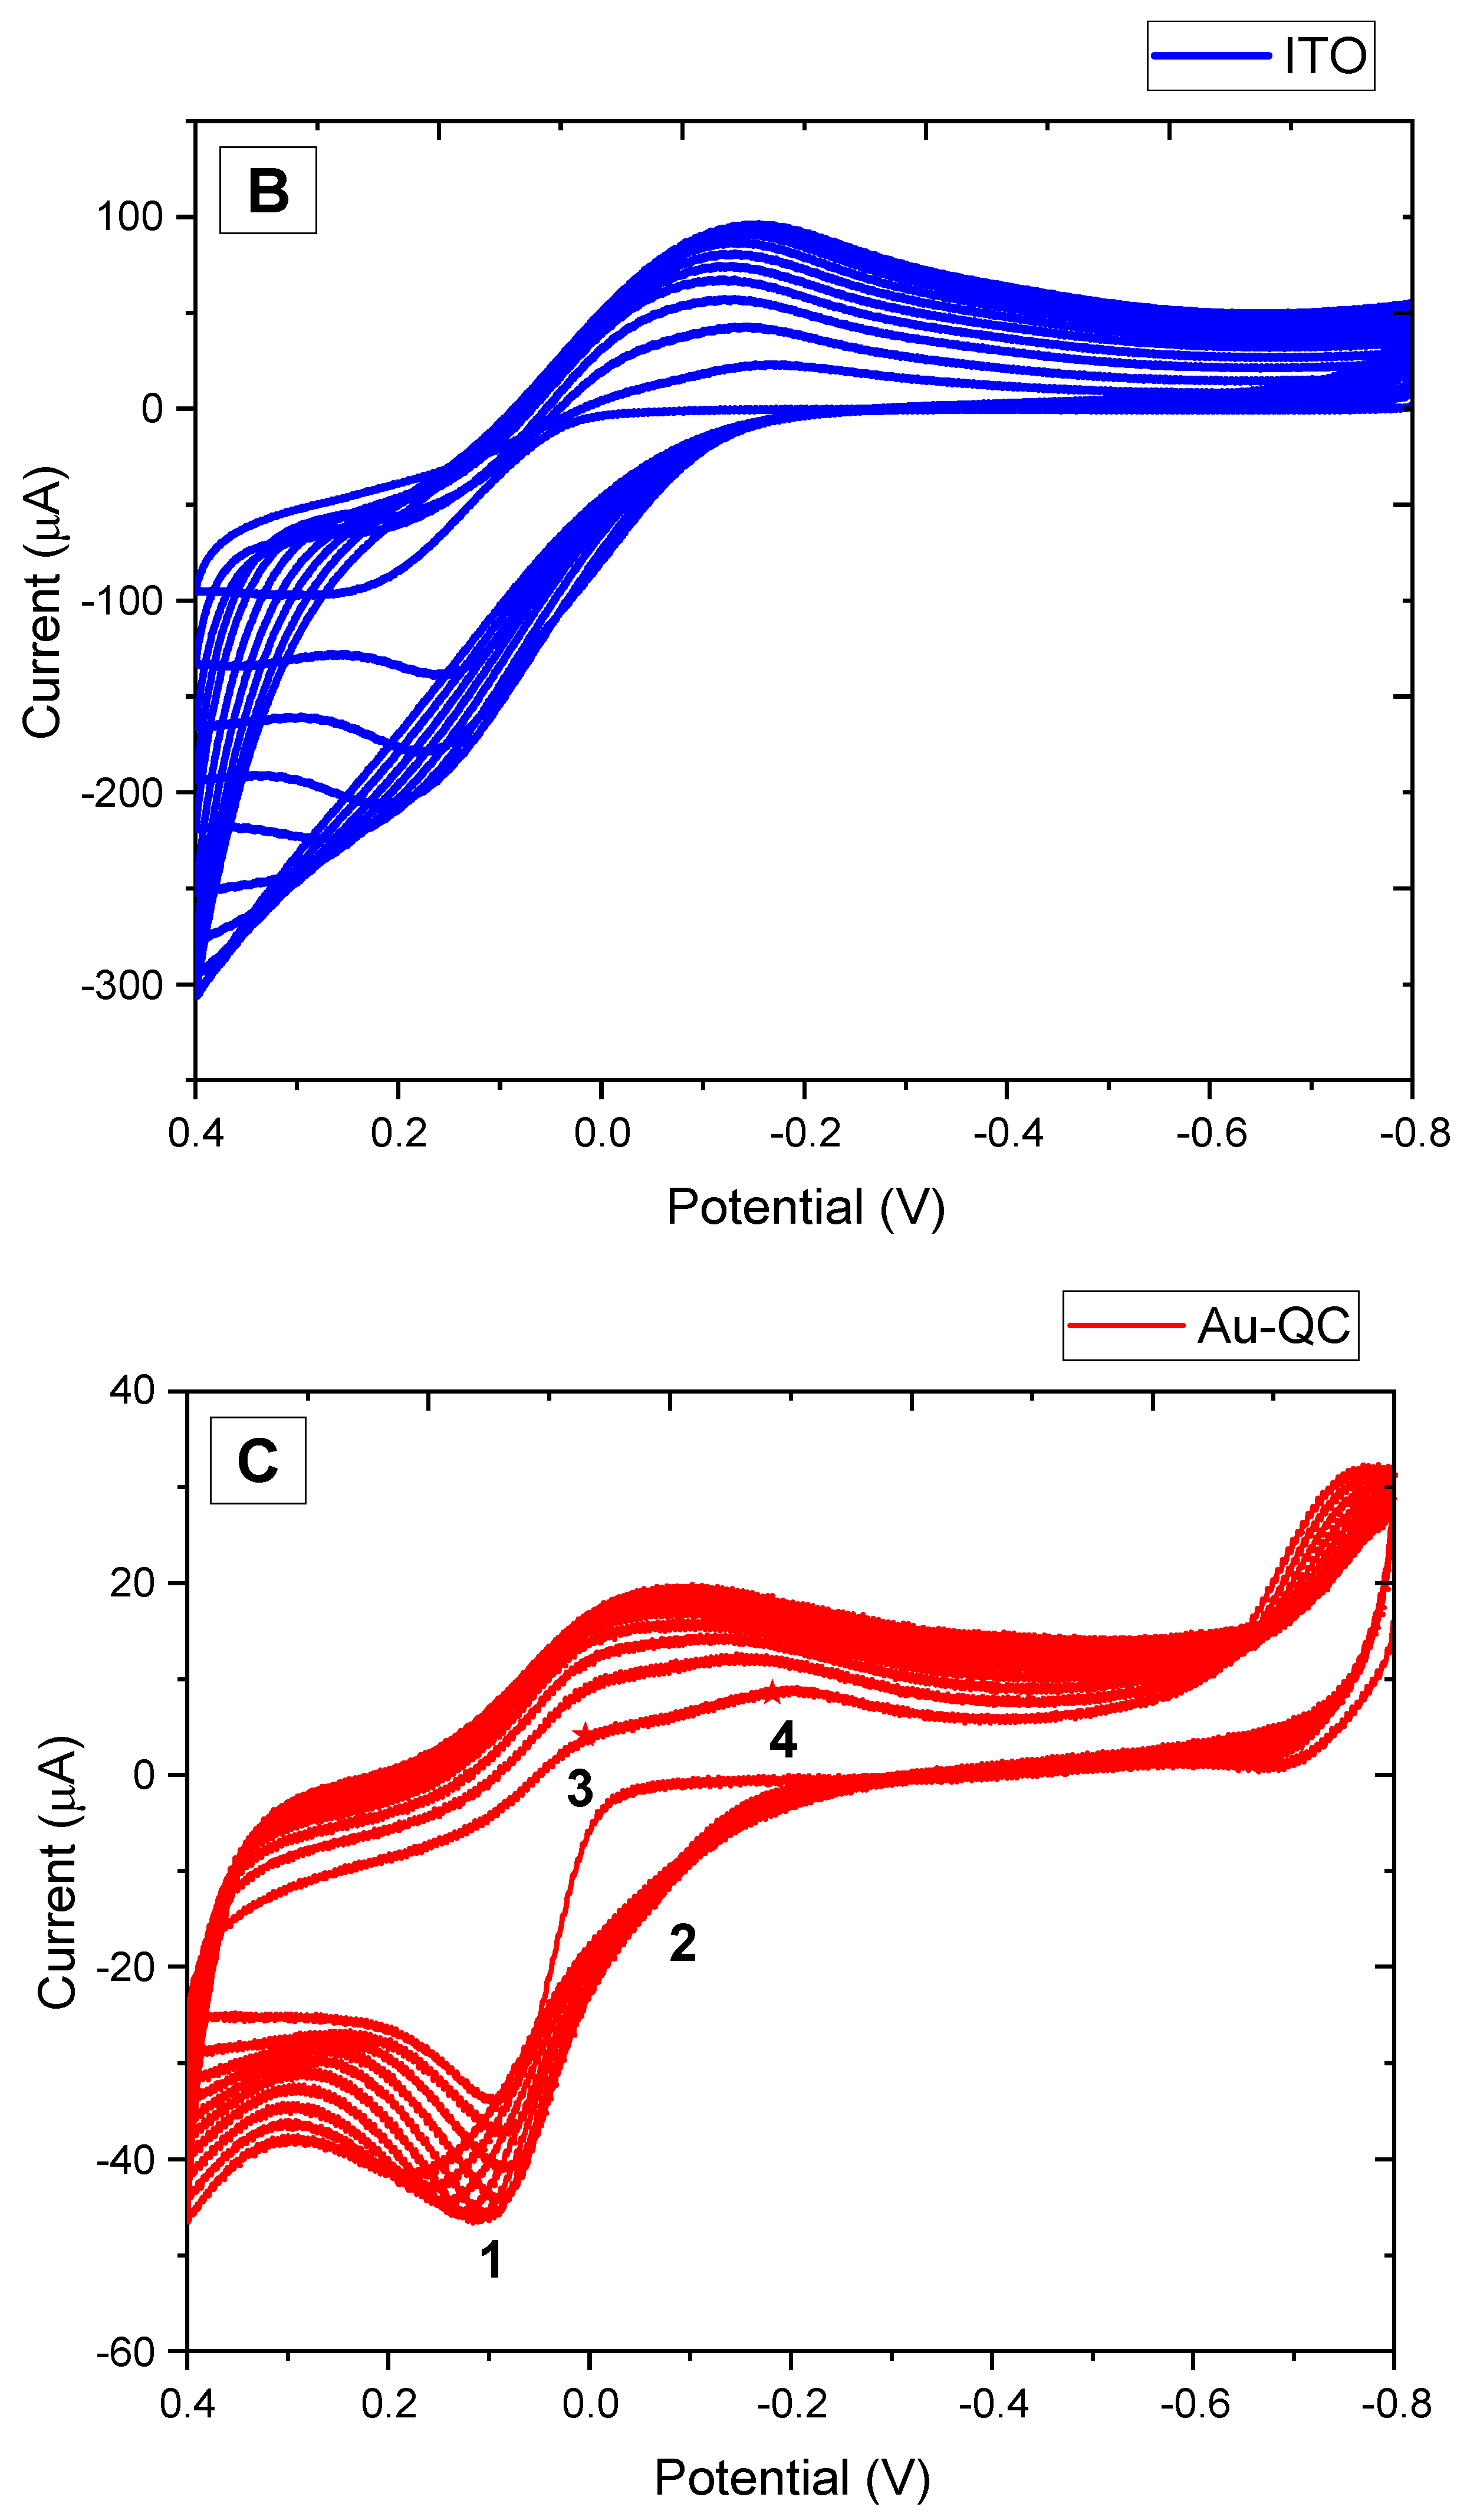
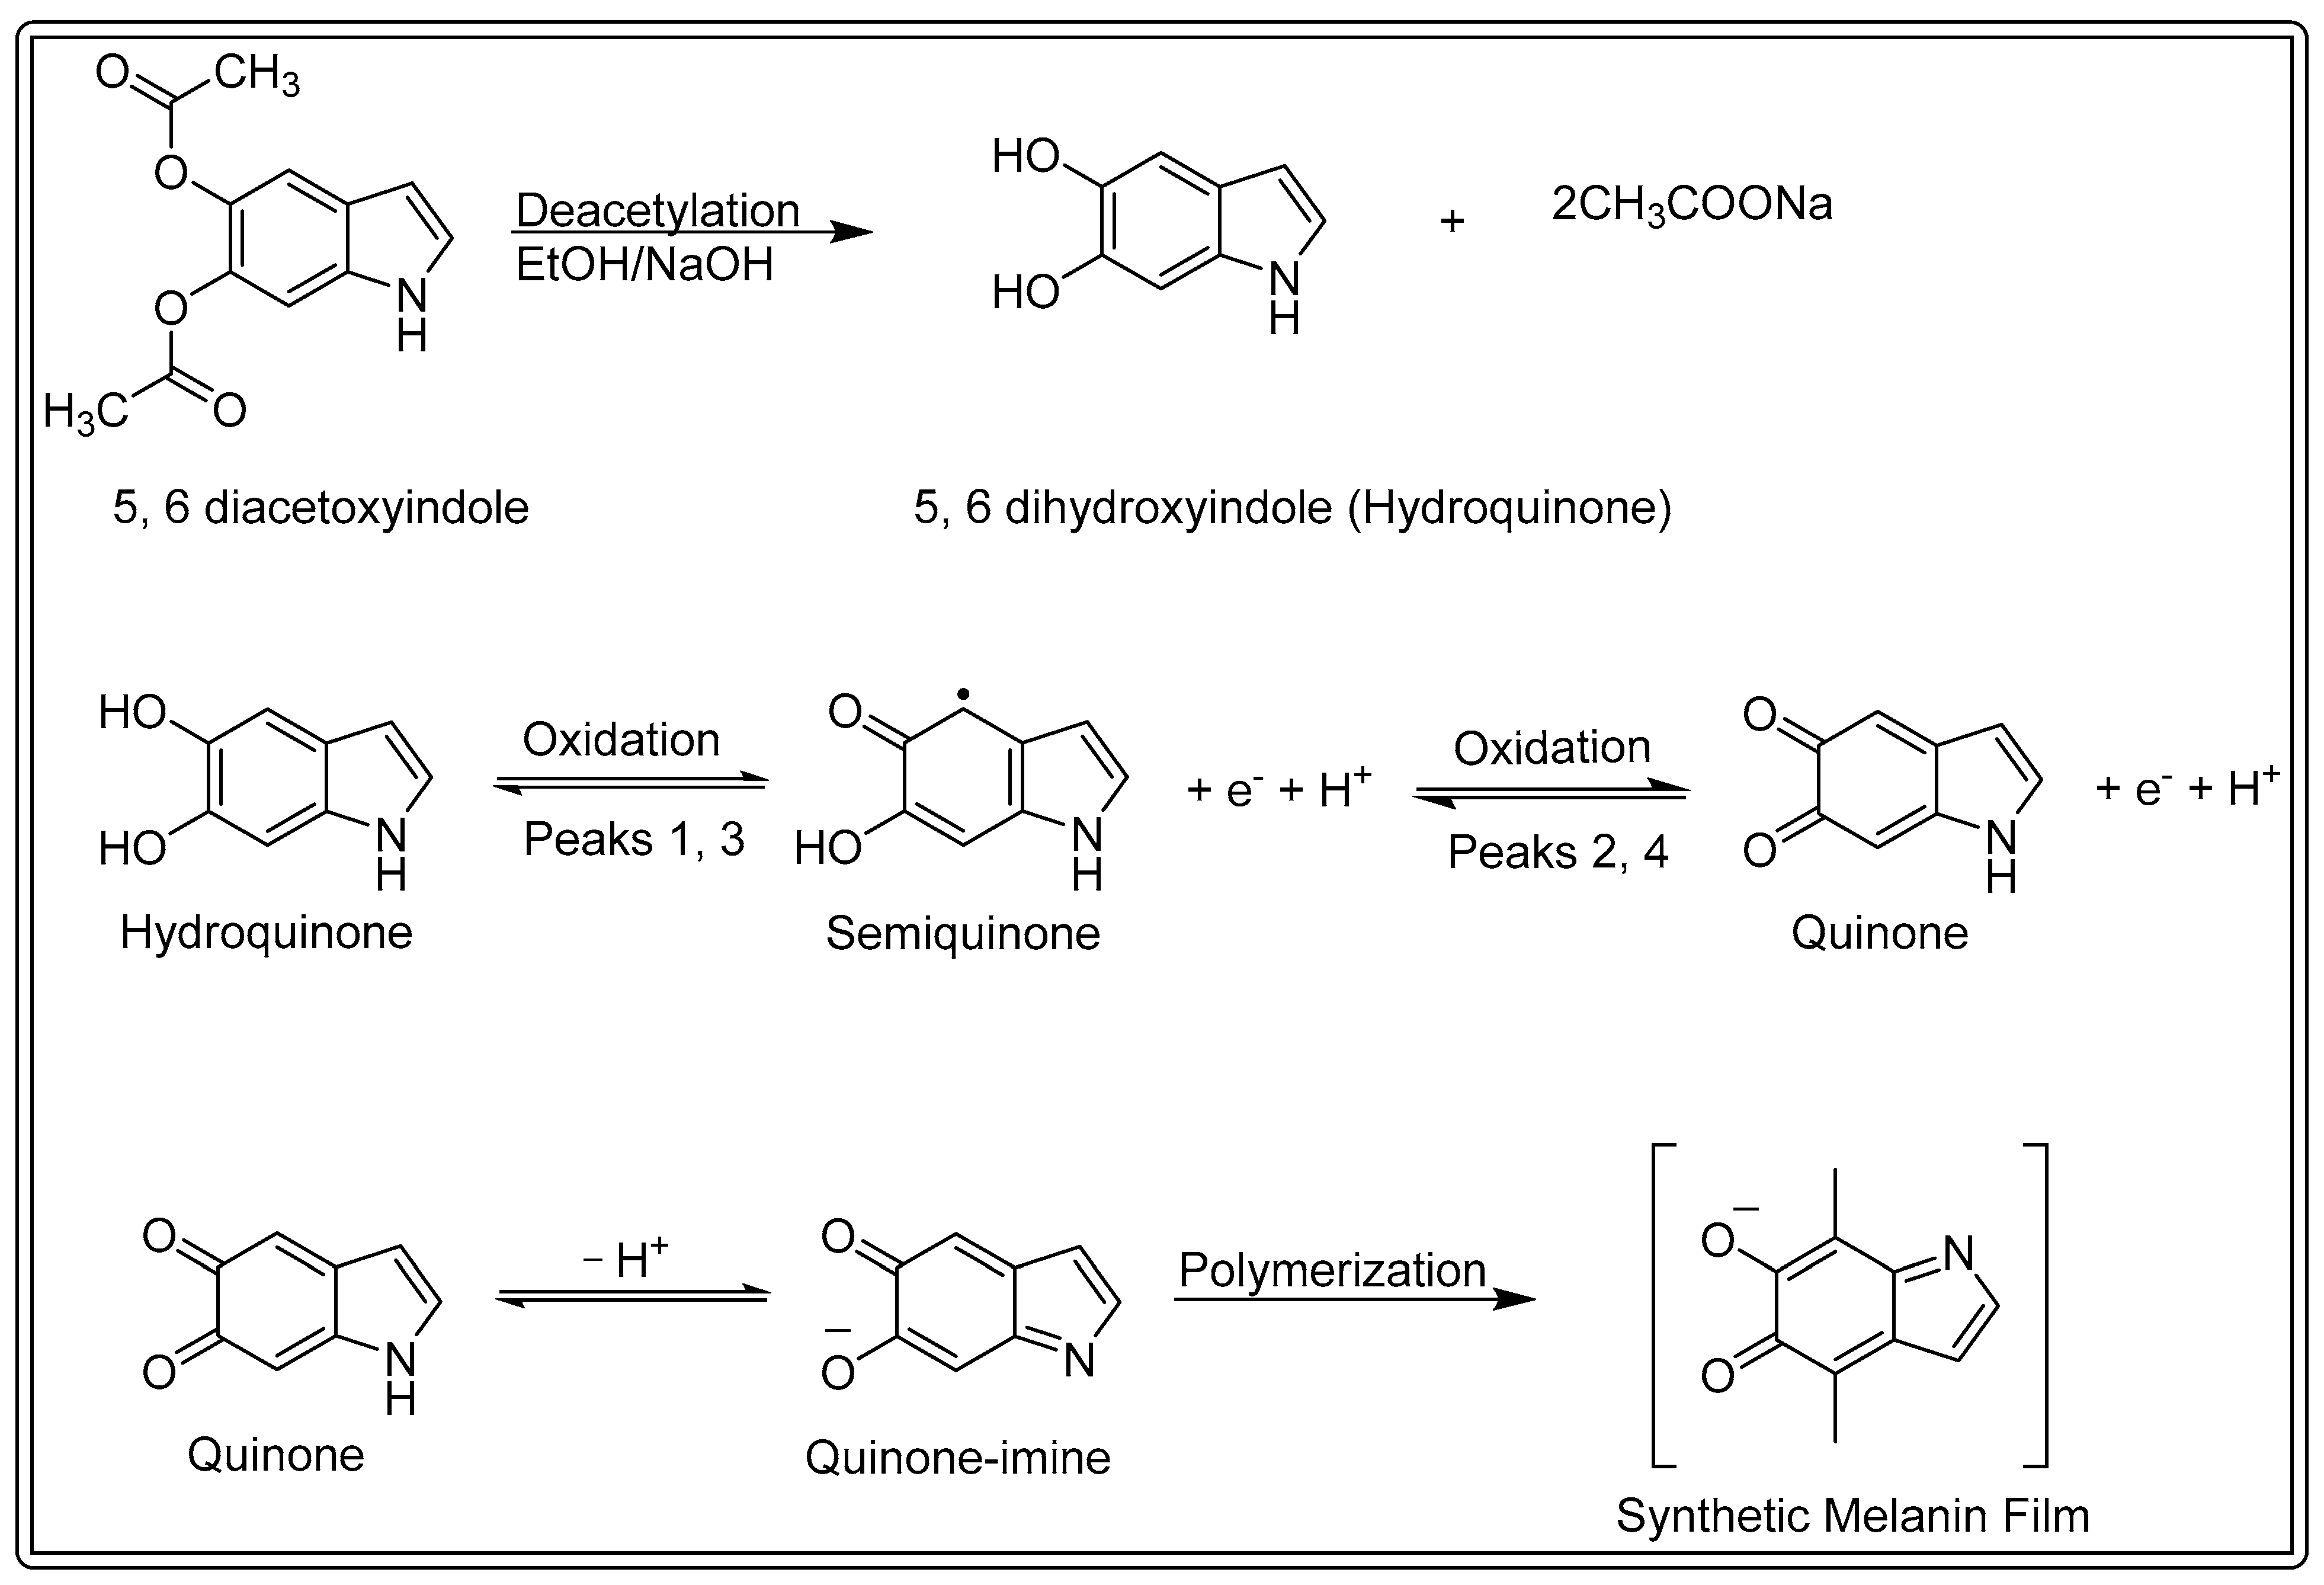
3.1. Electrochemical Synthesis of Melanin Film

The cyclic voltammograms presented in Figure 1 illustrate the typical electrodeposition process of synthetic melanin films from a 1 mM DHI monomer solution on GCE in a phosphate buffer (pH 7.4). The progressive increase in current over the 10 cycles suggests consistent polymerization and deposition of DHI precursor, which was synthesized in situ through the deacetylation of DAI using NaOH. The distinct anodic and cathodic peaks observed confirm the redox activity of the melanin-like polymer, indicative of its ability to undergo reversible electron transfer processes. The uniform growth of the peaks with successive scans highlights the successful formation of a conductive, electroactive film on the electrode surface [5,22].
This electrochemical approach to synthesizing melanin nanoparticles and thin films offers a reproducible and straightforward method for generating melanin polymeric materials with tunable electrochemical properties. Electropolymerization, particularly using CV, has emerged as an efficient strategy not only for driving the polymerization of melanin precursors like DHI but also for monitoring redox transitions and polymer growth in real-time. Previous studies have demonstrated that CV can provide detailed insight into the redox behavior, oxidation states, and polymerization kinetics of melanin-like materials, supporting the development of redox-active interfaces for sensing and other applications [23,24].
The ability to control the deposition process electrochemically makes this method advantageous for producing thin films with tailored thickness, morphology, and conductivity. Studies by d’Ischia et al. and others have shown that the electropolymerization of DHI leads to the formation of eumelanin-like films with structure-dependent electronic and optical properties [25]. Moreover, the biocompatibility and chemical stability of synthetic melanin films make them attractive for use in bioelectronics and electrochemical sensors [26].
In our work, we repeated the electropolymerization of DHI on three different substrates—GCE (A), ITO (B), and Au-QC (C)—to assess the consistency of the resulting films in terms of morphological coverage and interface quality. In all cases, the cyclic voltammograms exhibited a consistent oxidation peak for DHI at approximately +0.1 V, which aligns with findings reported in earlier studies, indicating the formation of quinonoid intermediates and the onset of polymer growth [27,28]. This reproducibility across substrates reinforces the robustness of the electrochemical method and suggests it can be adapted for device integration with minimal modification. Further studies investigating the influence of different electrode materials, including ITO and Au-QC, as explored in our experimental setup, may provide additional control over film adhesion, conductivity, and interface behavior, key factors for optimizing performance in specific application areas. However, GCE proved to be more convenient and suitable for this study due to its regenerable surface, unlike ITO and Au-QC, which were discarded after a single use. Additionally, GCE provided distinct anodic peaks, with the oxidation of DHI occurring at potentials lower than +0.1 V, as shown in Figure 1A. These features make GCE more reproducible and consistent for the formation of melanin films via DHI oxidation.
Scheme 1 outlines the deacetylation of DAI to yield DHI using sodium hydroxide as a deacetylating agent. This reaction exemplifies a straightforward yet highly efficient chemical transformation, where NaOH facilitates the removal of acetyl groups from DAI, leading to the formation of the hydroquinone form of DHI and the concomitant release of sodium acetate as a byproduct [29]. DHI, as the deacetylated product, possesses significant redox activity, making it an ideal precursor for the subsequent oxidative polymerization required for melanin synthesis. This pathway not only illustrates a direct route to obtaining DHI but also highlights its pivotal role in the electropolymerization process, which is essential for the formation of electroactive melanin films.
The ensuing oxidative polymerization of DHI is a multistep process involving several redox transformations, which are clearly depicted in the above scheme. Initially, DHI undergoes oxidation (CV peaks 1 and 3) by applying a positive potential from −0.8 to +0.4 V, generating a semiquinone intermediate, which is then further oxidized to form quinone species. These quinone derivatives, along with their imine counterparts, engage in condensation and polymerization reactions, culminating in the formation of a synthetic melanin film, primarily eumelanin. These anodic (oxidation) steps, particularly the conversion of semiquinone to quinone, correspond to distinct redox peaks in the cyclic voltammetry process, underscoring the stepwise and controlled nature of DHI oxidation. This provides valuable insight into the electrochemical characteristics of melanin formation and the role of electrochemical conditions in dictating the polymerization dynamics. These findings are consistent with previous studies that demonstrate the critical influence of electrochemical conditions on the structure and properties of polymerized melanin [30].
The final melanin film, formed through oxidative coupling of the intermediates, exhibits a complex three-dimensional network with extensive conjugated systems. This structure imparts the film with its characteristic electroactive and functional properties, which are essential for its application in fields such as sensors and bioelectronics. The electrochemical nature of the polymerization process demonstrates the critical influence of the applied potential, −0.8 to +0.4 V, on both the rate and structure of melanin polymerization, suggesting that fine-tuning these parameters can optimize the properties of the resulting films [31]. This mechanism underscores the potential of DHI-based systems for the development of advanced electroactive materials, with significant implications for future biomedical and electronic applications.
The LSV shown in Figure 2 illustrates the oxidational window of the electrodeposition process of a 1 mM DHI monomer solution on a Au-QC electrode in phosphate buffer (pH 7.4). The voltammogram indicates a sharp increase in anodic current at a specific potential of +0.1 V, representing the onset of oxidation of DHI and the subsequent initiation of polymerization on the electrode surface. This process is driven by the electrochemical conversion of DHI, synthesized in situ from the deacetylation of DAI using an equimolar ratio of NaOH. The distinct change in current demonstrates the redox-active nature of DHI and confirms the deposition of melanin-like films through oxidative polymerization [32].
The initial steady baseline, followed by a sharp increase in current within the 0.0 to +0.1 V potential window, suggests the formation of an electroactive film on the electrode surface. This behavior is consistent with the generation of quinone and semiquinone intermediates during the oxidation process, as seen in Scheme 1. The Au-QC electrode, with its superior conductivity and catalytic properties, facilitates this polymerization process efficiently. This technique highlights the use of LSV not only to monitor the oxidation potential of DHI but also as a tool for controlling the deposition of melanin films with desired electrochemical characteristics, making it an essential step in the fabrication of bioelectronic and sensing materials.
The EQCM analysis in Figure 3 provides insight into the electrodeposition process of DHI on a Au-QC electrode at a constant potential of 0.4 V over 700 s. The current (black dashed line) decreases gradually with time, indicating the progressive passivation of the electrode surface due to the formation of a melanin-like polymer film. Simultaneously, the charge (red dotted line) accumulates, demonstrating the continuous polymerization and deposition of the material. The concurrent decrease in frequency (blue solid line) correlates with the increasing mass on the quartz crystal, which confirms the successful deposition of the DHI-derived polymer.
This microbalance analysis highlights the real-time relationship between mass deposition, charge transfer, and electrochemical behavior during the DHI electrodeposition process. The decreasing frequency suggests a uniform and consistent increase in the film’s mass on the Au-QC electrode, while the current profile reflects the dynamics of redox processes involved in the oxidative polymerization of DHI. This method provides valuable data for characterizing the growth kinetics and mass-loading efficiency of synthetic melanin films, which is critical for optimizing their properties in bioelectronics, coatings, and sensor applications. The measurement of EQCM analysis showed that approximately 70 ng of melanin was deposited on the surface of Au-QC. The mass of the deposited film was estimated using the Sauerbrey equation, which relates the change in resonant frequency of the quartz crystal to the mass per unit area [20,33]. Using our Au-QC, which has a 7.995-MHz fundamental frequency, a net change of 1 Hz corresponds to 1.34 ng of mass adsorbed on a crystal surface area of 0.196 cm2; we estimated the mass of melanin deposition as 70 ng.
Using the Sauerbrey equation, the calculated mass of polymerized melanin at a frequency shift of −57 Hz and a deposition time of 700 s is approximately 70 ng. Based on the Au-QC electrode surface area of 0.196 cm2, the corresponding film thickness is estimated to be 3 µm. This value is significantly lower than that reported by the Ball research group, which can be attributed to the much shorter deposition time in our experiment, approximately 1/7 of the duration used in their study [33,34]. The shorter deposition time in our experimental setup was intentionally chosen to align with the duration of DHI electropolymerization by CV, allowing for a direct and consistent estimation of the synthetic melanin film thickness.

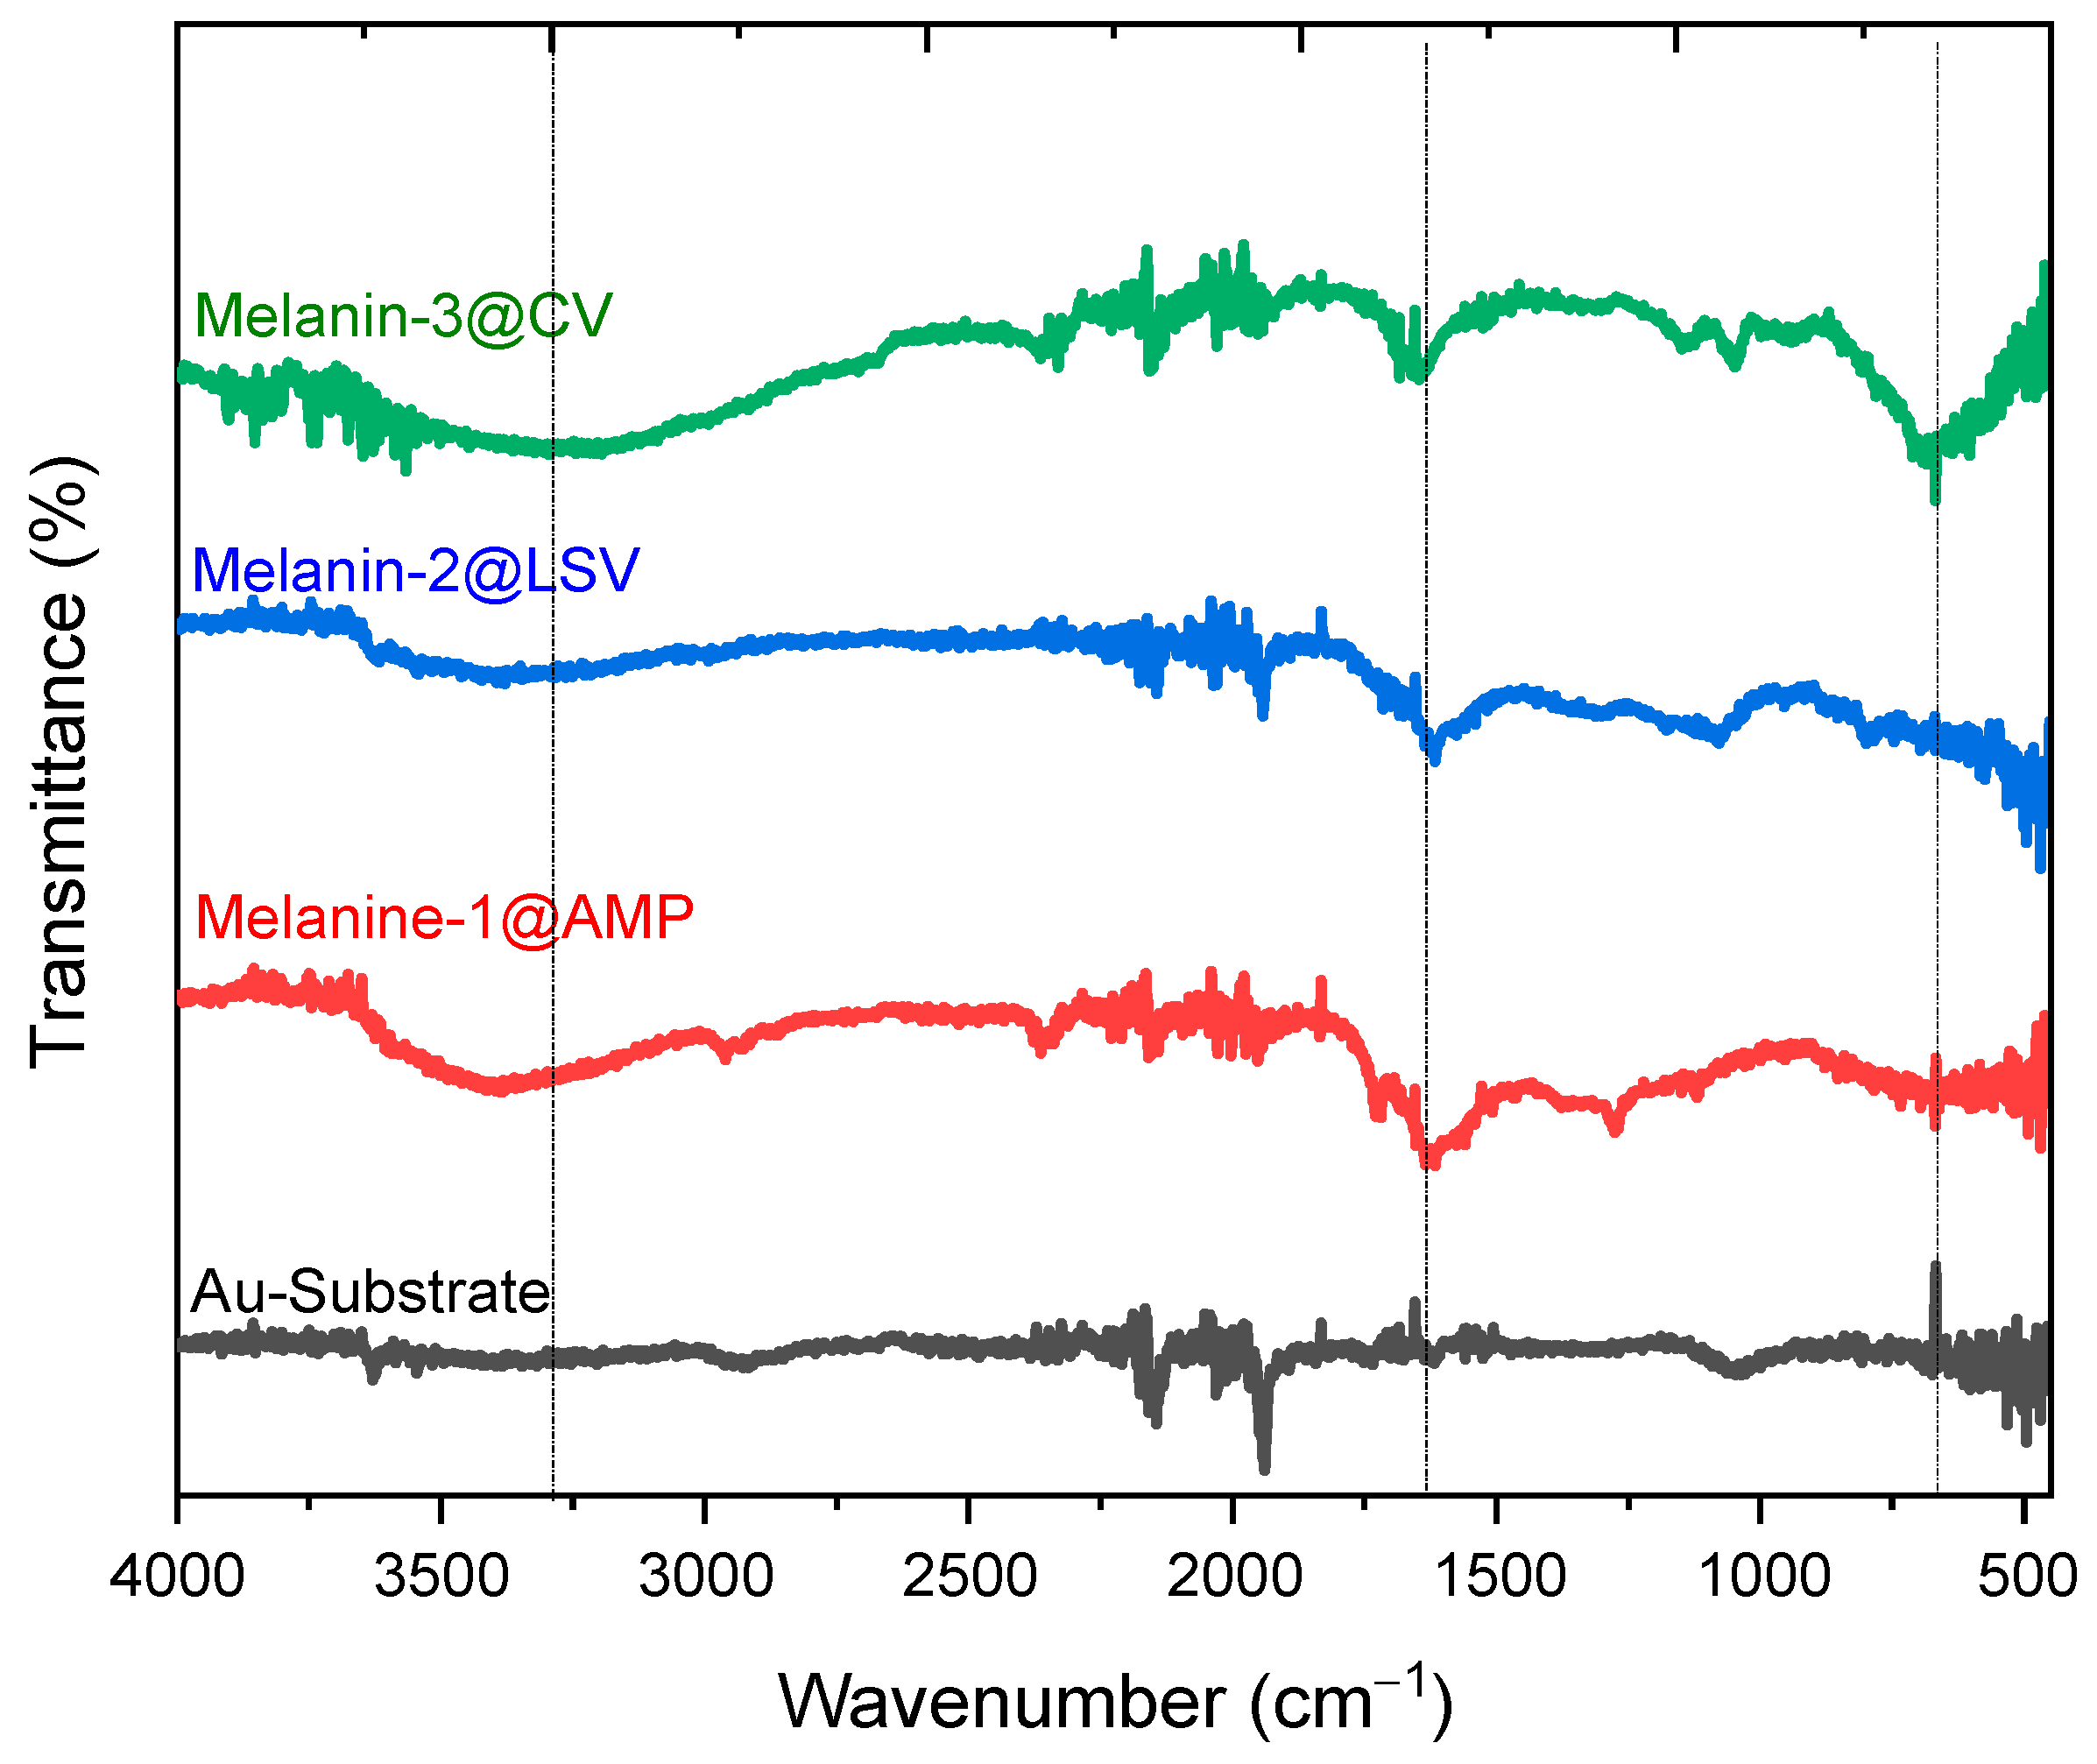
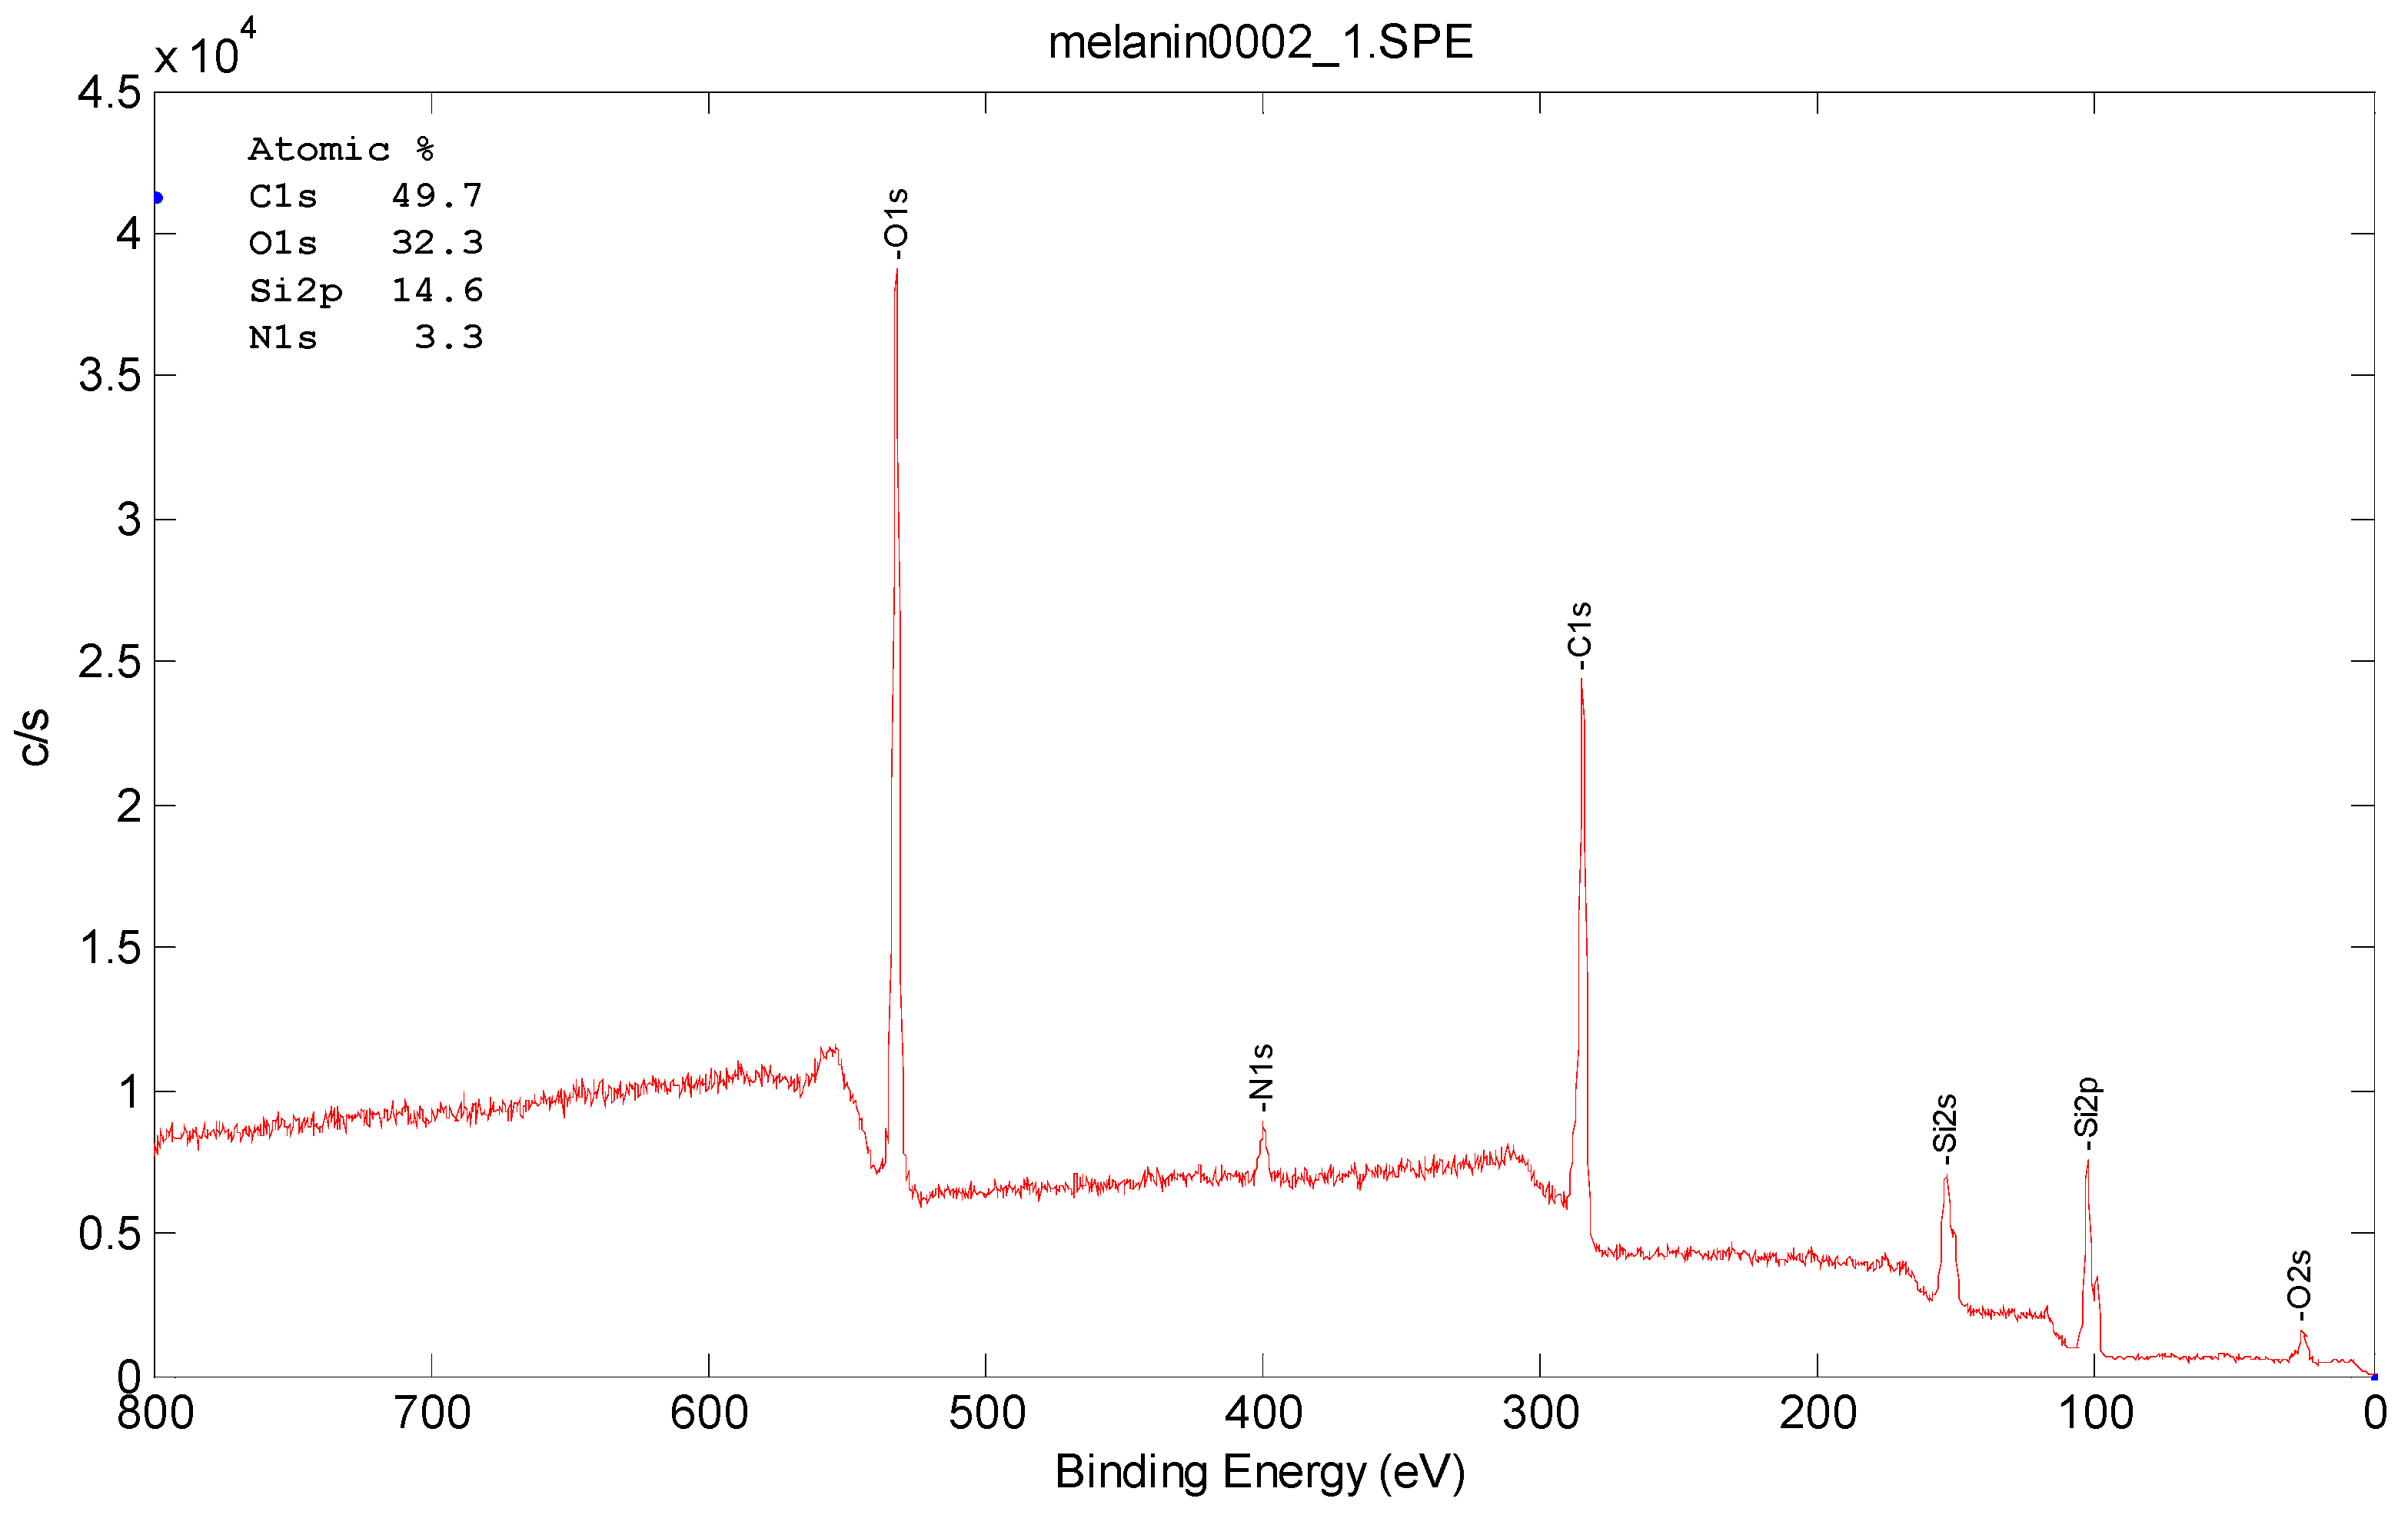
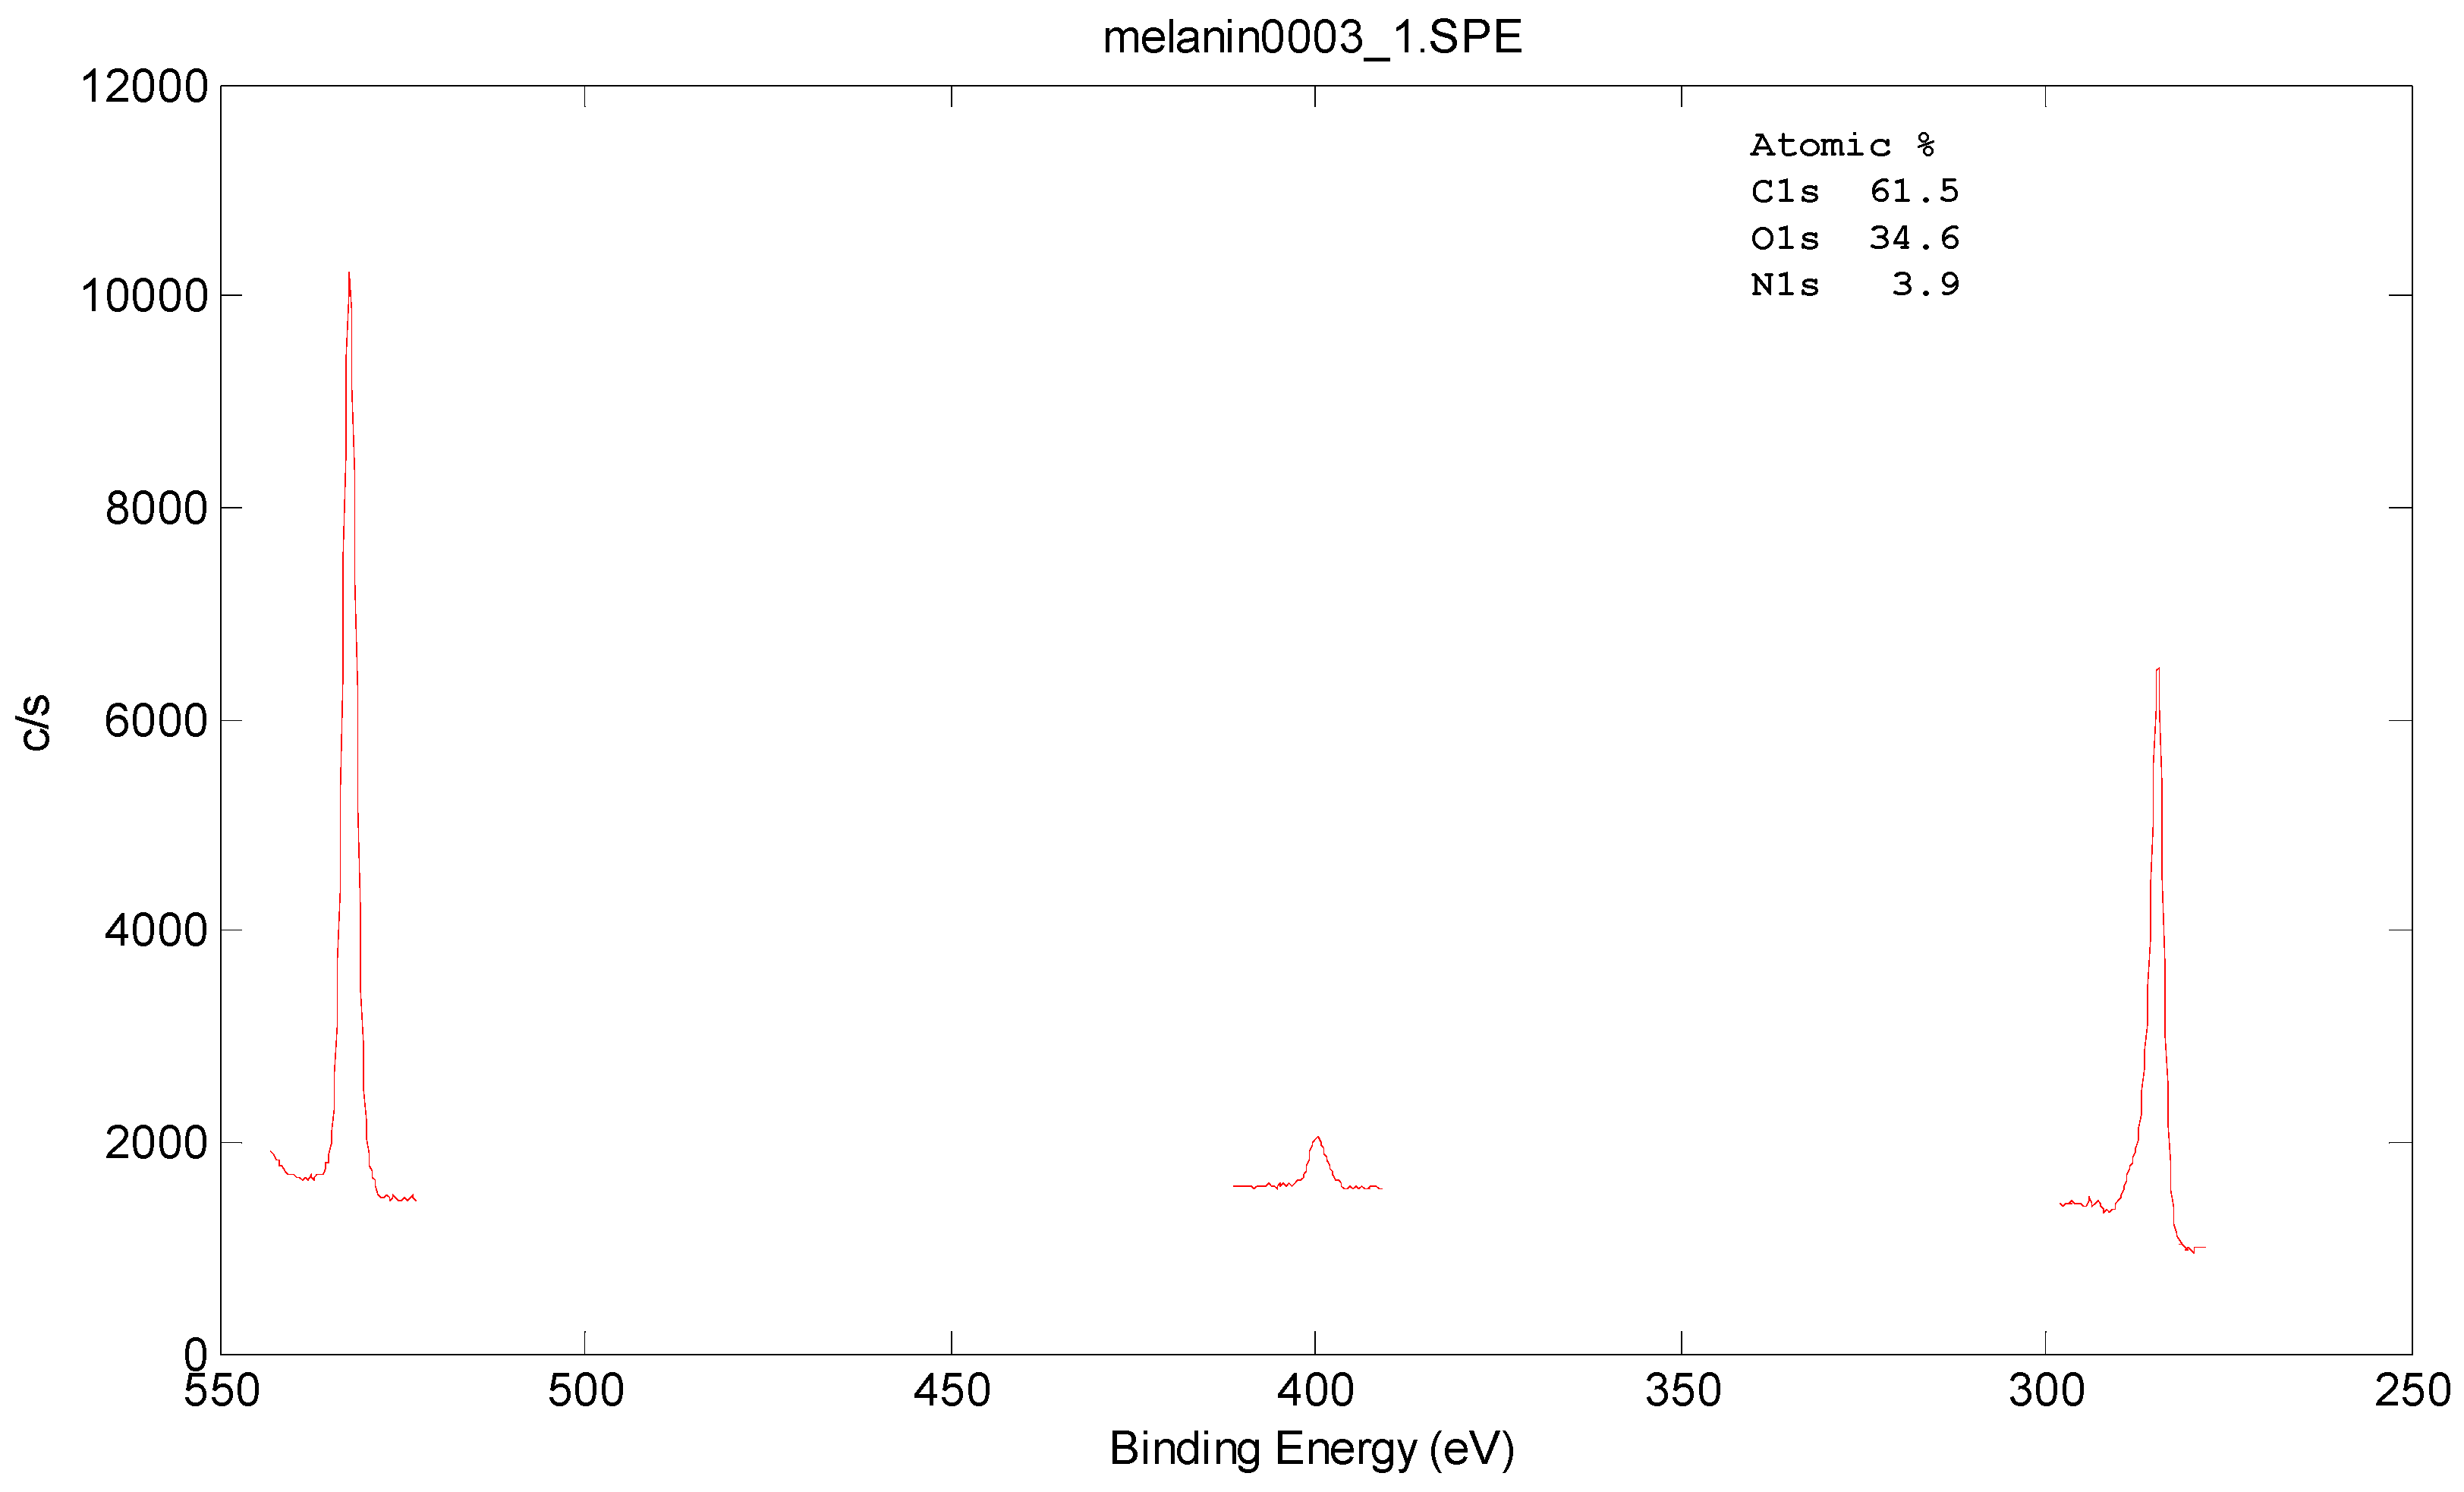
3.2. Spectroscopic Analysis

The UV–Vis spectra in Figure 4 reveal the progressive formation of melanin during the electropolymerization of DHI on an ITO electrode. The three spectra, labeled as Melanin-1, Melanin-2, and Melanin-3, correspond to different stages of the experiment. Melanin-1, taken before CV, shows the characteristic peak of the melanin precursor DHI at 310 nm, indicating its monomeric form and confirming the absence of melanin auto-polymerization. After running CV (Melanin-2), there is an observable increase in absorbance across the UV–Vis spectrum, particularly in the UV region at 220 nm, coupled with a decrease in the DHI characteristic peak at 310 nm, signifying the initiation of DHI polymerization. The final spectrum (Melanin-3), taken after the solution turned purple approximately two hours into the experiment, displays a further increase in absorbance at 220 nm and a significant reduction of the DHI peak, reflecting the continued polymerization and the development of the characteristic melanin structure. The increased absorbance in the UV region for Melanin-3 corresponds to the typical broadband absorption at 220 nm associated with melanin, attributed to its complex network of conjugated systems. This spectral evidence supports the conclusion that melanin polymerization occurs progressively, driven by the electrochemical oxidation of DHI during CV [35,36].
The progression of absorbance and the associated color change—from colorless to pink to purple—corresponds to the oxidation and polymerization of DHI into melanin. As polymerization advances (Melanin-2 and Melanin-3), the DHI-attributed peak diminishes, and the absorption spectrum becomes broader and featureless, indicating the formation of a complex, heterogeneous polymer network [17,18,35,36,37]. These results confirm the successful electrochemical polymerization of a thin film of melanin nanoparticles on the ITO slides and demonstrate how the formation of melanin and its spectroscopic characteristics can be monitored in real-time during CV electrodeposition.
The ATR-FTIR spectra shown in Figure 5 provide a comparative analysis of melanin films synthesized using different polymerization techniques on a Au-QC electrode. Each spectrum reveals characteristic functional groups of melanin, including broad absorption bands around 3200–3400 cm−1 corresponding to hydroxyl (-OH) and amine (-NH) stretching vibrations, and peaks near 1600 cm−1 and 1500 cm−1 attributed to aromatic ring vibrations and quinone groups. The spectra confirm the presence of key chemical functionalities typical of the DHI moiety that provides the conjugated polymeric structure of melanin, regardless of the polymerization method or the setup of each electrochemical technique [36]. However, the differences in the intensity and position of peaks between Melanin-1, Melanin-2, and Melanin-3 highlight the impact of the polymerization technique on the film’s morphology and structure. Melanin-3, synthesized via cyclic voltammetry, exhibits slightly sharper and more defined peaks, suggesting a more ordered polymer structure compared to films generated by amperometry (Melanin-1) or linear sweep voltammetry (Melanin-2). It also shows a new peak at 687 cm−1 which is suggested to be related to a binding between the electropolymerized melanin film and Au-QC electrode [38,39].
The IR spectra of synthetic and natural melanin showed similar functional groups to the electrodeposited films in our case, with slight variations in peak intensity, reflecting potential differences in the physical and chemical properties of the melanin deposition on Au-substrate using electrochemical methods [39]. Our results highlight the versatility of synthetic melanin deposition methods and the ability to tailor film properties for specific sensing applications by selectively choosing the appropriate electrochemical technique, controlling the applied potential, and optimizing experimental conditions.

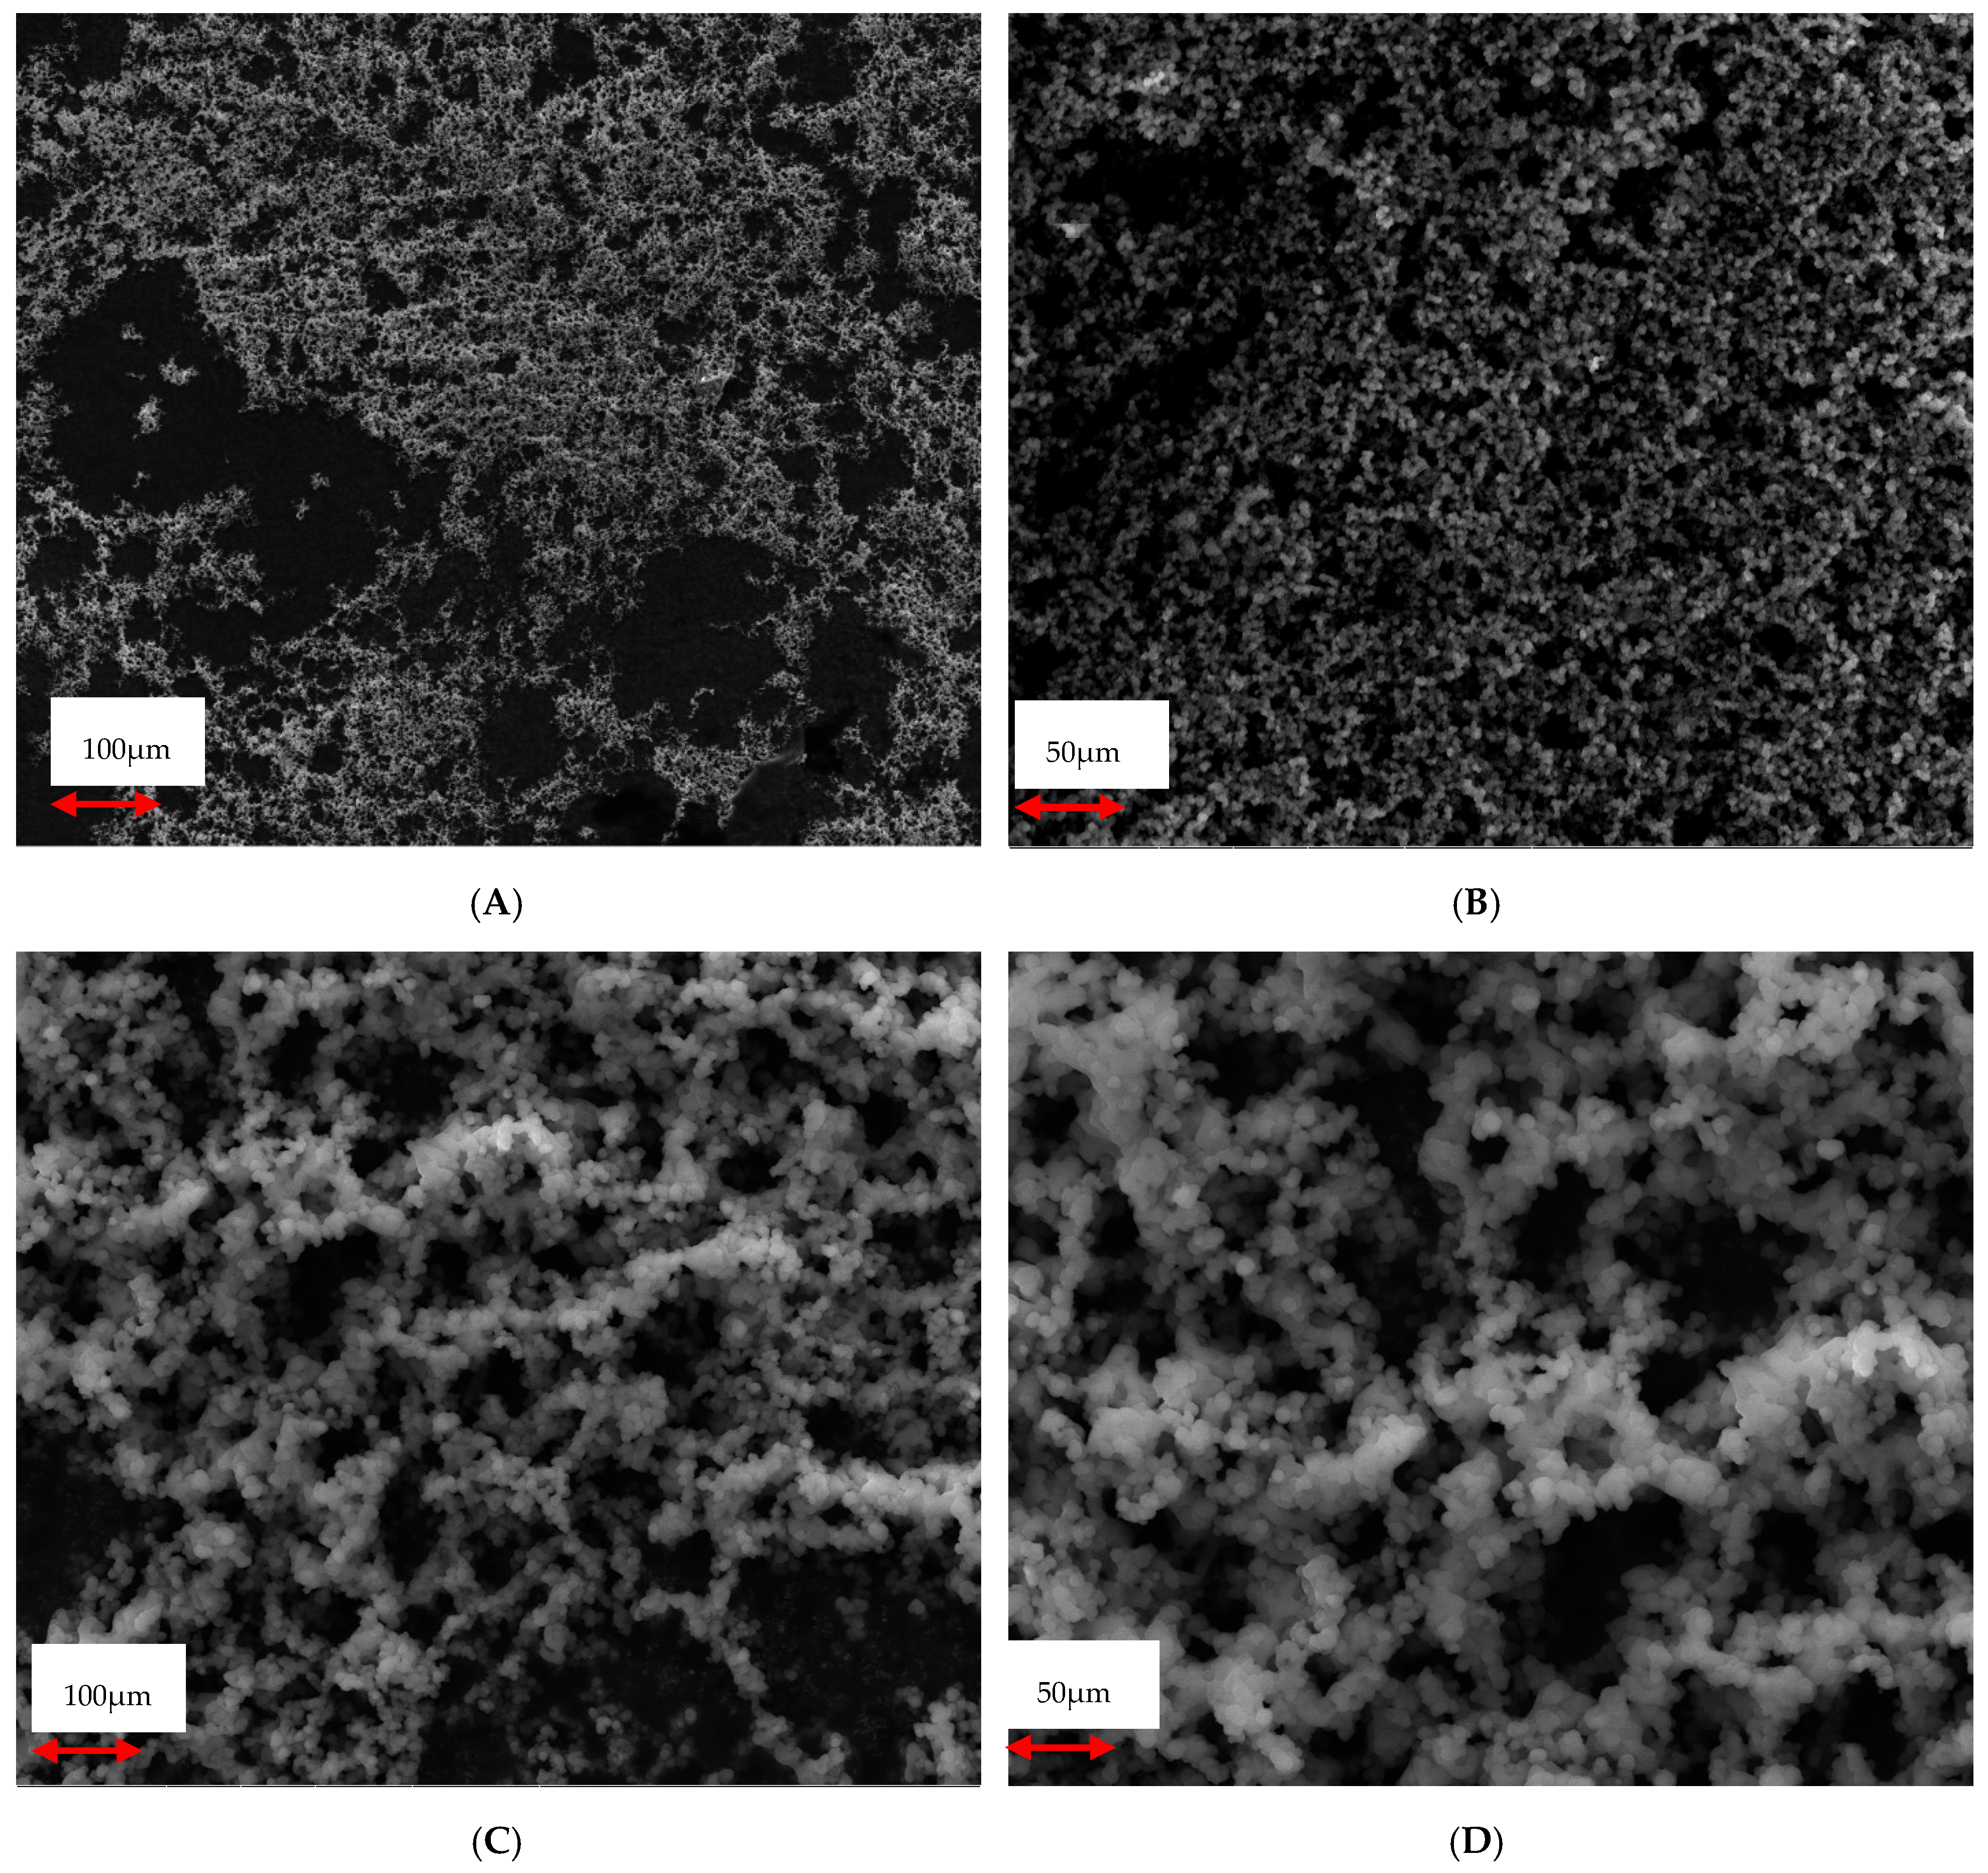
3.3. Morphology and Surface Characterizations

The SEM micrograph presented in Figure 6 reveals the morphological characteristics of melanin films deposited on various substrates, including ITO and Au-QC electrodes at high and low magnifications. The image displays a highly interconnected network of melanin nanoparticles, with an average particle size of approximately 98 nm. This nanoparticulate structure contributes to the high surface area and porous nature of the film, essential for applications requiring enhanced electrochemical activity and electron flux, such as biosensing and energy storage [24,40,41].
The uniformity and dense aggregation of melanin particles observed in the micrographs of Figure 6A,C on ITO and Au-QC electrodes indicate effective electrodeposition, regardless of the substrate material. The nanoscale features and rough surface morphology enhance the film’s capacity for electron transfer and ion diffusion, which are critical for its performance in electrochemical applications. The SEM analysis provides visual confirmation of the successful synthesis of melanin nanoparticles, supporting the material’s versatility for integrating into diverse sensing platforms [42].
As shown in Figure 6, the morphology of the melanin film is illustrated through high-resolution SEM micrographs at different magnifications—low (1000×, 100 μm) and high (5000×, 50 μm). All images reveal the uniform structure of the melanin film, consisting of stacked multilayers. At higher magnification, spherical, ball-shaped particles with an average diameter of approximately 97 nm are visible, as shown in Figure 6D. These SEM results align with previously published micrographs of naturally occurring melanin nanoparticles [43,44].
The Energy Dispersive X-ray (EDX) spectrum in Figure 7 provides the elemental composition of the synthetic melanin film deposited on an ITO transparent electrode using the CV electropolymerization technique. The spectrum displays characteristic peaks for carbon (C), nitrogen (N), and oxygen (O), which are the primary constituents of melanin. The prominent carbon peak reflects the organic nature of the film, while the presence of nitrogen and oxygen confirms functional groups such as amines, hydroxyls, and quinones, which are typical of melanin. Notably, the nitrogen peak appears relatively small, which is expected due to the low N/C atomic ratio, approximately 1:16, consistent with reported melanin compositions [45].
This elemental analysis supports the successful synthesis of melanin, as the observed elements align with its expected molecular structure. The presence of nitrogen suggests the incorporation of indole-based units, while oxygen indicates the presence of redox-active groups that contribute to melanin’s electrochemical properties. The EDX results, in combination with other characterization techniques, confirm the formation of a homogeneous and chemically consistent melanin film, suitable for applications in bioelectronics, energy storage, and surface coatings [19,46].
The XPS spectrum of the synthetic melanin film depicted in Figure 8 demonstrates the chemical composition and bonding states of the elements present in the material. The dominant peaks at binding energies corresponding to C1s (49.7%) and O1s (32.3%) indicate the major contributions of carbon and oxygen to the composition of the melanin film. The smaller peak for N1s (3.3%) further shows the presence of nitrogen, which aligns with the expected structure of melanin, as the nitrogen atomic ratio is relatively small compared to the carbon atomic ratio in the polymeric structure of melanin. Additionally, the peak for Si2p (14.6%) may be attributed to contributions from the underlying substrate during the film deposition process.
The characteristic peaks for C1s, N1s, and O1s confirm the presence of core elements of melanin, suggesting successful synthesis of the film using CV electropolymerization. The high-intensity C1s peak is indicative of carbon’s dominance in the polymeric structure of melanin, which is consistent with the aromatic and indole-like motifs characteristic of its structure. Similarly, the O1s peak corresponds to oxygen-containing functional groups, such as hydroxyl or quinone groups, which are integral to the redox activity of melanin. The lower intensity N1s peak suggests a lower abundance of nitrogen, possibly due to the formation of a polymer with varying degrees of indole-containing units. These findings validate the electrochemical polymerization method’s effectiveness in producing a melanin-like film with distinct elemental signatures [47]. Further analysis of the binding energy shifts and atomic peak deconvolutions could provide insights into the chemical states and interactions within the synthesized material. However, the appearance of characteristic peaks associated with the melanin moiety is sufficient to confirm the successful formation of the synthetic melanin film, indicating effective electrochemical deposition on the electrode surface.
The high-resolution XPS spectrum of the synthetic melanin film presented in Figure 9 provides insight into the elemental composition and bonding states of the material. The spectrum shows distinct peaks corresponding to binding energies of approximately 285 eV for C1s, 399 eV for N1s, and 531 eV for O1s. These peaks confirm the presence of carbon, oxygen, and nitrogen as primary components, with an elemental composition of 61.5% carbon, 34.6% oxygen, and 3.9% nitrogen. The calculated C:O:N ratio of roughly 16:9:1 aligns well with the expected molecular structure of melanin, where carbon dominates due to the extensive aromatic and polymeric backbone.
The binding energy values provide further insights into the chemical states of the elements. The C1s peak at ~285 eV corresponds to sp2-hybridized carbon atoms in aromatic and conjugated systems, characteristic of the indole and quinone structures in melanin [48]. The O1s peak at ~531 eV suggests that oxygen is present in hydroxyl and quinone functional groups, which play critical roles in melanin’s redox activity and chemical stability. The N1s peak at ~399 eV corresponds to nitrogen atoms involved in amine or imine groups, consistent with melanin’s indole-based units. This spectral analysis confirms the successful synthesis of a melanin-like film via CV electropolymerization, demonstrating its characteristic elemental and bonding composition.

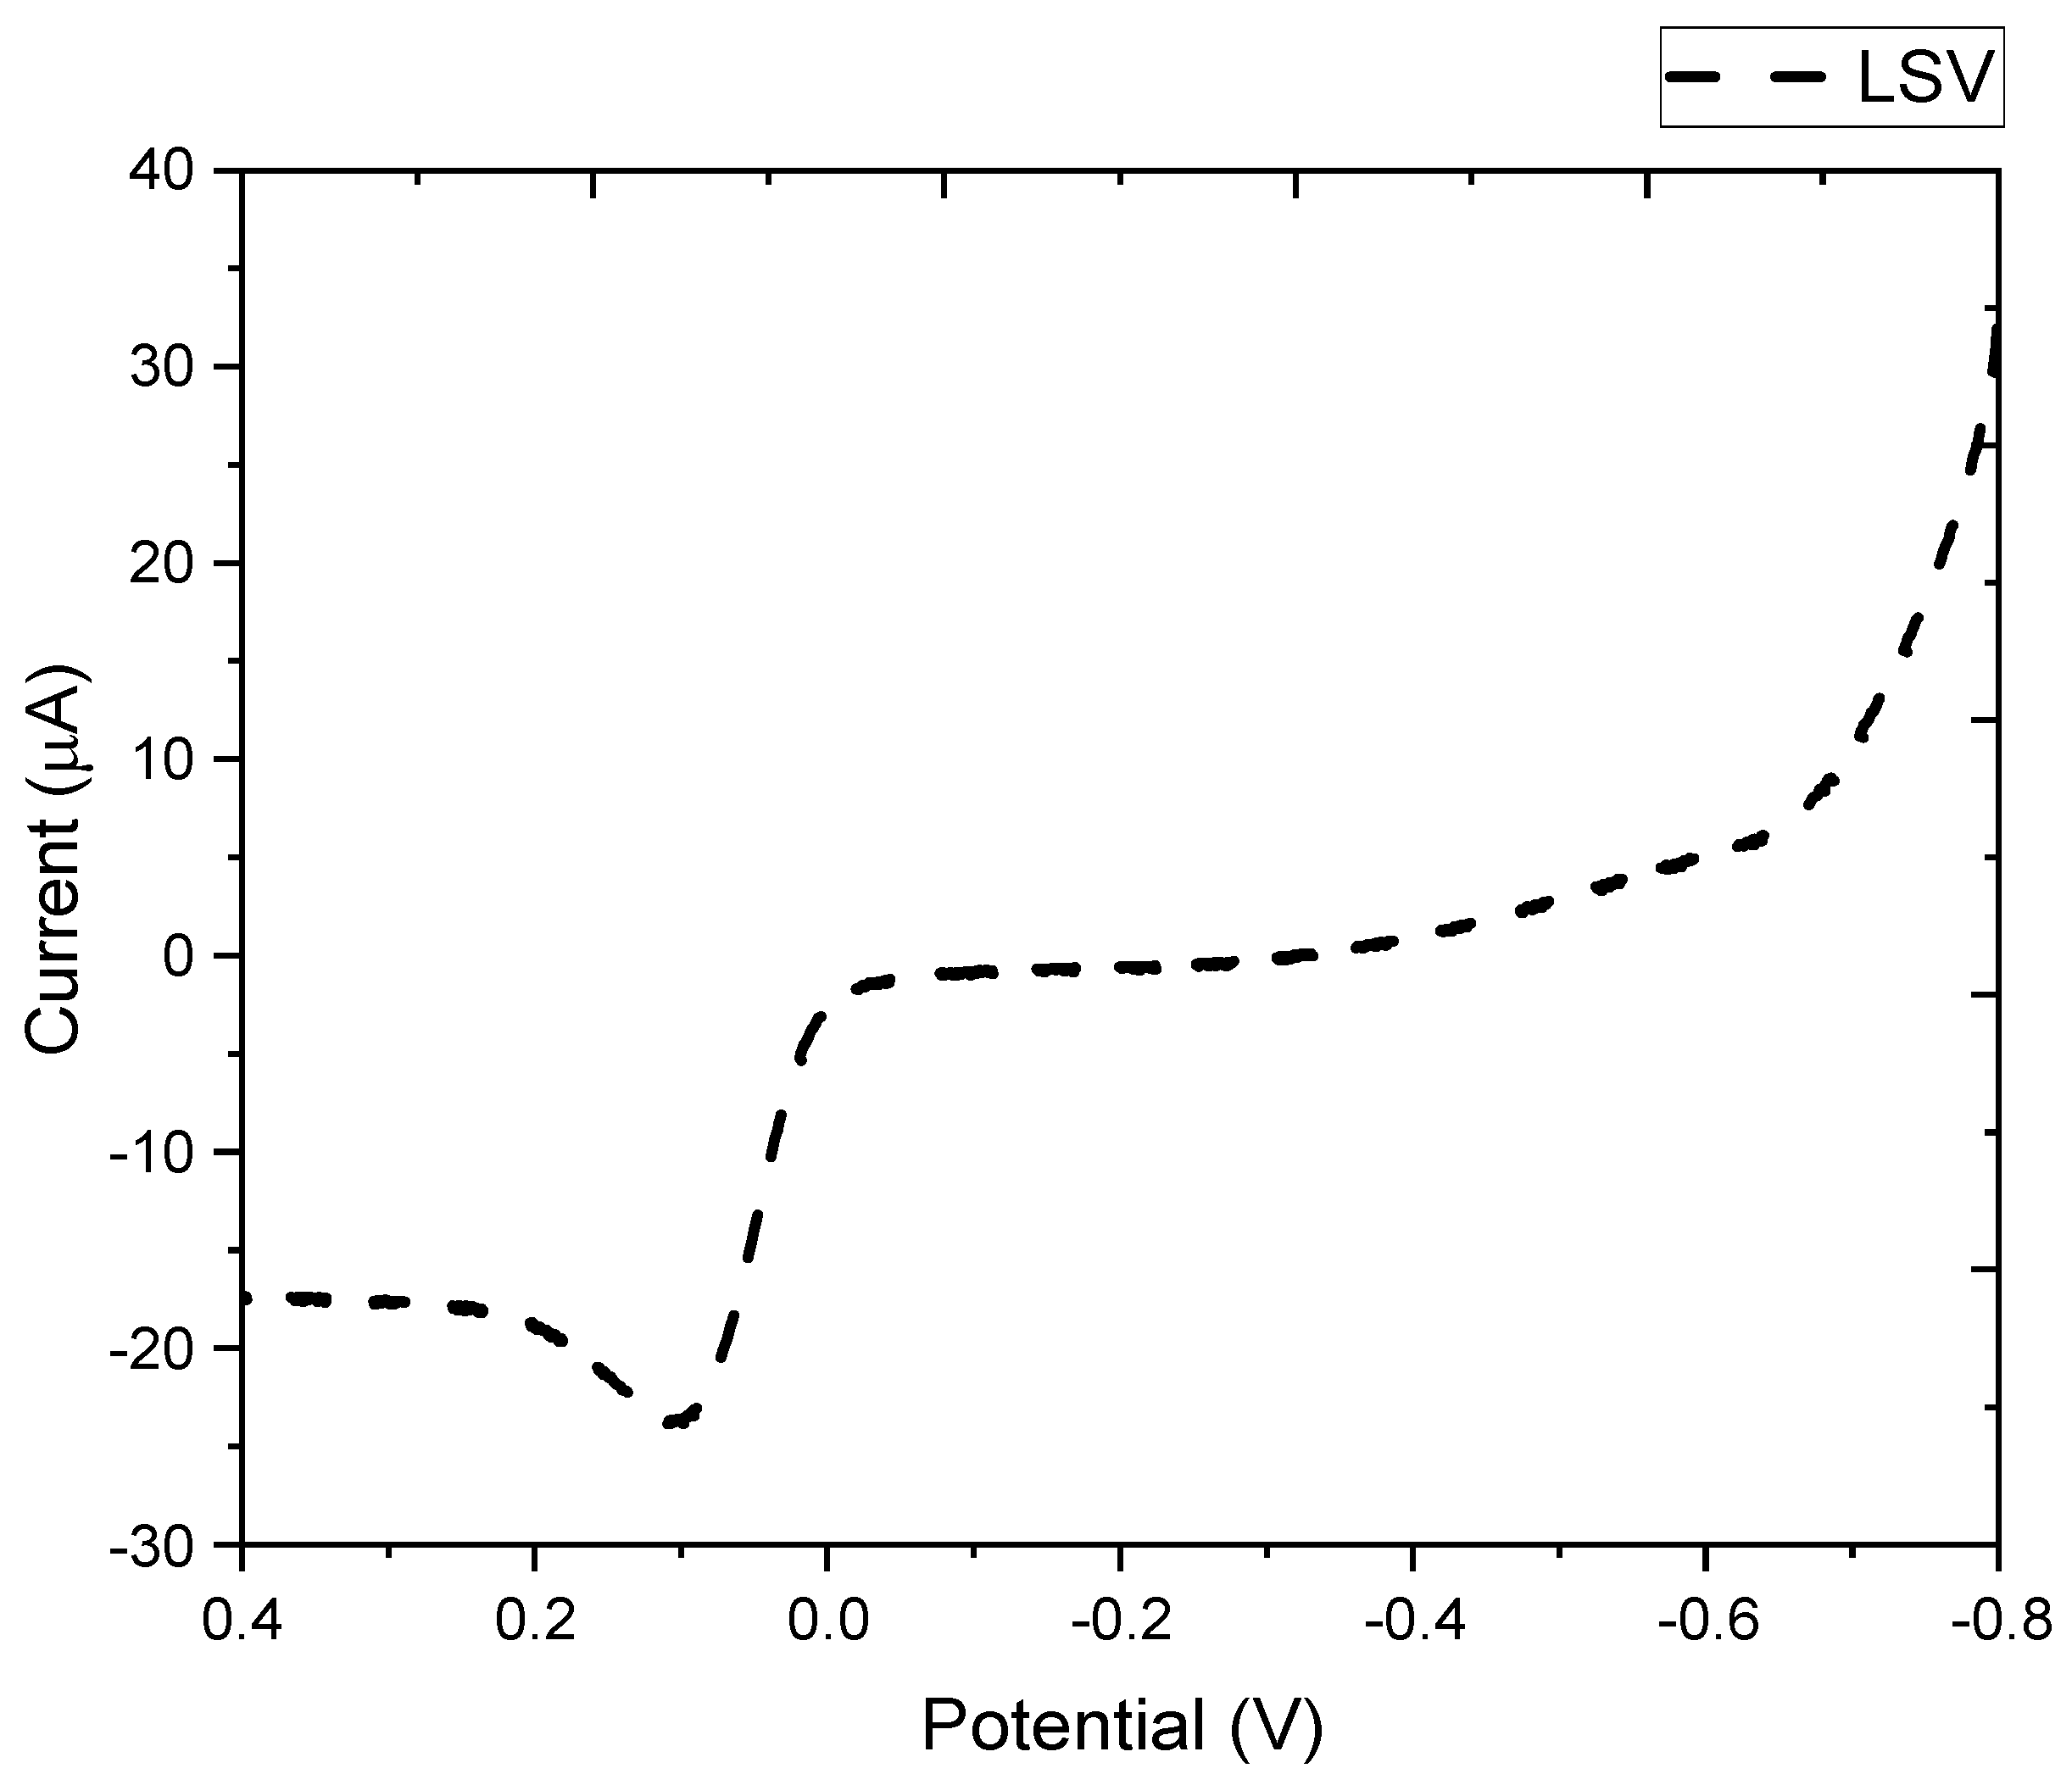
3.4. Electrochemical Activity and Electrode Performance

The amperometric responses shown in Figure 10 represent the performance of GCE modified with melanin films in detecting heavy metal ions. As 10 ppm solutions of Fe, Ni, Co, Cd, Zn, and Pb are consecutively added, distinct current responses are observed at an applied potential of +0.4 V vs. Ag/AgCl in 100 mM sodium nitrate electrolyte. Fe, Ni, and Co metal ions demonstrate a characteristic increase in current, reflecting the electrode’s sensitivity and the electrochemical interaction of these metal ions with the melanin-modified surface compared to Cd, Zn, and Pb metal ions. The melanin film appears to serve as an effective sensing layer for these heavy metals, likely due to its redox-active functional groups and capacity to coordinate with metal ions.
The clear distinction in current magnitudes between the metal ions indicates selectivity in their electrochemical responses. For instance, Fe has the highest current response, followed by Ni and Co, while Cd, Zn, and Pb generate relatively lower currents. These variations can be attributed to differences in the redox potentials, binding affinities, and electrochemical kinetics of each metal ion on the melanin-modified electrode.
The ionic radii of Fe3+ (~65 pm), Ni2+ (~69 pm), and Co2+ (~74.5 pm) influence their diffusion behavior and electron transfer kinetics at the electrode surface, which in turn affects amperometric sensitivity. In a typical staircase amperometric setup, where the current is measured stepwise at increasing potentials, smaller cations such as Fe3+ generally exhibit faster diffusion and stronger electrostatic interaction with the electrode surface, leading to a more pronounced current response. This is reflected in higher sensitivity for Fe3+ compared to Ni2+ and Co2+, whose larger ionic sizes result in slightly reduced mobility and slower electron transfer. As a result, the observed current response follows the trend Fe3+ > Ni2+ > Co2+, correlating inversely with ionic radius and highlighting the importance of ion size in determining amperometric detection performance.
The observed stepwise increase in current with each heavy metal ion detection confirms the linear response of the melanin-modified electrode, underscoring its suitability and effectiveness for quantitative sensing. These results demonstrate the potential of melanin-modified GCEs as a robust and sensitive platform for detecting Fe3+, Ni2+, and Co2+ ions in environmental and water analysis, with sensitivities of 4.6, 1.4, and 0.3 nA, respectively.
The amperometric responses in Figure 11 illustrate the sensitivity of GCE modified with melanin film to successive additions of Fe3+ ion solutions at concentrations of 1 ppm, 0.5 ppm, and 0.25 ppm. The applied potential of +0.4 V vs. Ag/AgCl in a 100 mM sodium nitrate electrolyte ensures consistent redox activity for detecting Fe3+ ions. As the Fe3+ concentration increases, the current response increases proportionally, with distinct stepwise rises corresponding to each concentration. This behavior highlights the linear relationship between current and concentration, essential for quantitative analysis.
The pronounced separation of current levels for 1 ppm, 0.5 ppm, and 0.25 ppm Fe3+ solutions demonstrates the electrode’s high sensitivity to low concentrations of Fe3+ ions, with sensitivity of 30, 50, and 65 nA, respectively. The response stabilizes quickly after each addition, indicating efficient electron transfer and a robust interaction between Fe3+ ions and the melanin-modified surface. This response is likely facilitated by the redox-active functional groups within the melanin film, such as quinone and hydroxyl groups, which promote Fe3+ adsorption and electron exchange. The results highlight the potential of melanin-modified GCEs as a reliable platform for trace detection of Fe3+ ions in analytical and environmental applications.
The DPV responses depicted in Figure 12 provide a comparison between a bare electrode (A) and a GCE modified with melanin film (B) upon successive additions of Fe3+ metal ion solutions ranging from 1 to 8 ppm. In the case of the melanin-modified electrode, the DPV curves show a progressive increase in peak current with increasing Fe3+ concentrations, indicating an enhanced sensitivity of the modified electrode for detecting Fe3+ ions. This is attributable to the functional groups in the melanin film, such as hydroxyl and quinone groups, which facilitate metal ion adsorption and redox reactions. The peak current shift also suggests a strong interaction between the Fe3+ ions and the melanin film, with a sensitivity of 106 nA per 1 ppm limit of quantification.
Conversely, the DPV responses of the bare electrode exhibit a much lower sensitivity to Fe3+ ion additions, with smaller changes in current as the concentration increases. This highlights the significant role of the melanin film in enhancing the electrode’s detection capabilities. The melanin-modified electrode shows higher peak current values across the Fe3+ concentration range, confirming its superior performance compared to the unmodified bare electrode. These results demonstrate that the melanin-modified electrode not only enhances the electrochemical detection of Fe3+ ions but also provides a linear and reliable response, making it a promising platform for heavy metal sensing applications in analytical and environmental fields.

4. Conclusions

This study successfully demonstrates the development and application of synthetic melanin-coated electrodes for the sensitive and reliable electrochemical detection of heavy metals. The in situ formation of melanin films yielded a stable and reproducible sensing platform with consistent electrochemical performance, as verified by differential pulse voltammetry and amperometry. Comprehensive characterization via EQCM, SEM, EDX, FTIR, and UV–Vis spectroscopy provided valuable insights into the film’s deposition, morphology, elemental composition, and chemical structure, ensuring optimal film formation and stability. Comparative analyses across melanin-modified electrodes identified the most effective substrate in terms of stability, electrochemical response, and metal ion sensitivity and selectivity. Notably, the melanin films exhibited superior sensitivity towards ferric ions, outperforming the detection of other heavy metals such as lead, cadmium, cobalt, zinc, and nickel. This enhanced selectivity towards ferric ions underscores the potential of synthetic melanin-coated electrodes in environmental monitoring applications, particularly in complex matrices. The findings position synthetic melanin-coated electrodes as a promising tool for selective detection and viable monitoring of ferric ions in water samples. The optimized sensor achieved a sensitivity of 106 nA, a limit of quantification of 1 ppm, and a linear regression coefficient (R2 = 0.99), indicating excellent linearity across the 1–8 ppm concentration range for ferric ion detection.

Author Contributions

Conceptualization, N.Y.M. and M.B.; methodology, H.K.; software, M.H.; validation, M.M.K., R.G.O., and H.K.; formal analysis, M.H. and H.K.; investigation, N.Y.M.; resources, M.B.; data curation, M.M.K.; writing—original draft preparation, M.H. and R.G.O.; writing—review and editing, H.K., N.Y.M., and M.B.; visualization, R.G.O.; supervision, N.Y.M., and M.M.K.; project administration, N.Y.M.; funding acquisition, M.B. All authors have read and agreed to the published version of the manuscript.

Funding

MB acknowledges partial funding from NIH grant R15GM140405, as well as USRA and FRD grants from CSU. The authors also thank Suez Canal University for its continuous support.

Data Availability Statement

No additional data are available beyond what is presented in the manuscript.

Conflicts of Interest

The authors declare no conflict of interest.

References

  1. Hajareh Haghighi, F.; Binaymotlagh, R.; Chronopoulou, L.; Cerra, S.; Marrani, A.G.; Amato, F.; Palocci, C.; Fratoddi, I. Self-Assembling Peptide-Based Magnetogels for the Removal of Heavy Metals from Water. Gels 2023, 9, 621. [Google Scholar] [CrossRef]
  2. Darwish, E.R.; Kalil, H.; Alqahtani, W.; Moalla, S.M.; Hosny, N.M.; Amin, A.S.; Martin, H.B.; Bayachou, M. Fast and reliable synthesis of melanin nanoparticles with fine-tuned metal adsorption capacities for studying heavy metal ions uptake. Nanotechnol. Sci. Appl. 2021, 14, 101–111. [Google Scholar] [CrossRef] [PubMed]
  3. Li, M.; Kuang, S.; Kang, Y.; Ma, H.; Dong, J.; Guo, Z. Recent advances in application of iron-manganese oxide nanomaterials for removal of heavy metals in the aquatic environment. Sci. Total Environ. 2022, 819, 153157. [Google Scholar] [CrossRef] [PubMed]
  4. Ayach, J.; El Malti, W.; Duma, L.; Lalevée, J.; Al Ajami, M.; Hamad, H.; Hijazi, A. Comparing Conventional and Advanced Approaches for Heavy Metal Removal in Wastewater Treatment: An In-Depth Review Emphasizing Filter-Based Strategies. Polymers 2024, 16, 1959. [Google Scholar] [CrossRef]
  5. Maher, S.; Mahmoud, M.; Rizk, M.; Kalil, H. Synthetic melanin nanoparticles as peroxynitrite scavengers, photothermal anticancer and heavy metals removal platforms. Environ. Sci. Pollut. Res. 2020, 27, 19115–19126. [Google Scholar] [CrossRef] [PubMed]
  6. Solano, F. Melanin and melanin-related polymers as materials with biomedical and biotechnological applications—Cuttlefish ink and mussel foot proteins as inspired biomolecules. Int. J. Mol. Sci. 2017, 18, 1561. [Google Scholar] [CrossRef]
  7. Büngeler, A.; Hämisch, B.; Strube, O.I. The Supramolecular Buildup of Eumelanin: Structures, Mechanisms, Controllability. Int. J. Mol. Sci. 2017, 18, 1901. [Google Scholar] [CrossRef]
  8. Medina-Armijo, C.; Yousef, I.; Berná, A.; Puerta, A.; Esteve-Núñez, A.; Viñas, M.; Prenafeta-Boldú, F.X. Characterization of melanin from Exophiala mesophila with the prospect of potential biotechnological applications. Front. Fungal Biol. 2024, 5, 1390724. [Google Scholar] [CrossRef]
  9. Zheng, P.; Shuai, L.; Dandan, Z.; Juan, Z. Biosynthetic melanin with excellent performance can be used for heavy metal adsorption. J. Clean. Prod. 2023, 385, 135655. [Google Scholar] [CrossRef]
  10. Manirethan, V.; Balakrishnan, R.M. Batch and continuous studies on the removal of heavy metals using biosynthesised melanin impregnated activated carbon. Environ. Technol. Innov. 2020, 20, 101085. [Google Scholar] [CrossRef]
  11. El-Gazzar, N.; Abdo, E.; Rabie, G.; El-Sayed, M.T. Suppression of mycotoxins production and efficient chelation of heavy metals using natural melanin originated from Aspergillus flavus and Aspergillus carbonarius. BMC Biotechnol. 2025, 25, 6. [Google Scholar] [CrossRef]
  12. Cuong, A.M.; Le Na, N.T.; Thang, P.N.; Diep, T.N.; Thuy, L.B.; Thanh, N.L.; Thang, N.D. Melanin-embedded materials effectively remove hexavalent chromium (CrVI) from aqueous solution. Environ. Health Prev. Med. 2018, 23, 9. [Google Scholar] [CrossRef]
  13. Fakhry, H.; Ghoniem, A.A.; Al-Otibi, F.O.; Helmy, Y.A.; El Hersh, M.S.; Elattar, K.M.; Saber, W.I.A.; Elsayed, A. A Comparative Study of Cr(VI) Sorption by Aureobasidium pullulans AKW Biomass and Its Extracellular Melanin: Complementary Modeling with Equilibrium Isotherms, Kinetic Studies, and Decision Tree Modeling. Polymers 2023, 15, 3754. [Google Scholar] [CrossRef] [PubMed]
  14. Costa, T.; Younger, R.; Poe, C.; Farmer, P.; Szpoganicz, B. Studies on synthetic and natural melanin and its affinity for Fe (III) ion. Bioinorg. Chem. Appl. 2012, 2012, 712840. [Google Scholar] [CrossRef]
  15. Liu, Y.; Hong, L.; Kempf, V.R.; Wakamatsu, K.; Ito, S.; Simon, J.D. Ion-Exchange and Adsorption of Fe(III) by Sepia Melanin. Pigment Cell Res. 2004, 17, 262–269. [Google Scholar] [CrossRef] [PubMed]
  16. Sarna, T.; Swartz, H.M.; Zadlo, A. Interaction of Melanin with Metal Ions Modulates Their Cytotoxic Potential. Appl. Magn. Reson. 2022, 53, 105–121. [Google Scholar] [CrossRef]
  17. Kollias, N.; Baqer, A. Spectroscopic characteristics of human melanin in vivo. J. Investig. Dermatol. 1985, 85, 38–42. [Google Scholar] [CrossRef]
  18. Riesz, J.J.; Jean, J. The Spectroscopic Properties of Melanin; University of Queensland: St. Lucia, Australia, 2007. [Google Scholar]
  19. Mostert, A.B.; Powell, B.J.; Pratt, F.L.; Hanson, G.R.; Sarna, T.; Gentle, I.R.; Meredith, P. Role of semiconductivity and ion transport in the electrical conduction of melanin. Proc. Natl. Acad. Sci. USA 2012, 109, 8943–8947. [Google Scholar] [CrossRef] [PubMed]
  20. Sauerbrey, G. Use of crystal vibrator for weighting thin films on a microbalance. Z. Phys. 1959, 155, 206–222. [Google Scholar] [CrossRef]
  21. Kankare, J. Sauerbrey equation of quartz crystal microbalance in liquid medium. Langmuir 2002, 18, 7092–7094. [Google Scholar] [CrossRef]
  22. Kalil, H.; Maher, S.; Bose, T.; Al-Mahmoud, O.; Kay, C.; Bayachou, M. Synthetic Melanin Films as Potential Interfaces for Peroxynitrite Detection and Quantification. ECS Trans. 2017, 80, 1447. [Google Scholar] [CrossRef]
  23. Argenziano, R.; Della Greca, M.; Panzella, L.; Napolitano, A. A Straightforward Access to New Amides of the Melanin Precursor 5, 6-Dihydroxyindole-2-carboxylic Acid and Characterization of the Properties of the Pigments Thereof. Molecules 2022, 27, 4816. [Google Scholar] [CrossRef]
  24. Dhole, P.; Khollam, Y.; Gunjal, S.; Shelke, P.; Jadkar, S. Melanin thin films prepared by electrochemical deposition method and their characterizations. Int. J. Chem. Phys. Sci. 2016, 5, 1–10. [Google Scholar]
  25. d’Ischia, M.; Napolitano, A.; Pezzella, A.; Meredith, P.; Sarna, T. Chemical and structural diversity in eumelanins: Unexplored bio-optoelectronic materials. Angew. Chem. Int. Ed. 2009, 48, 3914–3921. [Google Scholar] [CrossRef]
  26. Meredith, P.; Sarna, T. The physical and chemical properties of eumelanin. Pigment Cell Res. 2006, 19, 572–594. [Google Scholar] [CrossRef] [PubMed]
  27. Tiruye, H.M. Synthesis of Quinone Metabolites by Electrochemical and Chemical Oxidation; University of Stavanger: Stavanger, Norway, 2024. [Google Scholar]
  28. Sedó, J.; Saiz-Poseu, J.; Busqué, F.; Ruiz-Molina, D. Catechol-based biomimetic functional materials. Adv. Mater. 2013, 25, 653–701. [Google Scholar] [CrossRef]
  29. Dulo, B.; Phan, K.; Githaiga, J.; Raes, K.; De Meester, S. Natural quinone dyes: A review on structure, extraction techniques, analysis and application potential. Waste Biomass Valorization 2021, 12, 6339–6374. [Google Scholar] [CrossRef]
  30. Eom, T.; Ozlu, B.; Ivanová, L.; Lee, S.; Lee, H.; Krajčovič, J.; Shim, B.S. Multifunctional Natural and Synthetic Melanin for Bioelectronic Applications: A Review. Biomacromolecules 2024, 25, 5489–5511. [Google Scholar] [CrossRef]
  31. d’Ischia, M.; Napolitano, A.; Ball, V.; Chen, C.-T.; Buehler, M.J. Polydopamine and eumelanin: From structure–property relationships to a unified tailoring strategy. Acc. Chem. Res. 2014, 47, 3541–3550. [Google Scholar] [CrossRef]
  32. Olejnik, A.; Polaczek, K.; Szkodo, M.; Stanisławska, A.; Ryl, J.; Siuzdak, K. Laser-Induced Graphitization of Polydopamine on Titania Nanotubes. ACS Appl. Mater. Interfaces 2023, 15, 52921–52938. [Google Scholar] [CrossRef]
  33. Bernsmann, F.; Ponche, A.; Ringwald, C.; Hemmerlé, J.; Raya, J.; Bechinger, B.; Voegel, J.-C.; Schaaf, P.; Ball, V. Characterization of Dopamine−Melanin Growth on Silicon Oxide. J. Phys. Chem. C 2009, 113, 8234–8242. [Google Scholar] [CrossRef]
  34. Bernsmann, F.; Voegel, J.C.; Ball, V. Different synthesis methods allow to tune the permeability and permselectivity of dopamine-melanin films to electrochemical probes. Electrochim. Acta 2011, 56, 3914–3919. [Google Scholar] [CrossRef]
  35. Riesz, J.; Gilmore, J.; Meredith, P. Quantitative scattering of melanin solutions. Biophys. J. 2006, 90, 4137–4144. [Google Scholar] [CrossRef]
  36. Zonios, G.; Dimou, A.; Bassukas, I.; Galaris, D.; Tsolakidis, A.; Kaxiras, E. Melanin absorption spectroscopy: New method for noninvasive skin investigation and melanoma detection. J. Biomed. Opt. 2008, 13, 014017. [Google Scholar] [CrossRef] [PubMed]
  37. Micillo, R.; Panzella, L.; Iacomino, M.; Prampolini, G.; Cacelli, I.; Ferretti, A.; Crescenzi, O.; Koike, K.; Napolitano, A.; d’Ischia, M. Eumelanin broadband absorption develops from aggregation-modulated chromophore interactions under structural and redox control. Sci. Rep. 2017, 7, 41532. [Google Scholar] [CrossRef] [PubMed]
  38. Menter, J.M. Melanin from a physicochemical point of view. Polym. Int. 2016, 65, 1300–1305. [Google Scholar] [CrossRef]
  39. Bilińska, B. Progress of infrared investigations of melanin structures. Spectrochim. Acta Part A Mol. Biomol. Spectrosc. 1996, 52, 1157–1162. [Google Scholar] [CrossRef]
  40. Xu, R.; Gouda, A.; Caso, M.F.; Soavi, F.; Santato, C. Melanin: A Greener Route to Enhance Energy Storage under Solar Light. ACS Omega 2019, 4, 12244–12251. [Google Scholar] [CrossRef]
  41. Al-Shamery, N.; Park, J.-H.; Kim, S.R.; Heppner, F.; Yoon, S.Y.; Bredow, T.; Kwon, T.-H.; Lee, P.S. From black pigment to green energy: Shedding light on melanin electrochemistry in dye-sensitized solar cells. Mater. Adv. 2025, 6, 3073–3083. [Google Scholar] [CrossRef]
  42. Liu, Y.; Ai, K.; Liu, J.; Deng, M.; He, Y.; Lu, L. Dopamine-melanin colloidal nanospheres: An efficient near-infrared photothermal therapeutic agent for in vivo cancer therapy. Adv. Mater. 2013, 25, 1353–1359. [Google Scholar] [CrossRef]
  43. Wang, L.-F.; Rhim, J.-W. Isolation and characterization of melanin from black garlic and sepia ink. LWT 2019, 99, 17–23. [Google Scholar] [CrossRef]
  44. Blois, M.S. The melanins: Their synthesis and structure. In Photochemical and Photobiological Reviews; Springer: Boston, MA, USA, 1978; Volume 3, pp. 115–134. [Google Scholar]
  45. Pralea, I.E.; Moldovan, R.C.; Petrache, A.M.; Ilieș, M.; Hegheș, S.C.; Ielciu, I.; Nicoară, R.; Moldovan, M.; Ene, M.; Radu, M.; et al. From Extraction to Advanced Analytical Methods: The Challenges of Melanin Analysis. Int. J. Mol. Sci. 2019, 20, 3943. [Google Scholar] [CrossRef] [PubMed]
  46. Biesemeier, A.; Schraermeyer, U.; Eibl, O. Chemical composition of melanosomes, lipofuscin and melanolipofuscin granules of human RPE tissues. Exp. Eye Res. 2011, 93, 29–39. [Google Scholar] [CrossRef] [PubMed]
  47. Kang, E.T.; Neoh, K.G.; Tan, K.L. X-ray photoelectron spectroscopic studies of electroactive polymers. In Polymer Characteristics; Springer: Berlin/Heidelberg, Germany, 1993; pp. 135–190. [Google Scholar]
  48. Kalil, H.; Fouad, F.; Azeroual, S.; Bose, T.; Bayachou, M. Bottom-Up Design of a Grafted Organic Selenide Interface for Sensitive Electrocatalytic Detection of Peroxynitrite. Chemelectrochem 2021, 8, 3326–3338. [Google Scholar] [CrossRef]
Figure 1. Cyclic voltammograms of electrodeposition of 1 mM DHI monomer solution on GCE (A), ITO (B), and Au-QC (C) electrodes in 100 mM phosphate buffer (pH = 7.4) at a scan rate of 0.05 V/s for 10 cycles and a potential window from −0.8 to +0.4. DHI was synthesized in situ from the deacetylation of DAI using an equimolar ratio of NaOH. Four distinct redox peaks are observed: two anodic peaks (labeled 1 and 2) and two cathodic peaks (labeled 3 and 4), corresponding to the sequential oxidation and reduction processes of hydroquinone during film growth.
Applnano 06 00011 g001aApplnano 06 00011 g001b
Scheme 1. Deacetylation of 5,6-diacetoxyindole (DAI) to 5,6-dihydroxyindole (DHI) using NaOH and the postulated mechanism for the formation of DHI-melanin film. The deacetylation step removes the acetyl groups from DAI, yielding DHI, which undergoes oxidative polymerization during electropolymerization to form the melanin film. The proposed mechanism illustrates the key steps of the CV electrodeposition technique, highlighting the cathodic (reduction) and anodic (oxidation) peaks involved in the conversion of DHI into melanin polymer on the electrode surface.
Applnano 06 00011 sch001
Figure 2. Linear sweep voltammogram (LSV) of electrodeposition of 1 mM dihydroxyindole (DHI) monomer solution on a Au-QC electrode in 100 mM phosphate buffer (pH = 7.4) at a scan rate of 0.05 V/s and an oxidational potential sweep between −0.8 and +0.4. DHI was synthesized in situ in the electrochemical compartment from the deacetylation of DAI.
Applnano 06 00011 g002
Figure 3. Electrochemical Quartz Crystal Microbalance (EQCM) analysis of electrodeposition of 1 mM DHI monomer solution on a Au-QC electrode in 100 mM phosphate buffer (pH = 7.4) at a scan rate of 0.05 V/s under a constant potential of 0.4 V for 700 s at ambient conditions.
Applnano 06 00011 g003
Figure 4. UV–Vis spectra of the DHI solution at three different stages during the experiment: (Melanin-1) before running cyclic voltammetry (CV) to electropolymerize DHI on the ITO electrode; (Melanin-2) after running CV; and (Melanin-3) after the solution turned purple, approximately 2 h into the experiment. The increase in broadband absorbance at 220 nm, along with the decrease of the DHI peak at 310 nm and the color change from colorless to pink to purple, indicates the progressive formation of melanin.
Applnano 06 00011 g004
Figure 5. ATR-FTIR spectra of the melanin film electropolymerized on a Au-QC electrode using three different polymerization techniques: (Melanin-1@AMP) electropolymerized using amperometry; (Melanin-2@LSV) using linear sweep voltammetry; and (Melanin-3@CV) using cyclic voltammetry. Additionally, melanin nanoparticles were scratched from an ITO slide and analyzed via IR to compare with the melanin film collected from the Au-QC electrode.
Applnano 06 00011 g005
Figure 6. SEM micrographs of melanin film deposited on ITO (A,B) at high and low magnifications, and on Au-QC electrodes (C,D) at low and high magnifications. The images show melanin nanoparticles in spherical shapes. (A) Melanin on ITO with low magnification; (B) melanin on ITO with high magnification; (C) melanin on Au-QC with low magnification; (D) melanin on Au-QC with high magnification.
Applnano 06 00011 g006
Figure 7. Energy Dispersive X-ray (EDX) spectra of synthetic melanin film deposited on an ITO transparent electrode. The film was synthesized using the CV electropolymerization technique. The spectra reveal the elemental composition of the melanin film based on the emission of characteristic X-ray peaks for each element.
Applnano 06 00011 g007
Figure 8. X-ray Photoelectron Spectroscopy (XPS) spectra of synthetic melanin film deposited on an ITO transparent electrode. The film was synthesized using the CV electropolymerization technique. The spectra show characteristic peaks for C1s, N1s, and O1s, indicating the presence and chemical states of carbon, nitrogen, and oxygen within the melanin film.
Applnano 06 00011 g008
Figure 9. High-resolution X-ray Photoelectron Spectroscopy (XPS) spectra of a synthetic melanin film deposited on an ITO transparent electrode. The film was synthesized via the CV electropolymerization method to ensure consistent deposition. The spectra reveal distinct C1s, N1s, and O1s peaks, corresponding to an elemental composition of carbon (61.5%), oxygen (34.6%), and nitrogen (3.9%)—yielding a C:O:N ratio of approximately 16:9:1. This composition aligns with melanin’s molecular structure, where carbon predominates, while nitrogen and oxygen contribute to its unique photoprotective and conductive properties.
Applnano 06 00011 g009
Figure 10. Typical amperometric responses of melanin-modified GCE after consecutive additions of 10 ppm metal ion solutions. The applied potential was +0.4 V vs. Ag/AgCl in all cases, with 100 mM sodium nitrate as the supporting electrolyte. The corresponding calibration curves of current versus added ppm concentration of heavy metal ions are based on the staircase current responses observed in the amperometric trace.
Applnano 06 00011 g010
Figure 11. Typical amperometric responses of melanin-modified GCE after successive additions of Fe3+ metal ion solutions at concentrations of 1, 0.5, and 0.25 ppm. The applied potential was +0.4 V vs. Ag/AgCl in all cases, with 100 mM sodium nitrate as the supporting electrolyte. The corresponding calibration curves of current versus added ppm concentration of Fe3+ ions are based on the amperometric current responses observed in this figure.
Applnano 06 00011 g011
Figure 12. Typical differential pulse voltammetry (DPV) responses of bare unmodified GCE (A) and melanin-modified GCE (B) with successive additions of Fe3+ metal ion solutions at concentrations ranging from 1 to 8 ppm, along with their correlation calibration curves for unmodified GCE (C) and melanin-modified GCE (D). The applied potential was from 0 to +0.5 V vs. Ag/AgCl in all cases, with 100 mM sodium nitrate as the supporting electrolyte. The corresponding calibration curves of current versus added Fe3+ concentration (ppm) are derived from the DPV current responses shown in the respective figures for both modified and unmodified GCEs.
Applnano 06 00011 g012aApplnano 06 00011 g012b
Disclaimer/Publisher’s Note: The statements, opinions and data contained in all publications are solely those of the individual author(s) and contributor(s) and not of MDPI and/or the editor(s). MDPI and/or the editor(s) disclaim responsibility for any injury to people or property resulting from any ideas, methods, instructions or products referred to in the content.

