Article

Effects of Expandable Graphite at Moderate and Heavy Loadings on the Thermal and Electrical Conductivity of Amorphous Polystyrene and Semicrystalline High-Density Polyethylene

1
Department of Physics, National Technical University of Athens, Zografou Campus, 15780 Athens, Greece
2
Department of Chemistry, Laboratory of Polymer Chemistry and Technology, Aristotle University of Thessaloniki, 54124 Thessaloniki, Greece
3
Laboratory of X-ray, Optical Characterization and Thermal Analysis, Physics Department, Aristotle University of Thessaloniki, GR-541 24 Thessaloniki, Greece
*
Authors to whom correspondence should be addressed.
Appl. Nano 2021, 2(1), 31-45; https://doi.org/10.3390/applnano2010004
Submission received: 30 January 2021 / Revised: 19 February 2021 / Accepted: 22 February 2021 / Published: 25 February 2021

Abstract

:
In this work, we prepared and investigated two series of polymer composites, wherein the matrix was either an amorphous polystyrene (PS) or a semicrystalline high-density polyethylene (HDPE) filled with expandable graphite (EGr) at relatively high loadings within the range 5–55 wt %. For the investigation we employed a thermogravimetric analysis and differential scanning calorimetry to assess the thermal transitions and evaluate the various polymer fractions (crystalline (CF), mobile (MAF) and rigid amorphous (RAF)) in addition to broadband dielectric spectroscopy and a laser flash analysis to evaluate the EGr effects on electrical conductivity, σ, and thermal conductivity, λ, respectively. In PS, EGr was found to impose an increase of the glass transition temperature and a systematic decrease of the corresponding heat capacity change. The latter was rationalized in terms of the formation of an interfacial RAF. No glass transition was recorded for HDPE whereas the fillers increased the CF moderately. As expected, σ increased with the filler loading for both matrices, up to 10−3–10−2 S/cm, resulting in a conductive percolation threshold for electrons at > 8 wt % EGr. Simultaneously, the λ of PS and HDPE were strongly increased, from 0.13 and 0.38 W·K–1·m–1 up to 0.55 and ~2 W·K–1·m–1, respectively. λ demonstrated an almost linear EGr loading dependence whereas the semicrystalline composites exhibited a systematically higher λ.

Graphical Abstract

1. Introduction

Over the last decades, polymer composites and nanocomposites (PNCs) [1,2] have been under extensive investigation and have found use in a wide range of applications from industry, biochemistry and biomedicine to our everyday life. Several types of inclusions can be employed as a means for improving properties (reinforcing). The inclusions may differ either in shape/dimensionality (for example, nanotubes (e.g., carbon nanotubes (CNT)) [3,4], nanoplatelets (e.g., graphene, nanoclays) [5,6] and spherical nanoparticles (e.g., silica and titania) [7]) or in surface chemistry [8,9,10].
The main benefits of PNCs compared with neat polymers and traditional macrocomposites are the improved properties and performance achieved at very low filler loadings [1,3,11]. This is due to the high surface to volume ratio of the fillers arising from their nanodimensions [12], which provides a large potential for interfacial interactions between the filler and the polymer. What actually happens at the interfacial zone is still in debate as it is believed that the structure-density-chain topology dynamics of the polymer at the interface are altered compared with that in the bulk [13,14,15,16,17]. The polymer fraction located at the interfaces is generally called the interfacial polymer or rigid amorphous fraction (RAF or RAFfiller) [18,19] (Scheme 1a,b). The alternations seem to correlate with, if not being mainly responsible for, specific changes of the performance of the materials such as the mechanical strength [1,2,20], small molecule permeation or charges diffusion [21] and heat transport [22,23]. PNCs can be categorized also from the point of view of the polymer type, e.g., rubbery or thermoplastic, amorphous or semicrystalline [11,12,24]. Thus, the imposed filler-related improvements can be both direct such as in the case of electrical conduction [3,25] and indirect, e.g., via altering crystallinity and the semicrystalline morphology (Scheme 1) [26,27]; for example, on the elastic modulus [28,29] and heat transport [22,23,30]. In the last decade, importance has been considered within the performance of PNCs of the role of amorphous crystal interfaces (RAFcrystal) [22,31,32] due to their special structure following partly the lamellae ordering (Scheme 1a).
Electrical conductivity, σ, in PNCs [3,33,34] is developed mainly by two mechanisms; namely, via the transport of ions or/and electrical charges (including defects) through the polymer in a rubbery state [35] and via the oriented transport of free electrons (hopping and tunneling effects) in the case of electrically conducting fillers [3,25] (Scheme 1b). The most known conducting fillers are the CNTs [4,25], carbon fibers [36], graphene, graphite [5] and metallic particles (Ag, Au, Cu) [37]. The role of crystallinity on σ is indirect as, for example, the formation of crystals may reduce ionic σ via the polymer by disturbing/cutting a few amorphous polymer pathways [23,38] or/and reducing the number of percolating filler pathways due to filler rearrangements upon crystallization [39] (Scheme 1c).
Thermal diffusivity, α, and conductivity, λ (or k), in polymer-based systems [40,41,42] is the transport of energy from one point to another by energy carriers and is developed mainly via the mechanism of phonon diffusion via the polymer [43]. In the case of conducting fillers that percolate (which happens for quite high filler loadings [40]), the thermal conductivity is strongly enhanced [33,44] due to the transport of free electrons and phonons. As expected in neat polymers, heat transport occurs via a weak diffusion of phonons and thus results in low α and λ. The situation improves with the implementation of polymer crystals [45,46]. A variety of effects mainly concerning scatterings of the thermal carriers at interfaces, i.e., polymer-fillers and filler-fillers are also involved in PNCs [40,41,47,48]. In the case of PNCs, the numbers and total area of interfaces are actually greater compared with micro and macrocomposites, which are not always in favor of thermal conductivity. Recently, we explored the role of interfaces in PNCs based on amorphous and semicrystalline polymers filled with moderate amounts of CNTs and graphene oxide and showed that the role of the interfacial polymer around the fillers and that around the crystals was diverse as they, respectively, hinder and facilitate the heat transport (Scheme 1c) [22,23]. Such findings provide support to another open debate in the literature on the differences in the structuring of the two types of RAF; namely, RAFcrystal exhibiting a level of chain ordering [49,50,51,52] compared with RAFfiller (Scheme 1c).
In the present study, we synthesized and investigated two series of polymer composites based on an amorphous polystyrene (PS) and a semicrystalline high-density polyethylene (HDPE) reinforced by expanded graphite (EGr) at concentrations between 5 and 55 wt %. The choice of the said polymers arose from the fact that both are widely known commodity plastics with known properties/performance in addition to exhibiting different thermal behaviors, e.g., the glass transition temperature and degree of crystallinity. The composite materials were targeted at applications involving temperature management devices (thermal stability and conductivity) and, as a next step, flame retardance; EGr being particularly known for such a type of application [53,54,55]. Next to the application point of view, i.e., thermal/electrical performance in general, these systems in comparison with each other offered basic research; for example, evaluating direct and indirect effects on heat and electron transport imposed by the fillers and/or the polymer crystals [22,23]. For this investigation, we employed the following experimental methods: thermogravimetric analysis (TGA), differential scanning calorimetry (DSC) of the conventional and the temperature modulation mode (TMDSC), broadband dielectric spectroscopy (BDS) and laser flash analysis (LFA). The results were evaluated and discussed employing widely accepted models.

2. Materials and Methods

2.1. Materials

PS of high quality with a typical molar mass of Mn~170 k or Mw~350 k was purchased from Aldrich (441147) whereas HDPE under the trade name mPE M5510 EP (Metallocene Polyethylene Lumicene) with a melt flow index of 1.2 g/10 min (ISO 1133) and mass density of ρ~0.955 g/cm3 was supplied from Total Petrochemicals (Feluy, Belgium). As a temperature control and thermal conductive agent for the composites, expandable graphite (EGr) was used [55]. EGr was purchased from G.H. LUH, GmbH (Walluf, Germany), GHL PX 95 N, with 5% ash. max., 5% moisture and a volume expansion of ~250 cm3/g with a starting temperature 180–220 °C and an average particle size of ~300 μm. Prior to the synthesis of the composites, the EGr was heated in an oven at 400 °C for 5 min in order to expand and to achieve the exfoliation of the flakes for preparing the composites after melt mixing with neat polymers.
The composites were prepared via a relatively simple melt-compounding method. A mixture of HDPE or PS (Scheme 1a,b) and the respective amount of graphite (between ~5 and 55 wt %) were physically mixed for the preparation of the composites. Thereafter, the mixture was fed into a Haake Buchler Reomixer (model 600) of 69 cm3 volumetric capacity with twin roller blades operating at 180 °C and a rotation speed of 30 rpm for 5 min. The obtained composites were molded to form cylindrical specimens (thin disks) by compression at 180 °C using a thermal press (Paul-Otto Weber GmbH, Germany) and a homemade mold. The prepared disks were ~2 cm in diameter and ~1.5 mm in thickness.

2.2. Techniques and Methodology

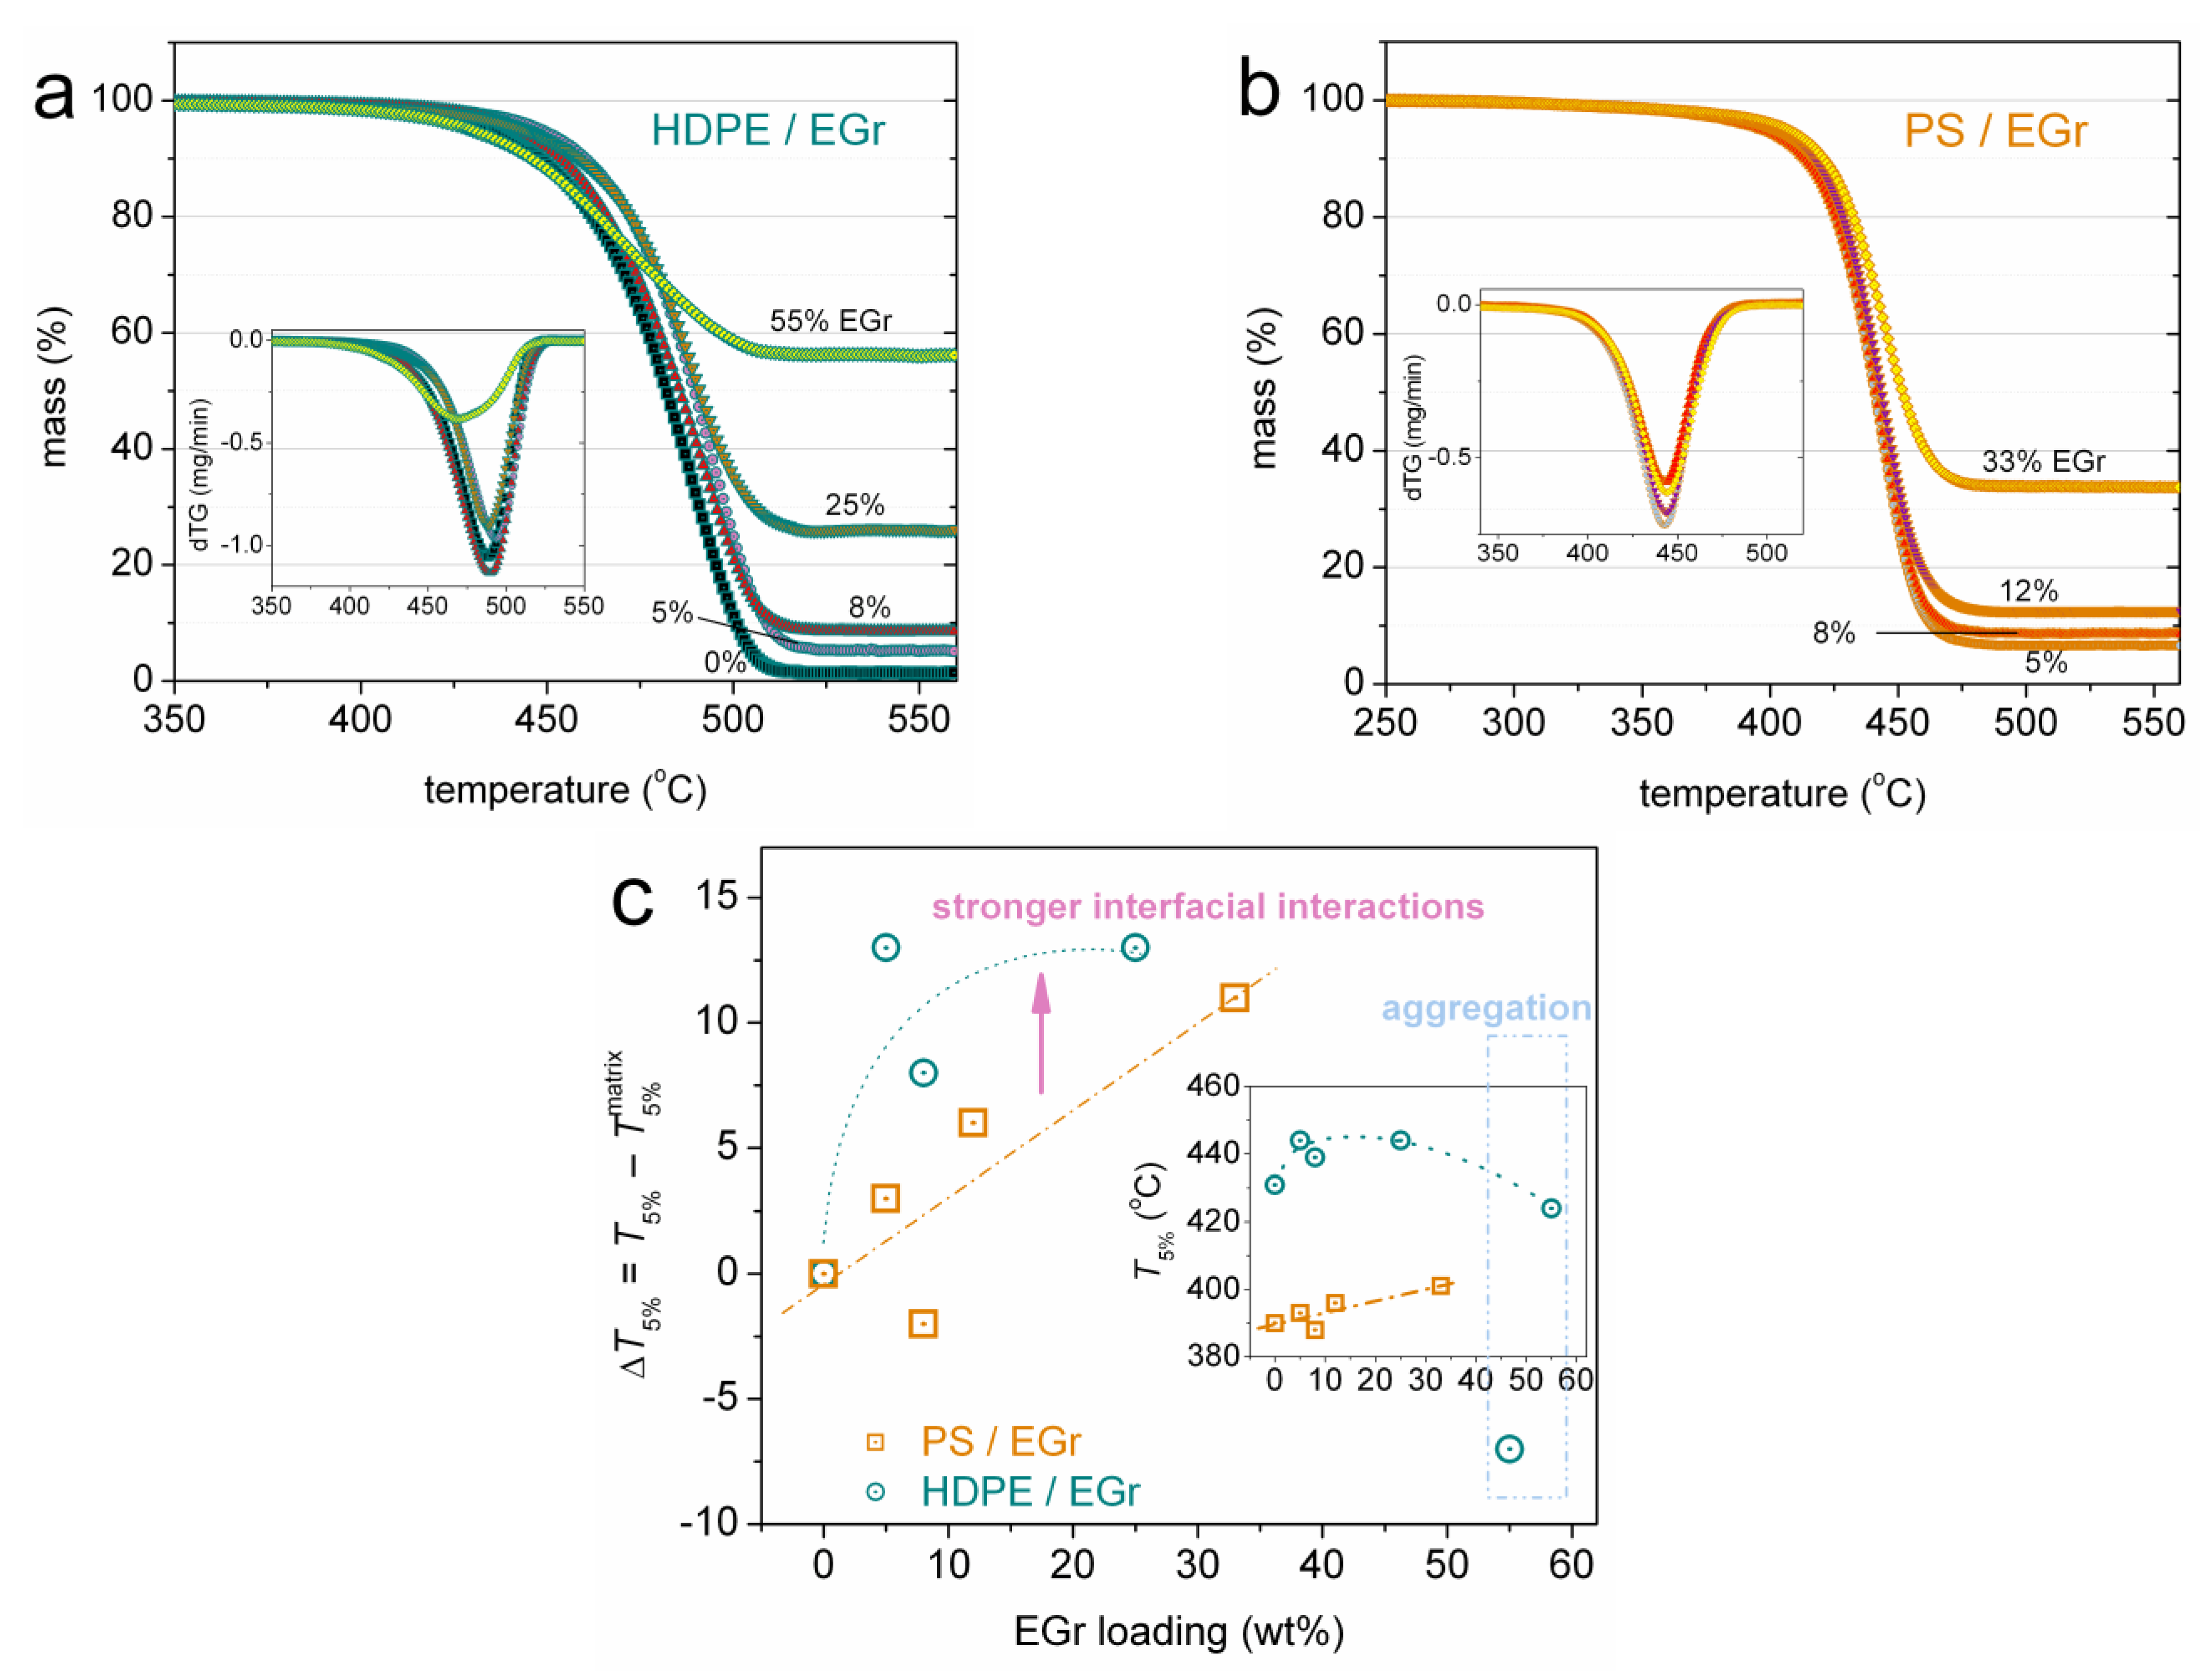
2.2.1. Thermogravimetric Analysis (TGA)

TGA thermograms were recorded employing a Setaram SETSYS TG-DTA 16/18 instrument. Samples of 3 ± 0.5 mg were placed in alumina crucibles and measured in dynamic conditions in the temperature range from 26 to 600 °C at the heating rate of 20 K/min under a N2 flow of 50 mL/min.

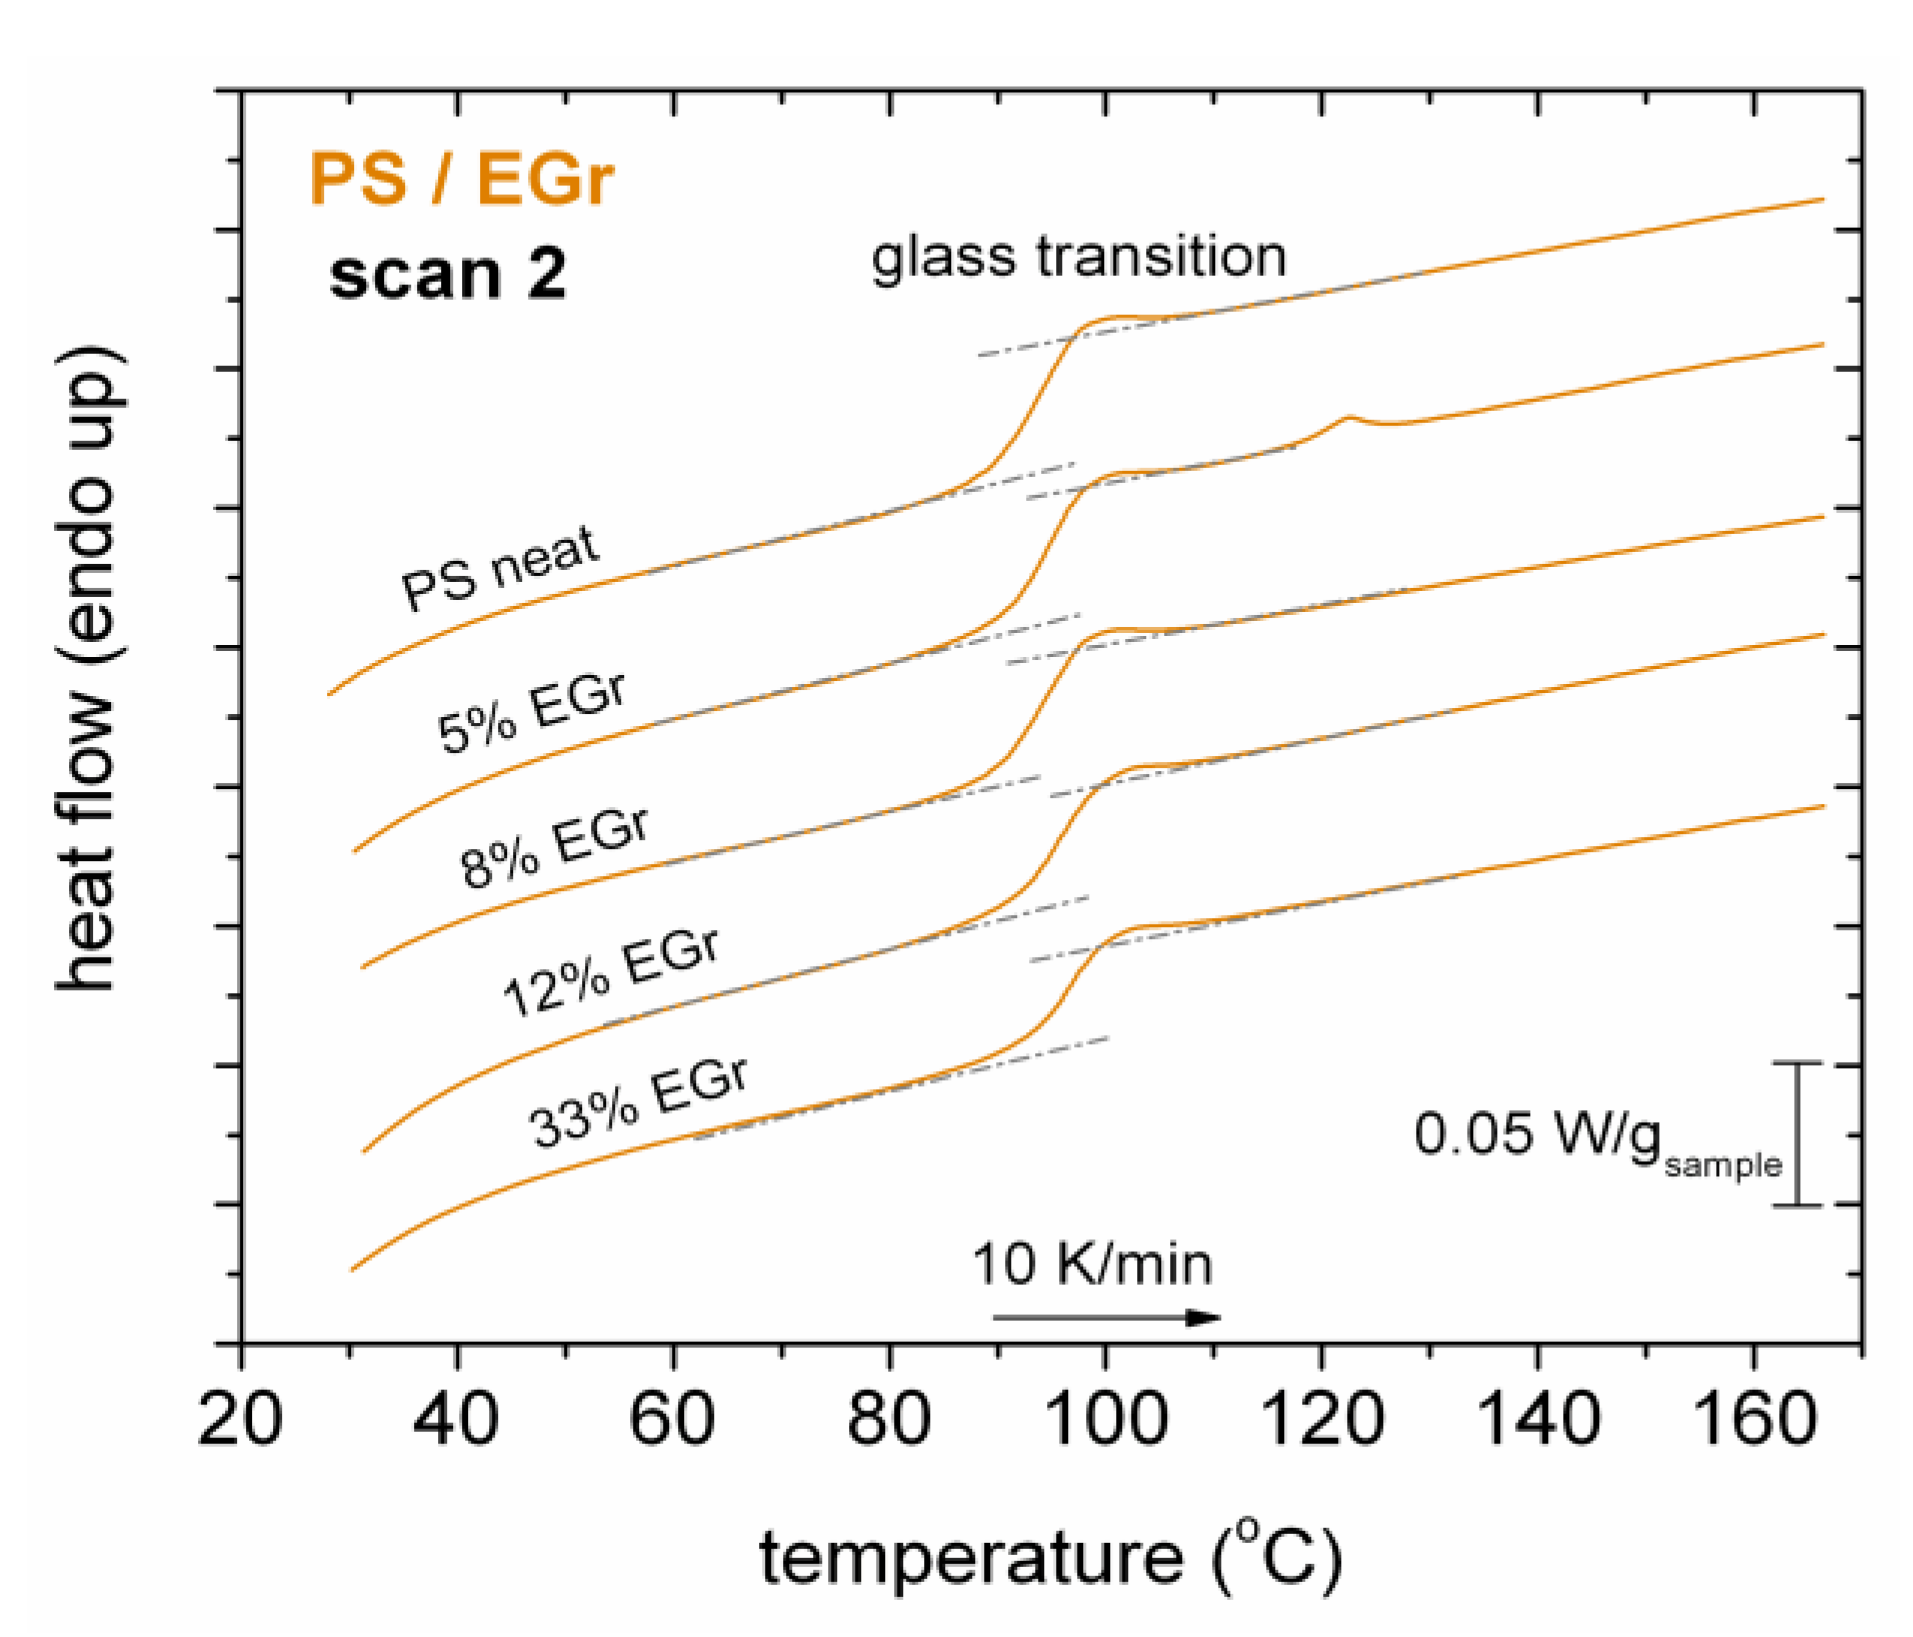
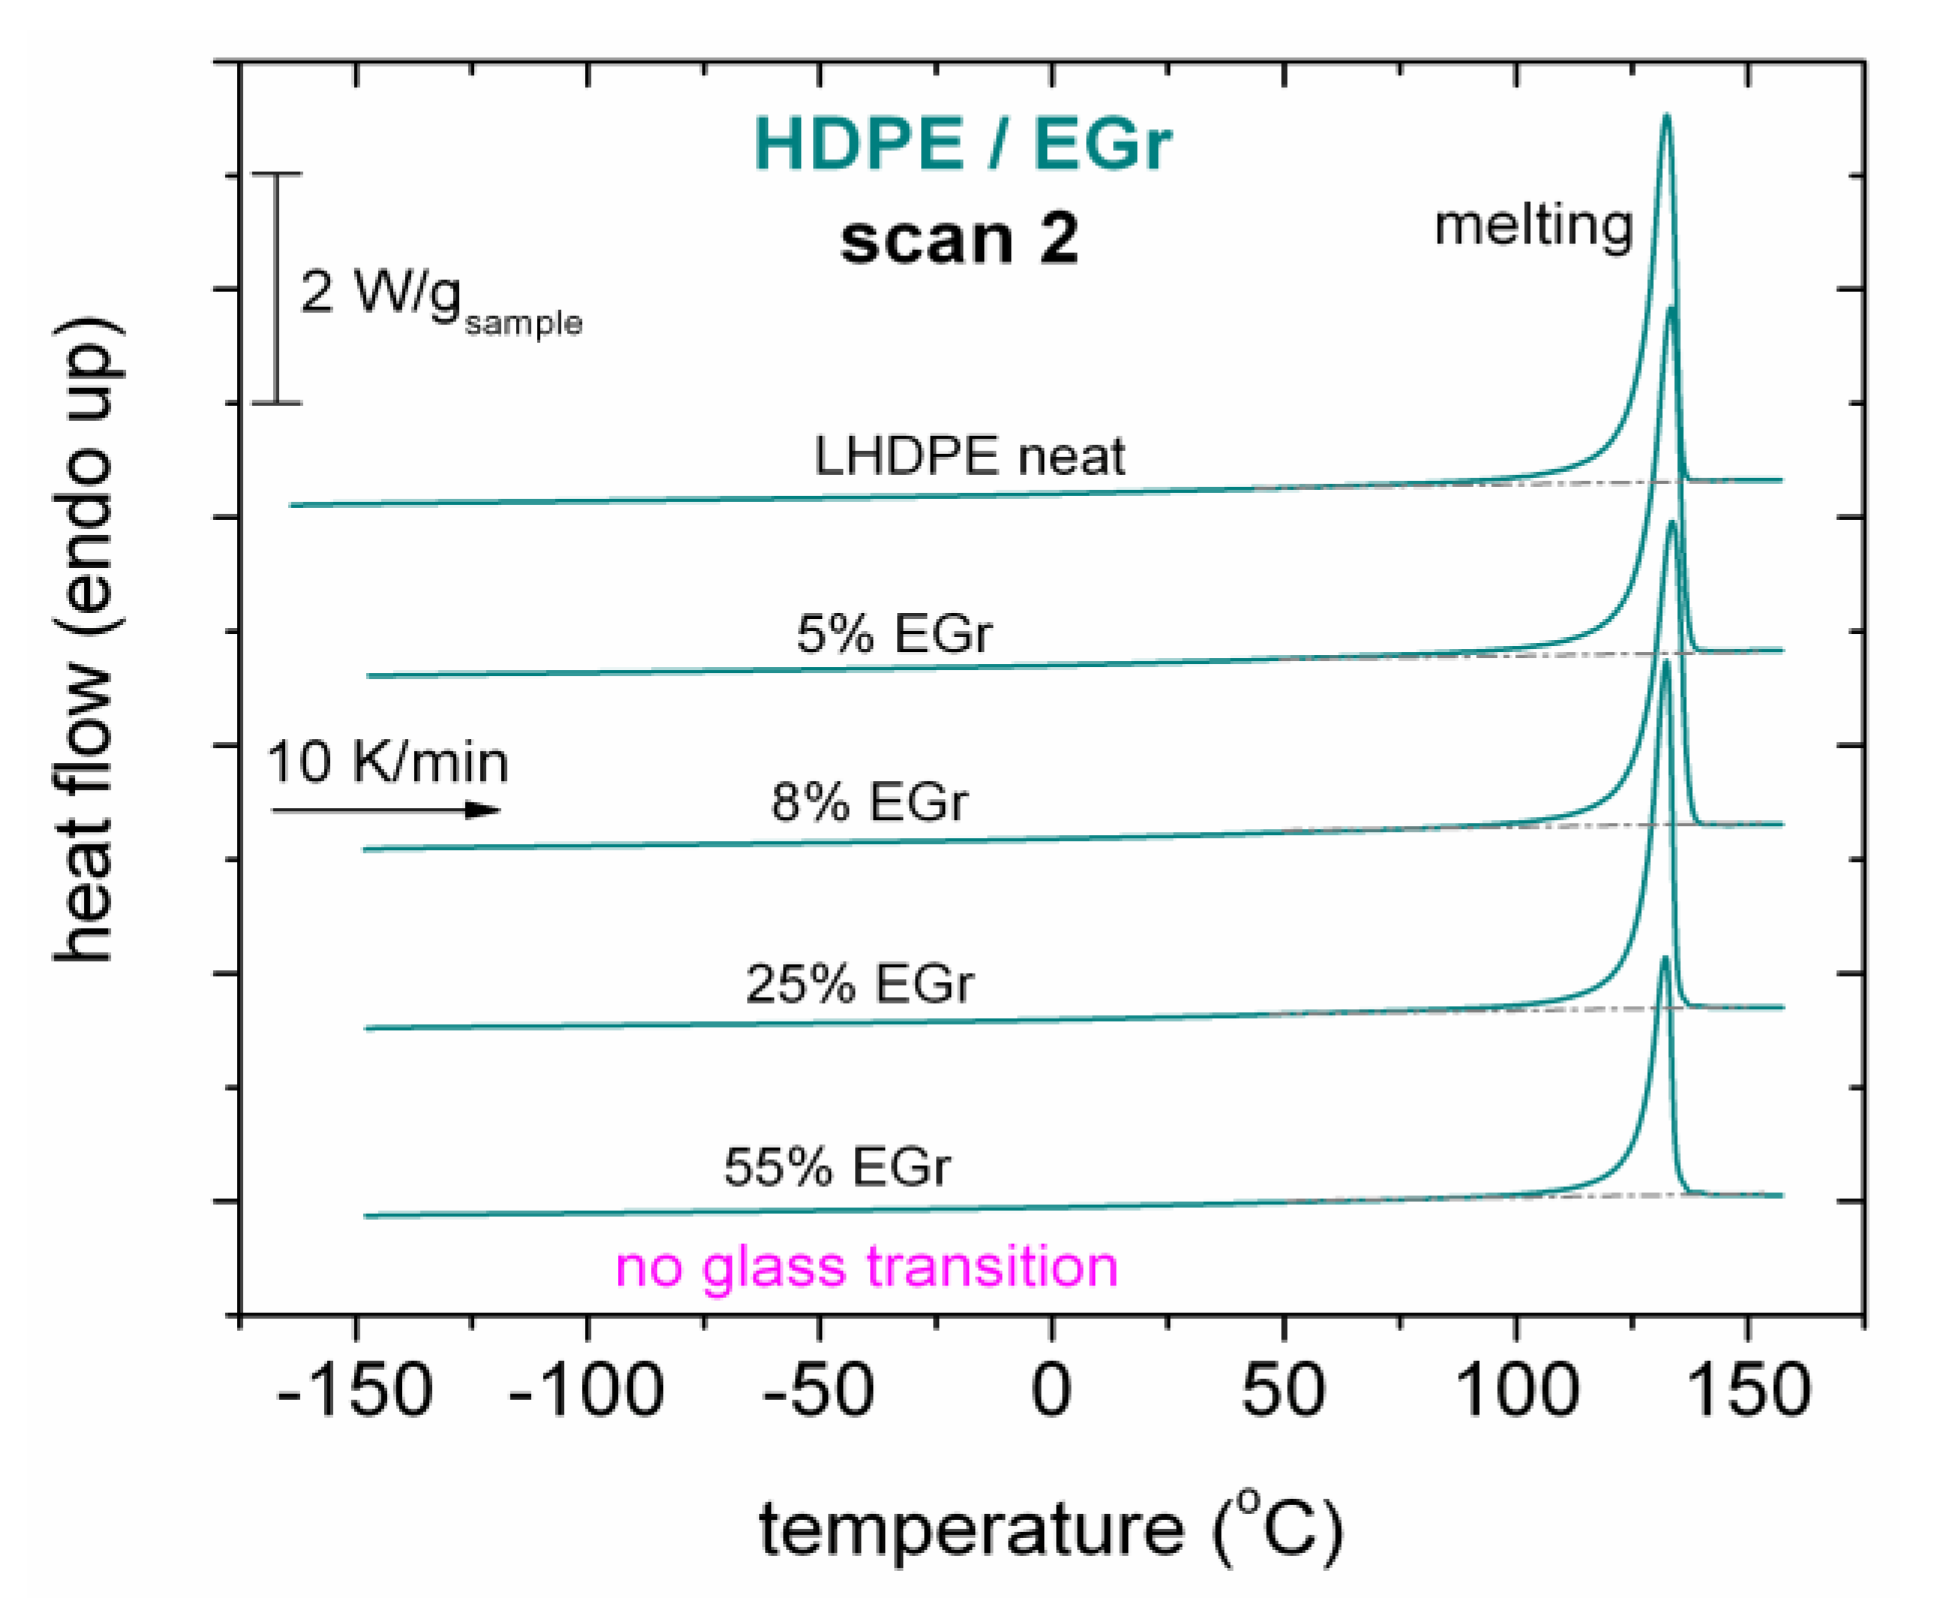
2.2.2. Differential Scanning Calorimetry (DSC)

The thermal events for all samples were recorded by DSC in high purity nitrogen (for PS) and helium (for HDPE) atmospheres (99.9995%) in the overall temperature range from –160 to 170 °C by means of a TA Q200 DSC apparatus (TA Instruments, New Castle, USA) calibrated with indium for temperature and enthalpy and with sapphires for the heat capacity, cp. Samples of 7–8 mg in mass cut from the prepared disks were closed in Tzero aluminum TA pans. In order to erase the thermal history of the samples, a first heating scan up to 170 °C was performed (scan 1). The samples were then cooled from the melt state down to 20 °C (for PS) and –160 °C (for HDPE) at 10 K/min and, subsequently, a heating scan up to 170 °C was performed at 10 K/min (scan 2).
The crystalline fraction, CF, in the case HDPE (semicrystalline) was calculated from the measured enthalpy of melting, ΔHm, normalized to the polymer content (ΔHm,n) employing Equation (1):
C F = Δ H m w p o l Δ H P E , 100 % = Δ H m , n Δ H P E , 100 %
where wpol was the wt polymer content and ΔHPE,100% was the melting enthalpy of 100% crystalline PE taken equal to 293 J/g [57].
Glass transition was observed in all PS-based samples only whereas HDPE samples did not exhibit a recordable glass transition in the temperature range of the measurements. This is expected for PE, in particular here where the CF was quite large (>50%, details are given later). For PS, the glass transition temperature, Tg, was estimated via the half cp method whereas the change in heat capacity during glass transition, Δcp, was estimated at Tg. Δcp was then normalized to the amorphous polymer mass according to Equation (2).
Δ c p , n = Δ c p w p o l y m e r ( 1 C F ) .
In order to check the recordings on the glass transition of HDPE and accurately estimate cp, the special DSC technique of Temperature Modulation (TMDSC) [56,58,59] was employed on fresh samples of ~12 mg in mass. TMDSC measurements were performed in the temperature range between –90 °C and 80 °C for HDPE and between 0 °C and 130 °C for PS at the heating rate of 2 K/min with a modulation period of 60 s and a temperature amplitude of 1 K.

2.2.3. Broadband Dielectric Spectroscopy (BDS)

The electrical conductivity was determined at 20 °C employing the BDS technique [35] by means of a Novocontrol (GmbH, Germany) apparatus; namely, an Alpha frequency response analyzer (FRA) combined with a BDS-1200 sample cell on disk-like samples of 20 mm in diameter and ~1.5 mm in thickness. An alternate voltage was applied to the sample and the complex dielectric permittivity, ε* = ε′ − iε′′, was recorded isothermally as a function of the frequency, f, in the range from 10–1 to 106 Hz. The electrical conductivity as a function of f, σ*, was calculated from the measured ε* by Equation (3):
σ * ( ω ) = i ω ε 0 ε * ( ω )
where ω = 2π∙f was the angular frequency and ε0 was the dielectric permittivity of the vacuum [35].

2.2.4. Laser Flash Analysis (LFA)

The thermal diffusivity, α, was determined at 20 °C (~RT) employing the LFA technique [60] by means of a NETZSCH LFA 467 HyperFlash apparatus (NETZSCH, Selb, Germany). The measurements were performed in a nitrogen atmosphere on samples of a cylindrical form of ~1.5 mm in thickness and 12.7 mm (half inch) in diameter. Graphite was spray coated onto the top and bottom sides of the samples following the manufacturers’ instructions. α was measured almost directly from an average of five samples per composition and four light pulse shots (of 600 μs in duration) per sample from the heat transmission at a spot size of 8.9 mm via an InSb infra-red detector. A Cowan plus pulse-correction model [61] was fitted to the signal of the detectors and α was estimated via the widely employed half-time method and via Equation (4):
α = 1.38 L 2 / ( π t 1 / 2 )
where L was the sample thickness and t1/2 was the required time for reaching half of the maximum temperature rise of the rear surface [60]. Subsequently, thermal conductivity, λ, was calculated via Equation (5):
λ = α ρ c p
where ρ was the sample density and cp was the specific heat. In our case, ρ was estimated from accurate measurements of the sample mass and volume whereas cp was calculated by two methods, i.e., directly from LFA software by comparing with a reference sample (pyroceram) as suggested by the manufacturer and additionally by TMDSC at 20 °C.

3. Results and Discussion

Figure 1 shows the results by TGA. From the remaining mass at the highest temperature, we determined the EGr weight fraction in the composites. Please note that neat polymers (0% EGr loading) resulted in 1–1.3 wt % remaining mass upon decomposition. This amount was considered when estimating the EGr loading. From the methodological point of view, we would like to report that the final amount of EGr in the composites was slightly lower (i.e., by ~1–2 wt %) than that weighted prior to the mixing with the polymers.
The TGA results also showed in general a slight temperature hysteresis for the initiation of polymer decomposition in the composites (elevation of the onset temperature). To further evaluate that we created Figure 1c. Therein, we compared the two series of composites in terms of the TGA temperature corresponding to a 5 wt % mass loss, T5%. In the inset to Figure 1c, the absolute T5% increased in general in the composites but laying on different temperature ranges; namely, 390–401 (± 0.4) °C for PS and 424–444 (± 0.3) °C for HDPE. The exception to this behavior was the case of HDPE + 55 wt % EGr (Figure 1c), wherein the EGr distribution within the HDPE matrix may not have been good (extended aggregation of EGr [18]). When comparing directly the T5% of the composites with that of the corresponding unfilled matrix polymer, ΔΤ5%, in Figure 1c, we observed that ΔΤ5% was in general larger for HDPE than PS.
These effects could be rationalized by the concept of formed interactions between the polymers and the fillers, probably larger in strength or/and degree (number of contact points) [7,10,18] for HDPE/EGr than PS/EGr. The interfacial interactions were considered to most probably lead to the formation of more rigid polymers in the composites; i.e., an interfacial RAF [18] and a tighter MAF with increased Tg. These points were further followed below in the light of findings by DSC.

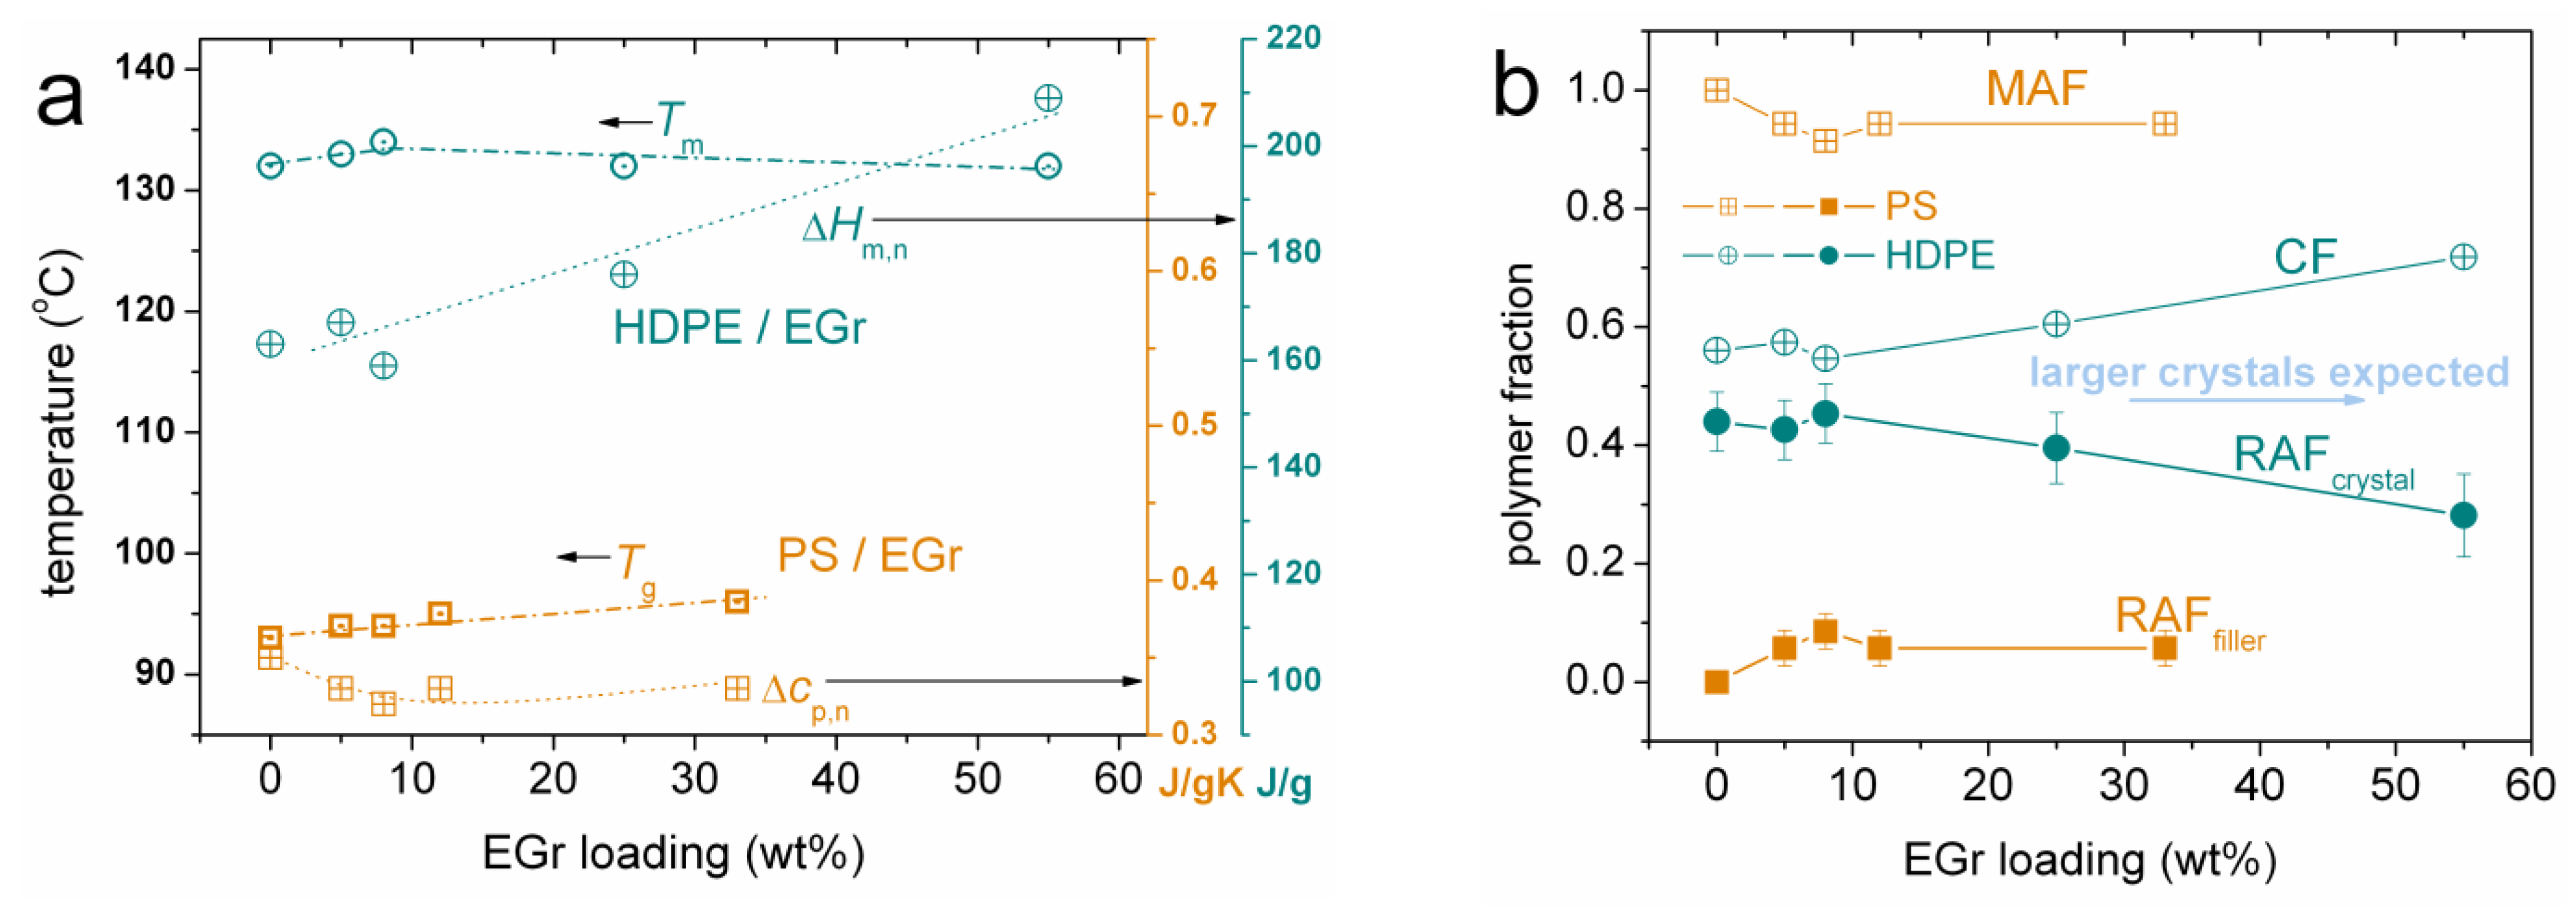
3.1. Thermal Transitions (DSC)

To record the thermal transitions and, in a next step, to evaluate the polymer fractions existing in the composites, we employed DSC. The samples were subjected to a first heating scan at a high temperature (170 °C and 160 °C for HDPE- and PS-based systems, respectively) to erase any thermal history (not shown).
In Figure 2 we presented the DSC heating curves of the second scan (scan 2) for the PS-based samples.
The PS samples were all amorphous; therefore, the only thermal transition recorded was that of the glass transition. The characteristic temperature, Tg, was evaluated via the half cp increase method. Tg equaled 93 °C for neat PS and systematically increased up to 96 °C upon EGr addition. These results are shown in the comparative diagrams of Figure 3a.
At the same time, the glass transition strength was reflected to the change in heat capacity, Δcp. Upon normalization with the polymer mass (Equation (2) where CF = 0 for PS), Δcp,n equaled 0.35 J/gK for the unfilled PS matrix and dropped to 0.32–0.33 J/gK in the composites (Figure 3a). Both results, Tg and Δcp,n, suggested that the fillers acted as obstacles to the mobile polymer chains, hindering their diffusion (mobility). Simultaneously, the suppression in Δcp,n has been widely considered [16,18,22,56] to originate on the immobilization of polymer chains at the surface of the fillers, producing the so-called RAFfiller. The fraction of the polymer that contributes to the glass transition is the so-called mobile amorphous fraction, MAF [18,56]. The MAF and RAFfiller can be estimated in the frame of a two phase model [18] by the following equation, Equation (6):
R A F f i l l e r = 1 M A F = 1 Δ c p , n P N C / Δ c p , n m a t r i x .
The results for the RAFfiller and MAF are shown in Figure 3b. The RAFfiller equaled 0.06 for almost all composites while it was larger (0.09) for 8 % EGr. Compared with PNCs with smaller nanoparticles finely dispersed throughout the matrix, the RAFfiller here seemed quite low [10,18,22,23,56,62,63], especially when considering the heavy loadings of 12 and 33% EGr. The effect was compatible with the large fillers involved, as two of their dimensions were of hundreds of μm whereas the almost constant values of the RAFfiller suggested a strong EGr agglomeration [18,22,24] probably forming many EGr continuous paths. This was actually desired and will be discussed later.
In Figure 4 we presented the DSC results for the systems based on HDPE during heating of scan 2. Therein at about 130 °C, the endothermal peaks recorded in all HDPE samples corresponded to the melting of crystals. The temperature of the peak maximum, Tm, equaled 132 °C for the unfilled matrix and exhibited weak changes at the addition of the fillers; namely, slightly increasing for 5 and 8 wt % EGr (133–134 °C, Figure 3a). The melting enthalpy, ΔHm, was evaluated using proper TA software and was found to equal 163 J/g for neat HDPE. For the composites and upon normalization to the polymer mass fraction by Equation (1), ΔHm,n varied between 159 and 209 J/g (Figure 3a). Based on these values, we calculated the CF of the matrix (Equation (1)) to equal 0.56 wt. The CF increased in general in the composites up to 0.72 wt for 55% EGr (Figure 3b). The values for CF were quite high compared with other semicrystalline polymers; however, these were expected for HDPE [22,45].
Regarding the glass transition in HDPE, a corresponding step could not be resolved. This could be due to the high CF. To suppress crystallization, we performed measurements involving more intense cooling at ~100 K/min. These experiments proved unable to suppress crystallinity therefore they are not shown here. Following previous work [58,64,65], in order to clear the DSC signal from several contributions and search for any weak glass transition steps of HDPE, we performed TMDSC. Selected results by TMDSC are shown in Figure 5. Figure 5a shows the total cp curve along with its two contributions; i.e., the reversing (real) and non-reversing (imaginary) parts for unfilled HDPE. The glass transition step was sought within the reversing (real) part of cp (Figure 5b). The glass transition was again absent in all HDPE-based samples at least at the temperature range investigated. Therefore, we concluded that any amorphous polymer chains were mainly immobile (bound) either around the crystals or at EGr interfaces.
Thus, we expected that polyethylene in bulk and in composites consisted of two phases; namely, CF and RAF due to crystals, RAFcrystal. Employing again a two phase model (1 = CF + RAFcrystal), we estimated RAFcrystal to equal 0.44 in neat HDPE and to systematically decrease with the EGr addition down to 0.28. The data have been included Figure 3b. Taking into account all of the data on Tm, CF and RAFcrystal together, we concluded that the crystals formed in the composites compared with the unfilled matrix should have been of a similar quality (lamellae thickness, similar Tm) but of a larger average size (CF elevated, RAFcrystal dropped). The effects could be checked by proper microscopy experiments, e.g., polarized optical microscopy [66,67]. Nevertheless, due to the heavy loadings of such large particles (dark), such investigations could be precluded.

3.2. Electrical Conductivity (BDS)

The data by BDS are shown in Figure 6a in the form of the frequency dependence of the real part of the complex electrical conductivity σ(f) at 20 °C for all systems. We recalled that EGr is an electrically conducting material while our polymers were insulators. At 20 °C, PS was also at the glassy state whereas HDPE was mainly crystalline and rigid. Depending on the EGr fraction, two distinct behaviors were observed in σ(f) in Figure 6a. On the one hand, for the composites with compositions between 0 and 8 wt % EGr, the AC conductivity increased almost linearly with f. This was typical behavior for insulating materials. On the other hand, for the larger EGr loadings, σ increased by many orders of magnitude (to 10–4–10–2 S/cm, Figure 6a) and the composites demonstrated the so-called DC plateau wherein σ became independent from f.
To supply a more direct comparison between all samples, the σ values for the lowest measured frequency (10–1 Hz) were plotted in Figure 6b against the EGr loading. In the case of electrically conducting materials (the existence of the DC plateau), the said value of σ represented the DC conductivity, σDC. It is clearly seen in Figure 6b that the transition from the insulating to conducting phase took place between 8 and ~12 wt % EGr for PS and between 8 and 25 wt % EGr for HDPE. The electrical conductivity of the high values 10–4–10–2 S/cm was due to EGr in particular, screening the oriented transport of electrons via the fillers (hopping and tunneling mechanisms, inset to Figure 6b) [3,25]. The lower value of EGr loading for the formation of the first electrically conducting paths (inset scheme to Figure 6b) throughout the whole sample, i.e., the so-called percolation threshold (pc), was located between the two aforementioned values. The exact value could be calculated from the percolation theory [34]; nevertheless, we did not proceed with such a calculation as more experimental data were necessary, especially for the HDPE-based samples. There have also been significantly lower reported pc values in nanocomposites [3,25,68] (and references therein) than those expected here.
It is interesting to mark from the methodological point of view that between the 8 and 12 wt % EGr we showed above in Figure 3 the thermal transitions and polymer fractions also exhibited their most intense changes, which was partly correlated with the formation of continuous filler paths (agglomerates) throughout both polymer matrices (such as those schematically described in Scheme 1c).

3.3. Thermal Conductivity (LFA)

The focus can be turned now to the results by LFA. The raw LFA measurement results at 20 °C are shown in Figure 7 in the form of the time evolution of the detector signal along with the corresponding analysis for determining t1/2. The signal represented the temperature of the top (rear) surface of the sample (inset to Figure 7a).
From only a glance at Figure 7, it is obvious that the heat transfer response was faster in the composites compared with the unfilled matrices. Subsequently, t1/2 was reduced. Employing Equation (4), the LFA data of Figure 7 were evaluated in terms of α. We noted that α is the direct thermal property obtained by the LFA technique. The data for α are shown in Figure 8a. Therein, α varied between 0.11 mm2/s (i.e., in neat PS) and 1.41 mm2/s (i.e., in HDPE + 55% EGr), systematically increasing with the EGr loading. A final comment on α refers to PS filled with EGr between 8 and 12 wt %. Between the two latter compositions, a sudden increase in α occurred in Figure 8a. This might correlate with the percolation of EGr expected at that concentration, as shown above for σ in Figure 6b.
Regarding heat transport, the physical property that is exploitable for processing and applications is thermal conductivity. For the accurate evaluation of λ and according to Equation (5), next to the easily measurable density, ρ, cp was necessary. cp was estimated by the LFA measurement here in combination with properly chosen reference materials and suitable software. Thus, λ was estimated here for PS-based systems between 0.13 and 0.55 W·K–1·m–1 and in the HDPE-based ones between 0.38 and 1.97 W·K–1·m–1, monotonically increasing with EGr loading in Figure 8b. The absolute λ were calculated also by employing the cp values obtained by TMDSC (Figure 5b) and the results were included in Figure 8b. Therein, λ was in quite good agreement for the two calculation routes.
In the HDPE-based systems compared with the PS-based ones, α and λ were larger and this was most probably due to the implementation of polymer HDPE crystals at high fractions [22,33,45,46,71]. In Figure 8a, the % increase in CF was not equal or similar to the increase of α and λ. Therefore, the results suggested that the major contribution to heat transport was via EGr and the synergetic contribution of crystals (Scheme 1c and inset to Figure 8b).
Beside these facts, it is useful to compare our data on λ with those of the initial EGr. To do so, we added data for neat EGr from the literature, both theoretical values mathematically estimated [69] and experimental ones [70], as shown in Figure 8b. According to these works and depending on the density of EGr (degree of packing/exfoliation), λ may change from ~1 to 7 W·K–1·m–1 [69] or from 4 to 12 W·K–1·m–1 [70]. The measured values can be also higher; for example, even up to 45 W·K–1·m–1 [70] depending on the method of measurement, e.g., placing the used detector parallel or perpendicular to the direction of the thermal stimulation.
Obviously, the larger λ for EGr occurred for the largest density [69,70]. In our case EGr was exfoliated (at 400 °C) prior to the preparation of the composites and the exfoliation (either extensive or not) was expected to be maintained in the composites due to the high temperature of melt-compounding. Consequently, the apparent density of EGr in the composites was also expected to be low. In this context, when extrapolating the linear fitting of our results on λ in Figure 8b to the 100% EGr content we expected a coincidence to the lower λ for the initial EGr. This was found to be true as far as the theoretical values were concerned (region 1 in Figure 8b) but not for the experimentally estimated λ (region 2). The lower values in general of our λ in the composites, moreover, even lower for the amorphous PS-based ones, originated from the various factors that hindered the transport of heat (Scheme 1c). First, considering the heat transport via the conducting fillers, the hindering was due to the heat resistance at the individual filler contacts (contact resistance) [40,41,54] and the interfacial thermal resistance at the filler-polymer interface (interfacial thermal resistance) [40,47]. As far as the heat transport via the polymer was concerned, this was quite poor in the amorphous polymers and became worse when filler-polymer interfaces were involved [22,23]; the latter acting as heat scatterers. On the contrary, the formation of crystals (ordered structures) is known to favor polymer-through transport of hot phonons [45,46]. This was clear in our case when comparing the amorphous and highly crystalline matrices in Figure 8. Quite recently, we showed that the RAFcrystal can be used as measure of the crystals-through heat transport (insets to Figure 8b) [22] while on the other hand a measure of the amorphous polymer heat scattering at the filler interfaces in composites has been proposed to be the amount of RAFfiller [22]. Both RAFs were estimated here (Figure 3b); however, their action as described above cannot be evaluated here, at least not without serious assumptions. Furthermore, the individual through-polymer contribution to λ was minor compared with the severely large EGr-through contribution.

4. Conclusions

In summary, we prepared, by simple melt-compounding, and investigated polymer composites consisting of amorphous PS or semicrystalline HDPE filled with 5–55 wt % EGr. Complementary techniques, TGA, DSC-TMDSC, BDS and LFA, were employed to explore the thermal transitions and evaluate the electrical and thermal conductivity. In both types of polymer in the amorphous state based on TGA data, polymer-EGr interfacial interactions seemed to be formed and, indirectly, led to hindered thermal decomposition. The effect of decomposition hysteresis was larger in HDPE/EGr than PS/EGr, suggesting stronger interfacial interactions in the case of HDPE. EGr fillers were found to slightly hinder the PS chain mobility by increasing the Tg and produced a relatively low amount of interfacial bound polymer (RAFfiller). On the other hand, the presence of EGr in the highly crystalline HDPE matrix resulted in a further elevation of CF whereas based on the absence of a glass transition step, it was considered that the non-crystallized part of HDPE was all rigid; for example, around the crystals (RAFcrystal). The center of interest here considering also the targeted applications were the effects of EGr on the electrical and heat transport. BDS results showed that fillers formed free electron paths at >8 wt % EGr loadings, producing high σ values up to 10–3–10–2 S/cm. On the other hand, a LFA revealed the systematic and intensive increase of α and λ by the EGr addition with this increase being almost linear. The quite large λ values (up to 1.97 W·K–1·m–1) suggested that the thermal transport in the composites occurred severely via the percolation of the EGr sheets. λ was systematically higher in HDPE than in PS, already in the case of the unfilled matrices, which was indicative of the additional contribution of crystals to heat transport. Overall, the effects recorded here on the thermal and the electrical conductivities by the fillers as well as by the crystals indicated the successful preparation of materials and, partly, their performance, envisaging the wanted applications. Moreover, the said effects were expected to favor other improvements of properties such as the mechanical performance, which was also wanted and could be checked in a future work.

Author Contributions

Conceptualization, P.A.K. and D.N.B.; methodology, P.A.K.; validation, D.N.B., A.K., D.K. and V.P.; formal analysis, P.A.K. and L.P.; investigation, P.A.K., D.K. and L.P.; resources, A.K. and D.N.B.; writing—original draft preparation, P.A.K.; writing—review and editing, L.P., A.K., V.P., K.C. and D.N.B.; visualization, P.A.K.; supervision, A.K., K.C. and D.N.B. All authors have read and agreed to the published version of the manuscript.

Funding

The authors wish to acknowledge co-funding of this research by European Union European Regional Development Fund and Greek Ministry of Education, Research and Religions/EYDE-ETAK through program EPANEK 2014–2020/Action “EREVNO-DIMIOURGO-KAINOTOMO” (project Τ1ΕΔΚ-02611).

Institutional Review Board Statement

Not applicable.

Informed Consent Statement

Informed consent was obtained from all subjects involved in the study.

Data Availability Statement

Data being contained within the article.

Conflicts of Interest

The authors declare no conflict of interest.

References

  1. Paul, D.R.; Robeson, L.M. Polymer nanotechnology: Nanocomposites. Polymer 2008, 49, 3187–3204. [Google Scholar] [CrossRef] [Green Version]
  2. Kumar, S.K.; Krishnamoorti, R. Nanocomposites: Structure, phase behavior, and properties. Annu. Rev. Chem. Biomol. Eng. 2010, 1, 37–58. [Google Scholar] [CrossRef] [Green Version]
  3. Alig, I.; Pötschke, P.; Lellinger, D.; Skipa, T.; Pagel, S.; Kasaliwal, G.R.; Villmow, T. Establishment, morphology and properties of carbon nanotubes networks in polymer melts. Polymer 2012, 53, 4–28. [Google Scholar] [CrossRef]
  4. Chen, J.; Liu, B.; Gao, X.; Xu, D. A review of the interfacial characteristics of polymer nanocomposites containing carbon nanotubes. RSC Adv. 2018, 8, 28048. [Google Scholar] [CrossRef] [Green Version]
  5. Bai, S.; Shen, X. Graphene-inorganic nanocomposites. RSC Adv. 2012, 2, 64–98. [Google Scholar] [CrossRef]
  6. Okada, A.; Usuki, A. Twenty years of polymer-clay nanocomposites. Macromol. Mater. Eng. 2006, 291, 1449–1476. [Google Scholar] [CrossRef]
  7. Klonos, P.; Panagopoulou, A.; Bokobza, L.; Kyritsis, A.; Peoglos, V.; Pissis, P. Comparative studies on effects of silica and titania nanoparticles on crystallization and complex segmental dynamics in poly(dimethylsiloxane). Polymer 2010, 51, 5490–5499. [Google Scholar] [CrossRef]
  8. Lin, Y.; Liu, L.; Xu, G.; Zhang, D.; Guan, A.; Wu, G. Interfacial interactions and segmental dynamics of poly(vinyl acetate)/silica nanocomposites. J. Phys. Chem. C 2015, 119, 12956–12966. [Google Scholar] [CrossRef]
  9. Bachhar, N.; Jiao, Y.; Asai, M.; Akcora, P.; Bandyopadhyaya, R.; Kumar, S.K. Impact of the distributions of core size and grafting density on the self-assembly of polymer grafted nanoparticles. Macromolecules 2017, 50, 7730–7738. [Google Scholar] [CrossRef]
  10. Klonos, P.A.; Goncharuk, O.V.; Pakhlov, E.M.; Sternik, D.; Deryło-Marczewska, A.; Kyritsis, A.; Gun’ko, V.M.; Pissis, P. Morphology, molecular dynamics, and interfacial phenomena in systems based on silica modified by grafting polydimethylsiloxane chains and physically adsorbed polydimethylsiloxane. Macromolecules 2019, 52, 2863–2877. [Google Scholar] [CrossRef]
  11. Bokobza, L.; Chauvin, J.P. Reinforcement of natural rubber: Use of in situ generated silicas and nanofibres of sepiolite. Polymer 2005, 46, 4144–4151. [Google Scholar] [CrossRef]
  12. Raquez, J.M.; Habibi, Y.; Murariu, M.; Dubois, P. Polylactide (PLA)–based nanocomposites. Prog. Polym. Sci. 2013, 38, 1504–1542. [Google Scholar] [CrossRef]
  13. Gin, P.; Jiang, N.; Liang, C.; Taniguchi, T.; Akgun, B.; Satija, S.K.; Endoh, M.K.; Koga, T. Revealed architectures of adsorbed polymer chains at solid-polymer melt interfaces. Phys. Rev. Lett. 2012, 109, 265501. [Google Scholar] [CrossRef] [Green Version]
  14. Vogiatzis, G.G.; Theodorou, D.N. Structure of polymer layers grafted to nanoparticles in silica-polystyrene nanocomposites. Macromolecules 2013, 46, 4670–4683. [Google Scholar] [CrossRef] [Green Version]
  15. Fragiadakis, D.; Pissis, P.; Bokobza, L. Glass transition and molecular dynamics in poly(dimethylsiloxane)/silica nanocomposites. Polymer 2005, 46, 6001–6008. [Google Scholar] [CrossRef]
  16. Klonos, P.; Kulyk, K.; Borysenko, M.V.; Gun’ko, V.M.; Kyritsis, A.; Pissis, P. Effects of molecular weight below the entanglement threshold on interfacial nanoparticles/polymer dynamics. Macromolecules 2016, 49, 9457–9473. [Google Scholar] [CrossRef]
  17. Cheng, S.; Holt, A.P.; Wang, H.; Fan, F.; Bocharova, V.; Martin, H.; Etampawala, T.; White, B.T.; Saito, T.; Kang, N.G.; et al. Unexpected molecular weight effect in polymer nanocomposites. Phys. Rev. Lett. 2016, 116, 038302. [Google Scholar] [CrossRef] [PubMed] [Green Version]
  18. Sargsyan, A.; Tonoyan, A.; Davtyan, S.; Schick, C. The amount of immobilized polymer in PMMA SiO2 nanocomposites determined from calorimetric data. Eur. Polym. J. 2007, 43, 3113–3127. [Google Scholar] [CrossRef]
  19. Dobbertin, J.; Hensel, A.; Schick, C. Dielectric spectroscopy and calorimetry in the glass transition region of semi-crystalline poly(ethylene terephthalate). J. Therm. Anal. Calorim. 1996, 47, 1027–1040. [Google Scholar] [CrossRef]
  20. Chen, Q.; Gong, S.; Moll, J.; Zhao, D.; Kumar, S.K.; Colby, R.H. Mechanical reinforcement of polymer nanocomposites from percolation of a nanoparticle network. ACS Macro Lett. 2015, 4, 398–402. [Google Scholar] [CrossRef]
  21. Bilchak, C.R.; Jhalaria, M.; Huang, Y.; Abbas, Z.; Midya, J.; Benedetti, F.M.; Parisi, D.; Egger, W.; Dickmann, M.; Minelli, M.; et al. Tuning selectivities in gas separation membranes based on polymer-grafted nanoparticles. ACS Nano 2020, 14, 17174–17183. [Google Scholar] [CrossRef]
  22. Klonos, P.A.; Tegopoulos, S.N.; Koutsiara, C.S.; Kontou, E.; Pissis, P.; Kyritsis, A. Effects of CNTs on thermal transitions, thermal diffusivity and electrical conductivity in nanocomposites: Comparison between an amorphous and a semicrystalline polymer matrix. Soft Matter 2019, 15, 1813–1824. [Google Scholar] [CrossRef] [PubMed]
  23. Klonos, P.A.; Peoglos, V.; Bikiaris, D.N.; Kyritsis, A. Rigid amorphous fraction and thermal diffusivity in nanocomposites based on poly(L-lactic acid) filled with carbon nanotubes and graphene oxide. J. Phys. Chem. C 2020, 123, 5469–5479. [Google Scholar] [CrossRef]
  24. Fragiadakis, D.; Bokobza, L.; Pissis, P. Dynamics near the filler surface in natural rubber-silica nanocomposites. Polymer 2011, 52, 3175–3182. [Google Scholar] [CrossRef]
  25. Logakis, E.; Pandis, C.; Pissis, P.; Pionteck, J.; Pötschke, P. Highly conducting poly(methyl methacrylate)/carbon nanotubes composites: Investigation on their thermal, dynamic-mechanical, electrical and dielectric properties. Compos. Sci. Technol. 2011, 71, 854–862. [Google Scholar] [CrossRef] [Green Version]
  26. Gedde, U.W. Polymer Physics; Chapman & Hall: London, UK, 1995. [Google Scholar]
  27. Toda, A.; Androsch, R.; Schick, C. Insights into polymer crystallization and melting from fast chip calorimetry. Polymer 2016, 91, 239–263. [Google Scholar] [CrossRef]
  28. Logakis, E.; Pandis, C.; Peoglos, V.; Pissis, P.; Stergiou, C.; Pionteck, J.; Pötschke, P.; Mičušík, M.; Omastová, M. Structure-property relationships in polyamide 6/multi-walled carbon nanotubes nanocomposites. J. Polym. Sci. B Polym. Phys. 2009, 47, 764–774. [Google Scholar] [CrossRef]
  29. Papadopoulos, L.; Klonos, P.A.; Tzetzis, D.; Papageorgiou, G.Z.; Kyritsis, A.; Bikiaris, D.N. Effects of graphene nanoplatelets on crystallization, mechanical performance and molecular dynamics of the renewable poly(propylene furanoate). Polymer 2020, 189, 122172. [Google Scholar] [CrossRef]
  30. Tessema, A.; Zhao, D.; Moll, J.; Xu, S.; Yang, R.; Li, C.; Kumar, S.K.; Kidane, A. Effect of filler loading, geometry, dispersion and temperature on thermal conductivity of polymer nanocomposites. Polym. Test. 2017, 57, 101–106. [Google Scholar] [CrossRef] [Green Version]
  31. Lin, J.; Shenogin, S.; Nazarenko, S. Oxygen solubility and specific volume of rigid amorphous fraction in semicrystalline poly(ethylene terephthalate). Polymer 2002, 43, 4733–4743. [Google Scholar] [CrossRef]
  32. Klonos, P.A.; Papadopoulos, L.; Tzetzis, D.; Kyritsis, A.; Papageorgiou, G.Z.; Bikiaris, D.N. Thermal, nanoindentation and dielectric study of nanocomposites based on poly(propylene furanoate) and various inclusions. Mater. Today Commun. 2019, 20, 100585. [Google Scholar] [CrossRef]
  33. Wurm, A.; Lellinger, D.; Minakov, A.A.; Skipa, T.; Pötschke, P.; Nicula, R.; Alig, I.; Schick, C. Crystallization of poly(ε-caprolactone)/MWCNT composites: A combined SAXS/WASX. Electrical and thermal conductivity study. Polymer 2014, 55, 2220. [Google Scholar] [CrossRef]
  34. Stauffer, D.; Aharony, A. Introduction to Percolation Theory; Taylor and Francis: London, UK, 1985. [Google Scholar]
  35. Kremer, F.; Schönhals, A. (Eds.) Broadband Dielectric Spectroscopy; Springer: Berlin/Heidelberg, Germany, 2003. [Google Scholar]
  36. Kada, D.; Koubaa, A.; Tabak, G.; Migneault, S.; Gamier, B.; Boudenne, A. Tensile properties, thermal conductivity, and thermal stability of short carbon fiber reinforced polypropylene composites. Polym. Compos. 2018, 39, E664–E670. [Google Scholar] [CrossRef]
  37. Boudenne, A.; Ibos, L.; Fois, M.; Majesté, J.C.; Géhin, E. Electrical and thermal behavior of polypropylene filled with copper particles. Compos. Part A 2005, 36, 1545–1554. [Google Scholar] [CrossRef]
  38. Papadopoulos, L.; Klonos, P.A.; Terzopoulou, Z.; Psochia, E.; Sanousi, O.M.; Aït Hocine, N.; Benelfellah, A.; Giliopoulos, D.; Triantafyllidis, K.; Kyritsis, A.; et al. Comparative study of crystallization, semicrystalline morphology, and molecular mobility in nanocomposites based on polylactide and various inclusions at low filler loadings. Polymer 2021, 217, 123457. [Google Scholar] [CrossRef]
  39. Khan, J.; Harton, S.E.; Akcora, P.; Benicewicz, B.; Kumar, S.K. Polymer crystallization in nanocomposites: Spatial reorganization of nanoparticles. Macromolecules 2009, 42, 5741–5744. [Google Scholar] [CrossRef]
  40. Han, Z.; Fina, A. Thermal conductivity of carbon nanotubes and their polymer nanocomposites: A review. Prog. Polym. Sci. 2011, 36, 914–944. [Google Scholar] [CrossRef] [Green Version]
  41. Burger, N.; Laachachi, A.; Ferriol, M.; Lutz, M.; Toniazzo, V.; Ruch, D. Review on thermal conductivity in composites: Mechanisms, parameters and theory. Prog. Polym. Sci. 2016, 61, 1–28. [Google Scholar] [CrossRef]
  42. Li, A.; Zhang, C.; Zhang, Y.F. Thermal conductivity of graphene-polymer composites: Mechanisms, properties, and applications. Polymers 2017, 9, 437. [Google Scholar]
  43. Rohsenow, W.M.; Hartnett, J.R.; Cho, Y.I. (Eds.) Handbook of Heat Transfer; McGraw-Hill: New York, NY, USA, 1998. [Google Scholar]
  44. Gong, P.; Buahom, P.; Tran, M.P.; Sanieri, M.; Park, C.B.; Pötschke, P. Heat transfer in microcellular polystyrene/multi-walled carbon nanotubes nanocomposite foams. Carbon 2015, 93, 819–829. [Google Scholar] [CrossRef]
  45. Hansen, D.; Bernier, G.A. Thermal conductivity of polyethylene: The effects of crystal size, density and orientation on the thermal conductivity. Polym. Eng. Sci. 1972, 12, 3. [Google Scholar] [CrossRef]
  46. Marsh, J.J.; Turner, R.P.; Carter, J.; Jenkins, M.J. Thermal diffusivity and secondary crystallization kinetics in poly(lactic acid). Polymer 2019, 179, 121595. [Google Scholar] [CrossRef]
  47. Ding, P.; Su, S.; Song, N.; Tang, S.; Liu, Y.; Shi, L. Influence on thermal conductivity of polyamide-6 covalently-grafted graphene nanocomposites: Varied grafting-structures by controllable macromolecular length. RSC Adv. 2014, 4, 18782–18791. [Google Scholar] [CrossRef]
  48. Nan, C.W.; Birringer, R. Effective thermal conductivity of particulate composites with interfacial thermal resistance. J. Appl. Phys. 1997, 81, 6692–6699. [Google Scholar] [CrossRef]
  49. Hedge, M.; Samulski, E.T.; Rubinstein, M.; Dingemans, T.J. The role of crystallinity in SWCNT–polyetherimide nanocomposites. Compos. Sci. Technol. 2015, 110, 176–187. [Google Scholar]
  50. Coleman, J.N.; Cadek, M.; Ryan, K.P.; Fonseca, A.; Nagy, J.B.; Blau, W.J.; Ferreira, M.S. Reinforcement of polymers with carbon nanotubes. The role of an ordered polymer interfacial region. Experiment and modeling. Polymer 2006, 47, 8556–8561. [Google Scholar] [CrossRef]
  51. Lu, T.; Kim, K.; Li, X.; Zhou, J.; Chen, G.; Liu, J. Thermal transport in semicrystalline polyethylene by molecular dynamics simulation. J. Appl. Phys. 2018, 123, 015107. [Google Scholar] [CrossRef]
  52. Klonos, P.; Sulym, I.Y.; Sternik, D.; Konstantinou, P.; Goncharuk, O.V.; Deryło-Marczewska, A.; Gun’ko, V.M.; Kyritsis, A.; Pissis, P. Morphology, crystallization and rigid amorphous fraction in PDMS adsorbed onto carbon nanotubes and graphite. Polymer 2018, 139, 130–144. [Google Scholar] [CrossRef]
  53. Moore, A.L.; Shi, L. Emerging challenges and materials for thermal management of electronics. Mater. Today 2014, 17, 163–174. [Google Scholar] [CrossRef]
  54. Konstantopoulos, G.; Maroulas, P.; Dragatogiannis, D.A.; Koutsoumpis, S.; Kyristis, A.; Charitidis, C.A. The effect of interfacial resistance and crystallinity on heat transfer mechanism in carbon nanotubes reinforced polyethylene. Mater. Des. 2021, 199, 109420. [Google Scholar] [CrossRef]
  55. Acuña, P.; Li, Z.; Santiago-Calvo, M.; Villarañe, F.; Rodriguez-Perez, M.A.; Wang, D.Y. Influence of the characteristics of expandable graphite on the morphology, thermal properties, fire behaviour and compression performance of a rigid polyurethane foam. Polymers 2019, 11, 168. [Google Scholar] [CrossRef] [Green Version]
  56. Wurm, A.; Ismail, M.; Kretzschmar, B.; Pospiech, D.; Schick, C. Retarded crystallization in polyamide/layered silicates nanocomposites caused by an immobilized interphase. Macromolecules 2010, 43, 1480–1487. [Google Scholar] [CrossRef]
  57. Wunderlich, B.; Czornyj, G. A study of equilibrium melting of polyethylene. Macromolecules 1977, 10, 906–913. [Google Scholar] [CrossRef]
  58. Xu, H.; Cebe, P. Heat capacity study of isotactic polystyrene: Dual reversible crystal melting and relaxation of rigid amorphous fraction. Macromolecules 2004, 37, 2797–2806. [Google Scholar] [CrossRef]
  59. Vassiliadou, O.; Chrysostomou, V.; Pispas, S.; Klonos, P.A.; Kyritsis, A. Molecular dynamics and crystallization in polymers based on ethylene glycol methacrylates (OEGMA) with melt-memory characteristics: From linear oligomers to comb-like polymers. Soft Matter 2021, 17, 1284–1298. [Google Scholar] [CrossRef]
  60. Parker, W.J.; Jenkins, R.J.; Butler, C.P.; Abbott, G.L. Flash method of determining thermal diffusivity, heat capacity, and thermal conductivity. J. Appl. Phys. 1961, 32, 1679. [Google Scholar] [CrossRef]
  61. Cowan, R.D. Pulse method of measuring thermal diffusivity at high temperatures. J. Appl. Phys. 1963, 34, 926. [Google Scholar] [CrossRef]
  62. Leng, J.; Szymoniak, P.; Kang, N.J.; Wang, D.Y.; Wurm, A.; Schick, C.; Schönhals, A. Influence of interfaces on the crystallization behavior and the rigid amorphous phase of poly(L-lactide)-based nanocomposites with different layered double hydroxides as nanofiller. Polymer 2019, 184, 121929. [Google Scholar] [CrossRef]
  63. Szymoniak, P.; Pauw, B.; Qu, X.; Schönhals, A. Competition of nanoparticle-induced mobilization and immobilization effects on segmental dynamics of an epoxy-based nanocomposite. Soft Matter 2020, 16, 5406–5421. [Google Scholar] [CrossRef]
  64. Monnier, X.; Cavallo, D.; Righetti, M.C.; Di Lorenzo, M.L.; Marina, S.; Martin, J.; Cangialosi, D. Physical aging and glass transition of the rigid amorphous fraction in poly(L-lactic acid). Macromolecules 2020, 53, 8741–8750. [Google Scholar] [CrossRef]
  65. Karava, V.; Siamidi, A.; Vlachou, M.; Christodoulou, E.; Zamboulis, A.; Bikiaris, D.N.; Kyritsis, A.; Klonos, P.A. Block copolymers based on poly(butylene adipate) and poly(L-lactic acid) for biomedical applications: Synthesis, structure and thermodynamical studies. Soft Matter 2021, in press. [Google Scholar] [CrossRef] [PubMed]
  66. Papageorgiou, G.Z.; Terzopoulou, Z.; Bikiaris, D.; Triantafyllidis, K.S.; Diamanti, E.; Gournis, D.; Klonos, P.; Giannoulidis, E.; Pissis, P. Evaluation of the formed interface in biodegradable poly(l-lactic acid)/graphene oxide nanocomposites and the effect of nanofillers on mechanical and thermal properties. Thermochim. Acta 2014, 597, 48–57. [Google Scholar] [CrossRef]
  67. Klonos, P.A.; Papadopoulos, L.; Kasimatis, M.; Iatrou, H.; Kyritsis, A.; Bikiaris, D.N. Synthesis, crystallization, structure-memory effects and molecular dynamics of biobased and renewable poly(n-alkylene succinate)s with n from 2 to 10. Macromolecules 2021, 54, 1106–1119. [Google Scholar] [CrossRef]
  68. Logakis, E.; Pollatos, E.; Pandis, C.; Peoglos, V.; Zuburtikudis, I.; Delidis, C.G.; Vatalis, A.; Gjoka, M.; Syskakis, E.; Viras, K.; et al. Structure-property relationships in isotactic polypropylene/multi-walled carbon nanotubes nanocomposites. Compos. Sci. Technol. 2010, 70, 328–335. [Google Scholar] [CrossRef]
  69. Afanasov, I.M.; Savchenko, D.V.; Ionov, S.G.; Rusakov, D.A.; Seleznev, A.N.; Avdeev, V.V. Thermal conductivity and mechanical properties of expanded graphite. Inogranic. Mater. 2009, 45, 486–490. [Google Scholar] [CrossRef]
  70. Bozenta, J.; Mazur, J.; Kaźmierczak-Bałata, A. Thermal properties of compressed expanded graphite: Photothermal measurements. Appl. Phys. B 2011, 105, 623–630. [Google Scholar] [CrossRef] [Green Version]
  71. Hu, M.; Yu, D.; Wei, J. Thermal conductivity determination of small polymer samples by differential scanning calorimetry. Polym. Test. 2007, 26, 333–337. [Google Scholar] [CrossRef]
Scheme 1. Schematic models for the polymer (bulk, interfacial)/filler/crystal distribution in the composites under investigation based on (a) an amorphous matrix [18] (here polystyrene) and (b) a semicrystalline one [56] (here polyethylene). (c) shows a simplified view of the electrical (electrons, e-) conduction and the heat transport (phonons, electrons) in (left) amorphous and (right) semicrystalline polymer composites and nanocomposites (PNCs), wherein the matrix was filled with conductive inclusions (here expandable graphite (EGr)) that partly percolated with each other [3,22,23,33] (and references therein).
Applnano 02 00004 sch001
Figure 1. Thermogravimetric analysis (TGA) thermograms for (a) high-density polyethylene/expandable graphite (HDPE/EGr) and (b) polystyrene/expandable graphite (PS/EGr) composites. The insets to (a,b) show the corresponding derivative mass loss (dTG) curves. (c) shows the EGr effects on the 5 % mass loss temperature, T5%.
Applnano 02 00004 g001
Figure 2. Differential scanning calorimetry (DSC) curves during heating at 10 K/min for the PS-based systems under investigation during scan 2. The heat flow values were normalized to the sample mass. The dot-dashed lines were added as representatives of the baselines of the curves before and upon glass transition.
Applnano 02 00004 g002
Figure 3. (a) Main values of interest from the calorimetry measurements; namely, Tg and Δcp.n for PS/EGr and Tm and ΔHm,n for HDPE/EGr against the filler wt loading in a common diagram. The lines connecting the data have been added to guide the eye. (b) The EGr loading dependence of the calculated polymer fractions, CF, RAF and MAF (details in the main text) for both types of matrix.
Applnano 02 00004 g003
Figure 4. DSC curves during heating at 10 K/min for the HDPE-based systems under investigation. Results refer to scan 2; i.e., upon erasing any thermal history. The heat flow was normalized to the sample mass. The dot-dashed lines were added as representatives of the baselines of the curves before and after melting.
Applnano 02 00004 g004
Figure 5. (a) Results by temperature modulation in DSC (TMDSC) for neat HDPE in terms of total cp as well as its reversing (real) and non-reversing (imaginary) parts. (b) shows comparatively the reversing cp for all HDPE-based samples and, for comparison, neat PS. Vertical dash-dotted lines have been added to mark the values of cp at 20 °C.
Applnano 02 00004 g005
Figure 6. (a) Comparative broadband dielectric spectroscopy (BDS) spectra of the real part of electrical conductivity (in AC), σ, versus frequency at 20 °C for the samples described on the plot. (b) The EGr loading dependence of σ at 100 mHz. The marked area in (b) shows the expected range of EGr loading wherein the electrically conductive paths through EGr were initially formed (electrical percolation, inset scheme).
Applnano 02 00004 g006
Figure 7. Typical laser flash analysis (LFA) measurements at 20 °C for (a) neat HDPE and PE + 5–50 wt % EGr and (b) neat PS and PS + 12 and 33 wt % EGr. The added dotted arrows describe the route for estimating t1/2. (to be used for the calculation of α in Equation (4)). Included in (a) is a schematic that describes the measurement process in LFA and a representative laser pulse profile.
Applnano 02 00004 g007
Figure 8. The EGr loading dependence of (a) thermal diffusivity, α, and (b) thermal conductivity, λ. In (a), the values for crystalline fraction (CF) were added for comparison and correspond to the vertical axis at the right. In (b), the open and crossed data points correspond to λ estimated by the cp values obtained by LFA and TMDSC, respectively. The added straight lines in (b) are used as guides to the eyes, whereas the marked regions (1) and (2) refer to neat EGr from works from the literature, [69,70], respectively. The inset schemes to (b) are simplified models for rationalizing a few differences in the heat transport (arrows) between the amorphous and the semicrystalline composites.
Applnano 02 00004 g008
Publisher’s Note: MDPI stays neutral with regard to jurisdictional claims in published maps and institutional affiliations.

