
Unraveling the Role of Aluminum in Boosting Lithium-Ionic Conductivity of LLZO


Abstract

1. Introduction
2. Methodology
2.1. Electronic Structure
2.2. Heating
2.3. Molecular Dynamics
2.4. Formation Energy and Electronic Conductivity
2.5. Binding Energy
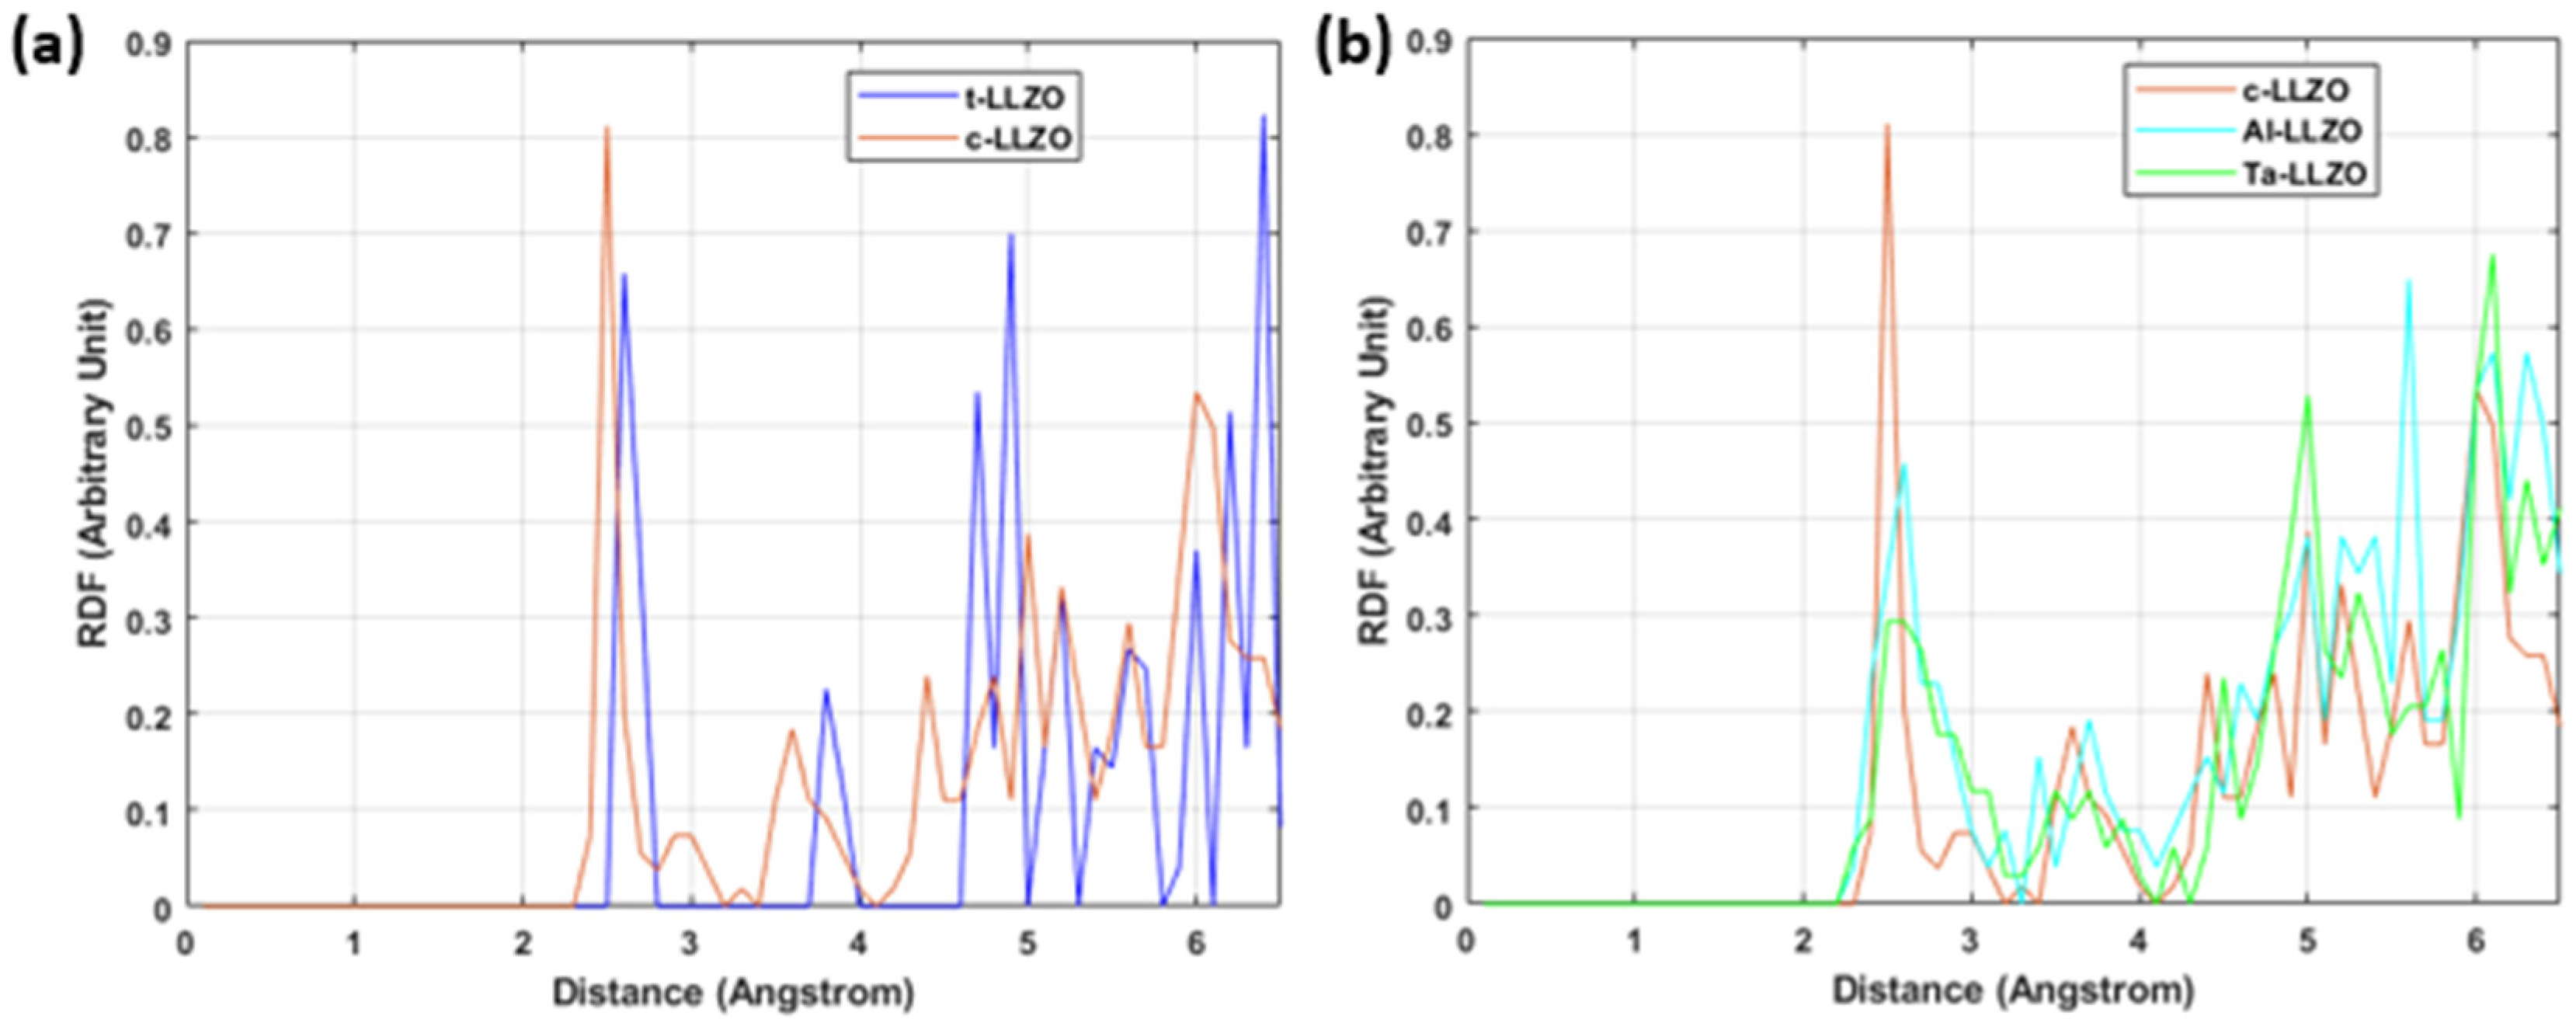
2.6. Radial Distribution Function
3. Computational Methodology
4. Results and Discussion
4.1. Ionic Conductivity and Activation Energy
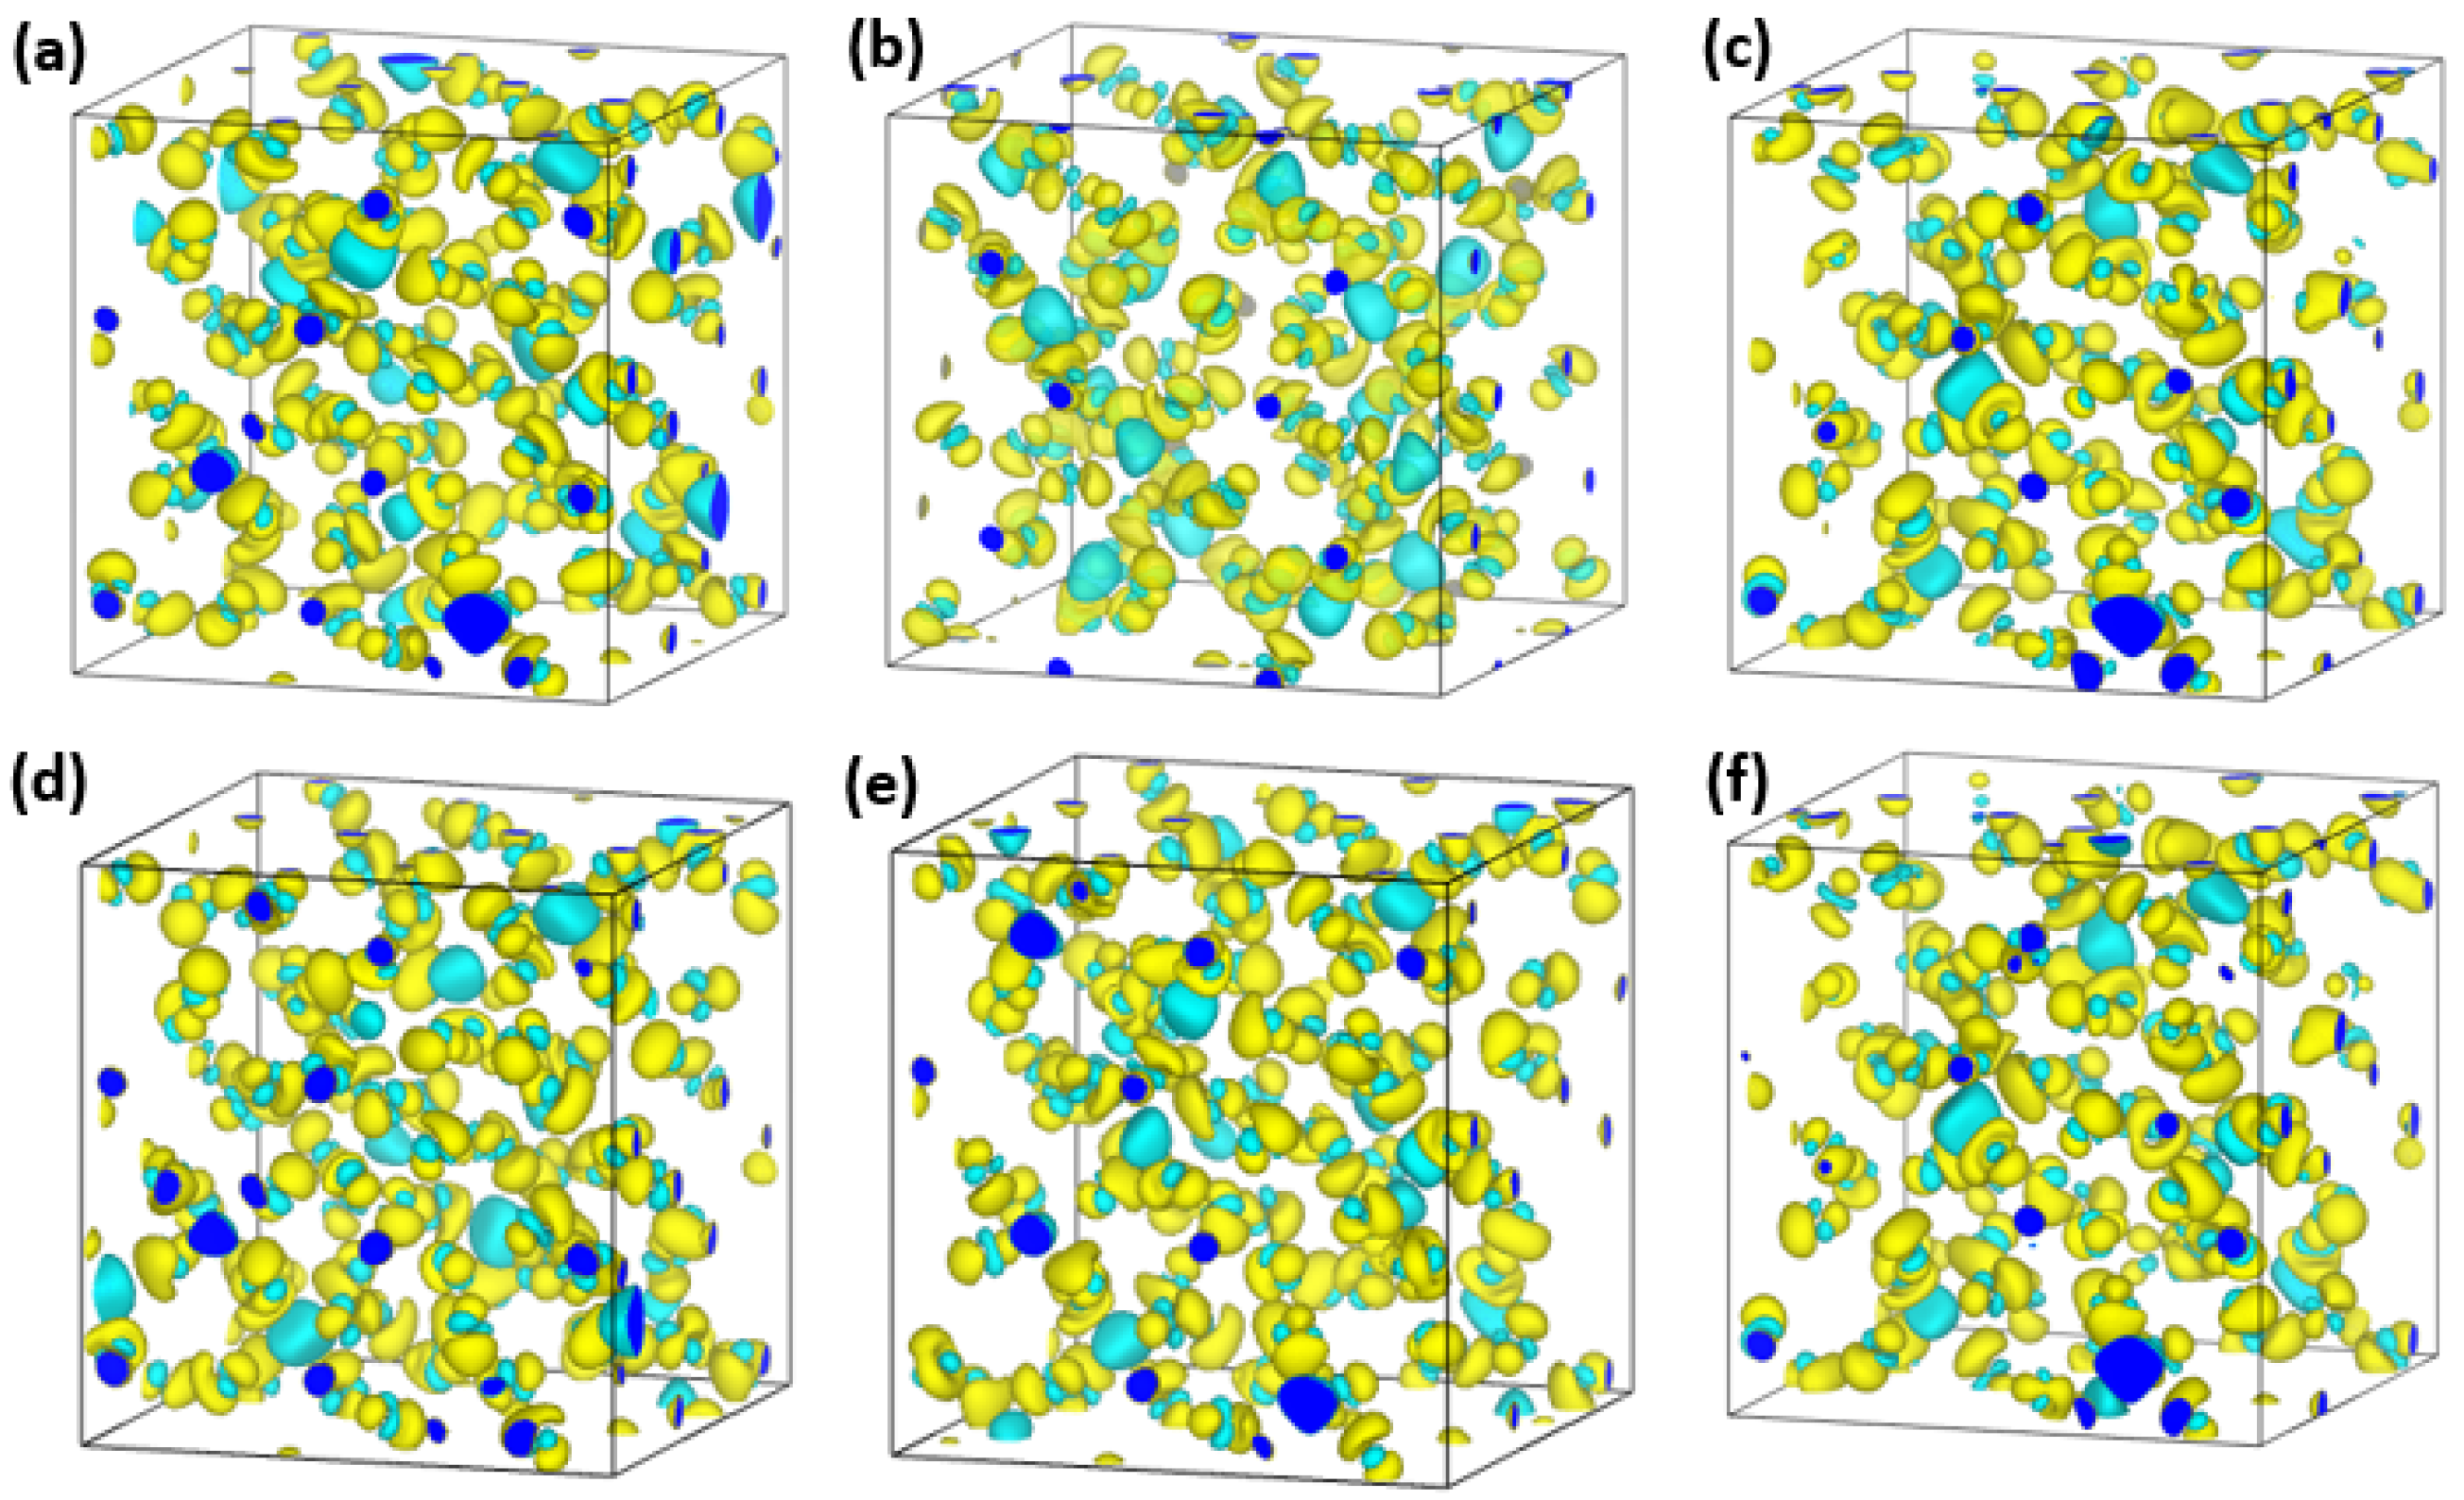
4.2. Analysis Based on Electronic Properties
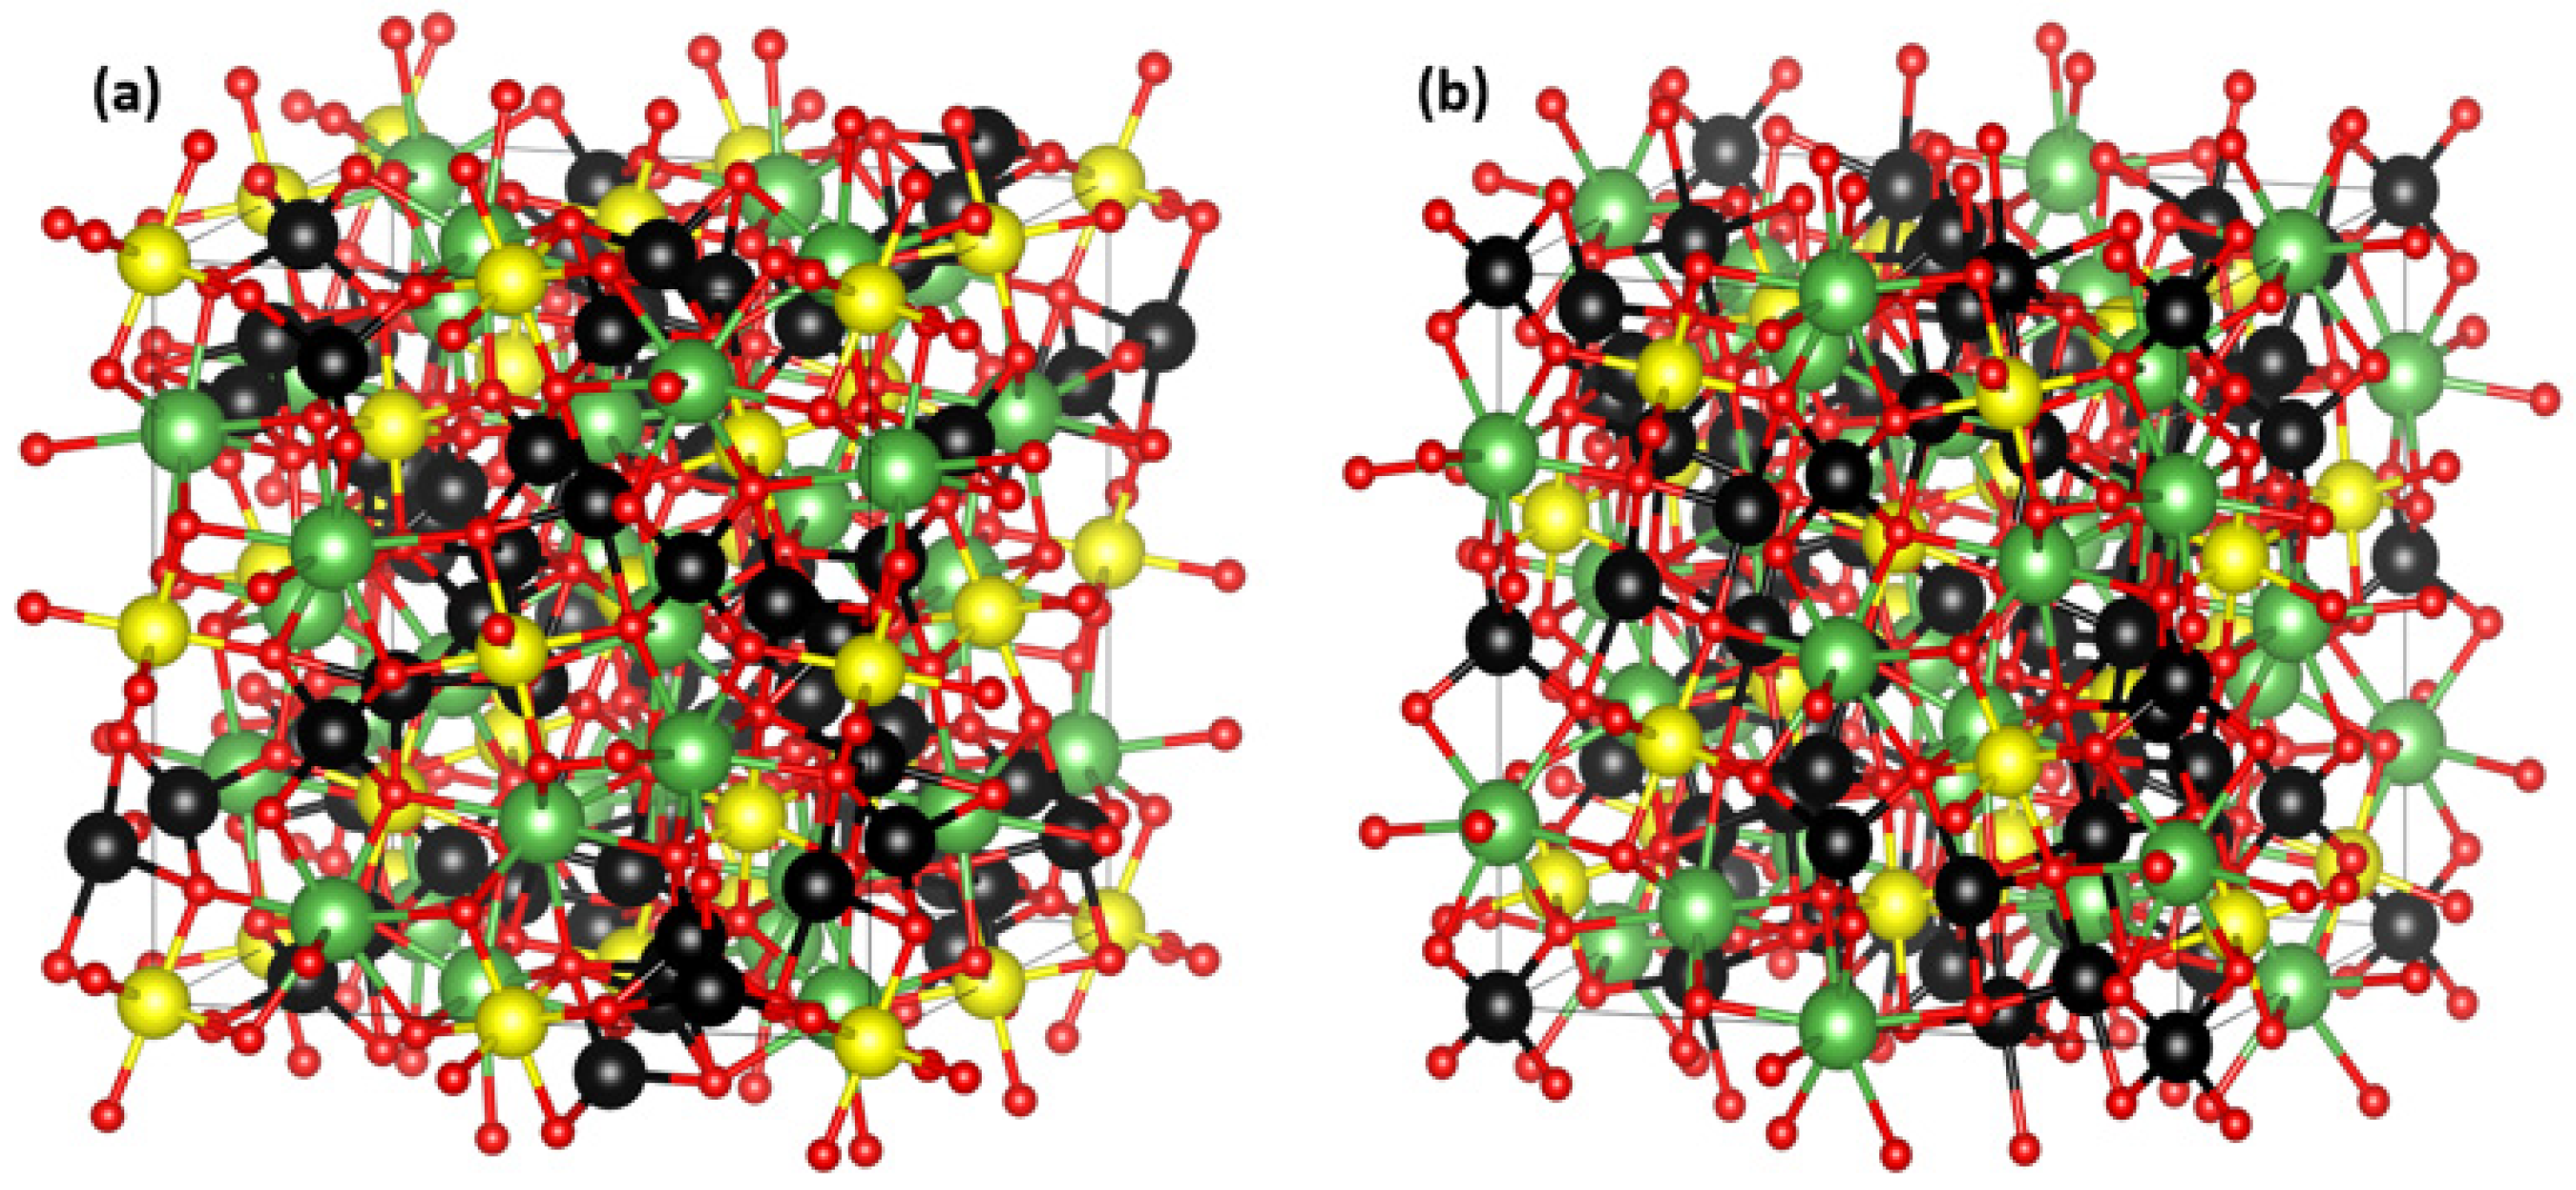
4.3. Analysis Based on Structural Properties
4.4. Cubic-Phase Preservation and Model Validation
5. Conclusions
Supplementary Materials
Author Contributions
Funding
Institutional Review Board Statement
Informed Consent Statement
Data Availability Statement
Conflicts of Interest
Abbreviations
| LLZO | Lithium Lanthanum Zirconium Oxide |
| DFT | Density Functional Theory |
| AIMD | Ab Initio Molecular Dynamics |
| RDF | Radial Distribution Function |
| XRD | X-Ray Diffraction |
| SSB | Solid-State Battery |
| MSD | Mean Square Distance |
| PBE | Perdew–Burke–Ernzerhof |
| GGA | Generalized Gradient Approximation |
| VASP | Vienna Ab initio Software Package |
| TDOS | Total Density of States |
References
- Zheng, F.; Kotobuki, M.; Song, S.; Lai, M.O.; Lu, L. Review on Solid Electrolytes for All-Solid-State Lithium-Ion Batteries. J. Power Sources 2018, 389, 198–213. [Google Scholar] [CrossRef]
- Raju, M.; Altayran, F.; Johnson, M.; Wang, D.; Zhang, Q. Crystal Structure and Preparation of Li7La3Zr2O12 (LLZO) Solid-State Electrolyte and Doping Impacts on the Conductivity: An Overview. Electrochem 2021, 3, 26. [Google Scholar] [CrossRef]
- Samson, A.J.; Hofstetter, K.; Bag, S.; Thangadurai, V. A Bird’s-Eye View of Li-Stuffed Garnet-Type Li7La3Zr2O12 Ceramic Electrolytes for Advanced All-Solid-State Li Batteries. Energy Environ. Sci. 2019, 12, 2957–2977. [Google Scholar] [CrossRef]
- Awaka, J.; Kijima, N.; Hayakawa, H.; Akimoto, J. Synthesis and Structure Analysis of Tetragonal Li7La3Zr2O12 with the Garnet-Related Type Structure. J. Solid State Chem. 2009, 182, 2046–2052. [Google Scholar] [CrossRef]
- Murugan, R.; Thangadurai, V.; Weppner, W. Fast Lithium Ion Conduction in Garnet-Type Li7La3Zr2O12. Angew. Chem. Int. Ed. 2007, 46, 7778–7781. [Google Scholar] [CrossRef] [PubMed]
- Awaka, J.; Takashima, A.; Kataoka, K.; Kijima, N.; Idemoto, Y.; Akimoto, J. Crystal Structure of Fast Lithium-Ion-Conducting Cubic Li7La3Zr2O12. Chem. Lett. 2011, 40, 60–62. [Google Scholar] [CrossRef]
- Barai, P.; Ngo, T.; Narayanan, B.; Higa, K.; Curtiss, L.A.; Srinivasan, V.; Sharma, J. The Role of Local Inhomogeneities on Dendrite Growth in LLZO-Based Solid Electrolytes. J. Electrochem. Soc. 2020, 167, 100538. [Google Scholar] [CrossRef]
- Cheng, X.-B.; Huang, J.-Q.; Yuan, H.; Lu, Y.; Yan, C.; Zhu, G.-L.; Xu, R.; Zhao, C.-Z.; Hou, L.-P.; He, C.; et al. Controlling Dendrite Growth in Solid-State Electrolytes. ACS Energy Lett. 2020, 5, 825–836. [Google Scholar] [CrossRef]
- Zheng, C.; Ruan, Y.; Su, J.; Song, Z.; Xiu, T.; Jin, J.; Badding, M.E.; Wen, Z. Grain Boundary Modification in Garnet Electrolyte to Suppress Lithium Dendrite Growth. Chem. Eng. J. 2021, 419, 129586. [Google Scholar] [CrossRef]
- Nasir, M.; Park, J.Y.; Heo, P.; Choi, K.H.; Park, H.J. Li–La–Zr–O Garnets with High Li-Ion Conductivity and Air-Stability by Microstructure-Engineering. Adv. Funct. Mater. 2023, 33, 2303397. [Google Scholar] [CrossRef]
- Vema, S.; Berge, A.H.; Nagendran, S.; Grey, C.P. Clarifying the Dopant Local Structure and Effect on Ionic Conductivity in Garnet Solid-State Electrolytes for Lithium-Ion Batteries. Chem. Mater. 2023, 35, 9632–9646. [Google Scholar] [CrossRef]
- Alam, T.; Das, A. Review on Impurity and Conductivity Issues of Garnet Type Li7La3Zr2O12: Mechanisms, Solutions, and Perspectives. Energy Fuels 2023, 37, 15267–15282. [Google Scholar] [CrossRef]
- Connell, J.G.; Fuchs, T.; Hartmann, H.; Krauskopf, T.; Zhu, Y.; Sann, J.; Garcia-Mendez, R. Kinetic versus Thermodynamic Stability of LLZO in Contact with Lithium Metal. Chem. Mater. 2020, 32, 10000–10015. [Google Scholar] [CrossRef]
- Paolella, A.; Zhu, W.; Bertoni, G.; Savoie, S.; Feng, Z.; Demers, H.; Gariepy, V.; Girard, G.; Rivard, E. Discovering the Influence of Lithium Loss on Garnet Li7La3Zr2O12 Electrolyte Phase Stability. ACS Appl. Energy Mater. 2020, 3, 3415–3424. [Google Scholar] [CrossRef]
- Benabed, Y.; Vanacker, A.; Foran, G.; Rousselot, S.; Hautier, G.; Dollé, M. Solving the Li7La3Zr2O12 Electrochemical Stability Window Puzzle. Mater. Today Energy 2023, 31, 101117. [Google Scholar] [CrossRef]
- Smetaczek, S.; Pycha, E.; Ring, J.; Sieben, M.; Ganschow, S.; Berendts, S.; Nenning, A. Investigating the Electrochemical Stability of Li7La3Zr2O12 Solid Electrolytes Using Field Stress Experiments. J. Mater. Chem. A 2021, 9, 9750–9762. [Google Scholar] [CrossRef]
- Ring, J. Electrochemical Stability of Li-Ion Conducting Lithium Lanthanum Zirconate (LLZO) and Lithium Lanthanum Titanate (LLTO) Solid Electrolytes. Doctoral Dissertation, Technische Universität, Wien, Vienna, 2023. [Google Scholar] [CrossRef]
- Kodgire, P.; Tripathi, B.; Chandra, P. Review of Garnet-Based Solid Electrolytes for Li-Ion Batteries (LIBs). J. Electron. Mater. 2024, 53, 2203–2228. [Google Scholar] [CrossRef]
- Guo, S.; Sun, Y.; Cao, A. Garnet-Type Solid-State Electrolyte Li7La3Zr2O12: Crystal Structure, Element Doping and Interface Strategies for Solid-State Lithium Batteries. Chem. Res. Chin. Univ. 2020, 36, 329–342. [Google Scholar] [CrossRef]
- Cao, S.; Song, S.; Xiang, X.; Hu, Q.; Zhang, C.; Xia, Z.; Xu, Y.; Zha, W.; Li, J.; Gonzale, P.M.; et al. Modeling, Preparation, and Elemental Doping of Li7La3Zr2O12 Garnet-Type Solid Electrolytes: A Review. J. Korean Ceram. Soc. 2019, 56, 101–115. [Google Scholar] [CrossRef]
- Salimkhani, H.; Yurum, A.; Gursel, S.A. A Glance at the Influence of Different Dopant Elements on Li7La3Zr2O12 Garnets. Ionics 2021, 27, 3673–3698. [Google Scholar] [CrossRef]
- Wang, Y.; Wu, Y.; Wang, Z.; Chen, L.; Li, H.; Wu, F. Doping Strategy and Mechanism for Oxide and Sulfide Solid Electrolytes with High Ionic Conductivity. J. Mater. Chem. A 2022, 10, 4517–4532. [Google Scholar] [CrossRef]
- Ma, J.; Jiang, Y.; Chen, W.; Luo, C.; Zhang, L.; Xu, H.; Chang, J.; Huang, W.; Wang, C.; Chi, S.-S.; et al. A Low-Cost Al-Doped Garnet Li7La3Zr2O12 with High Ionic Conductivity for High-Energy Solid-State Lithium Metal Batteries. Appl. Phys. Lett. 2019, 121, 193901. [Google Scholar] [CrossRef]
- Han, F.; Westover, A.S.; Yue, J.; Fan, X.; Wang, F.; Chi, M.; Leonard, D.N.; Dudney, N.J.; Wang, H.; Wang, C. High Electronic Conductivity as the Origin of Lithium Dendrite Formation within Solid Electrolytes. Nat. Energy 2019, 4, 187–196. [Google Scholar] [CrossRef]
- Eggestad, K.; Selbach, S.M.; Williamson, B.A. Doping Implications of Li Solid-State Electrolyte Li7La3Zr2O12. J. Mater. Chem. A 2024, 12, 15666–15675. [Google Scholar] [CrossRef]
- Košir, J.; Mousavihashemi, S.; Suominen, M.; Kobets, A.; Wilson, B.P.; Rautama, E.L.; Kallio, T. Supervalent Doping and Its Effect on the Thermal, Structural and Electrochemical Properties of Li7La3Zr2O12 Solid Electrolytes. Mater. Adv. 2024, 5, 5260–5274. [Google Scholar] [CrossRef]
- Nguyen, M.H.; Park, S. Synergetic Effect of Li-Ion Concentration and Triple Doping on Ionic Conductivity of Li7La3Zr2O12 Solid Electrolyte. Nanomaterials 2022, 12, 2946. [Google Scholar] [CrossRef]
- Kohn, W.; Sham, L.J. Self-Consistent Equations Including Exchange and Correlation Effects. Phys. Rev. 1965, 140, A1133–A1138. [Google Scholar] [CrossRef]
- Perdew, J.P.; Ernzerhof, M.; Burke, K. Rationale for Mixing Exact Exchange with Density Functional Approximations. J. Chem. Phys. 1996, 105, 9982–9985. [Google Scholar] [CrossRef]
- Perdew, J.P.; Burke, K.; Ernzerhof, M. Generalized Gradient Approximation Made Simple. Phys. Rev. Lett. 1996, 77, 3865–3868, Erratum in Phys. Rev. Lett. 1997, 78, 1396. [Google Scholar] [CrossRef] [PubMed]
- Laidler, K.J. The Development of the Arrhenius Equation. J. Chem. Educ. 1984, 61, 494–498. [Google Scholar] [CrossRef]
- Laidler, K.J. A Glossary of Terms Used in Chemical Kinetics, Including Reaction Dynamics (IUPAC Recommendations 1996). Pure Appl. Chem. 1996, 68, 149–192. [Google Scholar] [CrossRef]
- Kresse, G.; Furthmüller, J. Efficient Iterative Schemes for Ab Initio Total-Energy Calculations Using a Plane-Wave Basis Set. Phys. Rev. B 1996, 54, 11169–11186. [Google Scholar] [CrossRef]
- Kresse, G.; Furthmüller, J. Efficiency of Ab-Initio Total Energy Calculations for Metals and Semiconductors Using a Plane-Wave Basis Set. Comput. Mater. Sci. 1996, 6, 15–50. [Google Scholar] [CrossRef]
- Blöchl, P.E. Projector Augmented-Wave Method. Phys. Rev. B 1994, 50, 17953–17979. [Google Scholar] [CrossRef] [PubMed]
- Cussen, E.J.; Yip, T.W.S.; O’Neill, G.; O’Callaghan, M.P. A Comparison of the Transport Properties of Lithium-Stuffed Garnets and the Conventional Phases Li3La3Zr2O12. J. Solid State Chem. 2011, 184, 1610–1617. [Google Scholar] [CrossRef]
- Chen, Y.; Rangasamy, E.; Liang, C.; An, K. Origin of High Li+ Conduction in Doped Li7La3Zr2O12 Garnets. Chem. Mater. 2015, 27, 5491–5497. [Google Scholar] [CrossRef]
- Nosé, S. A Molecular Dynamics Method for Simulations in the Canonical Ensemble. Mol. Phys. 2002, 100, 191–198. [Google Scholar] [CrossRef]
- Hoover, W.G. Canonical Dynamics: Equilibrium Phase-Space Distributions. Phys. Rev. A 1985, 31, 1695–1697. [Google Scholar] [CrossRef] [PubMed]
- Shao, C.; Liu, H.; Yu, Z.; Zheng, Z.; Sun, N.; Diao, C. Structure and Ionic Conductivity of Cubic Li7La3Zr2O12 Solid Electrolyte Prepared by Chemical Co-precipitation Method. Solid State Ion. 2016, 287, 13–16. [Google Scholar] [CrossRef]
- Il’Ina, E.A.; Andreev, O.L.; Antonov, B.D.; Batalov, N.N. Morphology and Transport Properties of the Solid Electrolyte Li7La3Zr2O12 Prepared by the Solid-State and Citrate–Nitrate Methods. J. Power Sources 2012, 201, 169–173. [Google Scholar] [CrossRef]
- Košir, J.; Mousavihashemi, S.; Wilson, B.P.; Rautama, E.L.; Kallio, T. Comparative Analysis on the Thermal, Structural, and Electrochemical Properties of Al-Doped Li7La3Zr2O12 Solid Electrolytes through Solid State and Sol-Gel Routes. Solid State Ionics 2022, 380, 115943. [Google Scholar] [CrossRef]
- Wu, J.F.; Chen, E.Y.; Yu, Y.; Liu, L.; Wu, Y.; Pang, W.K.; Guo, X. Gallium-Doped Li7La3Zr2O12 Garnet-Type Electrolytes with High Lithium-Ion Conductivity. ACS Appl. Mater. Interfaces 2017, 9, 1542–1552. [Google Scholar] [CrossRef]
- Xu, Z.; Hu, X.; Fu, B.; Khan, K.; Wu, J.; Li, T.; Wu, M. Co-Doping Strategy Enhanced the Ionic Conductivity and Excellent Lithium Stability of Garnet-Type Li7La3Zr2O12 Electrolyte in All Solid-State Lithium Batteries. J. Mater. 2023, 9, 651–660. [Google Scholar] [CrossRef]
- Meesala, Y.; Liao, Y.-K.; Jena, A.; Yang, N.-H.; Pang, W.K. An Efficient Multi-Doping Strategy to Enhance Li-Ion Conductivity in the Garnet-Type Solid Electrolyte Li7La3Zr2O12. J. Mater. Chem. A 2019, 7, 19204–19213. [Google Scholar] [CrossRef]
- Liu, D.; Hou, Y.; Bulin, C.; Zhao, R.; Zhang, B. Enhancing Ionic Conductivity of Garnet-Type Nb-Doped Li7La3Zr2O12 by Cerium Doping. J. Rare Earths 2023, 41, 754–762. [Google Scholar] [CrossRef]
- Shi, J.; Wu, X.; Chen, Y.; Zhang, Y.; Hou, X.; Lv, R.; Liu, J.; Jiang, M.; Huang, K.; Feng, S. Structure Factors Dictate the Ionic Conductivity and Chemical Stability for Cubic Garnet-Based Solid-State Electrolyte. Chin. Chem. Lett. 2024, 35, 1575–1582. [Google Scholar] [CrossRef]
- Tian, H.; Xu, B.; Qi, Y. Computational Study of Lithium Nucleation Tendency in Li7La3Zr2O12 (LLZO) and Rational Design of Interlayer Materials to Prevent Lithium Dendrites. J. Power Sources 2018, 396, 44–52. [Google Scholar] [CrossRef]
- Wang, J.X.; Sun, B.Z.; Li, M.; Wu, M.S.; Xu, B. Structural, Electronic, and Li-Ion Mobility Properties of Garnet-Type Li7La3Zr2O12 Surface: An Insight from First-Principles Calculations. Chin. Phys. B 2023, 32, 045201. [Google Scholar] [CrossRef]
- Shimakawa, K.; Aniya, M. Dynamics of Atomic Diffusion in Condensed Matter: Origin of the Meyer-Neldel Compensation Law. Monatsh. Chem. 2013, 144, 67–71. [Google Scholar] [CrossRef]
- Kraft, M.A.; Culver, S.P.; Calderon, M.; Böcher, F.; Krauskopf, T.; Senyshyn, A.; Dietrich, C.; Zevalkink, A.; Janek, J.; Zeier, W.G. Influence of Lattice Polarizability on the Ionic Conductivity in the Lithium Superionic Argyrodites Li6PS5X (X = Cl, Br, I). J. Am. Chem. Soc. 2017, 139, 10909–10918. [Google Scholar] [CrossRef] [PubMed]
- Van der Klerk, N.; van der Maas, E.; Wagemaker, M. Analysis of Diffusion in Solid-State Electrolytes through MD Simulations, Improvement of the Li-Ion Conductivity in β-Li3PS4 as an Example. ACS Appl. Energy Mater. 2018, 1, 3230–3242. [Google Scholar] [CrossRef] [PubMed]
- Shannon, R.D. Revised Effective Ionic Radii and Systematic Studies of Interatomic Distances in Halides and Chalcogenides. Acta Crystallogr. A 1976, 32, 751–767. [Google Scholar] [CrossRef]
- Feng, X.; Zhang, L.; Li, C.; Shen, M.; Zheng, R.; Wang, Z.; Liu, Y. Al–Ta Dual-Substituted Li7La3Zr2O12 Ceramic Electrolytes with Two-Step Sintering for Stable All-Solid-State Lithium Batteries. Ceram. Int. 2024, 50, 38999–39009. [Google Scholar] [CrossRef]
- Hu, Z.; Liu, H.; Ruan, H.; Hu, R.; Su, Y.; Zhang, L. High Li-Ion Conductivity of Al-Doped Li7La3Zr2O12 Synthesized by Solid-State Reaction. Ceram. Int. 2016, 42, 14268–14274. [Google Scholar] [CrossRef]
- Zhou, Y.; Li, X.; Yang, Y.; Huang, X.; Tian, B. Production of Ta-Doped Li7La3Zr2O12 Solid Electrolyte with High Critical Current Density. ACS Appl. Energy Mater. 2022, 5, 13817–13828. [Google Scholar] [CrossRef]
- Liu, B.; Yang, J.; Yang, H.; Ye, C.; Mao, Y.; Wang, J.; Zhang, W. Rationalizing the Interphase Stability of Li|Doped-Li7La3Zr2O12 via Automated Reaction Screening and Machine Learning. J. Mater. Chem. A 2019, 7, 19961–19969. [Google Scholar] [CrossRef]
- Mann, M.; Küpers, M.; Häuschen, G.; Finsterbusch, M.; Fattakhova-Rohlfing, D.; Guillon, O. Evaluation of Scalable Synthesis Methods for Aluminum-Substituted Li7La3Zr2O12 Solid Electrolytes. Materials 2021, 14, 6809. [Google Scholar] [CrossRef]
- Kim, M.; Kim, G.; Lee, H. Tri-Doping of Sol–Gel Synthesized Garnet-Type Oxide Solid-State Electrolyte. Micromachines 2021, 12, 134. [Google Scholar] [CrossRef]


| c-LLZO | t-LLZO | Al-LLZO | Ga-LLZO | Rb-LLZO | Ta-LLZO | |
|---|---|---|---|---|---|---|
| Ionic conductivity (S/cm) | 2.38 × 10⁻³ | 3.03 × 10⁻⁷ | 1.439 × 10⁻² | 3.73 × 10⁻³ | 3.32 × 10⁻³ | 7.12 × 10⁻³ |
| Activation energy (eV) | 0.227 | 0.496 | 0.138 | 0.197 | 0.212 | 0.191 |
| Experimental ionic conductivity (S/cm) and activation energy (eV) | 2 × 10⁻⁴ (0.25) [40] | 1.3 × 10⁻⁶ (--) * [41] | 4.96 × 10⁻⁴ (0.28) [42] | 1.46 × 10⁻³ (0.25) [43] | --* | --* |
| Al-LLZO | Ga-LLZO | Rb-LLZO | Ta-LLZO | |
|---|---|---|---|---|
| Formation energy (eV) | −0.56 | −0.47 | −0.43 | −0.51 |
| Electronic conductivity (S/cm) | 1.72 × 10⁻⁸ | 7.86 × 10⁻⁸ | 2.23 × 10⁻⁹ | 4.33 × 10⁻⁸ |
| Elements | Al3+ | Ga3+ | Li+ | Rb+ | La3+ | Ta5+ | Zr4+ |
|---|---|---|---|---|---|---|---|
| Ionic Radius (Å) | 0.54 | 0.62 | 0.76 | 1.52 | 1.06 | 0.79 | 0.72 |
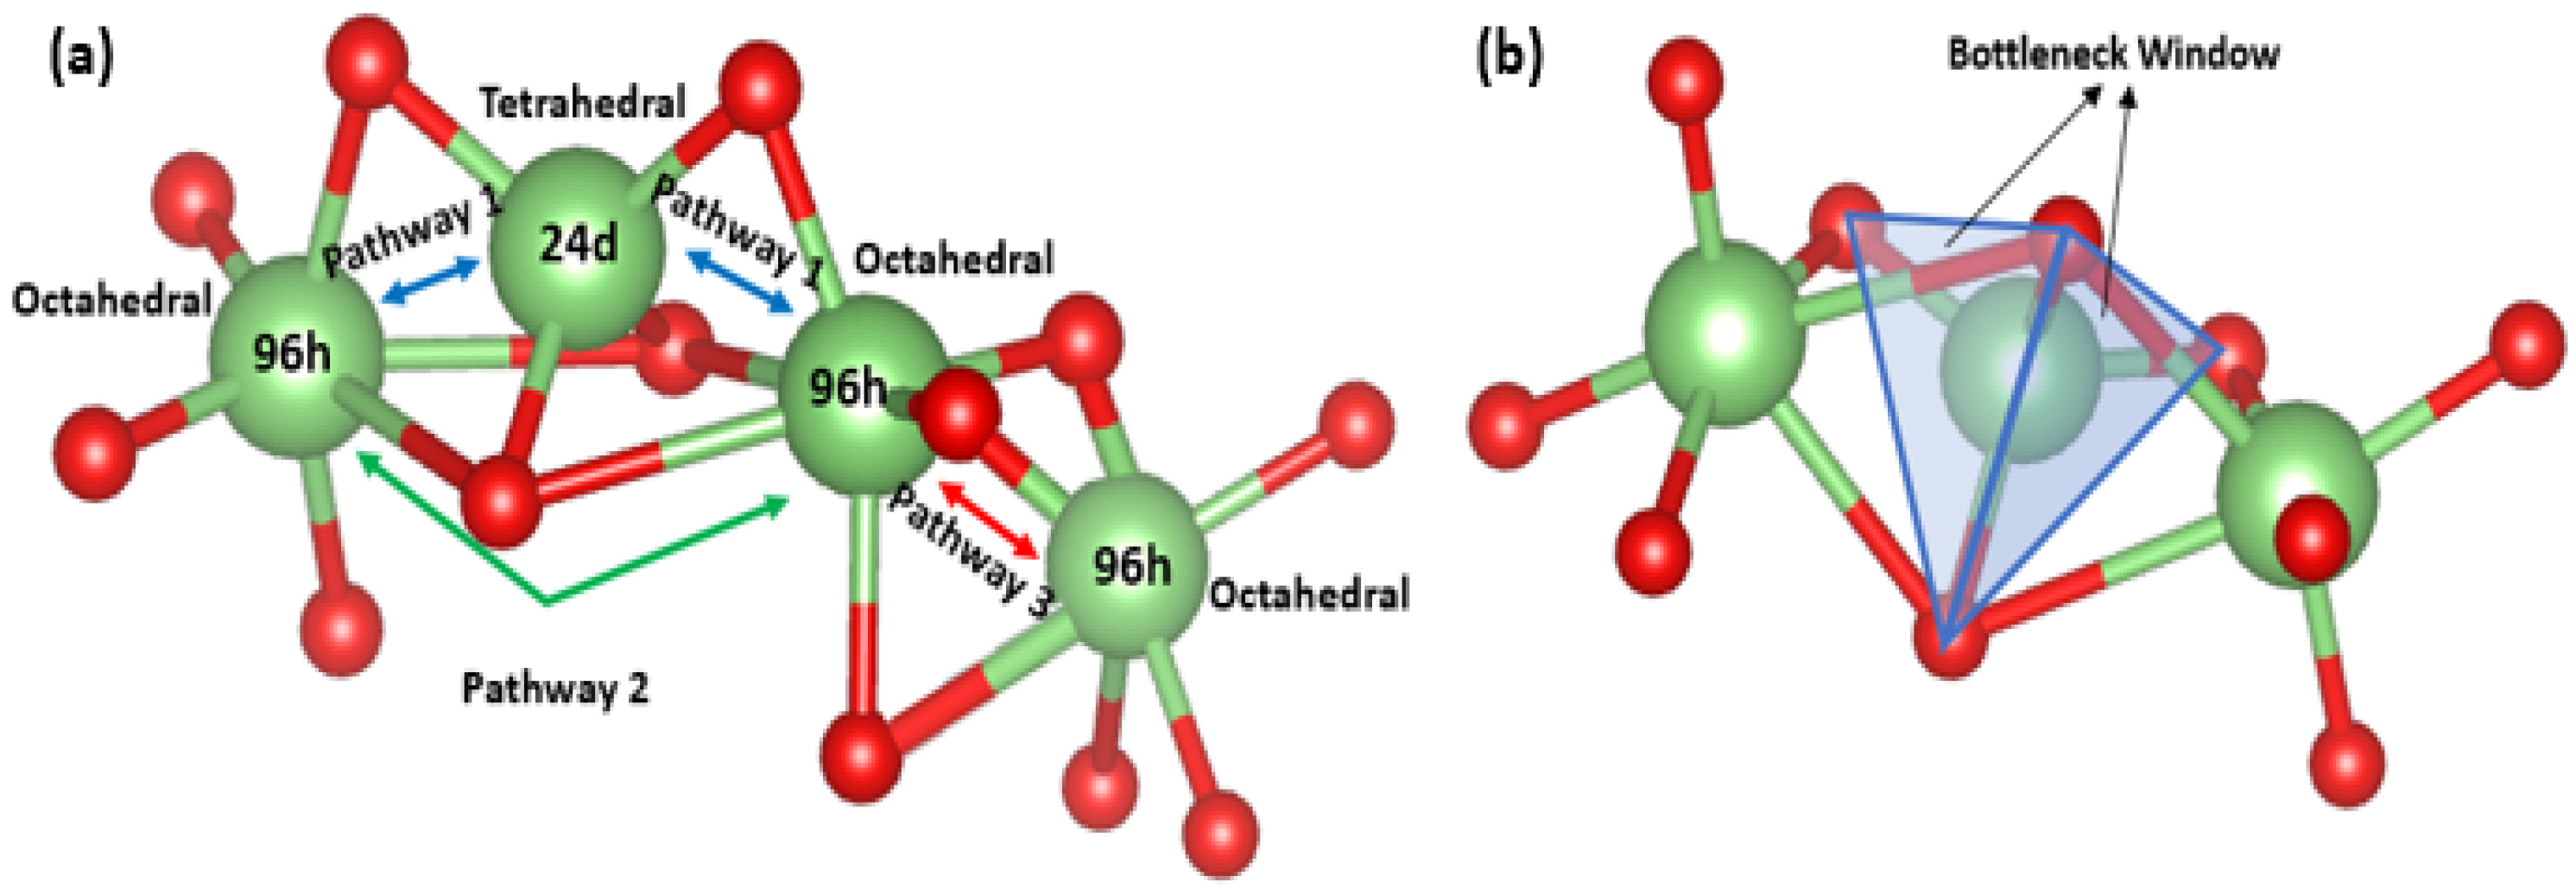
| Migration Pathway | Pathway 1 | Pathway 2 | Pathway 3 |
|---|---|---|---|
| Distance (Å) | ≈2.2 | ≈3.7 | ≈0.9 |
| Triangle Arm Length (Å) | c-LLZO | t-LLZO | Al-LLZO | Ga-LLZO | Rb-LLZO | Ta-LLZO |
|---|---|---|---|---|---|---|
| Side A | 3.11 | 3.12 | 3.08 | 3.20 | 3.12 | 3.10 |
| Side B | 3.046 | 3.09 | 3.10 | 3.15 | 3.20 | 2.96 |
| Side C | 3.17 | 3.26 | 2.88 | 2.96 | 2.96 | 3.10 |
| Average | 3.11 | 3.16 | 3.02 | 3.10 | 3.09 | 3.06 |
| c-LLZO | t-LLZO | Al-LLZO | Ga-LLZO | Rb-LLZO | Ta-LLZO | |
|---|---|---|---|---|---|---|
| Binding energy (eV) | −1107.46 | −1101.5746 | −1121.39 | −1110.29 | −1108.62 | −1113.64 |
Disclaimer/Publisher’s Note: The statements, opinions and data contained in all publications are solely those of the individual author(s) and contributor(s) and not of MDPI and/or the editor(s). MDPI and/or the editor(s) disclaim responsibility for any injury to people or property resulting from any ideas, methods, instructions or products referred to in the content. |
© 2025 by the authors. Licensee MDPI, Basel, Switzerland. This article is an open access article distributed under the terms and conditions of the Creative Commons Attribution (CC BY) license (https://creativecommons.org/licenses/by/4.0/).
Share and Cite
Raju, M.M.; Ding, Y.; Zhang, Q. Unraveling the Role of Aluminum in Boosting Lithium-Ionic Conductivity of LLZO. Electrochem 2025, 6, 29. https://doi.org/10.3390/electrochem6030029
Raju MM, Ding Y, Zhang Q. Unraveling the Role of Aluminum in Boosting Lithium-Ionic Conductivity of LLZO. Electrochem. 2025; 6(3):29. https://doi.org/10.3390/electrochem6030029
Chicago/Turabian StyleRaju, Md Mozammal, Yi Ding, and Qifeng Zhang. 2025. "Unraveling the Role of Aluminum in Boosting Lithium-Ionic Conductivity of LLZO" Electrochem 6, no. 3: 29. https://doi.org/10.3390/electrochem6030029
APA StyleRaju, M. M., Ding, Y., & Zhang, Q. (2025). Unraveling the Role of Aluminum in Boosting Lithium-Ionic Conductivity of LLZO. Electrochem, 6(3), 29. https://doi.org/10.3390/electrochem6030029