Article

Enhanced Performance of Sodium-Ion Battery Cathodes with Ti and V Co-Doped P2-Type Na0.67Fe0.5Mn0.5O2 Materials

by
Trapa Banik
1,
Indranil Bhattacharya
1,*,
Kirankumar Venkatesan Savunthari
2,
Sanjeev Mukerjee
2,
Webster Adepoju
1 and
Abiodun Olatunji
1
1
Department of Electrical and Computer Engineering, Tennessee Technological University, Cookeville, TN 38505, USA
2
Department of Chemistry and Chemical Biology, Northeastern University, Boston, MA 02115, USA
*
Author to whom correspondence should be addressed.
Electrochem 2024, 5(4), 437-454; https://doi.org/10.3390/electrochem5040029
Submission received: 26 August 2024 / Revised: 18 September 2024 / Accepted: 20 September 2024 / Published: 18 October 2024

Abstract

:
Manganese- and iron-rich P2-type N a 0.67 F e 0.5 M n 0.5 O 2   ( N F M ) has garnered significant interest as a promising cathode candidate due to the natural abundance of Fe and Mn along with a high redox couple of Fe3+/Fe4+ and Mn3+/Mn4+. Despite all these merits, NFM suffers from structural instability during cycling, arising from the destructive Jahn-Teller (JT) distortion effect of Mn3+/Mn4+ during charging and Fe4+/Fe3+ during discharging. In this research, a novel P2-type transition metal-oxide cathode Na0.67Fe0.5−2xMn0.5TixVxO2 was synthesized by doping a tiny fraction of two electrochemically inactive elements, Titanium (Ti) and Vanadium (V), into Mn-rich Na0.67Fe0.5Mn0.5O2 (NFM) that mitigated the JT effect substantially and ameliorated the stability of the SIB during cycling. These exhaustive structural and morphological comparisons provided insights into the effects of V and Ti doping on stabilizing surface structures, reducing Jahn Teller distortion, enhancing stability and capacity retention, and promoting the Na+ carrier transport mechanism. Moreover, the electrochemical analysis, such as the galvanostatic charge/discharge profile, validates the capacity improvement via Ti and V co-doping into NFM cathode. The initial discharge capacity of the 2% Ti/V-doped N a 0.67 F e 0.48 M n 0.5 T i 0.01 V 0.01 O 2   ( 2 N F M T V ) was found to be 187.12 mAh g−1 at a rate of 0.1 C, which was greater than the discharge capacity of 175.15 mAh g−1 observed for pure NFM ( N a 0.67 M n 0.5 F e 0.5 O 2 ) . In contrast, 2NFMTV exhibited a noteworthy capacity retention of 46.1% when evaluated for its original capacity after undergoing 150 cycles at a rate of 0.1 C. This research also established a structural doping approach as a feasible technique for advancing the progress of next-generation Sodium-ion Batteries.

1. Introduction

Demand for high-capacity, low-priced rechargeable batteries is increasing rapidly throughout the world as we enter an era of widespread electrification of transportation and a larger energy transition. It is anticipated that the demand for lithium will skyrocket by the year 2030, growing by a factor of 1500 [1]. While lithium-ion battery technology has advanced considerably, concerns persist about the abundance and cost of lithium to meet such expanded energy demand in the near future. To maintain such energy demand growth, sodium-ion battery (SIB) is emerging as an attractive substitute for the lithium-ion battery (LIB) due to the cost-efficiency, the seemingly inexhaustible nature of sodium, and the similar electrochemical and chemical properties of LIBs [2,3]. In spite of these benefits, many alterations in structure occur upon Na+ entry or removal because of the bigger ionic radius ( 1.02   ) and low energy density (<160 Wh kg−1) [4]. Research is ongoing to develop SIB as counterparts of LIB cathode materials such as transition metal oxides, polyanionic compounds, Prussian blue analogs, ferro cyanides, and organic compounds have all been the focus of research in recent years. The most promising cathode material based on discharge capacity for SIB is layered transition metal oxide (LTMO) with a composition of NaTMO2 (where TM = one or combination of several transition metal ions such as Mn, Fe, Mg, Ti, etc.) due to their higher theoretical capacity, and good conductivity as a result of smaller polarization and fast diffusion kinetics [5,6,7]. Two types of LTMO cathodes are available based on the preferred co-ordination environment of sodium ions (Prismatic and Octahedral sites) in between two consecutive TMO2 layers: O3-type and P2-type, as defined by Delmas based on the co-ordination position of Na-ion, while the associated number “2” or “3” describes the number of unique transition layers in a single crystal unit [6,7,8]. P2-type LTMO (NaxTMO2 where x 0.7 ) [9,10] facilitates large prismatic sites for Na-ion transport, which in turn enhances the diffusion and results in better electrochemical properties compared to O3-type materials [11]. Among various types of P2-type LTMO cathodes, P2- N a 0.67 M n 0.5 F e 0.5 O 2 is acknowledged as being an intriguing cathode for SIBs in light of its availability and inexpensive cost in raw materials, environmental benignity, and exceptional theoretical specific capacity (260 mAh g−1), while the O3-type N a M n 0.5 F e 0.5 O 2 delivers 110 mAh g−1 [12,13]. Regrettably, two big challenges are correlated to this material: high spin Mn3+-induced Jahn-Teller lattice distortions and phase transitions at high voltage during Na+(de)intercalation, for which the material’s cycling performance is often found to deteriorate [12,14,15].
Numerous techniques have been proposed by researchers such as coating, doping with electrochemically inactive metal ions, surface modification, etc. to resolve these issues in the case of Mn-rich layered oxides. Electrochemically active or inactive elements like Ni [16], Ti [13,17,18,19], Cu [20,21], Mo [21], V [22,23,24], Cr [24], Zr [25], and Al [26,27], among others, were often introduced into the TM layer to improve the structural stability. Sui et al. [22] adopted vanadium substitution strategy in N a 0.67 F e 0.5 M n 0.5 O 2 in order to elevate the cycle stability and rate capability. In order to modify the host layer, dopants are introduced into the transition metal (TM) sites or Li slabs. Ding et al. added Li ion into TMO2 layers and thus ameliorated the structural stability as well as increased the working voltage. This N a 0.6 L i 0.2 F e 0.2 M n 0.6 O 2 delivered a capacity of 167 mAh g−1 with a voltage window of 2 4.4   V with 78% capacity retention after 100 cycles [28]. Hwang et al. synthesized N a 0.6 N i 0.1 F e 0.1 M n 0.8 O 2 cathode by incorporating Ni and Fe into Mn sites and achieved a significantly high capacity of 221.5 mAh g−1 with 80% capacity retention after 500 cycles [15]. Park et al. did an extensive study on the effect of partial Ti doping into N a 0.67 F e 0.5 M n 0.5 O 2 that resulted in lowering the discharge capacity but improving the cycling stability [29]. Rojo and his peers proposed a Ti-doped N a 0.67 M n 0.8 F e 0.1 T i 0.1 O 2 which exhibited a remarkably extended cycling life, retaining 87% of its capacity after 300 cycles as the material exhibited a solid solution reaction instead of undergoing the expected P2–O2 phase transition throughout the charge and discharge process as per their research [18]. Shen et al. developed a nano-necklace type N a 0.6 C u 0.22 F e 0.3 M n 0.48 O 2 cathode structure that showed 125.4 mAh g−1 capacity at 0.1C and a 79% capacity retention after 300 cycles [12].
In this research, our main objective is to mitigate the stability issues arising from Jahn-Teller distortion in N a 0.67 F e 0.5 M n 0.5 O 2 (NFM), which occurs due to the high spin Mn3+. A co-doping strategy is adopted to synthesize the N a 0.67 F e 0.5 2 x M n 0.5 T i x V x O 2 (NFMTV), where the NFM is doped with electrochemically inactive elements Ti and V by substituting a fraction of Fe to reduce the Jahn-Teller distortion. Another reason to substitute Fe is the instability of Fe4+ in oxide-ion configuration in ambient atmospheric conditions [30]. From the literature review, it is evident that while doping with a single element, the modifications in redox chemistry are somewhat restricted, whereas an enhanced charge capacity, voltage stability, and total energy density can be achieved by creating a more tailored redox environment with dual dopants. This allows for the participation of diverse elements in redox processes. Because of these synergistic effects, battery performance may be optimized in ways that would be unattainable with single-element doping. Based on the studies from previous research, it is observed that titanium (Ti) helps stabilize the crystal structure for longer cycle life but it reduces the electronic and ionic conductivity to some extent. On the contrary, cathodes doped with vanadium (V) demonstrate promising results when operated at elevated voltages, leading to enhanced energy density and capacity retention, enabling them to function within a broader voltage range without experiencing rapid capacity degradation. By combining V and Ti together in NFM, it is apparent that the co-doped NFMTV would outperform the pristine NFM by improving conductivity, structural stability, and capacity retention.

2. Materials and Methods

The active materials were synthesized via a chelating agent-assisted sol-gel method. An extensive material and crystallographic analysis were conducted to examine the cathode material’s morphological and electrochemical behavior in depth. Scanning electron microscope (SEM) and electron dispersive spectroscopy (EDS) were employed in order to investigate the particle morphologies and elemental mapping distributions. Also, we studied the microstructure of the NFM crystal lattice in depth using X-ray diffraction (XRD), and then the Rietveld refinement technique was deployed to understand thoroughly how the doping helps increase the d-spacing for the facile transportation of Na-ion. Furthermore, in order to get a better understanding of whether the doping alters the oxidation state of the elements in NFM using X-ray photoelectron spectroscopy (XPS), Fourier transform infrared spectroscopy (FTIR) and Raman spectroscopy analysis were performed. After the battery assembly process, the electrochemical impedance spectroscopy (EIS), cyclic voltammetry, and galvanostatic charge/discharge profile followed by rate capability were executed to analyze the battery behavior.

2.1. Material Synthesis

The N a 0.6 M n 0.5 F e 0.5 2 x T i x V x O 2 compounds were synthesized through a chelating agent-based sol-gel process by mixing Sodium acetate [ C H 3 C O O N a ] (99+%, Sigma-Aldrich, USA), Manganese (II) acetate tetra-hydrate [ ( C H 3 C O O ) 2 M n ] (99+%, Sigma-Aldrich, USA), Iron (III) nitrate nonahydrate F e N O 3 3 . 9 H 2 O (98+%, Alfa Aesar, USA), and doping sources Titanium (IV) oxide [ T i O 2 ] (99.0%, Alfa Aesar), and Vanadium (V) Oxide [ V 2 O 5 ] (99.6%, Sigma-Aldrich), as starting material with the atomic molecular ratio of 0.6:0.5:0.5−x:x. All of the precursors were analytical grade, and hence, no further treatment was required. 10% C H 3 C O O N a was added in excess to compensate for sodium loss during high-temperature synthesis. All the precursors were dissolved into the deionized water one by one and stirred with a magnetic stirrer for about 1.5 h. Citric acid [ C 6 H 8 O 7 ] (99+%, Alfa Aesar), was added to the solution as a chelating agent in a molar ratio of 1:1, and then the whole mixture was continuously stirred overnight at 80 °C to form a gel-like substance. The gel was dried in a vacuum oven at 100 °C overnight which resulted in a porous structured material. The dried material was ground uniformly (mortar and pastel) and kept for the first sintering process in a quartz tube furnace for 5 h at 400 °C so that all the nitrates and acetates were evaporated. The sintered material was then ground again and sent for the second sintering process at 880 °C for 15 h at the tubular furnace, which, in turn, formed the desired cathode materials. After the sintering process, the material was ground again into a fine powder and transferred immediately to an argon-filled glovebox to avoid oxidation. The materials were labeled as NFM for the pure N a 0.6 M n 0.5 F e 0.5 O 2 , and for the N a 0.6 M n 0.5 F e 0.5 2 x T i x V x O 2 samples with 1, 2, 3, 5, and 10 mol % ( T i + V ) doping were named as 1NFMTV, 2NFMTV, 3NFMTV, 5NFMTV, and 10NFMTV, respectively.

2.2. Material Characterization

The surface morphology and distribution of elements of the microstructures were observed by an Ultra-High-Resolution Schottky Scanning Electron Microscope SU7000, USA (2 kV). The EDS was performed using the Octane Elect EDS System, an enhanced platform with the latest advancements in Silicon Drift Detector (SDD) technology, and the APEX™ software program was performed for the collection and analysis of (EDS) data and the compositional characterization of material. Rigaku Ultima IV diffractometer, USA with D/tex Ultra-High-Speed Detector and Panalytical powder diffractometers with Cu Kα radiation were employed to perform powder-XRD in order to detect the crystalline structure of synthesized powder. The XRD was performed over 2θ range from 10° to 80°, with a scan speed of 5°/min with Cu Kα radiation (λ = 1.5406 nm) and a power setting of 40 kV, 40 mA. The Rietveld Refinement was executed using PDXL software which is implemented to refine the unit crystal lattice parameter along with occupancy and bond length. The XPS analysis was performed on Thermo Scientific Nexsa G2, a monochromatic, micro-focused, low-power Al K-Alpha, built upon the high-performance XPS capabilities of the K-Alpha, with an X-Ray Spot Size of 10 to 400 μm.

2.3. Electrochemical Characterization

The electrochemical test was executed after the CR2032 coin cell battery was assembled in the glovebox ( H 2 O ,   O 2 < 0.1 ppm). The coin-type half cells (CR2032) [20 mm diameter, 3.2 mm thickness] were prepared in a glovebox by assembling 0.04 cm thick cold-rolled circular sodium discs (Sodium ingot, 99.8%, Alfa Aesar) as a reference electrode, with two glass micro-fiber films (Whatman, diameter 47mm) as a separator. The slurries for electrode coating were prepared by dissolving the as-prepared active material, conductive carbon black (Super C65, Alfa Aesar), and PVDF binder (polyvinylidene fluoride, Alfa Aesar) in N-methyl-2-pyrrolidone [ C 5 H 9 N O ] (NMP, Alfa Aesar) in a weight proportion of 80:10:10. The slurries were dispersed uniformly on aluminum foil with the doctor’s blade (the adjustable doctor blade gap was set at 60 µm and the casting speed was 0.2 m/min). The coated foil was kept in exposure to infrared light until it dried up and then it was kept in the oven at 100 °C overnight to dry and remove the volatile solvent. Then, the dried electrodes were punched into circular discs of the desired size with a diameter of 12.5 mm (0.5″), and the deposit of the active material was around 3.82 mg cm−2. After drying at 120 °C for 12 h in a vacuum, the cathode disks were kept in an argon-filled glovebox ( H 2 O , O 2 < 0.1 ppm).
The electrolyte was prepared by dissolving 1 M Sodium hexafluorophosphate [NaPF6] (98%, Sigma-Aldrich) into propylene carbonate [C4H6O3] (PC, 99%, Sigma-Aldrich) with an additive Fluoroethylene carbonate [C3H3FO3] (FEC, 98%, Alfa Aesar, USA). Galvanostatic charge/discharge tests (1 C = 260 mAh g−1) were carried out using an ARBIN battery tester with a voltage window of 1.5−4.3V (vs Na+/Na) at room temperature. Cyclic voltammetry (CV) of the samples was carried out using a Gamry instrument between 1.5 and 4.5 V at a scan rate of 0.1 mVs−1. The electrochemical impedance spectroscopy (EIS) measurement was conducted with Gamry using the frequency range of 10 kHz to 10 mHz with 5 mV amplitude.

3. Results

3.1. Physicochemical Analysis

3.1.1. XRD and Rietveld Refinement Analysis

In order to illustrate the effect of doping atoms in the crystalline structure, the powder XRD patterns were compared for 1 mol%–10 mol% Ti/V-doped N a F e M n O 2 samples (i.e., 1NFMTV, 2NFMTV, 3NFMTV, 5NFMTV, 10NFMTV) to pure N a F e M n O 2   ( P u r e   N F M ) . The unit lattice cell structure and its parameters usually govern the overall electrochemical property of a material, as the structure has to encounter structure deformation during ion insertion. Figure 1a and Figure 2a–d demonstrate the comparative XRD patterns of Na0.67Fe0.5−2xMn0.5TixVxO2 (x = 0~0.1). Figure 1b shows the crystal lattice model of the layered structure using the refined data.
The crystal structure of the samples was characterized by X-ray diffraction (XRD, Cu Kα), in the 2θ range of 10°–80°. The predominant diffraction peaks of all the doped NFMTV samples are indexed to a well-defined layered hexagonal structure of NFM with the P63/mmc space group (No.194) with a P2-type (ABBA type stacking) layered structure. Sodium ions are situated in the prismatic sites, which share faces and edges with the TMO6 octahedra. All the samples are matched with the phase of NaFeMnO2 (a = 2.9441, c = 11.1881).
As shown in Figure 1a, the comparative XRD analysis showed that the insertion of Ti-V into NFM does not affect the directional growth of the crystals (crystalline symmetry), the relative position of the peaks was preserved and the peaks of all the samples were very sharp, indicating a high degree of crystallinity in the structure [31]. A strong peak for the crystallographic plane [002] was found in the case of both pristine NFM and doped NFMTV samples, suggesting that the crystallites are highly oriented with their c-axis perpendicular to the substrate plane [32]. This may be attributed to the fact that both V and Ti have been calcinated into the lattice structure rather than enfolding the surface as a coating layer, which is further intensified in the FESEM results. The sharp and intense peaks at 15.65°, 31.62°, 35.45°, 38.97°, 43.02°, 48.22°, 61.27°, and 63.65° were representative of the (002), (004), (100), (102), (103), (104), (106), and (110) diffraction planes, respectively. Specifically, the (002) peak of NFMTV shifted slightly toward the lower-angle region (inset of Figure 1a) as a result of the introduction of V5+ and Ti4+ ions into the tetragonal lattice space occupied by transition metal oxide ions. This indicates an expansion along the c-axis caused by the increase in coulombic repulsion between neighboring O layers in the sandwiched TMO2 slabs, which, in turn, expands the Na layer spacing and, thus, improves the sodium diffusion kinetics. However, it’s noticed that there was a reduction in the intensities of the peaks, especially that of the [002] direction, which might be due to a decrease in the quantity of Fe in the doped samples. No additional significant diffraction peaks in the XRD patterns of V- and Ti-doped NFM spectra were visible even when the Ti-V doping contents increased to 5%, which justifies that no extra phase was generated with the Ti-V doping [21]. As seen in the XRD pattern, the small peaks around 14° and 33° are due to the presence of oxides formed by Ti and V.
In order to dig deeper into the impact of Ti and V doping on the structure of NFM, Rietveld refinement was performed on the XRD data, as displayed in Figure 1b and Figure 2a–d. The refined parameters from the Rietveld refinement exhibited how the lattice parameters a, c, and d002 changed with different types and quantities of doping elements. The lattice parameter d002 stands for the interlayer distance corresponding to (002) peak. The calculated results align well with the observed values curves, and the low values of R w p and R p (<10) confirm the accuracy of the computation [33].
From Table 1 and Tables S1–S5 data, it is seen that the parameter (a) becomes larger with the increase in doping content, whereas lattice parameter (c) increases gradually with increased doping content up to 2%, then decreases with further amount of doping due to the substitution of iron by titanium and vanadium. The reason behind this is the oxidation state of iron in the crystal structure is +3, with the ionic radius of Fe3+ being around 0.654 Å. Manganese, on the other hand, is anticipated to contain both Mn3+ (0.645 Å) and Mn4+ (0.530 Å) ions in the P2-type Na0.67Fe0.5Mn0.5O2. As the smaller Ti4+ (0.605 Å) and V5+ (0.54 Å) are replacing Fe3+ (0.63 Å), the (a) parameter is increasing [22,24,25]. Furthermore, the bond dissociation energy of Ti-O (ΔHf298K = 662 kJ mol−1) and V-O (ΔHf298K = 644 kJ mol−1) is much stronger than that of Mn-O (ΔHf298K = 402 kJ mol−1) and Fe-O (ΔHf298K = 409 kJ mol−1), which eventually suppresses the release of oxygen, resulting in reduction of the irreversible capacity loss [34]. The stronger bond effect can be visualized from the Rietveld analysis as the (c) parameter is increased. The migration of Na+ ion is associated with the value of the c-axis and the increase of the c-axis, which corresponds to a larger d-spacing, implying an expanded path for Na+ ion transport [26]. Thus, this phenomenon can be interpreted as an overall volume shrinkage of lattice unit in the narrowing of the NFMTV lattice in one of the two principal directions and expansion in the other direction in the interval (0~1%), in accordance with Vegard’s law. The volume of the unit cell in each case of NFMTV samples, with the exception of 2NFMTV, exhibits an increase when compared to that of the pristine NFM. The observed phenomenon may be attributed to the effects of variations in Mn3+ and Mn4+ quantity in the doped NFMTV, resulting from the replacement of iron atoms with different amounts of titanium and vanadium atoms in the NFM lattice, which we can see in the other analysis as well [27]. Additionally, compared to pure NFM, the c/a ratio of NFMTV with any amount of doping is higher, indicating a more stable layer structure. The d-spacing also follows the same pattern with the increase in doping contents, first increasing gradually for low doping (≤2%), and then decreasing gradually for high doping contents (≥2%). The expanded d-spacing is equivalent to the thickness of the Na ion diffusion layer since the (002) peak is related to the layer-to-layer distance between two adjacent TMO6 layers. The expanded d-spacing signifies that the Na+ diffusion barrier has been reduced which will improve the rate capability. Based on the overall d-space expansion and shrinkage in unit volume in the case of 2NFMTV compared to both bare NFM and doped NFMTV samples, it can be presumed that 2NFMTV will be most favorable for fast Na+-ion diffusion, resulting in the enhancement of rate capability and cycling stability. The determination of the TMO2 slab thickness, inter-slab thickness (d-spacing), and bond lengths was conducted using the Rietveld refinement technique, as shown in Table 1. The length of the Na-O bond shows an increase till 2% doping and then decreases when Ti and V are introduced as dopants. This change makes Na ion intercalation/extraction simpler, as the extended Na-O bond length decreases electrostatic attraction between Na and O. Besides, the TM-O bond length becomes reduced for 2% Ti-V and then remains unchanged. This helps in achieving better stability of the layered structure due to the stronger bonding energy facilitated by the contraction of the TM-O bonds. The overall cyclic performance was improved due to the compression of the TMO2 layers and expansion of the d-spacing.

3.1.2. SEM and EDS Analysis

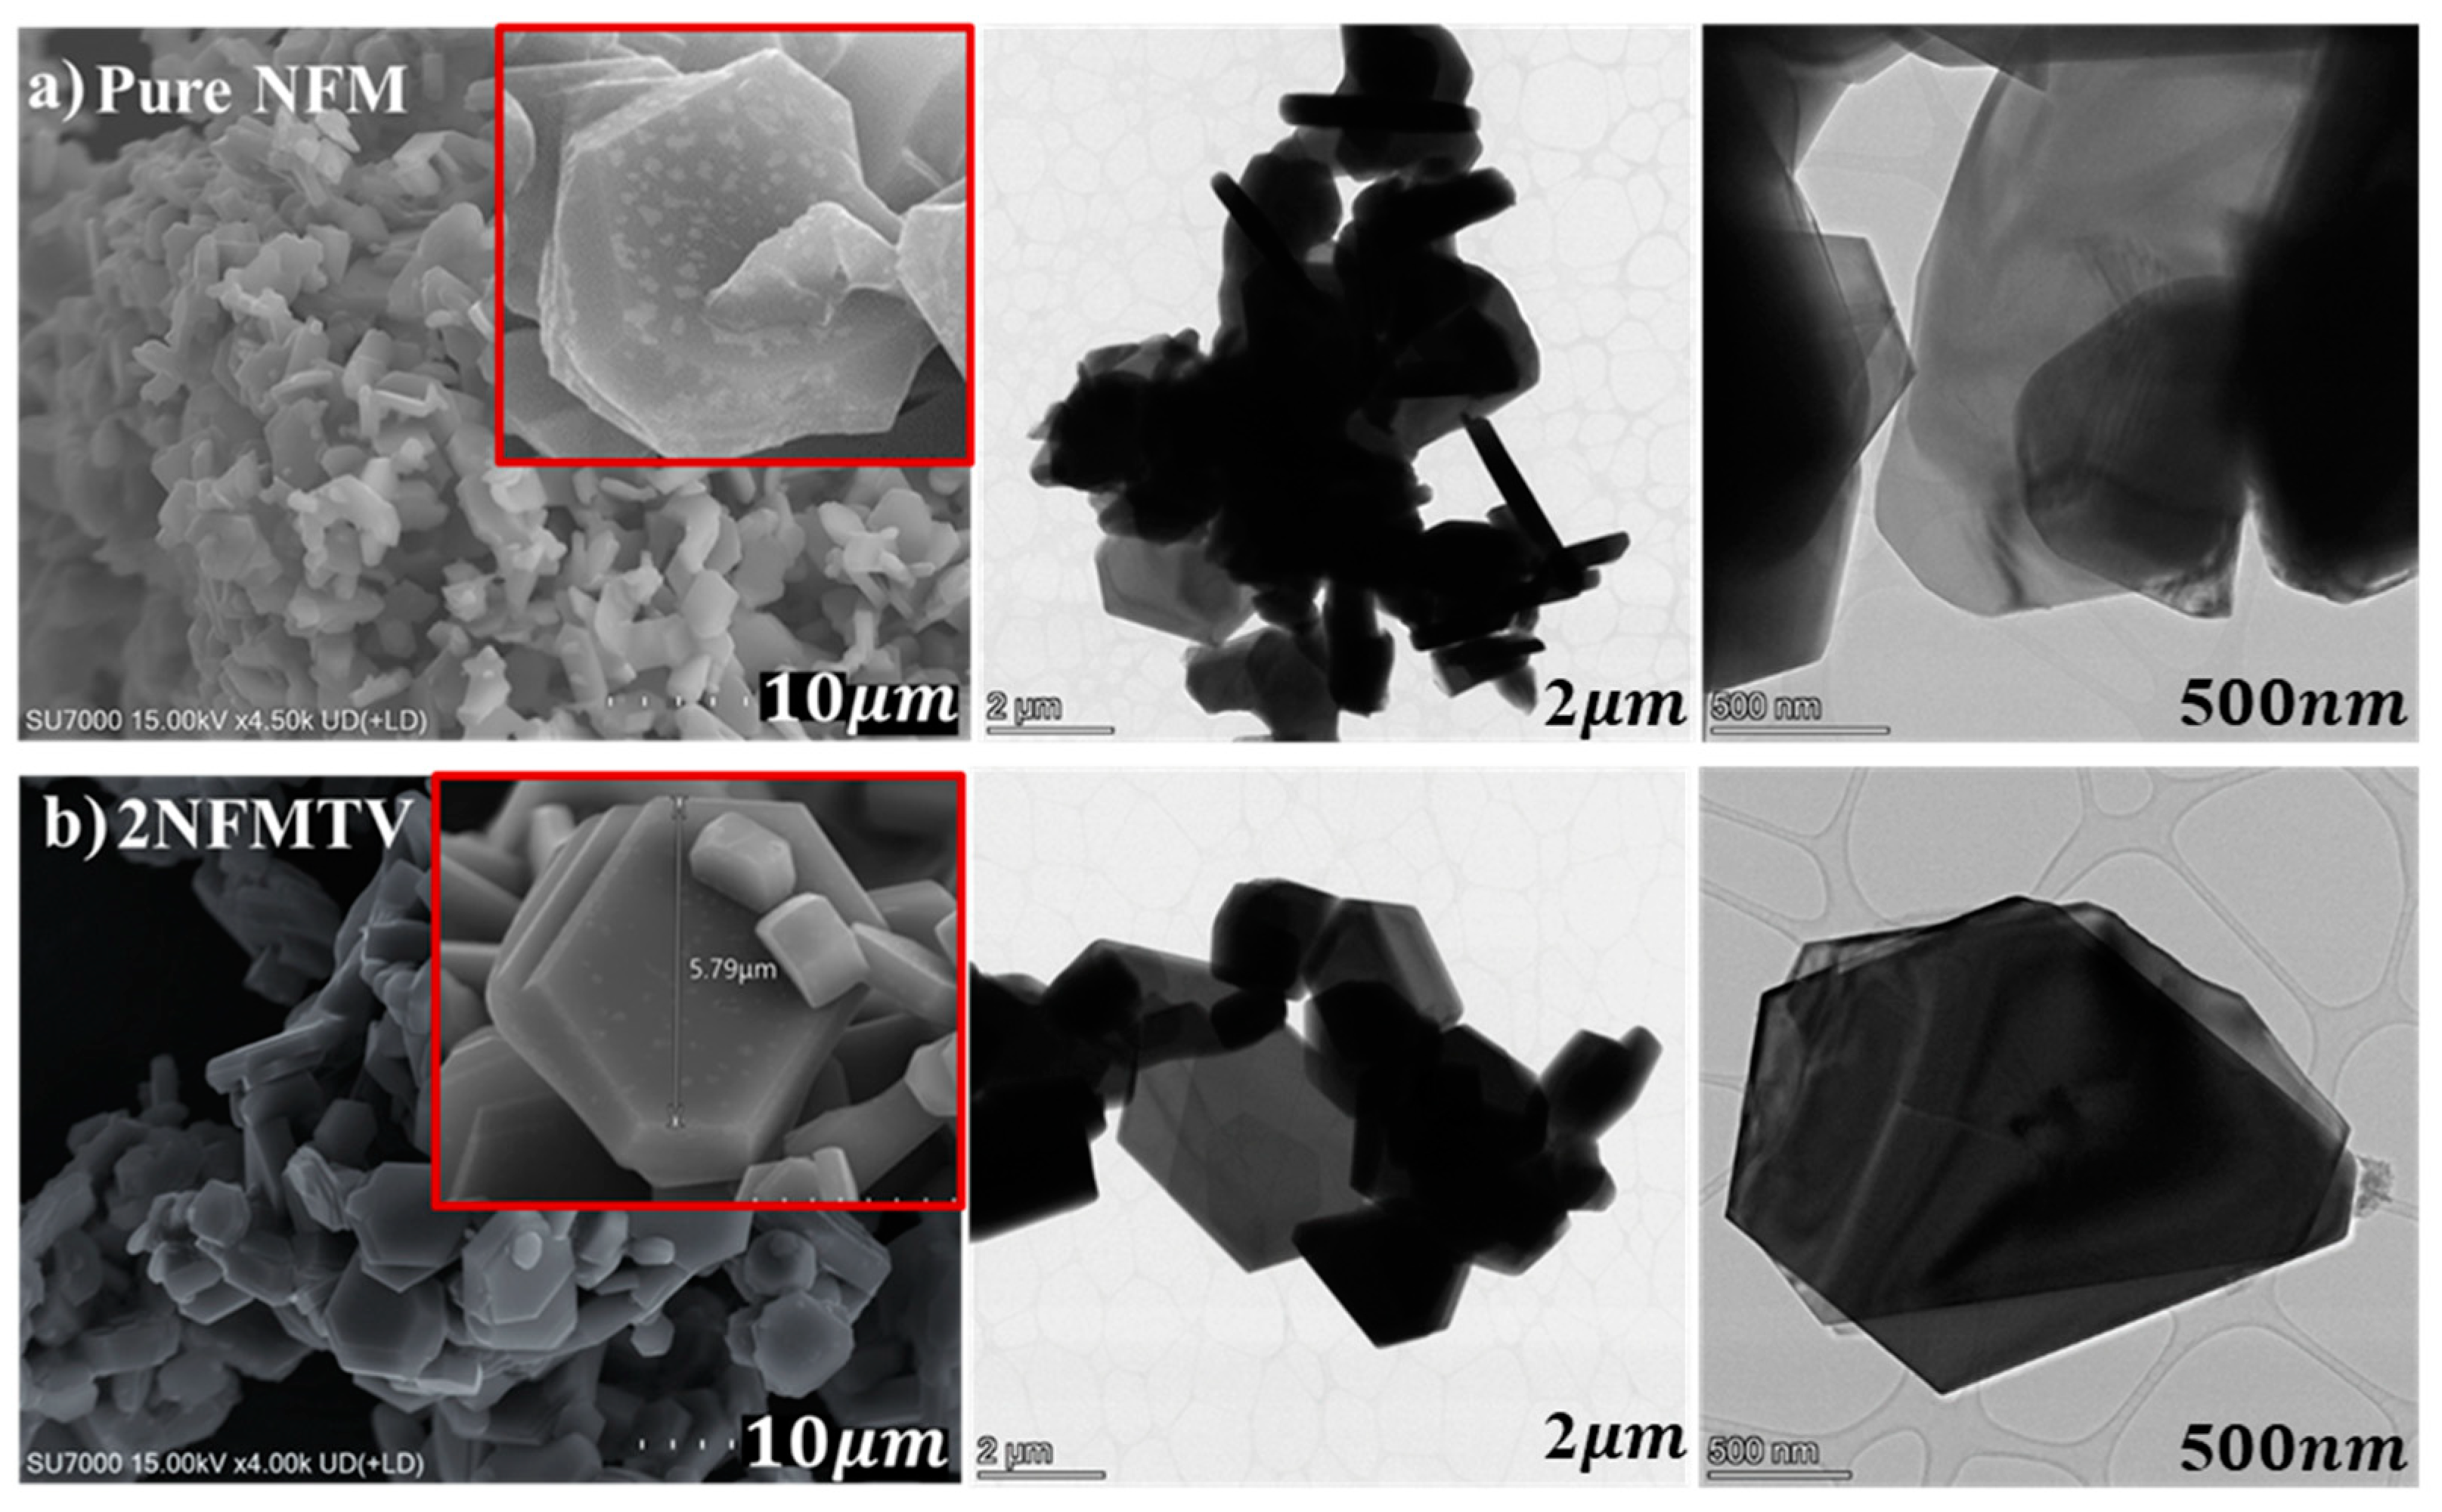
SEM and TEM were executed to characterize the particle size and surface morphologies of Ti and V-doped NFM samples. A similar hexagon structure and morphology of pristine NFM were observed for V- and Ti-doped NFM, irrespective of doping content, which indicates that the Ti and V doping didn’t alter the crystal structure. From the SEM figures of N a 0.6 M n 0.5 F e 0.5 2 x V x T i x O 2 (x = 0.00, 0.005, 0.01, 0.015, 0.025, 0.05) with different amounts of Ti and V doping, it was observed that the primary particles were in sub-micron scaled pure hexagon structure (1~6 µm), and self-assembled to form secondary particles with a granular shape, sized of 40~50 µm, as shown in Figure 3 and Figure S1. The sub-micron level framework of the cathode material accommodated the expansion and contraction of volume due to the insertion/extraction of Na-ion into or from the lattice for faster stress relaxation during the charge/discharge process [34,35,36,37]. Furthermore, there was no obvious difference in the surface state, which possibly suggests that Ti and V have been doped well into the crystal structure. The primary particles became smaller in size and more compact in proportion to the increased ratio of V- and Ti-doping suggesting a reduction in the crystal structure. Thus, it is postulated that the co-doping will enhance the electrochemical performance of the electrode by decreasing the route for Na-ion diffusion. The transmission electron microscopy (TEM) image, as shown in Figure 3a,b, also provides further evidence that the 2NFMTV particle has a more distinct hexagonal shape than that of pure NFM.
Another significant finding is that the primary particles of the NFMTV materials gradually become more hexagonal compared to pure NFM structure when the doping was increased stepwise, as seen from SEM and TEM in Figure 1 and Figure S1, which is an indication of less JT-prone Mn3+ ion present in the doped NFMTV [38]. At a higher enlargement, in Figure 3, it was evident that the doped primary particle had a more pronounced hexagonal structure than that of the pure NFM, which improved morphological characteristics.
Energy dispersive spectra (EDS) were implemented to further confirm the efficacy of doping and to quantify the distribution of elements. The EDS analysis was the clear conjecture of the presence and distribution pattern of doped vanadium and titanium in the NFMTV.
The cross-section EDS mapping results, as shown in Figure 2 and Figures S2–S5 verified the even distributions of Ti and V in NFM. From the EDX elemental mapping images as well as in the quantitative values as shown in Figure 4a,b, it was seen that all the elements—Mn, Fe, Ti, V, and O were evenly dispersed homogeneously throughout the surface of the samples, validating Ti and V are doped well into the crystal structure. The mapping signal from Ti and V was less intense due to having relatively low contents compared with that of Fe and Mn [39].

3.1.3. XPS Analysis

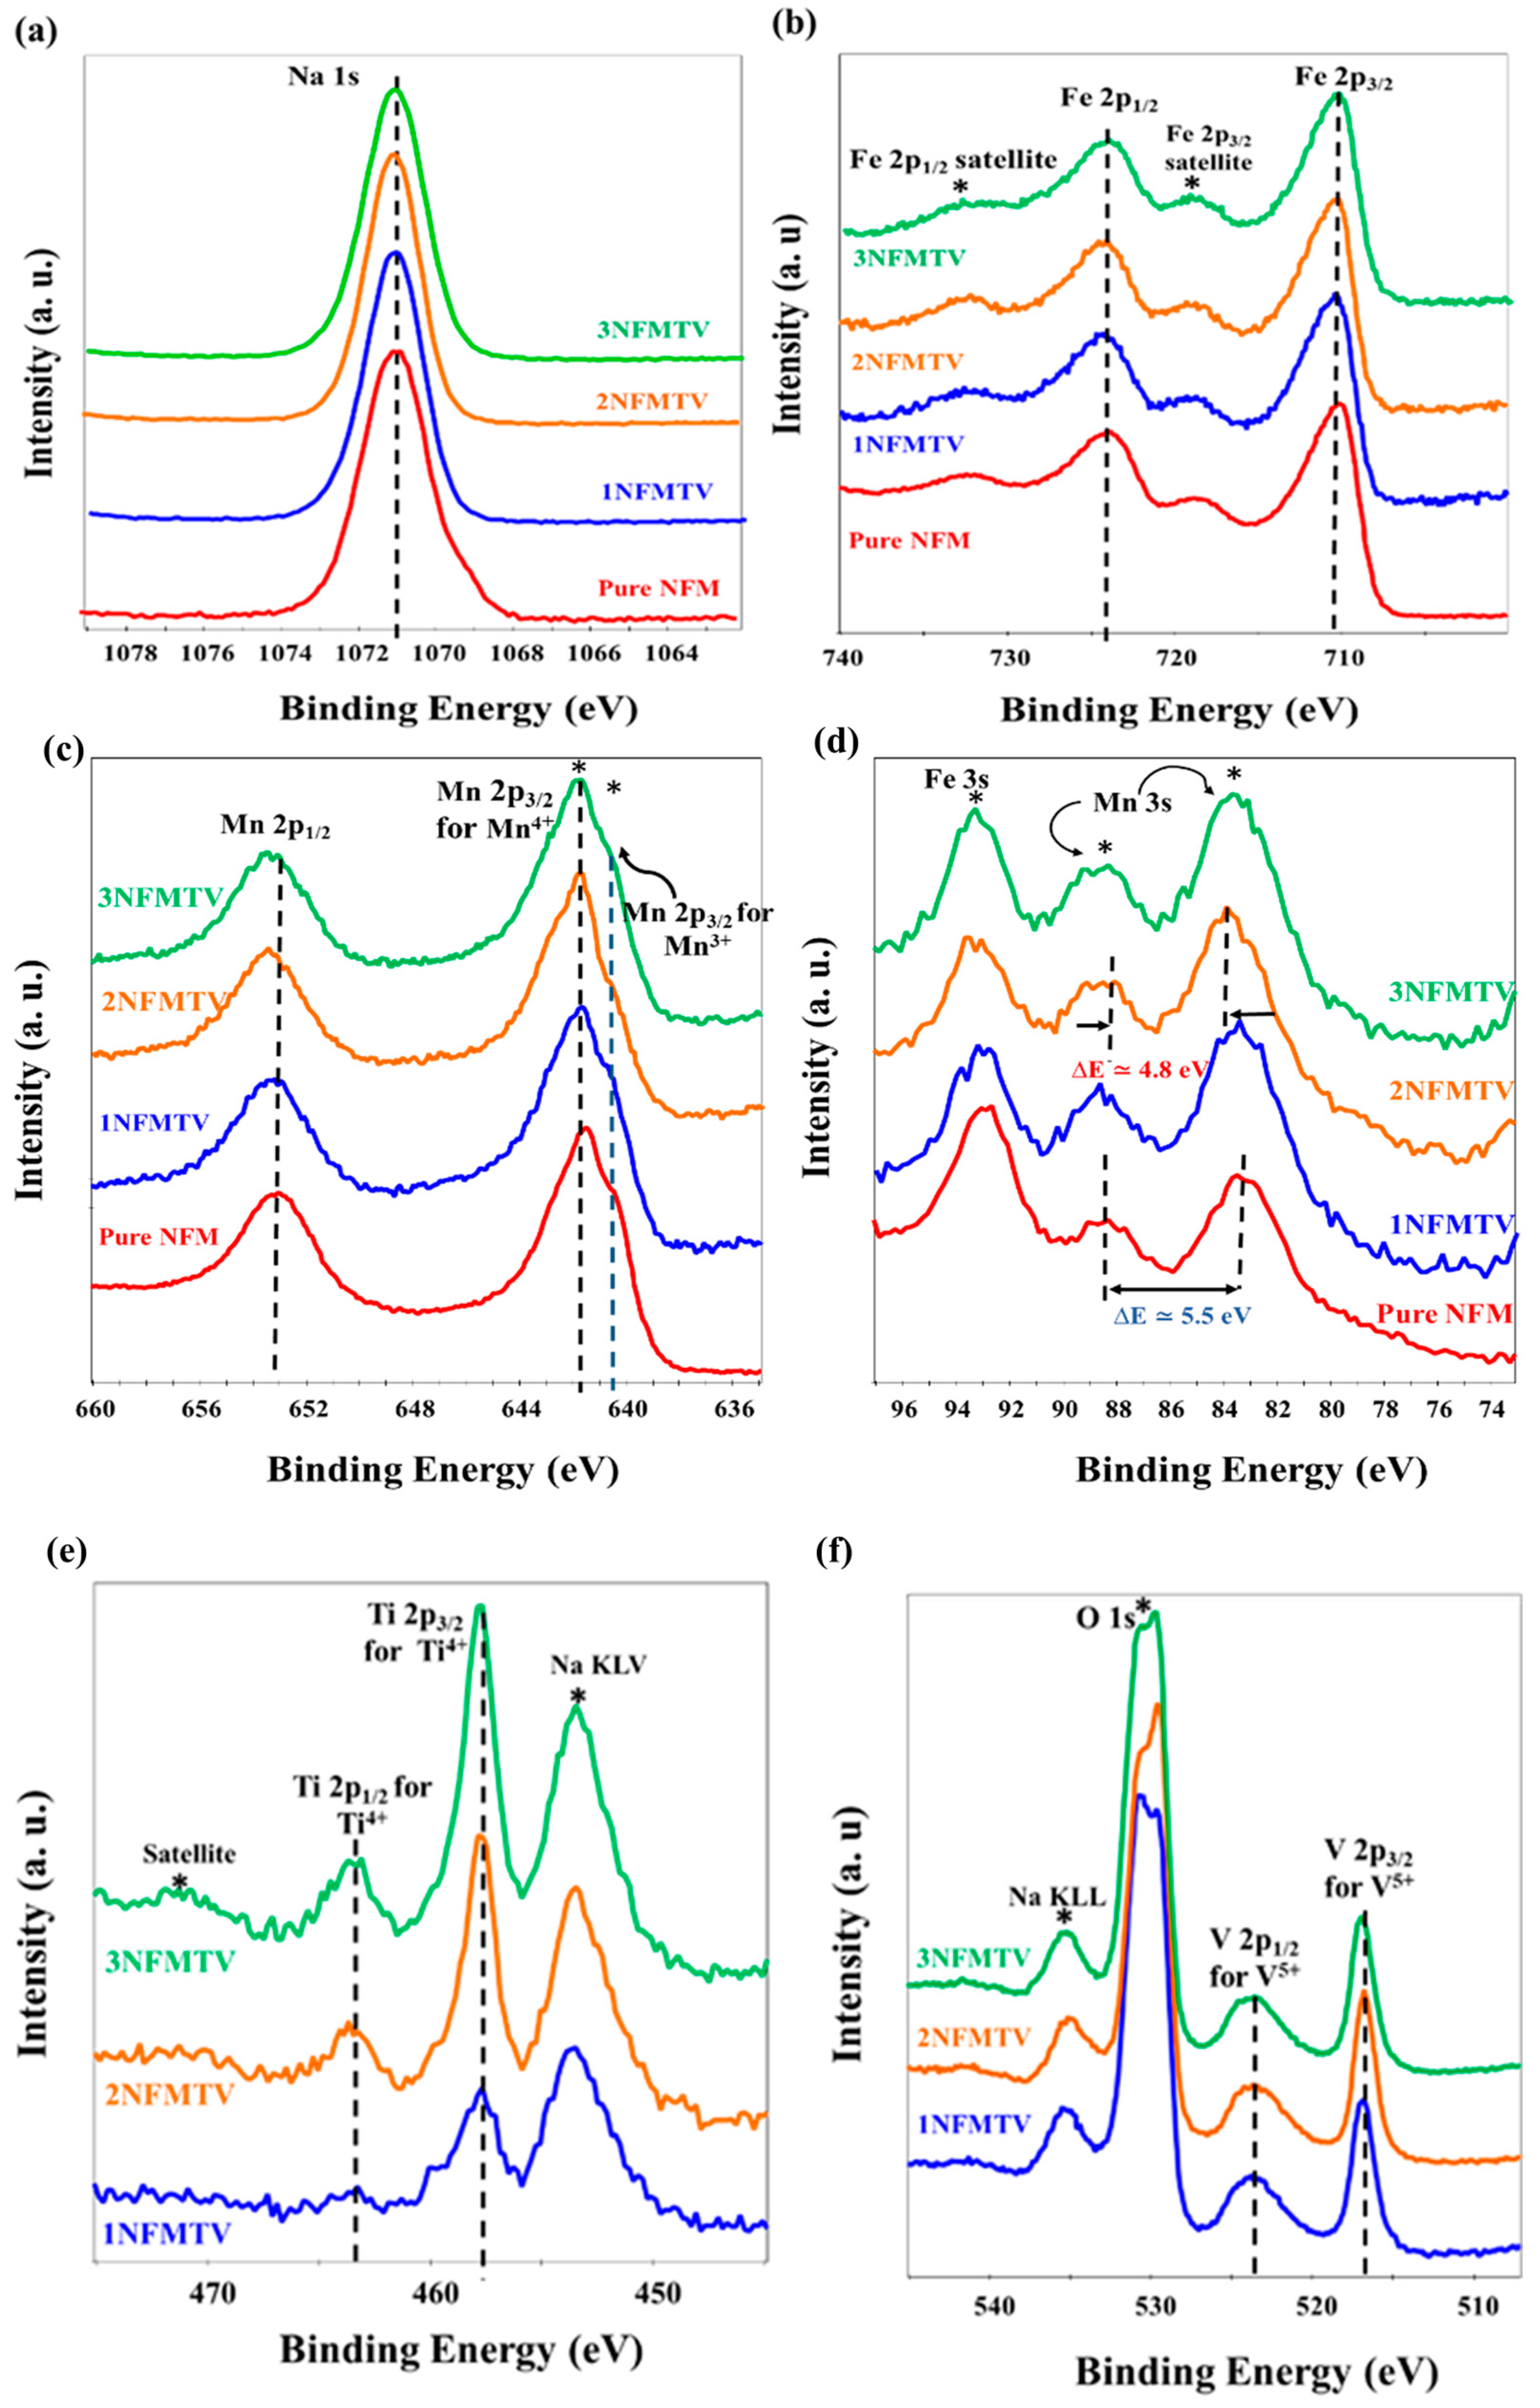
To demonstrate and validate how doping with Ti and V will help to reduce Jahn-Teller-prone Mn3+, XPS analysis was performed after synthesizing the material as presented in Figure 5 and Figures S6–S9. The XPS analysis is to characterize the surface chemical status of the materials and to analyze the changes in valence state and chemical composition. As seen in Figure 5e, the main peaks of Ti 2p spectra were located at around 458.5 eV ( 2 p 3 / 2 ), and ( 2 p 1 / 2 ) is 464.2 eV, which is the characteristic of Ti4+. Also, the positions of both the peak Ti 2 p 3 / 2 and 2 p 1 / 2 were the same in all doped NFMTV samples, although the peak intensity increases proportionately with the doping amount. The binding energy values of V 2 p 1 / 2 and V 2 p 3 / 2 were detected at 524.5 eV and 517.2 eV in Figure 5f, which implies that the valance of vanadium was already in the high oxidation state of V5+. No change in the peaks of Ti and V dictated that both Ti and V were electrochemically inactive. From the Na peak, it was observed that the Na 1s spectra of all the samples showed no variation in the peak shape in NFM-TV, which suggested the Na environment might be identical to that in pure NFM. The Fe 2p peak, as shown in Figure 5b, deconvoluted to two main peaks: Fe 2 p 3 / 2 at 710.6 and Fe 2 p 1 / 2 at 724.1 eV, corresponding to the Fe3+ state. Moreover, there was no shift in Fe 2p peaks after V and Ti doping, indicating that V and Ti doping did not affect the valence state of Fe (III). The XPS spectra of Mn 2p3/2 in the pure NFM in Figure 5c exhibited the existence of different oxidation states of Mn, such as Mn (III) and Mn (IV), corresponding to ≈641.5 eV and ≈642.7 eV that coexisted with a small difference in binding energy. Moreover, the Mn 3s peaks were clearly formed of two wide peaks centered at around 84.5 eV and 89.5 eV, which were mostly caused by the coupling effect of nonionized 3s electrons with 3d valence band electrons [26,40]. The energy gap between these two split Mn 3s peaks ( E 3 s ) gave quantitative insight regarding the Mn3+/Mn4+ ratio that was due to the parallel spin coupling of electrons in the 3s and 3d orbitals during photoelectron discharge. The peak splitting of the Mn 3s peak was altered from 5.5 eV on the pristine sample to 4.8 eV on the 2% Ti/V-doped NFM sample, as displayed in Figure 5d, suggesting the Mn oxidation state goes from +4 to +3 [41].

3.1.4. Raman and FTIR Analysis

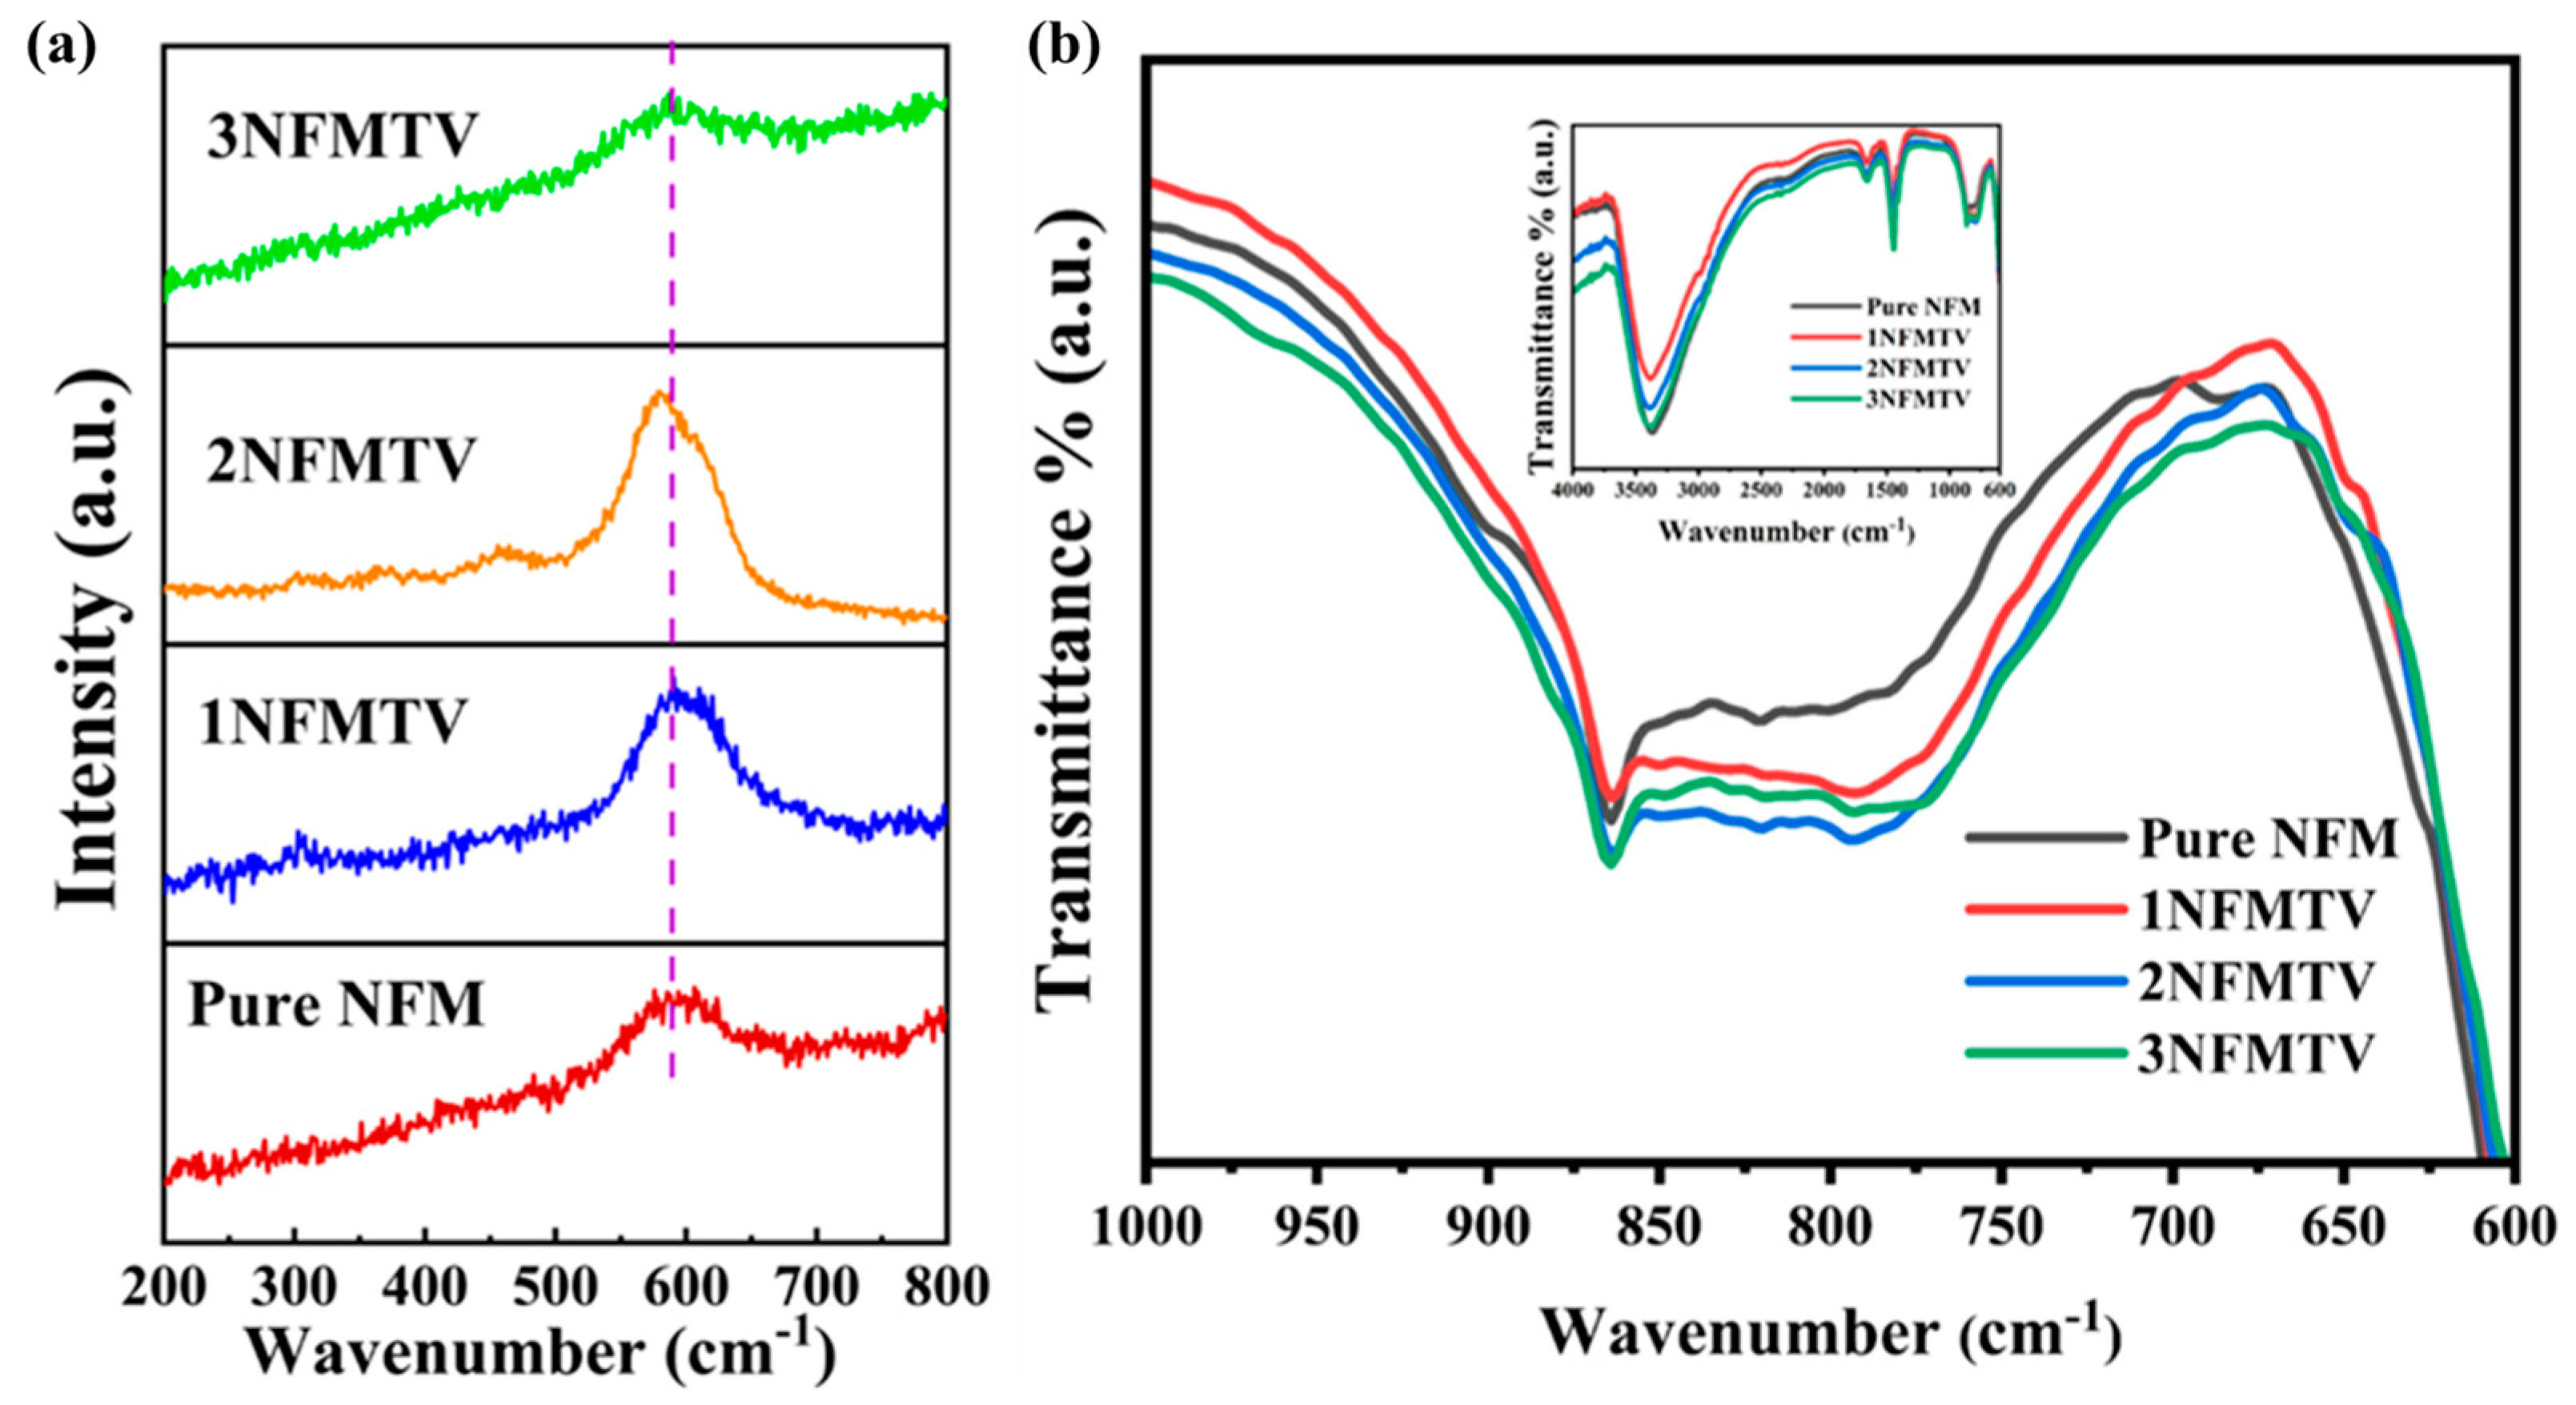
Figure 6a displays the Raman spectra for pristine NFM, and Ti/V-doped NFM (1NFMTV, 2NFMTV, and 3NFMTV). The NFM sample band at 601 cm−1 is related to E2g modes of Na-O vibrations. The doped 1NFMTV, 2NFMTV, and 3NFMTV samples were slightly shifted to a lower wavenumber compared to undoped NFM samples. The observed phenomenon could be attributed to factors related to doping and disorder. The noticeable widening of the Raman spectra in the case of 3NFMTV may be attributed to either the presence of lattice disorder within the polycrystalline sample or the development of strain and the potential formation of sub-lattices within the matrix following the substitution of metals [42].
Figure 6b demonstrates the FTIR spectra of NFM, 1NFMTV, 2NFMTV, and 3NFMTV samples. The FTIR spectra of all samples’ bands span from 600 to 900 cm−1 and correspond to the metal-oxygen bonds. The bands at 603 and 800 cm−1 are due to the O-metal-O (O-Fe-O and O-Mn-O) and metal-O (Fe-O, Mn-O, and Na-O), respectively [43]. In addition, the band at 867 cm−1 is corresponding to the Fe-O-Fe bonds [44,45]. The doped samples slightly shifted to the lower wavenumber compared to the pure NFM samples, which indicates successful Ti and V doping. Similar results were observed in Raman and XRD analysis.

3.2. Electrochemical Analysis

3.2.1. Galvanostatic Charge/Discharge and Rate Capability Analysis

The galvanostatic charge/discharge test was performed to visualize the impact of Ti-V co-doping on the cyclic performance. The theoretical capacity of NFM is 260.7 mAh g−1. From the charge/discharge test, it is found that the initial discharge capacity of pure NFM, 1NFMTV, 2NFMTV, 3NFMTV, and 5NFMTV were 175.15 mAh g−1, 203.147 mAh g−1, 187.12 mAh g−1, 183.15 mAh g−1, and 169.68 mAh g−1, respectively, at 0.1 C (26 mAh g−1), as shown in Figure S10. One notable thing is that the initial discharge-specific capacity of all Ti/V-doped NFMTV samples consistently exceeded that of undoped NFM material even though Ti and V are electrochemically inactive, which dictates that the insertion of doping element improves the electrochemical performance. The reason for an increase in the capacity of 2NFMTV with respect to that of pure NFM is due to the presence of Ti-V doping, which helps to increase the d-spacing in the lattice structure and hence, enhances the ionic conductivity [20,46].
Figure 7a,b shows the charge/discharge profiles for pure NFM and the doped NFMTV samples that are run in the voltage window of 1.5–4.3 V at 0.1 C, and the initial charge/discharge curve for all the samples are shown in Figure S10. According to previous research [27,30,47], it is established that the Na0.66Fe0.5Mn0.5O2 cathode undergoes a phase change from P2 to OP4 with a P6m2 space group during the first charge. This transition is caused by stacking defects, resulting in the alternate arrangement of octahedral and prismatic sites. One point to note is that the charge curve for the pure NFM cathode indicates a phase transition from P2 to OP4 when cycled above 4.0 V during charging (Figure 7a). In contrast, the charge curve for 2NFMTV is smoother in comparison to that of pure NFM, as seen in Figure 7a, which indicates that Ti-V doping is halting the P2-OP4 phase transition to a great extent.
Although the 1st cycle discharge capacity of 1NFMTV was higher than any other samples, the capacity was not consistent in the subsequent cycles. Contrastingly, the capacity of 2NFMTV (187.12 mAh g−1) remained consistent onwards, which was exhibited in Figure S11, and the cycling performance of 3NFMTV and 5NFMTV were shown in Figures S12 and S13. Also, the cycling performance for pure NFM and 2NFMTV was executed at 0.1 C for 150 cycles as compared in Figure 7c. The capacity retention for pure NFM and 2NFMTV were 16.5% and 47.1%, respectively, after 100 cycles. Hence, it is observed that doping with Ti-V improved the capacity retention rate compared to the pristine NFM which is a testament to enhanced reversibility. The reason behind such a significant increase in capacity retention rate might be the effect of controlling the phase transition to OP4/Z, which further enhances the structural stability of the material when Fe is replaced by Ti-V. The rate performance was performed for the pristine NFM and 2NFMTV at various current densities in the voltage range of 1.5–4.3 V, as presented in Figure 7d. While cycled at different C rates swiping from 0.1 C (26 mAh g−1) to 4 C (1040 mAh g−1), the 2NFMTV exhibited better rate capability than that of pristine NFM. The pure NFM exhibited a notably limited capacity and experienced pronounced polarization when subjected to a high discharge rate of 4 C. Conversely, the 2NFMTV led to a substantial enhancement in capacity and a reduction in polarization. The results demonstrate that the Ti-V co-doped 2NFMTV exhibited improved rate capabilities, particularly at high current densities which is strongly correlated to the expansion of the NaO2 slab that facilitates the diffusion of Na ions. Furthermore, the charge and discharge profiles of pure NFM and 2NFMTV cathodes on the 1st, 10th, 50th, 100th, and 150th cycle at 0.1 C were shown in Figure 7a,b. The aforementioned rate and cycle data suggested that the incorporation of Ti and V into Na0.67Mn0.5Fe0.5O2 might significantly improve its electrochemical properties [10,40].

3.2.2. Cyclic Voltammetry and EIS Analysis

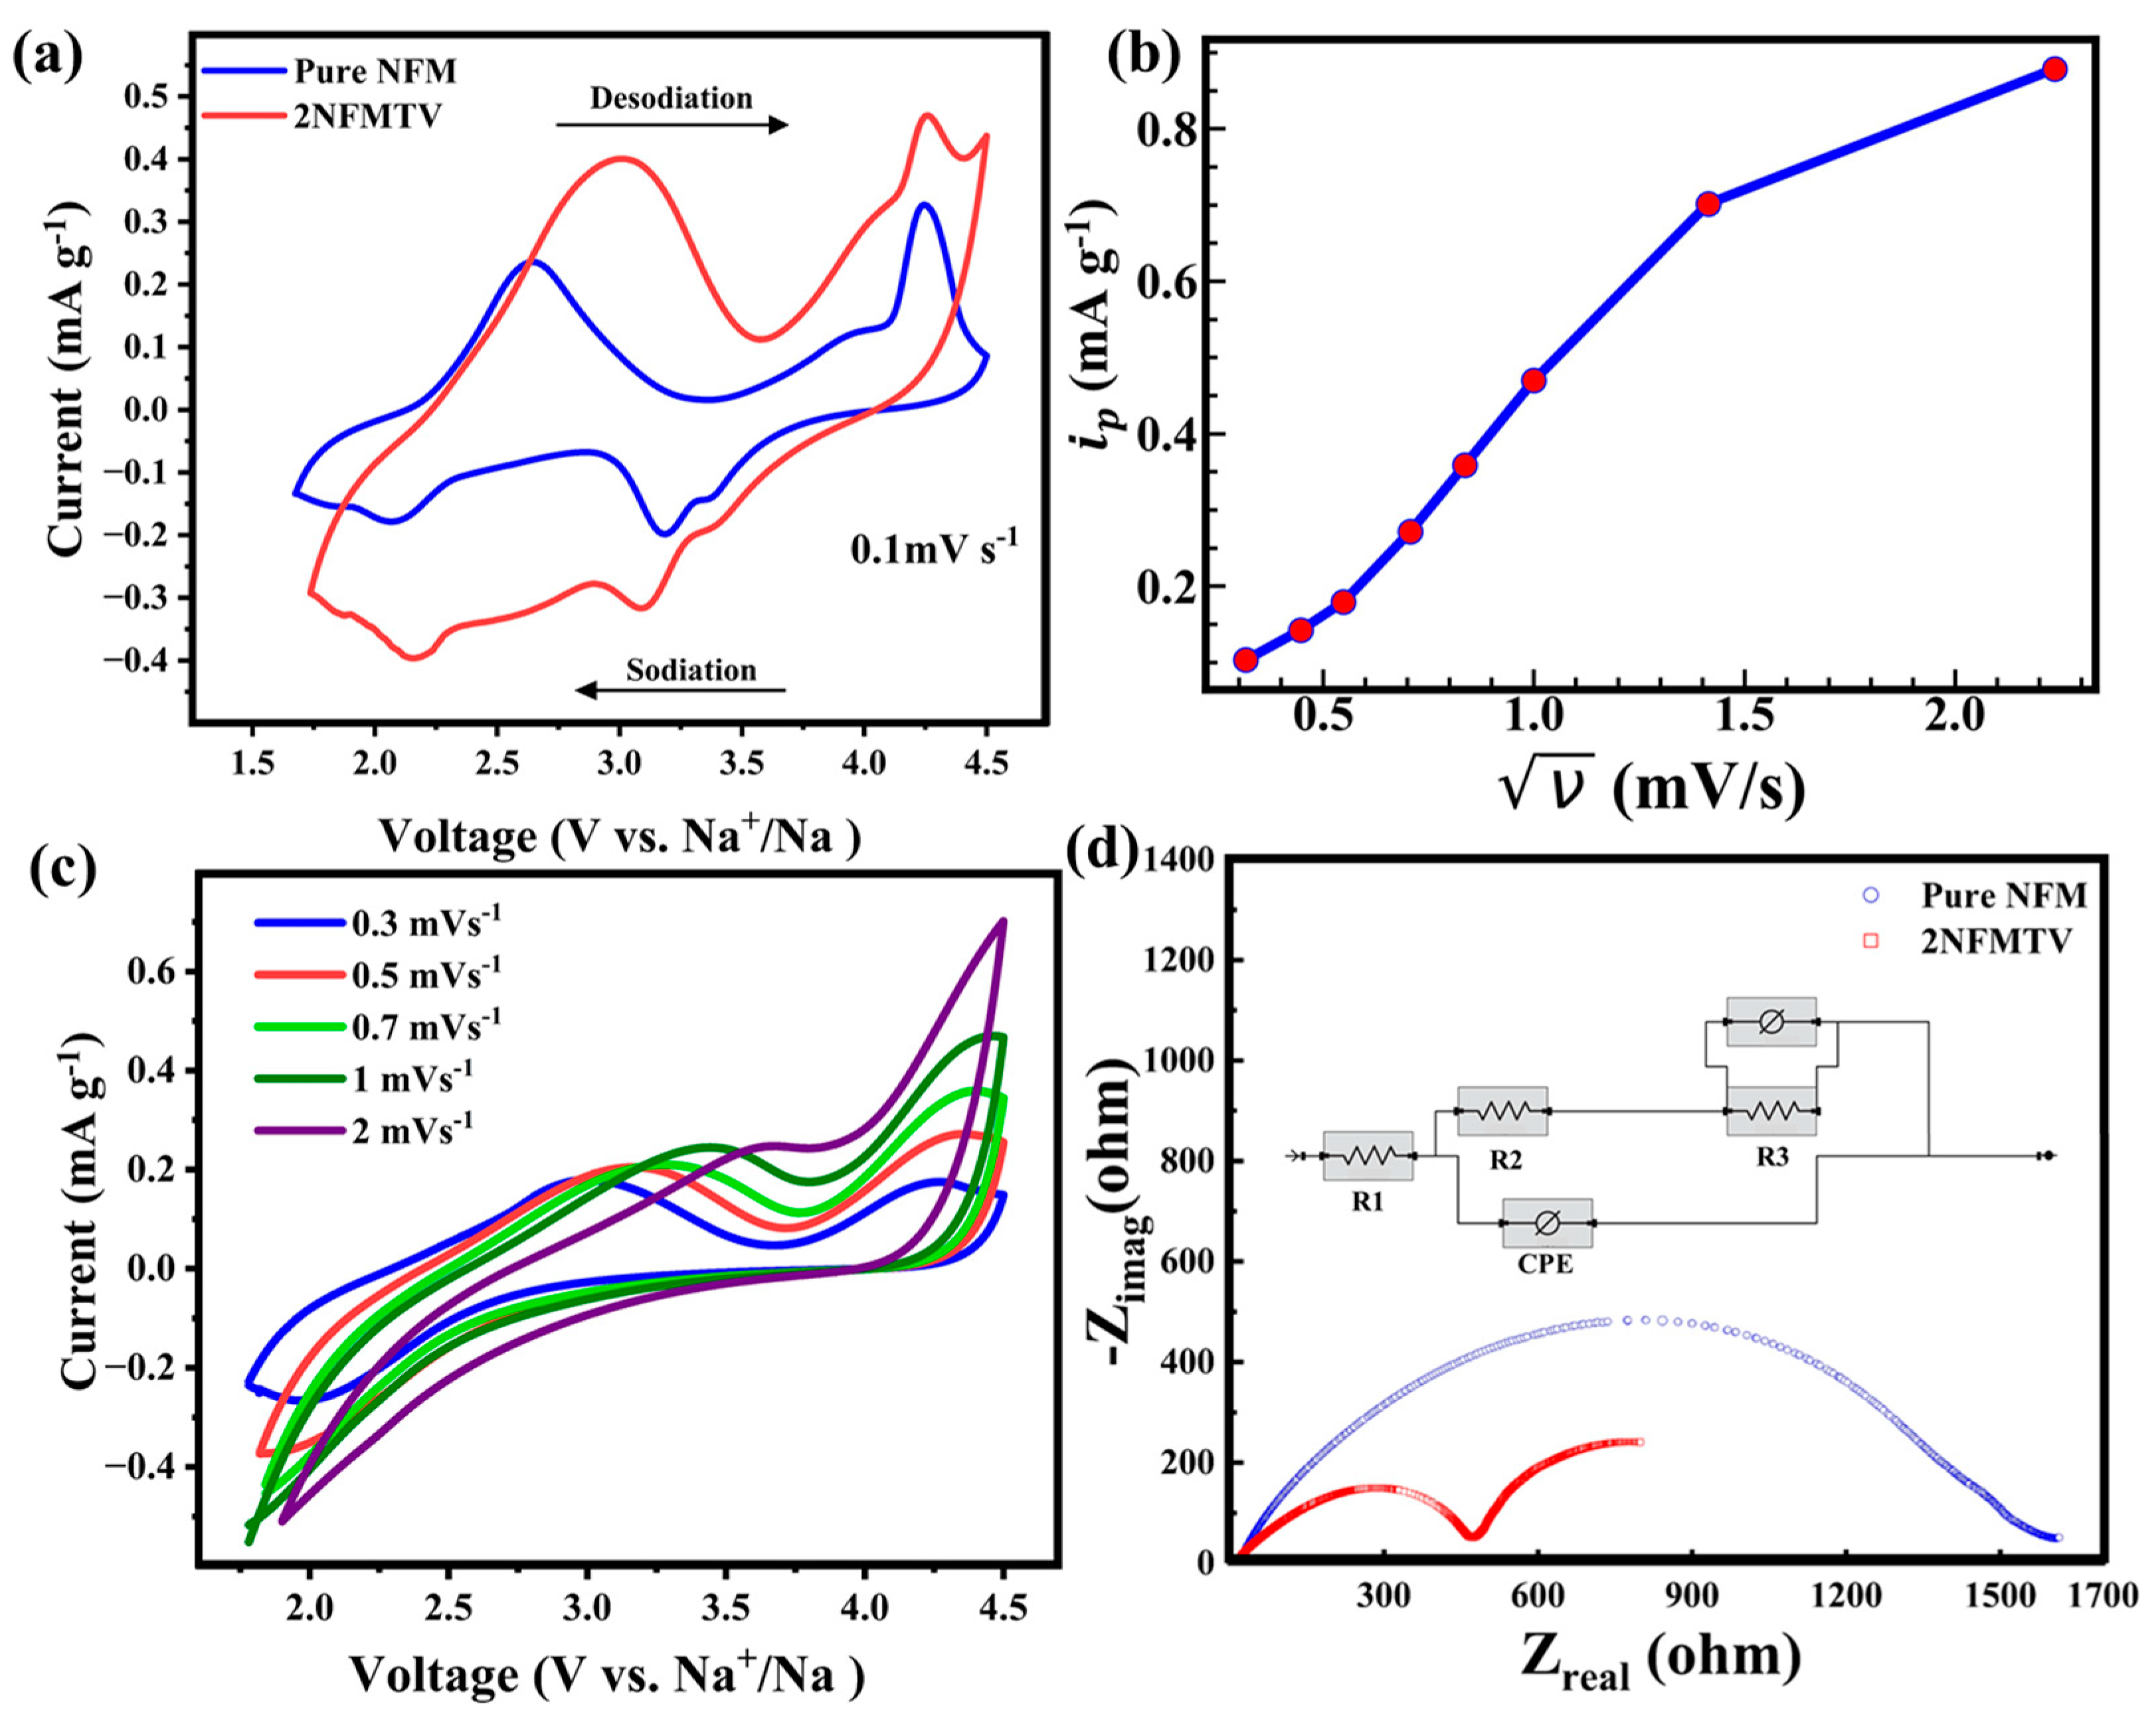
To delve into the reversibility and phase transition of samples, cycling voltammetry (CV) was performed in coin-type cells. Figure 8a showed the initial CV curves of the pristine and the Ti-V co-doped 2NFMTV, spanning a potential window of 1.5 to 4.5 V at a scan rate of 0.1 mV s−1. The CV curves illustrated the intricate electrochemical redox reactions that unfold during the intercalation process. The intensity of the anodic peaks and the cathodic peaks for 2NFMTV is stronger than for pure NFM, suggesting better redox reaction. As seen in the CV curves throughout the charge and discharge cycles, distinctive pairs of oxidation/reduction peaks emerged for pristine NFM and 2NFMTV, centered around 3.2 V/2.2 V and 4.3 V/3.1 V, respectively, corresponding to Mn3⁺/Mn⁴⁺ and Fe3⁺/Fe⁴⁺. Additional peaks at 2.5 V/3.5 V were indicative of Na⁺ vacancy ordering induced by the Jahn-Teller distortion effect of Mn3+. Notably, the Ti/V-doped NFMTV displayed a reduction peak near 3.4 V, smaller than that of pure NFM, suggesting a mitigated reduction of Mn⁴⁺ through doping [29,41,42]. In the context of pure NFM, a modest peak around 3.5 V, possibly associated with Mn3+-induced Jahn-Teller distortion, was discerned but appeared less pronounced in 2NFMTV. This phenomenon could explain that Jahn-Teller distortion-prone Mn3+ was reduced in 2NFMTV by the incorporation of Ti and V into the crystal lattice, which helps suppressing and contributed to the Jahn-Teller distortion stability of the structure [44]. Furthermore, the reduction of the Fe3+ peak in 2NFMTV, compared to pristine NFM, points to the substitution of Fe by Ti-V within the crystal lattice. Crucially, the charge/discharge profiles and cyclic voltammetry curves exhibited no supplementary plateaus or redox peaks, underscoring the electrochemical inertness of V⁵⁺ and Ti⁴⁺ in NFMTV. Also, in Figure 8b, the peak current for each scan rate is plotted for 2NFMTV. The linear connection between the peak currents of the three samples and the square root of the scan rate ( ν ) suggests that the sodiation/desodiation of Na+ is regulated by diffusion. By using the Randles-Sevcik equation, the effect of scan rate with respect to peak current is given by,
i p = 0.4463 n F A C n F υ D R T 1 2
where i p is the peak current (mA), N is the number of electrons transferred in the redox reaction, A is the electrode area (cm2), F is the Faraday constant (C mol−1), and D is the diffusion coefficients (cm2 s−1). From Equation (1) the diffusion co-efficient is calculated, which is 8.4 × 10 6   c m 2 s 1 .
From Figure 8c it is seen that as the scan rate went higher, the anodic peaks migrated to a more positive potential position, while the cathodic peaks shifted to a more negative potential position. When subjected to a higher scan rate, the potential difference between the anodic peaks and the cathodic peaks was observed to increase, indicating a higher level of polarization of the electrode.
In order to provide more evidence for the enhanced electrochemical performance of pure NFM and 2NFMTV, electrochemical impedance spectroscopy (EIS) was conducted after the charge/discharge finished for 1st cycle to partially elucidate their electrochemical kinetics. For both materials, the Nyquist plot in Figure 8d shows the real vs. imaginary impedance over a variety of frequencies when they are charged to 4.3 V and discharged to 1.5 V, respectively. A model circuit, as seen in Figure 8b, can be used for quantitative analysis of the impedance spectra. In the equivalent circuit, R1, the intercept in the horizontal axis, is the bulk resistance ( R s ) of the cell (electrolyte, separator, and electrodes). The semi-circle in the high-frequency area corresponds to charge transfer behavior, whereas the line at low frequencies area corresponds to a diffusion process. Constant phase element (CPE) is used to supplement double layer capacitance. R2 accounts for the resistance due to Na-ion diffusion through the surface of the cathode, whereas R3 refers to charge-transfer resistance ( R c t ) . Warburg impedance (ZW) is generated by the mass transfer and is used to describe the impedance created by the sodium diffusion process in the bulk materials [48,49,50]. Evidently, the radius of the semicircle seen in the 2NFMTV material was observed to be significantly lower in comparison to that of NFM, which dictates smaller cathode electrolyte layer formation for 2NFMTV on its electrode surface compared to that of pure NFM. This suggests that the migration of sodium ions during the process of de-intercalation is more facile in 2NFMTV, which is beneficial for enhancing the rate performance and achieving higher capacities. The EIS for all the samples—pure NFM, 1NFMTV, 2NFMRV, and 3NFMTV—are shown in Figures S14 and S15, where it is evident that the 2NFMTV has the smallest charge transfer resistance and the values are shown in Table 2. The diffusion value D N a + is calculated using following equation:
Z = R s + R c t + σ W . ω 0.5
D N a + = 0.5 R T A F 2 σ W ω C 2
where ω is angular frequency region; R is gas constant; T is absolute temperature; F is the Faraday constant; A is the area of electrode surface; and C is molar concentration of Na+ ions.
By using Equations (2) and (3), the diffusion co-efficient ( D N a + ) for all the samples are calculated, as shown in Table 2:
It can be observed from the Table 2 that 2NFMTV shows the superior conductivity based on the diffusion co-efficient value, which matched well with values found in the CV analysis result.

4. Conclusions

In conclusion, this study successfully synthesized, characterized, and assessed a novel cobalt-free cathode material, denoted as N a 0.6 M n 0.5 F e 0.5 2 x V x T i x O 2 (x = 0.00, 0.005, 0.01, 0.015, 0.025, 0.05), for implementation in sodium-ion batteries. The highlight of this study lies in the material’s high discharge capacity and remarkable structural stability observed throughout cycling within an extended voltage window of 1.5–4.3 V. This advantageous performance stems from the utilization of smaller Ti and V ions, coupled with their elevated bonding energy. The investigation involved a comprehensive analysis of their structural properties and an evaluation of their electrochemical performance. The findings of the study indicate that the amount of JT-prone Mn3+ has been reduced to a great extent by incorporating Ti and V in the transition metal oxide layer, particularly for 2% T-V substitution in transition metal oxide layer. This has been shown explicitly from the XPS results, where change in peak splitting energy gap of the Mn 3 s peak implies that the Mn3+/Mn4+ ratio has been altered. Moreover, the capacity retention and long-term cycling stability have been greatly improved due to the prevention of P2-OP4 phase transition at higher voltage (> 4   V ), which corresponds to the wider d-spacing for faster Na-ion migration and better reversibility. Ti-V substituted 2NFMTV demonstrated superior cycling stability to pristine NFM (79.36 mAh g−1 vs. 45.12 mAh g−1) at a high current density (4 C). In light of these findings, it is evident that improving the electrochemical characteristics of P2-type NFMO by the replacement of titanium and vanadium in place of iron is an efficient strategy for sodium-ion batteries. This approach paves the way to develop next-generation layered oxide cathodes for SIBs with greater structural stabilization, high capacity, and extended cycle life.

Supplementary Materials

The following supporting information can be downloaded at: https://www.mdpi.com/article/10.3390/electrochem5040029/s1. The supplemental information includes Rietveld refinement data, SEM and EDS images, Galvanostatic charge discharge curve, CV and EIS data. Figure S1: Scanning electron microscope images of (a) Pristine NFM, (b) 1NFMTV, (c) 2NFMTV, (d) 3NFMTV, (e) 5NFMTV, (f) 10NFMTV; Figure S2: EDS Elemental Mapping of 1NFMTV; Figure S3: EDS Elemental Mapping of 3NFMTV; Figure S4: EDS Elemental Mapping of 5NFMTV; Figure S5: EDS Elemental Mapping of 10NFMTV; Figure S6: XPS Spectra for Pure NFM; Figure S7: XPS Spectra for 2NFMTV; Figure S8: XPS Peak of O 1s in Pure NFM and Doped NFM; Figure S9: XPS Peak of C 1s in Pure NFM and Doped NFM; Figure S10: 1st Cycle Charge/Discharge Profiles for Pure NFM, 1NFMTV, 2NFMTV, 3NFMTV, 5NFMTV; Figure S11: Cycling Profile for 1NFMTV; Figure S12: Cycling Profile for 3NFMTV; Figure S13: Cycling Profile for 5NFMTV; Figure S14: Nyquist plots from EIS analysis for Pure NFM, 1NFMTV, 2NFMTV, 3NFMTV over frequency range from 0.1 kHz to 100 kHz; Figure S15: -Z’’ vs. Angular Frequency response from EIS analysis for Pristine NFM, 1NFMTV, 2NFMTV, 3NFMTV; Table S1: Rietveld refinement results (lattice parameters, Na sites, and R-factors) for N a 0.6 F e 0.5 M n 0.5 O 2 ; Table S2: Rietveld refinement results (lattice parameters, Na sites, and R-factors) for N a 0.6 F e 0.49 M n 0.5 T i 0.005 V 0.005 O 2 ; Table S3: Rietveld refinement results (lattice parameters, Na sites, and R-factors) for N a 0.6 F e 0.48 M n 0.5 T i 0.01 V 0.01 O 2 ; Table S4: Rietveld refinement results (lattice parameters, Na sites, and R-factors) for N a 0.6 F e 0.47 M n 0.5 T i 0.015 V 0.015 O 2 ; Table S5: Rietveld refinement results (lattice parameters, Na sites, and R-factors) for N a 0.6 F e 0.45 M n 0.5 T i 0.025 V 0.025 O 2 .

Author Contributions

Conceptualization, T.B. and I.B.; methodology, T.B. and W.A.; software, T.B. and A.O.; validation, T.B., I.B. and K.V.S.; formal analysis, T.B. and K.V.S.; investigation, T.B.; resources, I.B. and S.M.; data curation, T.B.; writing—original draft preparation, T.B.; writing—review and editing, T.B., I.B., K.V.S. and W.A.; visualization, T.B. and K.V.S.; supervision, I.B.; project administration, I.B.; funding acquisition, I.B. All authors have read and agreed to the published version of the manuscript.

Funding

This research was funded by the Tennessee Valley Authority (TVA), grant number 5315627.

Institutional Review Board Statement

Not applicable.

Informed Consent Statement

Not applicable.

Data Availability Statement

Data are contained within the article.

Acknowledgments

The material synthesis and electrochemical characterization were carried out at SOLBAT-TTU Energy Research Laboratory, Tennessee Technological University. The major physical characterization was performed at the Materials Science Lab, Tennessee Technological University. FTIR and Raman characterization work were performed at Northeastern University, Boston, Massachusetts.

Conflicts of Interest

The authors declare no conflicts of interest. The funders had no role in the design of the study; in the collection, analyses, or interpretation of data; in the writing of the manuscript; or in the decision to publish the results.

References

  1. Bloomberg. Lithium-Ion Battery Market Size Worth $182.53 Billion by 2030: Grand View Research, Inc. 2022. Available online: https://www.bloomberg.com/press-releases/2022-06-07/lithium-ion-battery-market-size-worth-182-53-billion-by-2030-grand-view-research-inc (accessed on 3 March 2023).
  2. Nayak, P.K.; Yang, L.; Brehm, W.; Adelhelm, P. From Lithium-Ion to Sodium-Ion Batteries: Advantages, Challenges, and Surprises. Angew. Chemie-Int. Ed. 2018, 57, 102–120. [Google Scholar] [CrossRef]
  3. Kim, S.W.; Seo, D.H.; Ma, X.; Ceder, G.; Kang, K. Electrode materials for rechargeable sodium-ion batteries: Potential alternatives to current lithium-ion batteries. Adv. Energy Mater. 2012, 2, 710–721. [Google Scholar] [CrossRef]
  4. Anilkumar, A.; Nair, N.; Nair, S.V.; Baskar, S. Tailoring high Na content in P2-type layered oxide cathodes via Cu–Li dual doping for sodium-ion batteries. J. Energy Storage 2023, 72, 108291. [Google Scholar] [CrossRef]
  5. Shi, W.J.; Zhang, D.; Meng, X.M.; Bao, C.X.; Xu, S.D.; Chen, L.; Wang, X.M.; Liu, S.B.; Wu, Y.C. Low-Strain Reticular Sodium Manganese Oxide as an Ultrastable Cathode for Sodium-Ion Batteries. ACS Appl. Mater. Interfaces 2020, 12, 14174–14184. [Google Scholar] [CrossRef]
  6. Yuan, D.D.; Wang, Y.X.; Cao, Y.L.; Ai, X.P.; Yang, H.X. Improved electrochemical performance of Fe-substituted NaNi0.5Mn0.5O2 cathode materials for sodium-ion batteries. ACS Appl. Mater. Interfaces 2015, 7, 8585–8591. [Google Scholar] [CrossRef]
  7. Delmas, C.; Fouassier, C.; Hagenmuller, P. Structural classification and properties of the layered oxides. Physica B+C 1980, 99, 81–85. [Google Scholar] [CrossRef]
  8. Jia, M.; Qiao, Y.; Li, X.; Qiu, F.; Cao, X.; He, P.; Zhou, H. Identifying Anionic Redox Activity within the Related O3- and P2-Type Cathodes for Sodium-Ion Battery. ACS Appl. Mater. Interfaces 2020, 12, 851–857. [Google Scholar] [CrossRef]
  9. Bianchini, M.; Gonzalo, E.; Drewett, N.E.; Ortiz-Vitoriano, N.; López Del Amo, J.M.; Bonilla, F.J.; Acebedo, B.; Rojo, T. Layered P2-O3 sodium-ion cathodes derived from earth abundant elements. J. Mater. Chem. A 2018, 6, 3552–3559. [Google Scholar] [CrossRef]
  10. Toumar, A.J. Phase Transformations in Layered Electrode Materials for Sodium Ion Batteries. Mass. Inst. Technol. 2017, 380, 138156. [Google Scholar]
  11. Wei, F.; Zhang, Q.; Zhang, P.; Tian, W.; Dai, K.; Zhang, L.; Mao, J.; Shao, G. Review—Research Progress on Layered Transition Metal Oxide Cathode Materials for Sodium Ion Batteries. J. Electrochem. Soc. 2021, 168, 050524. [Google Scholar] [CrossRef]
  12. Shen, Q.; Zhao, X.; Liu, Y.; Li, Y.; Zhang, J.; Zhang, N.; Yang, C.; Chen, J. Dual-Strategy of Cation-Doping and Nanoengineering Enables Fast and Stable Sodium-Ion Storage in a Novel Fe/Mn-Based Layered Oxide Cathode. Adv. Sci. 2020, 7, 2002199. [Google Scholar] [CrossRef]
  13. Thorne, J.S.; Dunlap, R.A.; Obrovac, M.N. Structure and Electrochemistry of NaxFexMn1−xO2 (1.0 ≤ x ≤ 0.5) for Na-Ion Battery Positive Electrodes. J. Electrochem. Soc. 2013, 160, A361–A367. [Google Scholar] [CrossRef]
  14. Zhang, K.; Kim, D.; Hu, Z.; Park, M.; Noh, G.; Yang, Y.; Zhang, J.; Lau, V.W.-h.; Chou, S.L.; Cho, M.; et al. Manganese based layered oxides with modulated electronic and thermodynamic properties for sodium ion batteries. Nat. Commun. 2019, 10, 5203. [Google Scholar] [CrossRef]
  15. Hwang, J.Y.; Kim, J.; Yu, T.Y.; Sun, Y.K. A New P2-Type Layered Oxide Cathode with Extremely High Energy Density for Sodium-Ion Batteries. Adv. Energy Mater. 2019, 9, 1803346. [Google Scholar] [CrossRef]
  16. Shi, Y.; Li, S.; Gao, A.; Zheng, J.; Zhang, Q.; Lu, X.; Gu, L.; Cao, D. Probing the Structural Transition Kinetics and Charge Compensation of the P2-Na0.78Al0.05Ni0.33Mn0.60O2 Cathode for Sodium Ion Batteries. ACS Appl. Mater. Interfaces 2019, 11, 24122–24131. [Google Scholar] [CrossRef]
  17. Darbar, D.; Muralidharan, N.; Hermann, R.P.; Nanda, J. Evaluation of Electrochemical Performance and Redox Activity of Fe in Ti doped layered P2-Na0.67Mn0.5Fe0.5O2 cathode for sodium ion batteries. Electrochim. Acta 2021, 380, 138156. [Google Scholar] [CrossRef]
  18. Han, M.H.; Gonzalo, E.; Sharma, N.; López Del Amo, J.M.; Armand, M.; Avdeev, M.; Saiz Garitaonandia, J.J.; Rojo, T. High-Performance P2-Phase Na2/3Mn0.8Fe0.1Ti0.1O2 Cathode Material for Ambient-Temperature Sodium-Ion Batteries. Chem. Mater. 2016, 28, 106–116. Available online: https://pubs.acs.org/doi/full/10.1021/acs.chemmater.5b03276 (accessed on 5 November 2023). [CrossRef]
  19. Linnell, S.F.; Manche, A.G.; Liao, Y.; Hirsbrunner, M.; Imada, S.; Naden, A.B.; Irvine, J.T.S.; Duda, L.C.; Armstrong, A.R. Effect of Cu substitution on anion redox behaviour in P3-type sodium manganese oxides. J. Phys. Energy 2022, 4, 044006. [Google Scholar] [CrossRef]
  20. Ramasamy, H.V.; Kaliyappan, K.; Thangavel, R.; Aravindan, V.; Kang, K.; Kim, D.U.; Park, Y.; Sun, X.; Lee, Y.S. Cu-doped P2-Na0.5Ni0.33Mn0.67O2 encapsulated with MgO as a novel high voltage cathode with enhanced Na-storage properties. J. Mater. Chem. A 2017, 5, 8408–8415. [Google Scholar] [CrossRef]
  21. Zhang, L.; Wang, C.; Liu, Y.; Ren, M.; Du, J.; Chen, A.; Li, F. Suppressing interlayer-gliding and Jahn-Teller effect in P2-type layered manganese oxide cathode via Mo doping for sodium-ion batteries. Chem. Eng. J. 2021, 426, 130813. [Google Scholar] [CrossRef]
  22. Sui, Y.; Hao, Y.; Zhang, X.; Li, J.; Wen, G.; Zhong, S.; Zhang, Z.; Wu, L. Improved electrochemical properties of vanadium substituted Na0·67Fe0·5Mn0·5O2 cathode material for sodium-ion batteries. Ceram. Int. 2021, 47, 5227–5234. [Google Scholar] [CrossRef]
  23. Yuan, S.; Liu, Y.B.; Xu, D.; Ma, D.L.; Wang, S.; Yang, X.H.; Cao, Z.Y.; Zhang, X.B. Pure Single-Crystalline Na1.1V3O7.9 Nanobelts as Superior Cathode Materials for Rechargeable Sodium-Ion Batteries. Adv. Sci. 2015, 2, 1400018. [Google Scholar] [CrossRef]
  24. Wang, Y.; Xiao, R.; Hu, Y.S.; Avdeev, M.; Chen, L. P2-Na0.6[Cr0.6Ti0.4]O2 cation-disordered electrode for high-rate symmetric rechargeable sodium-ion batteries. Nat. Commun. 2015, 6, 6954. [Google Scholar] [CrossRef]
  25. Do, J.; Kim, I.; Kim, H.; Jung, Y. Towards stable Na-rich layered transition metal oxides for high energy density sodium-ion batteries. Energy Storage Mater. 2020, 25, 62–69. [Google Scholar] [CrossRef]
  26. Ramasamy, H.V.; Kaliyappan, K.; Thangavel, R.; Seong, W.M.; Kang, K.; Chen, Z.; Lee, Y.S. Efficient Method of Designing Stable Layered Cathode Material for Sodium Ion Batteries Using Aluminum Doping. J. Phys. Chem. Lett. 2017, 8, 5021–5030. [Google Scholar] [CrossRef]
  27. Wang, H.; Gao, R.; Li, Z.; Sun, L.; Hu, Z.; Liu, X. Different Effects of Al Substitution for Mn or Fe on the Structure and Electrochemical Properties of Na0.67Mn0.5Fe0.5O2 as a Sodium Ion Battery Cathode Material. Inorg. Chem. 2018, 57, 5249–5257. Available online: https://pubs.acs.org/doi/full/10.1021/acs.inorgchem.8b00284 (accessed on 1 February 2024). [CrossRef]
  28. Ding, Z.; Liu, Y.; Tang, Q.; Jiang, Q.; Lu, J.; Xiao, Z.; Yao, P.; Monasterio, M.; Wu, J.; Liu, X. Enhanced electrochemical performance of iron-manganese based cathode by Li doping for sodium-ion batteries. Electrochim. Acta 2018, 292, 871–878. [Google Scholar] [CrossRef]
  29. Park, J.K.; Park, G.G.; Kwak, H.H.; Hong, S.T.; Lee, J.W. Enhanced Rate Capability and Cycle Performance of Titanium-Substituted P2-Type Na0.67Fe0.5Mn0.5O2 as a Cathode for Sodium-Ion Batteries. ACS Omega 2017, 3, 361–368. [Google Scholar] [CrossRef]
  30. Yabuuchi, N.; Kajiyama, M.; Iwatate, J.; Nishikawa, H.; Hitomi, S.; Okuyama, R.; Usui, R.; Yamada, Y.; Komaba, S. P2-type Nax[Fe1/2Mn1/2]O2 made from earth-abundant elements for rechargeable Na batteries. Nat. Mater. 2012, 11, 512–517. [Google Scholar] [CrossRef]
  31. Zhou, D.; Huang, W.; Zhao, F.; Lv, X. The effect of Na content on the electrochemical performance of the O3-type NaxFe0.5Mn0.5O2 for sodium-ion batteries. J. Mater. Sci. 2019, 54, 7156–7164. [Google Scholar] [CrossRef]
  32. Nakrela, A.; Benramdane, N.; Bouzidi, A.; Kebbab, Z.; Medles, M.; Mathieu, C. Site location of Al-dopant in ZnO lattice by exploiting the structural and optical characterisation of ZnO: Al thin films. Results Phys. 2016, 6, 133–138. [Google Scholar] [CrossRef]
  33. Mao, D.; Tan, X.; Guo, L.; Zhao, T.; Fan, Z.; Song, L.; Zhang, Y.; Liu, G.; Wang, H.; Chu, W. Lithium Antievaporation-Loss Engineering via Sodium/Potassium Doping Enables Superior Electrochemical Performance of High-Nickel Li-Rich Layered Oxide Cathodes; American Chemical Society: Washington, WA, USA, 2022; Volume 14, pp. 19594–19603. [Google Scholar]
  34. Billaud, J.; Singh, G.; Armstrong, A.R.; Gonzalo, E.; Roddatis, V.; Armand, M.; Rojo, T.; Bruce, P.G. Na0.67Mn1−xMgxO2 (0 ≤ x ≤ 0.2): A high capacity cathode for sodium-ion batteries. Energy Environ. Sci. 2014, 7, 1387–1391. [Google Scholar] [CrossRef]
  35. Widiyandari, H.; Sukmawati, A.N.; Sutanto, H.; Yudha, C.; Purwanto, A. Synthesis of LiNi0.8Mn0.1Co0.1O2 cathode material by hydrothermal method for high energy density lithium ion battery. J. Phys. Conf. Ser. 2019, 1153, 012074. [Google Scholar] [CrossRef]
  36. Hasan, F.; Kim, J.; Song, H.; Lee, S.H.; Sung, J.H.; Kim, J.; Yoo, H.D. Effect of particle size and doping on the electrochemical characteristics of Ca-doped LiCoO2 cathodes. J. Electrochem. Sci. Technol. 2020, 11, 352–360. [Google Scholar] [CrossRef]
  37. Julien, C.; Mauger, A.; Zaghib, K.; Groult, H. Optimization of layered cathode materials for lithium-ion batteries. Materials 2016, 9, 595. [Google Scholar] [CrossRef]
  38. Stoyanova, R.; Carlier, D.; Sendova-Vassileva, M.; Yoncheva, M.; Zhecheva, E.; Nihtianova, D.; Delmas, C. Stabilization of over-stoichiometric Mn4+ in layered Na2/3MnO2. J. Solid State Chem. 2010, 183, 1372–1379. [Google Scholar] [CrossRef]
  39. Dang, R.; Chen, M.; Li, Q.; Wu, K.; Lee, Y.L.; Hu, Z.; Xiao, X. Na+-Conductive Na2Ti3O7-Modified P2-type Na2/3Ni1/3Mn2/3O2 via a Smart in Situ Coating Approach: Suppressing Na+/Vacancy Ordering and P2-O2 Phase Transition. ACS Appl. Mater. Interfaces 2019, 11, 856–864. [Google Scholar] [CrossRef]
  40. Pang, W.L.; Zhang, X.H.; Guo, J.Z.; Li, J.Y.; Yan, X.; Hou, B.H.; Guan, H.Y.; Wu, X.L. P2-type Na2/3Mn1−xAlxO2 cathode material for sodium-ion batteries: Al-doped enhanced electrochemical properties and studies on the electrode kinetics. J. Power Sources 2017, 356, 80–88. [Google Scholar] [CrossRef]
  41. Hirsh, H.; Olguin, M.; Chung, H.; Li, Y.; Bai, S.; Feng, D.; Wang, D.; Zhang, M.; Meng, Y.S. Meso-Structure Controlled Synthesis of Sodium Iron-Manganese Oxides Cathode for Low-Cost Na-Ion Batteries. J. Electrochem. Soc. 2019, 166, A2528–A2535. [Google Scholar] [CrossRef]
  42. Zhao, W.; Kirie, H.; Tanaka, A.; Unno, M.; Yamamoto, S.; Noguchi, H. Synthesis of metal ion substituted P2-Na2/3Ni1/3Mn2/3O2 cathode material with enhanced performance for Na ion batteries. Mater. Lett. 2014, 135, 131–134. [Google Scholar] [CrossRef]
  43. Zhang, L.; Zhou, M.; Shao, L.; Wang, W.; Fan, K.; Qin, Q. Reactions of Fe with H2O and Feo with H2. A combined matrix isolation FTIR and theoretical study. J. Phys. Chem. A 2001, 105, 6998–7003. [Google Scholar] [CrossRef]
  44. Altin, E.; Altundag, S.; Altin, S.; Bayri, A. Fabrication of Cr doped Na0.67Fe0.5Mn0.5O2 compounds and investigation of their structural, electrical, magnetic and electrochemical properties. J. Mater. Sci. Mater. Electron. 2019, 30, 17848–17855. [Google Scholar] [CrossRef]
  45. Uchaker, E.; Jin, H.; Yi, P.; Cao, G. Elucidating the Role of Defects for Electrochemical Intercalation in Sodium Vanadium Oxide. Chem. Mater. 2015, 27, 7082–7090. [Google Scholar] [CrossRef]
  46. Wan, D.Y.; Fan, Z.Y.; Dong, Y.X.; Baasanjav, E.; Jun, H.B.; Jin, B.; Jin, E.M.; Jeong, S.M. Effect of Metal (Mn, Ti) Doping on NCA Cathode Materials for Lithium Ion Batteries. J. Nanomater. 2018, 2018, 8082502. [Google Scholar] [CrossRef]
  47. Mortemard de Boisse, B.; Carlier, D.; Guignard, M.; Delmas, C. Structural and Electrochemical Characterizations of P2 and New O3-NaxMn1−yFeyO2 Phases Prepared by Auto-Combustion Synthesis for Na-Ion Batteries. J. Electrochem. Soc. 2013, 160, A569–A574. [Google Scholar] [CrossRef]
  48. Zhu, Q.; Cheng, H.; Zhang, X.; He, L.; Hu, L.; Yang, J.; Chen, Q.; Lu, Z. Improvement in electrochemical performance of Na3V2(PO4)3/C cathode material for sodium-ion batteries by K-Ca co-doping. Electrochim. Acta 2018, 281, 208–217. [Google Scholar] [CrossRef]
  49. Sim, S.; Lee, S.; Jin, B.; Kim, H. Improving the electrochemical performances using a V-doped Ni- rich NCM cathode. Sci. Rep. 2019, 9, 8952. [Google Scholar] [CrossRef]
  50. Tsai, Y.T.; Wu, C.Y.; Duh, J.G. Synthesis of Ni-rich NMC cathode material by redox-assisted deposition method for lithium ion batteries. Electrochim. Acta 2021, 381, 138244. [Google Scholar] [CrossRef]
Figure 1. XRD patterns of (a) pristine NFM and Ti/V-doped NaFe0.5−2xMn0.5TixVxO2 (x = 0~0.1), (b) lattice structure of 2NFMTV, (c) lattice parameters obtained from Rietveld refinement, and (d) schematic illustration of P2-type layered transition metal oxides.
Electrochem 05 00029 g001
Figure 2. Rietveld refinement on XRD data of (a) pristine NFM, (b) 1NFMTV, (c) 2NFMTV, and (d) 3NFMTV (blue lines and red lines correspond to observed intensities and differences between observed and calculated patterns, respectively).
Electrochem 05 00029 g002
Figure 3. SEM and TEM images of (a) pure NFM (b) 2NFMTV.
Electrochem 05 00029 g003
Figure 4. Elemental mapping from EDS Analysis of (a) pure NFM (b) 2NFMTV.
Electrochem 05 00029 g004
Figure 5. XPS analysis of all elements in pristine NFM and Ti/V-doped NFM (1 NFMTV, 2NFMTV, 3NFMTV). (a) Na 1s Peak; (b) Fe 2s Peaks; (c) Mn 2p Peaks; (d) Mn 3s Peaks; (e) Ti 2p Peaks; (f) O 1s and V 2p Peaks.
Electrochem 05 00029 g005
Figure 6. (a) Raman Spectroscopy and (b) FTIR analysis of pristine and Ti/V-dopedNFM samples.
Electrochem 05 00029 g006
Figure 7. Galvanostatic charge/discharge data for (a) pure NFM (b) 2NFMTV (c) long-term cycling stability tests for pure NFM and 2NFMTV and (d) rate capability of pure NFM and 2NFMTV.
Electrochem 05 00029 g007
Figure 8. (a) CV for pure NFM and 2NFMTV (b) linear response of peak current as a function of the square root of scan rate of 2NFMTV, (c) CV for 2NFMTV at various scan rates of 0.1–5 mV s−1, (d) Nyquist plots over a frequency range from 0.1 kHz to 100 kHz and equivalent circuit of pure NFM and 2NFMTV.
Electrochem 05 00029 g008
Table 1. Detailed Rietveld refinement results of Na0.67Fe0.5−2xMn0.5TixVxO2 (x = 0, 1, 2, 3, 5, 10) samples.
SamplesLattice Parameters Bond   Length   of   N a - O   ( ) Bond   Length   of   T M - O   ( ) R w p R p
a   ( ) c   ( ) c / a V   ( 3 ) d 002   ( )
Pure NFM2.917611.28853.86983.2185.64413.7131.9317.85.45
1NFMTV2.921611.29643.866583.50485.64893.24832.06957.284.89
2NFMTV2.918211.29753.871483.31585.64933.47471.9948.595.71
3NFMTV2.922211.29513.865383.52435.64763.55941.975146.294.12
5NFMTV2.921511.29093.865483.42935.64583.54341.9315.463.96
10NFMTV2.994711.31543.778487.8855.65773.5161.9259.937.73
Table 2. Impedance Parameters of Na0.67Fe0.5−2xMn0.5TixVxO2 (x = 0, 1, 2, 3) samples.
Sample R c t   ( Ω )Warburg Co-EfficientDiffusion Co-Efficient  ( D N a + )   c m 2 s 1
Pure NFM1510103.4718 4.97 × 10 6
1NFMTV2630453.3639 2.59 × 10 7
2NFMTV49881.3622 8.04 × 10 6
3NFMTV27231469.8327 2.46 × 10 8
Disclaimer/Publisher’s Note: The statements, opinions and data contained in all publications are solely those of the individual author(s) and contributor(s) and not of MDPI and/or the editor(s). MDPI and/or the editor(s) disclaim responsibility for any injury to people or property resulting from any ideas, methods, instructions or products referred to in the content.