Article

The Influence of Thick Cathode Fabrication Processing on Battery Cell Performance

by
Dewen Kong
,
Haijing Liu
*,†,
Si Chen
and
Meiyuan Wu
Battery R&D, Battery Cell and Pack, General Motors, Shanghai 201206, China
*
Author to whom correspondence should be addressed.
These authors contributed equally to this work.
Electrochem 2024, 5(4), 421-436; https://doi.org/10.3390/electrochem5040028
Submission received: 2 August 2024 / Revised: 3 October 2024 / Accepted: 14 October 2024 / Published: 16 October 2024

Abstract

:
The lithium-ion battery (LIB) is the key energy storage device for electric transportation. The thick electrode (single-sided areal capacity >4.0 mAh/cm2) design is a straightforward and effective strategy for improving cell energy density by improving the mass proportion of electroactive materials in whole cell components and for reducing cost of the battery cell without involving new chemistries of uncertainties. Thus, selecting a low-cost and environmentally friendly fabrication process to achieve a thick cathode electrode with good electrochemical performance is of strong interest. This study investigated the impact of fabrication processes on the performance of thick LiNi0.75Mn0.25O2 (NM75) cathode electrodes in pouch cells. Two fabrication methods were compared: the conventional polyvinylidene fluoride (PVDF)-based slurry casting method (C-NM75) and the polytetrafluoroethylene (PTFE)-based powder fibrillating process (F-NM75). The pouch cells with F-NM75 electrodes exhibited significantly improved discharge and charge rate capabilities, with a discharge capacity ratio (3 C vs. C/3) > 62% and a charge capacity ratio (2 C vs. C/3) > 81%. Furthermore, F-NM75 cells demonstrated outstanding C/3 cycling performance, retaining 86% of discharge capacity after 2200 cycles. These results strongly indicated that the PTFE-based powder fibrillating process is a promising solution to construct high-performance thick cathode electrodes for electric vehicles (EVs) applications.

1. Introduction

Electric transportation has become a popular and highly supported solution for reducing greenhouse gas (GHG) emissions [1,2]. Lithium-ion batteries (LIBs) are widely used as the primary rechargeable energy storage system (RESS) in EVs due to their high gravimetric energy density (GED), large volumetric energy density (VED), and excellent cycling stability [3,4,5,6,7,8,9,10,11,12]. The utilization of thick electrodes with a single-sided areal capacity greater than 4.0 mAh/cm2 is a straightforward and effective approach to enhance the mass proportion of electroactive materials at the cell level to improve device level energy density and reduce cell cost without involving new chemistries of uncertainties [4,13,14,15].
State-of-the-art cathode electrodes are commonly produced using a PVDF-based slurry casting process. The slurry, consisting of active materials, conductive carbon, and PVDF binder solution for cathode electrodes, is prepared in a double planetary mixer (DPM) following specific formulations. The slurry is then coated onto Al foil using a slot-die coating machine and dried to fabricate a double-sided coated electrode with the desired loading [16,17,18]. However, the PVDF-based casting process for thick cathode electrodes has several limitations and drawbacks: (1) the use of N-methyl-2-pyrrolidone (NMP) as a solvent in the slurry poses environmental concerns, requiring the implementation of a heavy capital investment for NMP recovery system [19,20,21,22]; (2) the drying process consumes significant energy due to the high boiling point of NMP [16]; (3) challenges in manufacturability arise, including the preparation of highly concentrated flowable slurries and low slurry casting line speed [16]; and (4) electrode delamination can occur, especially for active materials with small particle sizes. For instance, the particle size (D50) of market-available NM75 material is 3 μm, and the thickness of the one-sided C-NM75 coating layer after calendaring is 89 μm at a capacity loading of 4.5 mAh/cm2. Accordingly, there are approximately 30 layers of NM75 particles within the active material layer. In the drying step, the evaporation of NMP solvent leads to the redistribution of the PVDF binder, conductive agents, and active material particles, resulting in reduced bonding strength between the active material layer and current collector [23,24,25,26,27].
An alternative approach that has gained more attention is the utilization of PTFE as the binder, either without or with a low-content processing solvent media, to fabricate thick cathode electrodes [28,29,30,31,32,33,34,35,36,37]. This fabrication method mainly involves three steps [28]: (1) powder mixing: PTFE particles are subjected to shearing force, resulting in the formation of fibrils. These fibrils tightly bind both the conductive carbon and active materials; (2) rolling/calendaring: the pre-treated powder is rolled or calendared to create a free-standing film; and (3) lamination: the free-standing film is then laminated onto the current collector. This process reduces the capital expenditures of the coater machine, eliminates the toxic and expensive NMP solvent, and saves manufacturing costs [28,29,30,31,32].
In this study, we aimed to find a low-cost and environmentally friendly fabrication process for achieving thick electrodes with good electrochemical performance. We compared the conventional PVDF-based slurry casting process with the PTFE-based fibrillating process for fabricating NM75 electrodes at high loadings (4.5 mAh/cm2). The electrochemical performance of pouch cells with these electrodes was systematically compared. The results showed that the pouch cells with F-NM75 electrodes exhibited significantly enhanced discharge and charge rate capabilities. These cells also demonstrated better low-temperature 1 C discharge capability and excellent cycling performance, with a capacity retention of 86% after 2200 cycles. Through hybrid pulse power characterization (HPPC) and electrode folding experiments, we identified that the performance improvement of F-NM75 electrodes was attributed to the unique interconnecting binding network formed by the fibrillated PTFE fibers. This binding network reduced cell resistance and enhanced the mechanical properties of the electrodes, leading to the observed improvements in electrochemical performance. The work introduces several novel aspects in the field of electric vehicle (EV) battery technology. Firstly, it introduces the adoption of cobalt-free NM75 chemistry as a cathode material. NM75 chemistry offers the potential for high energy density at a lower cost compared to traditional cobalt-containing NCM cathode materials. In addition, a thick electrode formulation has been developed, which is a notable advancement. This formulation allows for the higher loading of active materials, resulting in increased energy density with improved battery performance. Furthermore, the PTFE powder fibrilization process has been demonstrated as a universal technique applicable to various cathode chemistries and anode chemistry.

2. Materials and Methods

2.1. Materials

The cathode material NM75 was sourced from Ningbo Ronbay New Energy Technology Co., Ltd. (Ningbo, China). The anode material graphite was purchased from Hangzhou Future Power Technology Co., Ltd. (Hangzhou, China). Refer to Table S1 for detailed materials specifications of active materials. Current collectors included 16 μm aluminum foil and 10 μm copper foil. Super P® Li (SP, Imerys, Paris, France) and Ketjen black (KB) EC-600JD (GELON, Linyi, China) were used as conductive fillers. PVDF (Solvay5130, Solvay, Brussels, Belgium), PTFE (Teflon™ 601 X, Chemours, Wilmington, NC, USA), carboxymethyl cellulose (CMC, DAICEL2200, Daicel, Osaka, Japan), and styrene butadiene rubber (SBR, JSR TRD-104A, JSR, Tokyo, Japan) were used as binders.

2.2. Electrode Fabrication

A scheme of detailed PTFE-based powder fibrillating fabrication process is also provided (Figure S1). This method involves the following steps: (a) NM75 powder, PTFE powder, Super P, and KB were added according to the electrode formula (Table 1) and mixed in a mixer at a linear speed of 20 m/s for 30 min. A cooling jacket was used to maintain the temperature below 15 °C; (b) the pre-mixed materials were transferred to a Banbury mixer and mixed for an additional 20 min at 80 °C to obtain the admixture; (c) the admixture was pressed in a hot roller machine under a pressure of 60 tons at 100 °C to form a free-standing electrode film; (d) the free-standing electrode film was laminated onto the aluminum current collector using precoated conductive glue at 120 °C; (e) the NM75 electrode was pressed to the target press density using a calendar machine at 45 °C; and (f) the electrode was then punched into dimensions of 50 mm (W) * 55 mm (H) for further cell fabrication. This novel PTFE-based powder fibrillating process was also demonstrated universally in chemistries; in addition to NM75 material, we also fabricated thick LiMn0.7Fe0.3PO4 (LMFP) electrode and LiNi0.91Co0.05Mn0.03Al0.01O2 (NCMA) electrode and thick graphite electrode (Figure S2 and Table S2).
The C-NM75 cathode electrode was fabricated using the PVDF-based slurry casting process. The NM75 slurry was prepared in a double planetary mixer (Asada, Nagoya, Japan) based on the electrode formula provided in Table 1. To achieve a homogeneous distribution of all components, a kneading process was implemented in the mixer. This process involved breaking down the aggregation of conductive carbons through high shearing force at a relatively high solid content of 78%. NMP solvent was gradually added to the mixer under continuous mixing conditions until the solid content reached 69%. The slurry was double-sided and coated onto a C-coated aluminum foil using a slot-die coating machine. The coating process was conducted at a line speed of 5 m/min.
To keep the comparison under the same conditions except for the cathode processing, the graphite electrode was also fabricated through the traditional slurry casting process using the aqueous CMC/SRB binders and a solid content (48%) slurry. In this work, we selected large-size (D50 = 20 µm) graphite materials with a formula of high binder ratio (3.7 wt.%) to make 5.3 mAh/cm2 thick anode electrode.

2.3. Electrode Morphology Characterization

Scanning electron microscopy (SEM) images were collected on Zeiss Auriga-45-11 (Oberkochen, Germany).

2.4. Coin Cell Assembling and Specific Capacity Collection

The electrodes were initially cut into a diameter of 14 mm. The assembly of the coin cells involved using 16 mm diameter Li metal discs and Celgard EH2010 (Celgard, Charlotte, NC, USA) separator, which had a thickness of 20 μm. To assemble the coin cells, an electrolyte consisting of 1.0 M LiPF6 in EC/EMC (3/7, V/V) with 2 wt.% VC was used for characterization purposes. All the coin cells were assembled inside a high-purity argon glove box (MBRAUN, Munich, Germany). This glove box ensured that the oxygen and moisture levels were controlled below 0.1 ppm, providing a controlled environment for the assembly process.
The specific capacity collection of electrodes was performed at room temperature (25 °C) using the Maccor cycler (Series 4000, Tulsa, OK, USA). The NM75/Li cell was tested within a voltage range of 2.7–4.3 V, while the graphite/Li cell was tested within a voltage range of 0.01–2.0 V.

2.5. Pouch Cell Fabrication and Performance Testing

The pouch cells were fabricated through a series of steps in a dry room with a dew point of −45 °C. The process included stacking, wielding, pre-sealing, drying, electrolyte filling, formation, degassing, and final sealing. In the stacked assembling process, one double-sided graphite electrode was placed between two single-sided NM75 electrodes. These electrodes were separated by Celgard EH2010 separator. The dimensions of the NM75 electrode were 50 mm (W) * 55 mm (H), and the graphite electrode measured 52 mm (W) * 57 mm (H) (Figure S3). To achieve a balanced performance, the negative/positive (N/P) capacity ratio was controlled at 1.1–1.2. For the electrolyte, 1 M LiPF6 dissolved in EC/EMC (3:7, by volume) + 2 wt.%VC + 1 wt.% DTD was used in the pouch cells.
Pouch cells were compressed under a pressure of 9 psi using a test fixture including two pieces of insulated steel plates, one piece of silicon rubber foam as the spacer, and four screws [38]. The Maccor cycler (Series 4000, Tulsa, OK, USA), coupled with WVC thermal chamber (Weiss Technik, Lindenstruth, Germany), was employed for pouch cell performance testing.
During the formation process of the pouch cells, a constant current and constant voltage (CCCV) protocol was utilized. The cells were charged at a constant current of C/20 until they reached a voltage of 4.2 V, then charged at a constant voltage (CV) of 4.2 V until the charging current dropped to C/100. The cells were discharged at C/5 to 2.7 V.
For discharge rate test, the cells were charged at C/3 following CCCV protocol with a C/20 taper. Then, cells were discharged at various C-rates, including C/10, C/5, C/3, 1 C, 2 C, and 3 C. Each C-rate was repeated three times to ensure accuracy and consistency in the test results.
In charge rate test, the cells were always discharged at C/3 to 2.7 V and charged under CCCV mode at various C-rates (C/10, C/5, C/3, 1 C, and 2 C) to 4.2 V with the same cut-off current of C/20 during the CV step. Each C-rate was run for 3 cycles, but only the constant current capacity parts were adopted for comparison in this work.
During the 1C discharge capacity test at cold temperatures, the cells were first fully charged at 25 °C using a C/3 CCCV protocol with a C/20 taper. Then, the cells were transferred to a thermal chamber and soaked at the specified test temperature (0 °C, −10 °C, and −20 °C) for a duration of 6 h. After soaking period, we discharged the cells at 1C to 2.7 V.
In the C/3 cycling test, cells were charged following C/3 CCCV protocol to 4.2 V with a C/20 taper and discharged at C/3 to 2.7 V. A reference performance test (RPT) was conducted after every 100 cycles to collect cells’ direct current resistance (DCR). The DCR test was conducted by applying a 10 s discharge pulse at a rate of 1C (50% state of charge (SOC)) and at a temperature of 25 °C. The DCR values were calculated by dividing the voltage difference by the current difference observed during the 10-s interval.
Hybrid pulse power characterization (HPPC) test of G1 and G2 cells was conducted following GM16460 specification [39]. The cells were charged and discharged following C/3 CCCV protocol but with a C/100 taper. The C/3 CCCV discharge capacity was used to adjust the SOC for the DCR test. After that, the cells were charged under C/3 CCCV protocol to 4.2 V with a C/100 taper, followed by 1 h rest, discharged at C/3 to 95% SOC, followed by 3 h rest, discharged at 1 C for 20 s, followed by 40 s rest, and charged at 1 C for 20 s, followed by 60 s rest. Then, we discharged cells at C/3 to another SOC for DCR test until 5% SOC.

3. Results and Discussion

3.1. Electrode Morphology and Coin Cell Evaluation

The detailed electrode information of the three types of electrodes used in this work is listed in Table 1.
The SEM micrographs revealed significant differences between the F-NM75 electrode (Figure 1a) and the C-NM75 electrode (Figure 1b). In the F-NM75 electrode, the morphology showed a unique structure where fibrillated PTFE fibers formed an interconnected bonding network that hosted the active material and conductive carbons. The NM75 particles were surrounded by conductive carbons, creating an effective electronic conductive network within the electrode. On the other hand, the C-NM75 electrode depicted a different morphology (Figure 1b). The carbons were not evenly distributed on the NM75 surface but rather concentrated in certain spots. The carbon distribution status with NM75 electrodes was also confirmed by EDX results (Figure S4). This uneven distribution of carbons could be attributed to the drying step during the evaporation of the NMP solvent from the NM75 slurry film coated on the aluminum foil. During the drying step, the dissolved PVDF binder and conductive fillers floated and agglomerated due to capillary action and diffusion, leading to the uneven distribution of the electrode components [40].
In Figure 1c, the morphology of the thick anode electrode revealed the presence of large graphite particles (D50 = 20 µm). The specific capacity of both NM75 electrodes and the graphite anode was tested in half-coin cells. The results are listed in Table 1 and shown in Figure 1d. The F-NM75 (green) electrode displayed an identical capacity vs. voltage curve to the C-NM75 (black) electrode with a comparable specific capacity at ~179 mAh/g. The blue curves in Figure 1d demonstrate the lithiation and delithiation processes of the graphite electrode, showing typical three-phase transformation zones [41].

3.2. Pouch Cell Design Table

We assembled the bilayer pouch cells to investigate the influence of cathode fabrication processing on battery cell performance. The detailed pouch cell design information is listed in Table 2.

3.3. Electrochemical Performance of Pouch Cells

3.3.1. Discharge Rate Test at 25 °C

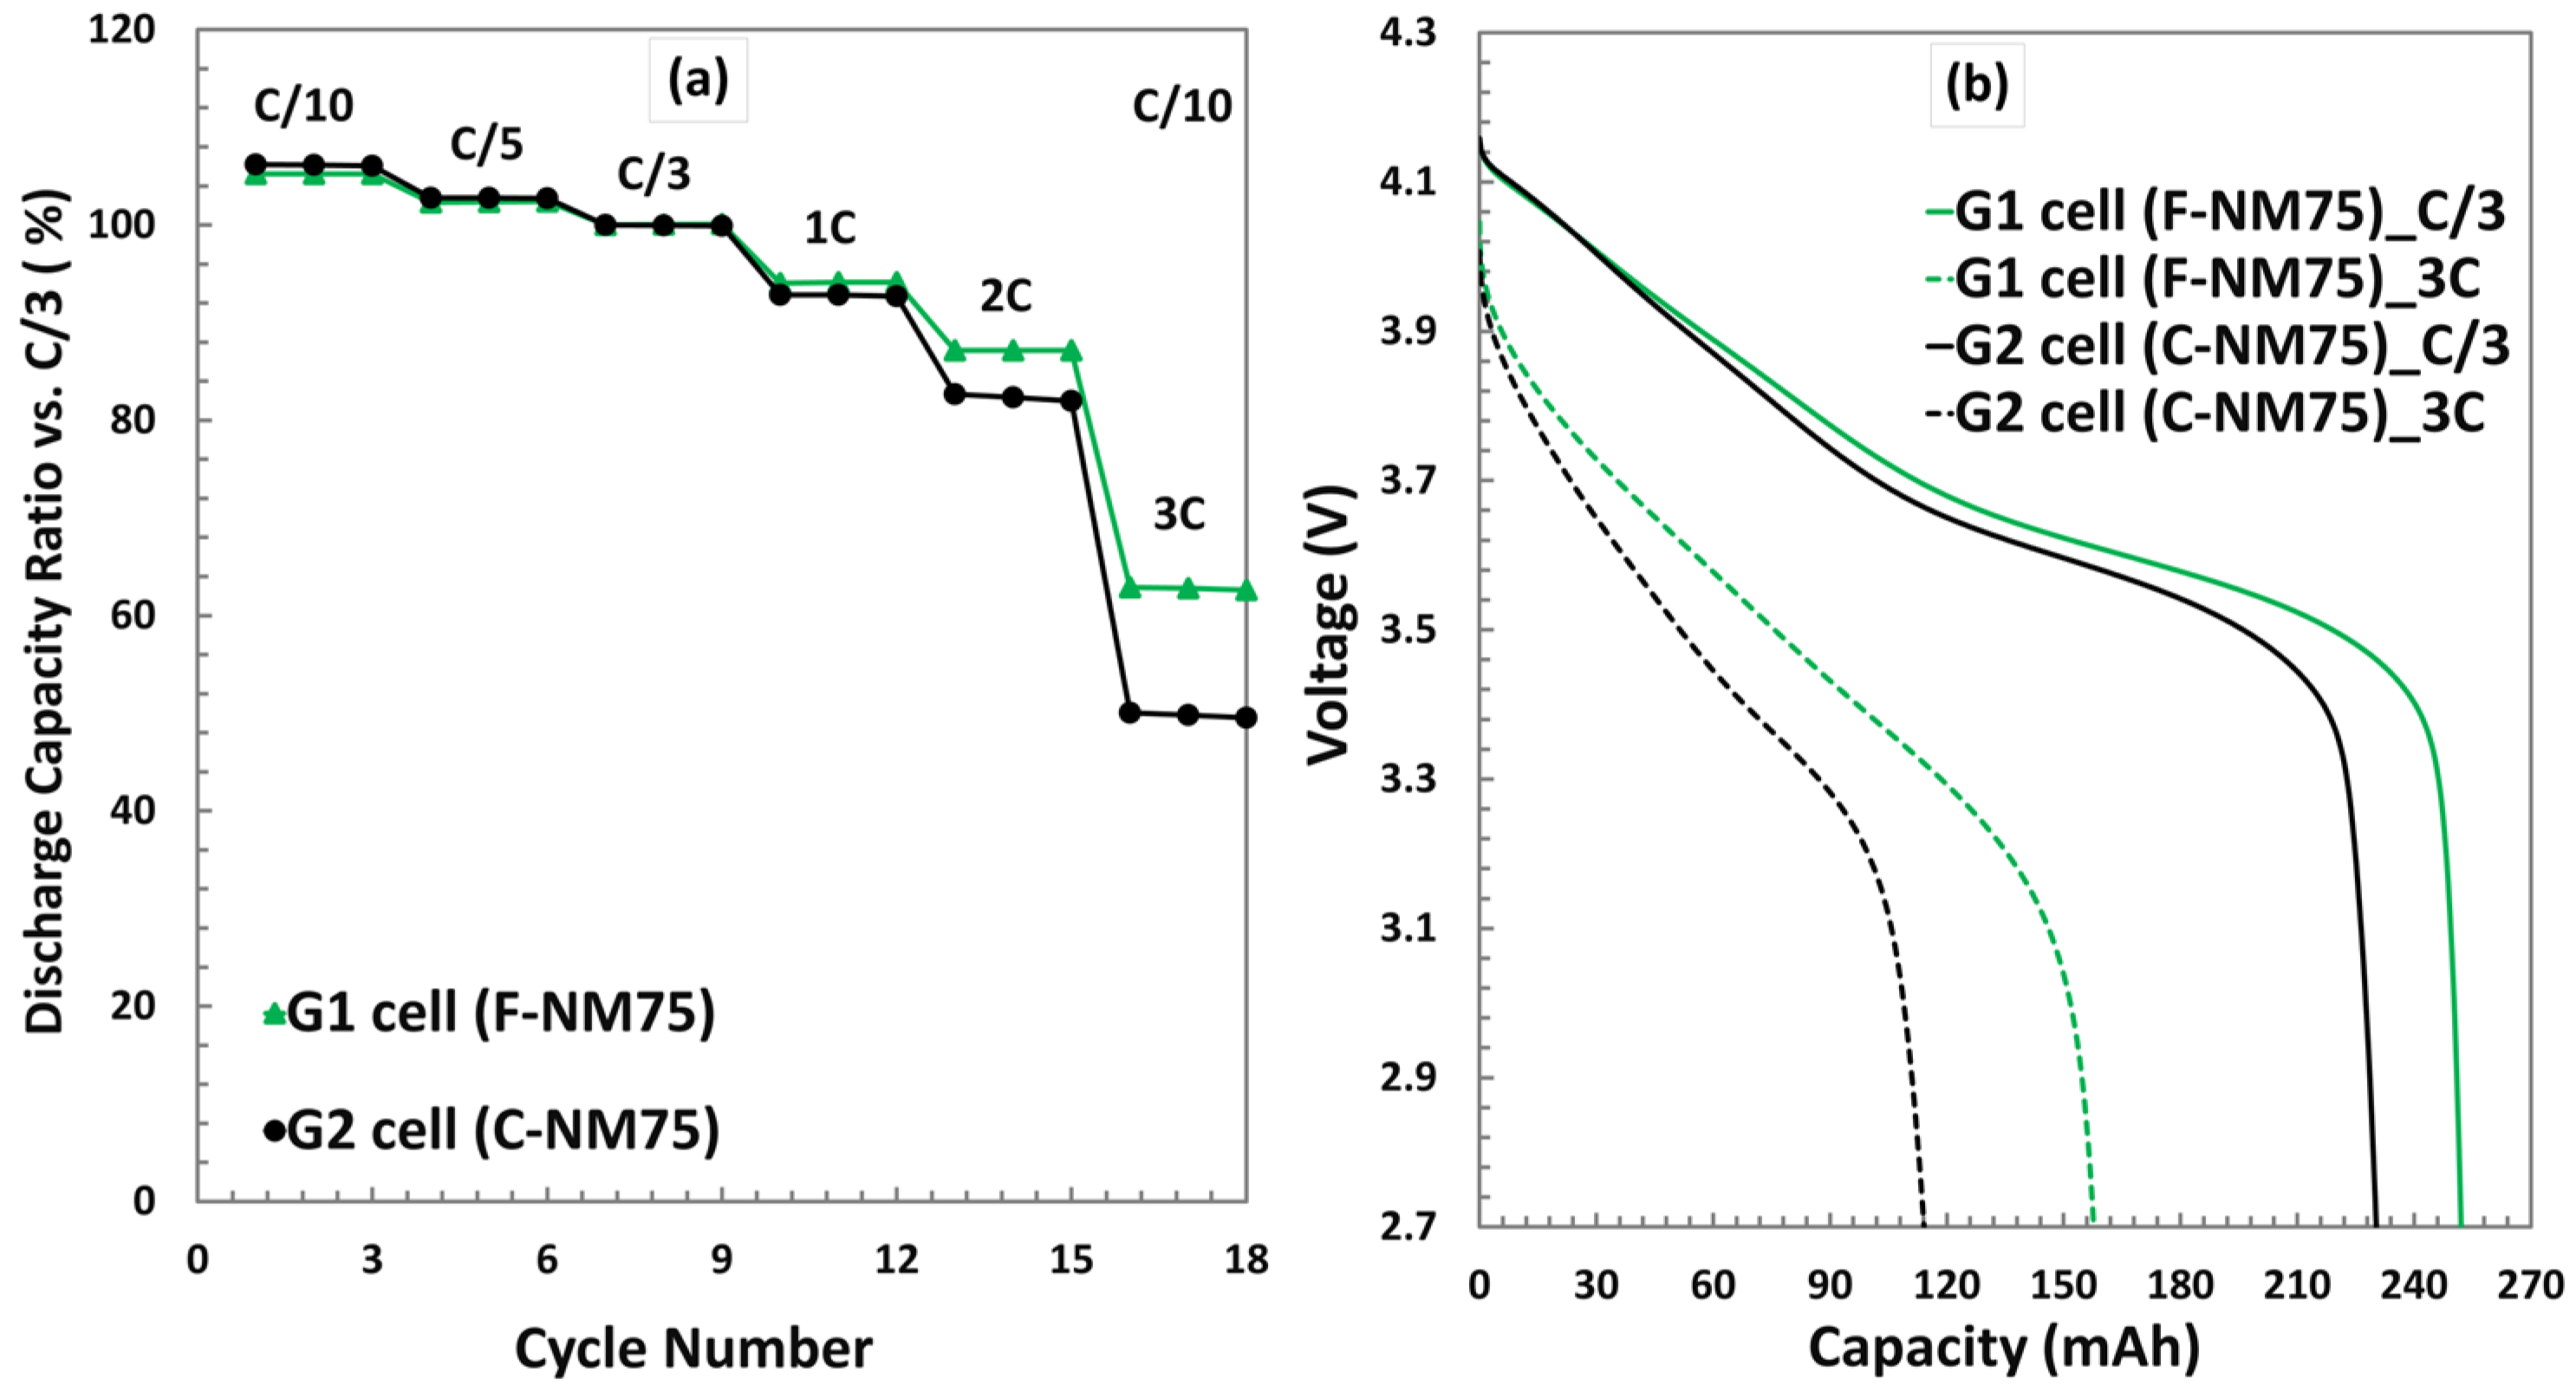
Figure 2a compares the discharge rate performance of G1 and G2 cells at room temperature. It is observed that all cells exhibited similar rate capabilities for C-rates below 1. However, at higher C-rates, the discharge capacities started to deviate noticeably. The G1 cell with F-NM75 electrodes demonstrated significantly increased discharge rate capability for C-rates higher than 1. Specifically, at 2 C and 3 C, the discharge capacity ratios (vs. C/3) were 87.1% and 62.6%, respectively, which were 5.8% and 13.8% higher than those of the G2 cells with C-NM75 electrodes. Figure S5 provides a summary of the voltage profiles of the G1 and G2 cells at different C-rates. Representative discharge curves corresponding to a rate of C/3 and 3 C are plotted in Figure 2b. At C/3, both the G1 and G2 cells demonstrated comparable average discharge voltage (3.70 V) and delivered discharge capacities of 252.1 mAh and 230.3 mAh, respectively. These discharge capacities align well with the pouch cell design target (Table 2). When the discharge current increased to 3 C, the G1 cell with F-NM75 electrodes exhibited a larger discharge capacity of 157.7 mAh. This resulted in an increased capacity gap between the G1 cell and the G2 cell, which grew from 21.8 mAh to 43.6 mAh.
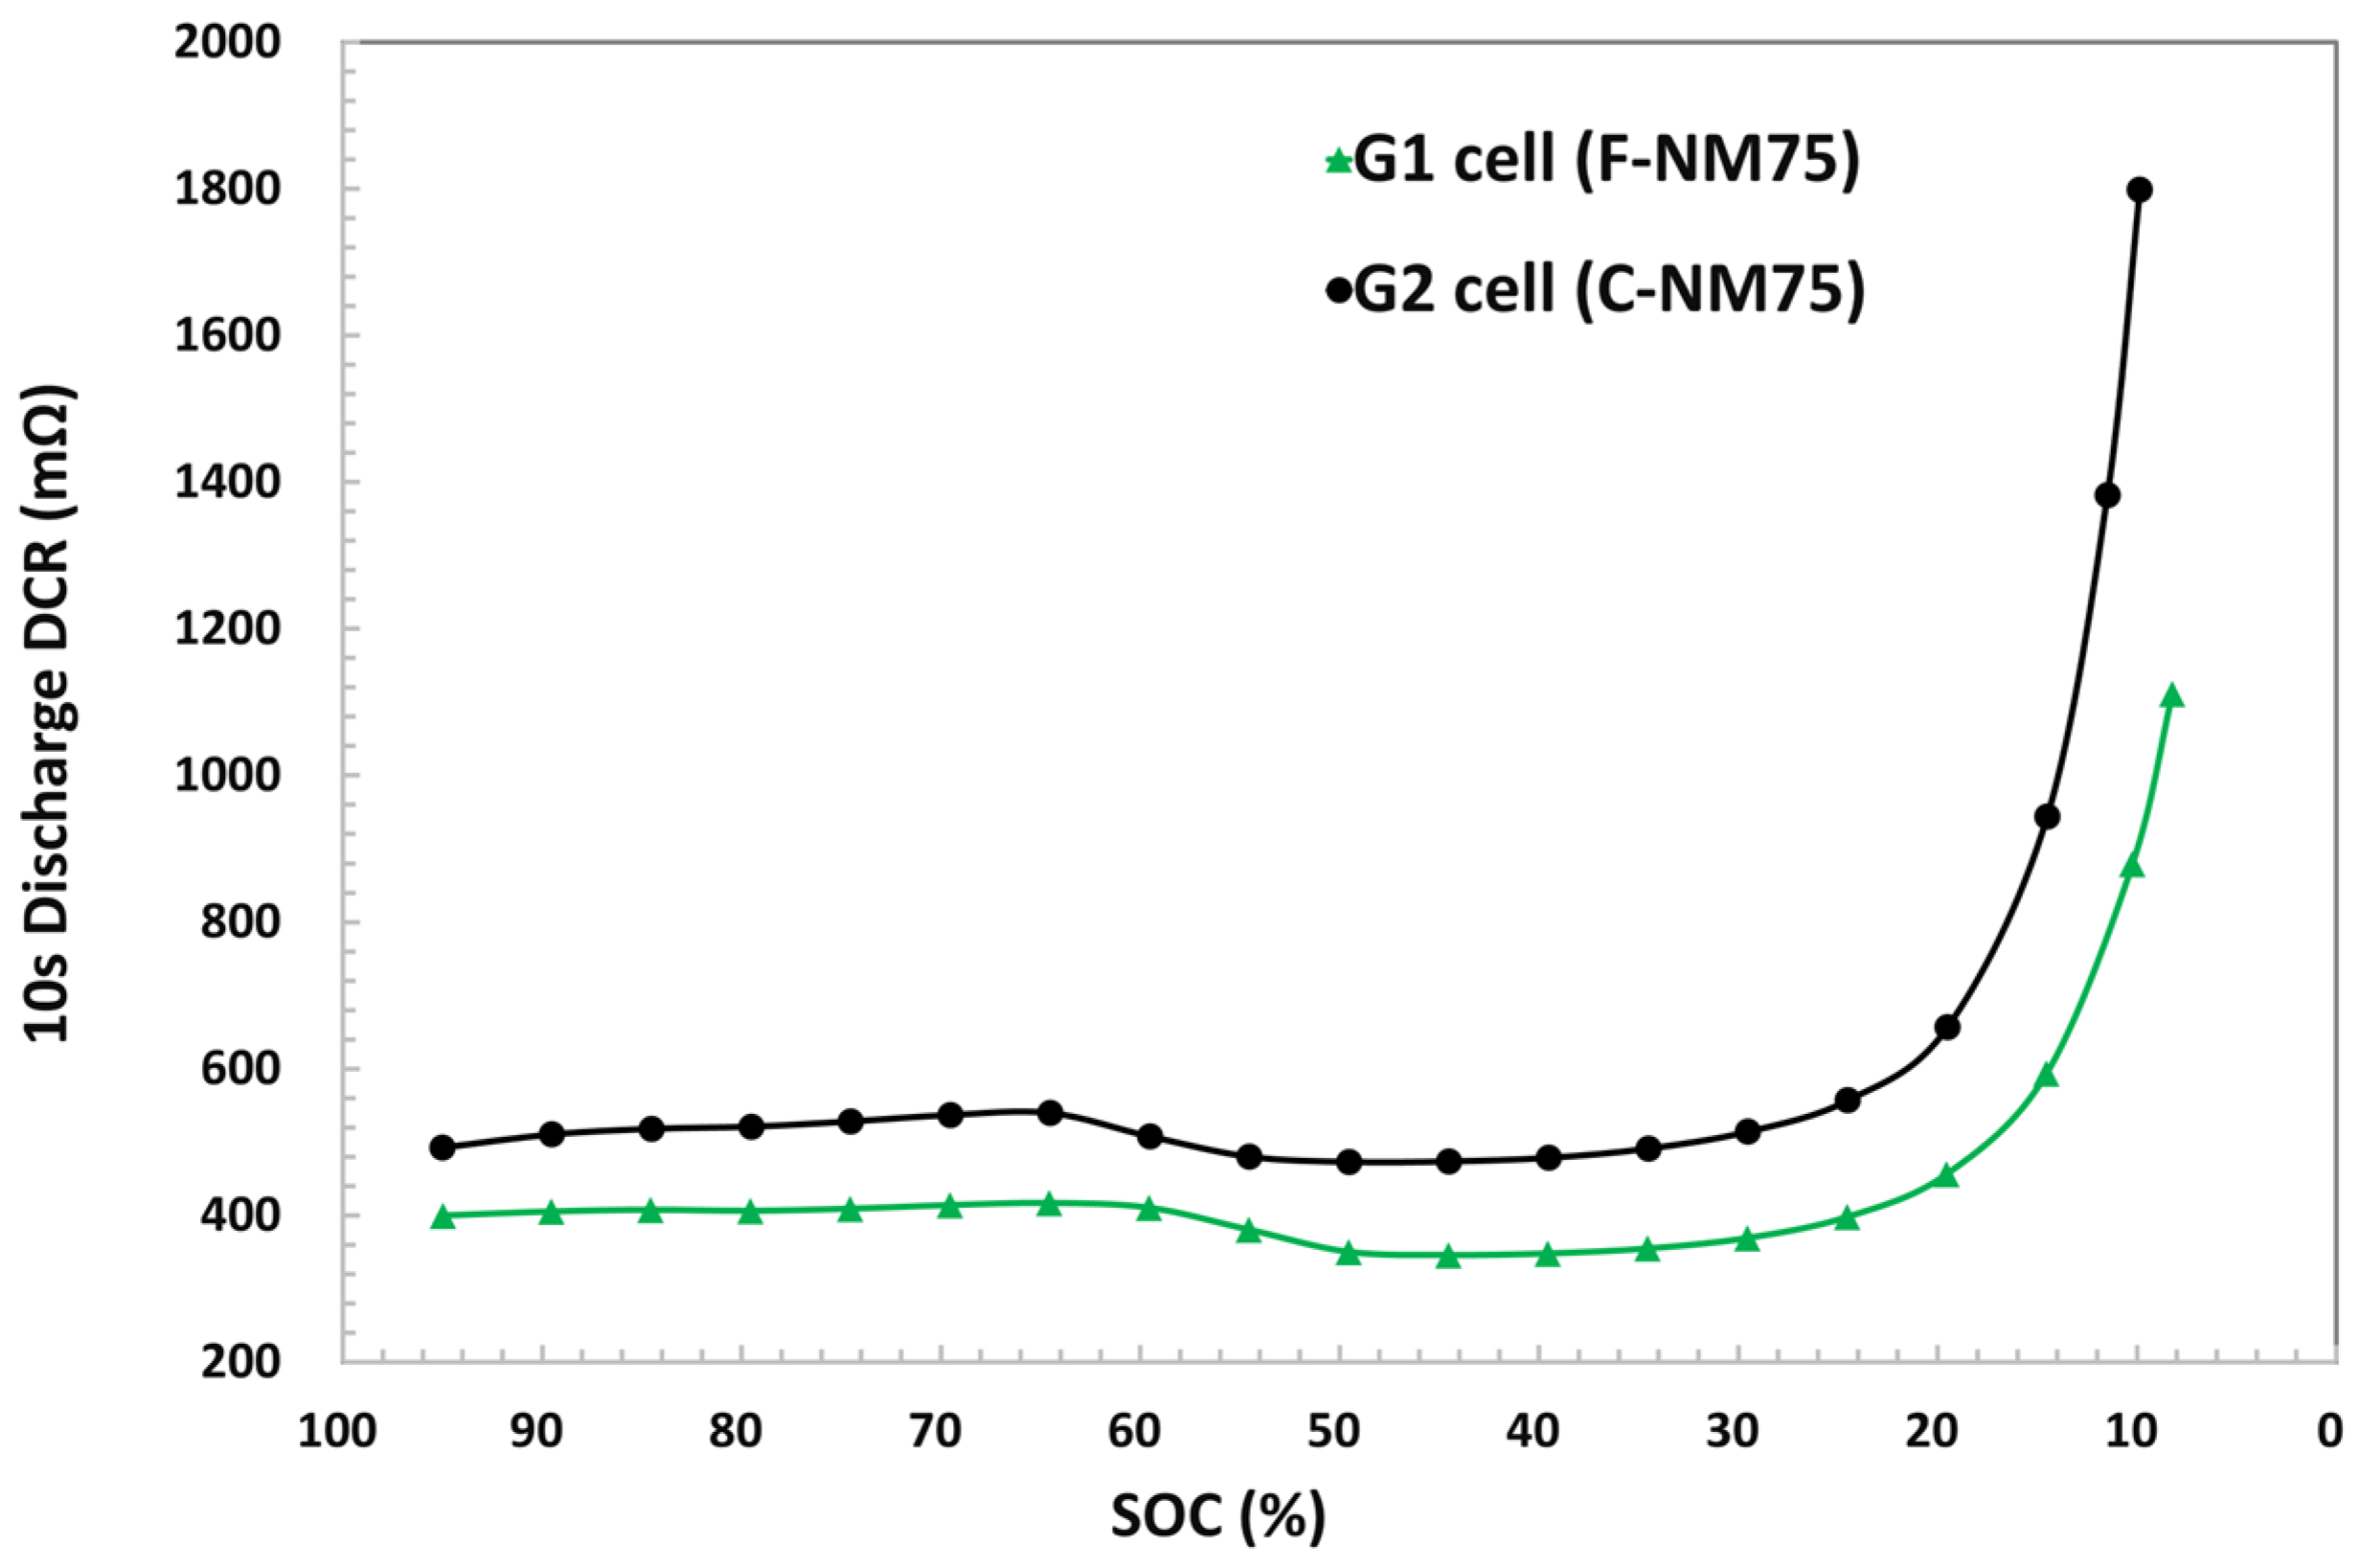
The internal resistance of a cell plays a significant role in determining its rate capability. The study conducted by Onda and Pan compared different methods of collecting internal resistance data for batteries. The methods included the U-I constant current charge/discharge cycle, open circuit voltage and voltage difference (OCV-V), HPPC, and alternating current (AC) impedance measurement. They found that the HPPC method was able to accurately measure the internal resistance of the battery [42,43]. The HPPC test calculates cells’ internal resistance values by dividing the voltage difference by the current difference during specific intervals. These resistance values encompass all internal resistance components within the cell, such as ohmic resistance and charge transfer resistance (Rct), and are referred to as lump resistance. By obtaining resistance values through the HPPC test over the cell’s usable SOC range, valuable insights can be gained into the reasons behind the improved performance of the G1 cell.
Figure 3 compares the 10 s discharge resistance from the HPPC test for the representative G1 cell (green) and G2 cell (black). The observed cell resistance trend in this study was comparable to results from other LFP cells [44]; the resistance was fairly constant in the range of hybrid operation between 25% and 95% SOC. The G1 cell exhibited significantly lower resistance throughout the entire SOC range compared to the G2 cell. For example, at 50% SOC, the discharge resistance values for the G1 and G2 cells were 350.2 mΩ and 472.6 mΩ, respectively. In the discharge rate test, as the discharge current increases, the energy consumed by the internal resistance of the cell increases, resulting in a decrease in the transferable available capacity [45]. The lower resistance allowed for the higher power capability of a battery cell, enabling it to deliver or receive higher power while staying within safe operating SOC ranges [46,47]. The resistance results align well with the discharge rate performance shown in Figure 2.

3.3.2. Charge Rate Test at 25 °C

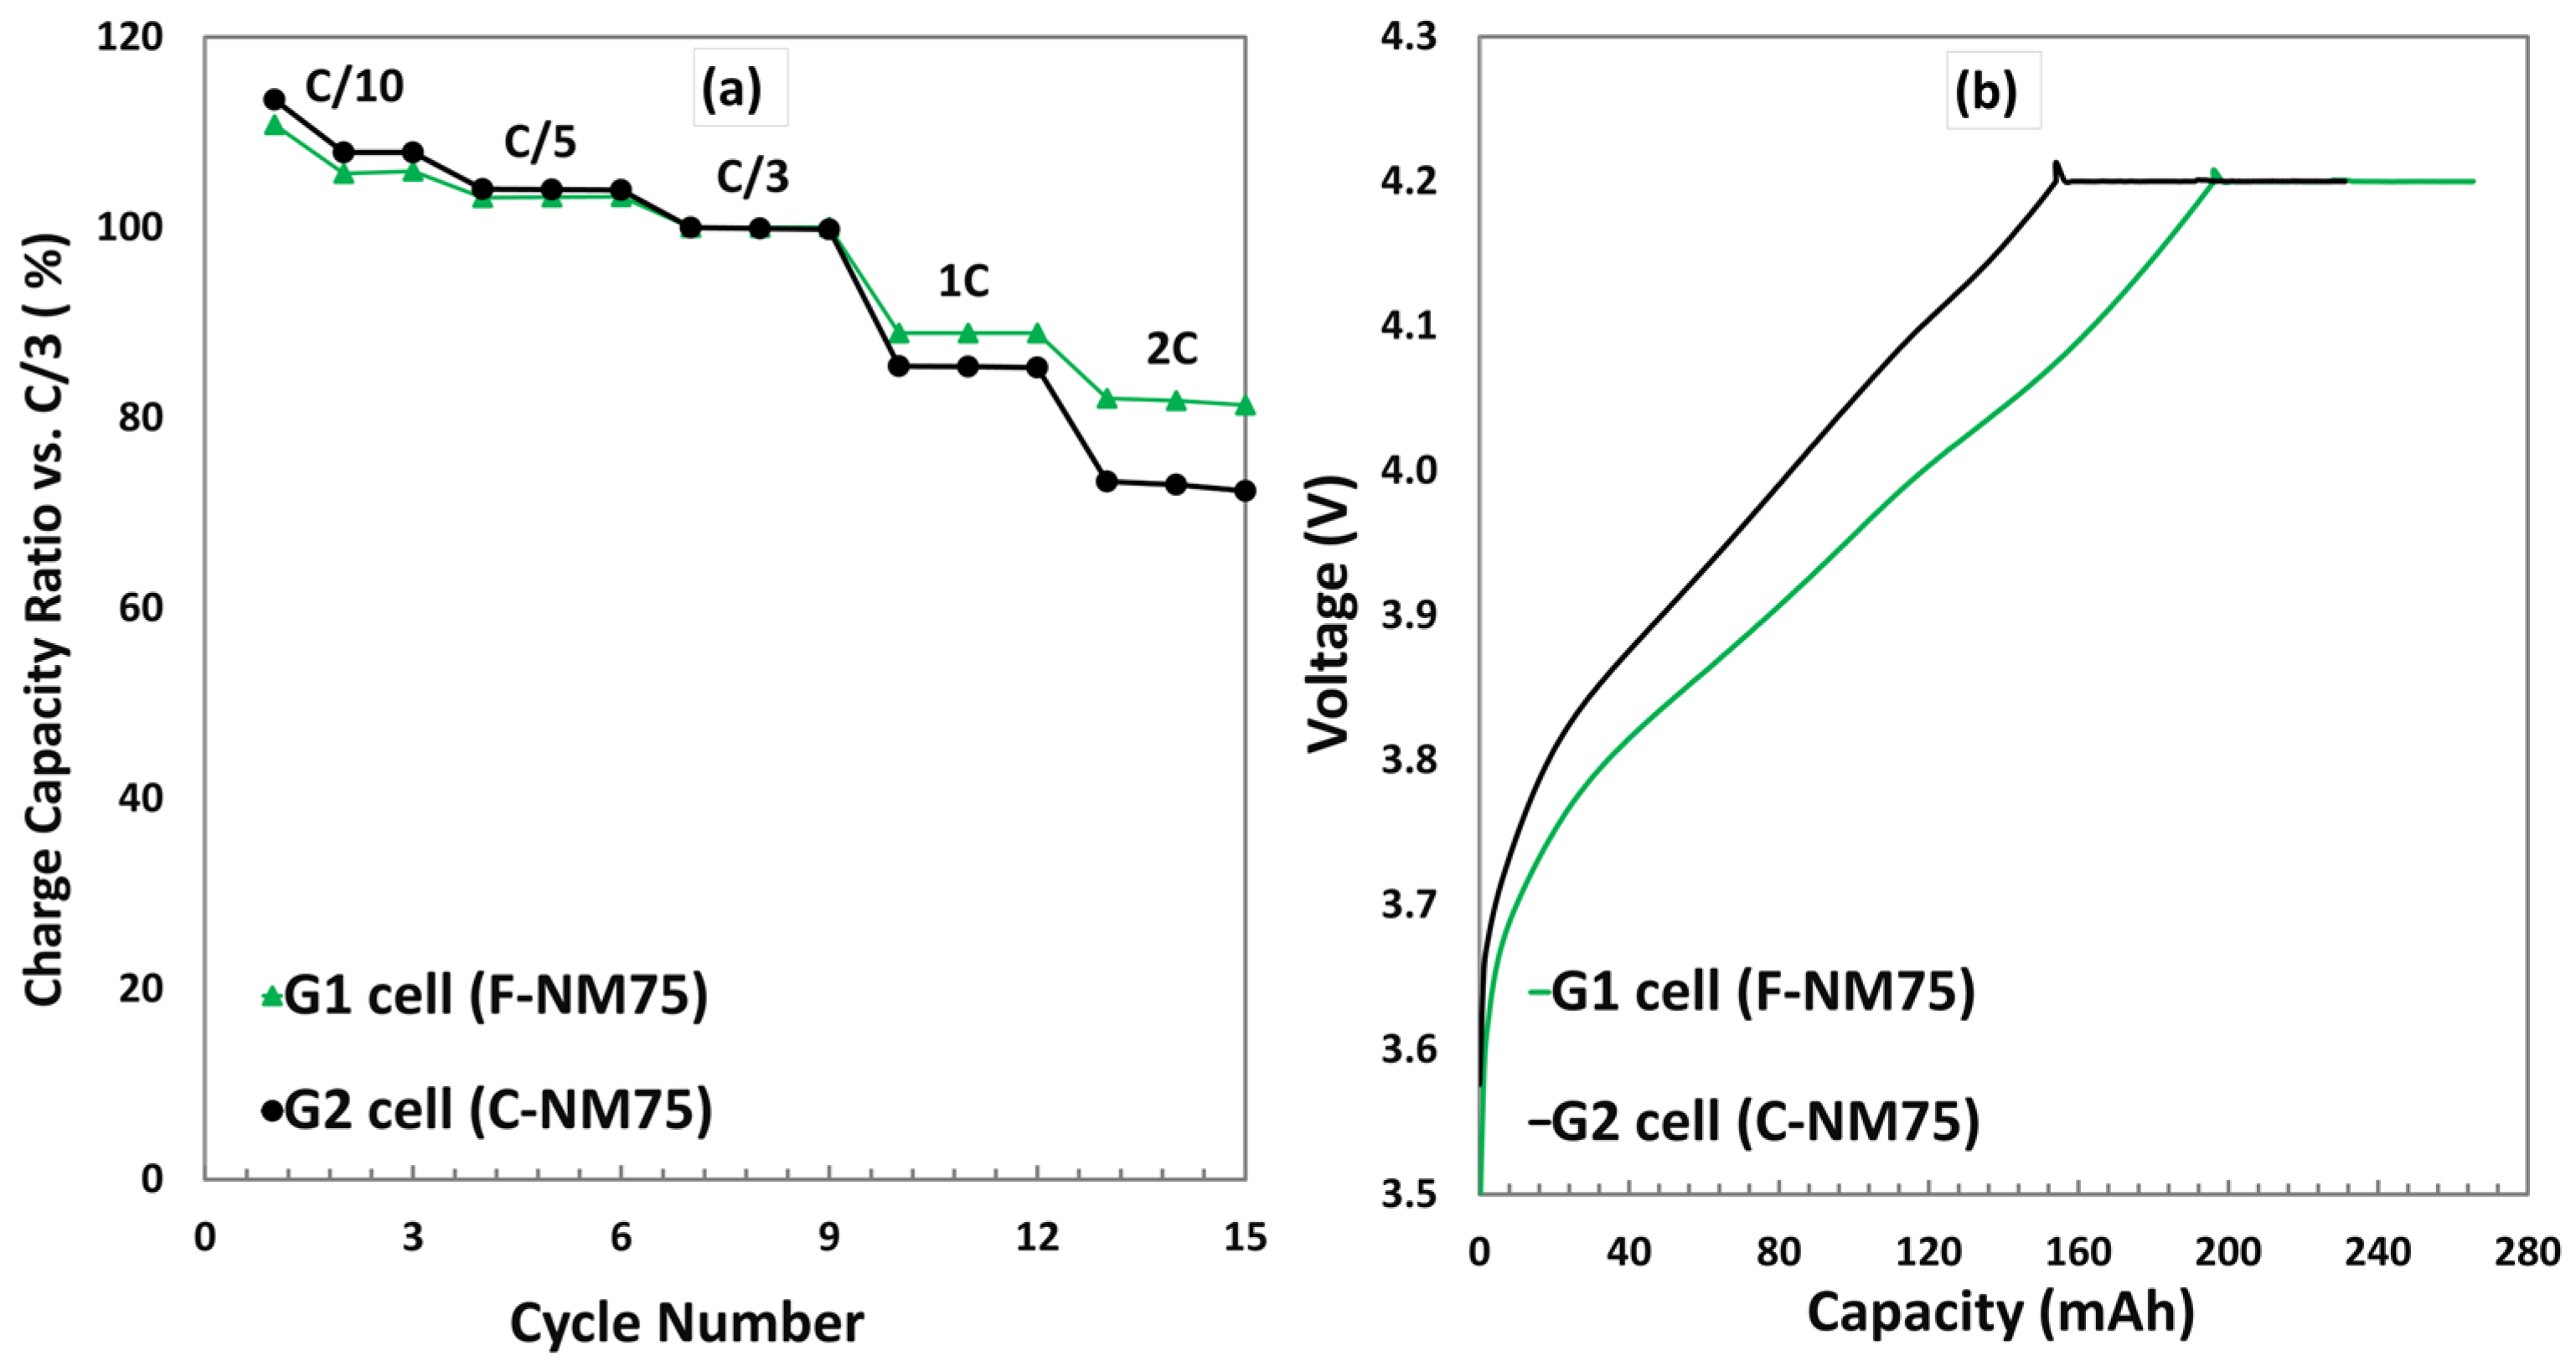
Figure 4a compares the charge rate performance of G1 and G2 cells. All cells showed very similar rate capabilities for C-rates below C/3. At higher C-rates, the discharge capacities deviated distinguishably. The G1 cell with F-NM75 electrodes exhibited an enhanced charge rate capability, with the advantage becoming more pronounced as the charge current increased. The charge capacity ratios (compared to C/3) at 1 C and 2 C for the G1 cell were 88.9% and 81.8%, respectively. These values were approximately 3.5% and 8.8% higher than those of the G2 cells. Figure S6 provides a summary of the voltage profiles of the G1 and G2 cells at different charging C-rates. Representative discharge curves corresponding to 2 C are plotted in Figure 4b. Compared with the G2 cell with C-NM75 electrodes, the G1 cell with F-NM75 electrodes (shown in the green curve) demonstrated both a constant current charge capacity (197 mAh) and a much lower charging voltage.
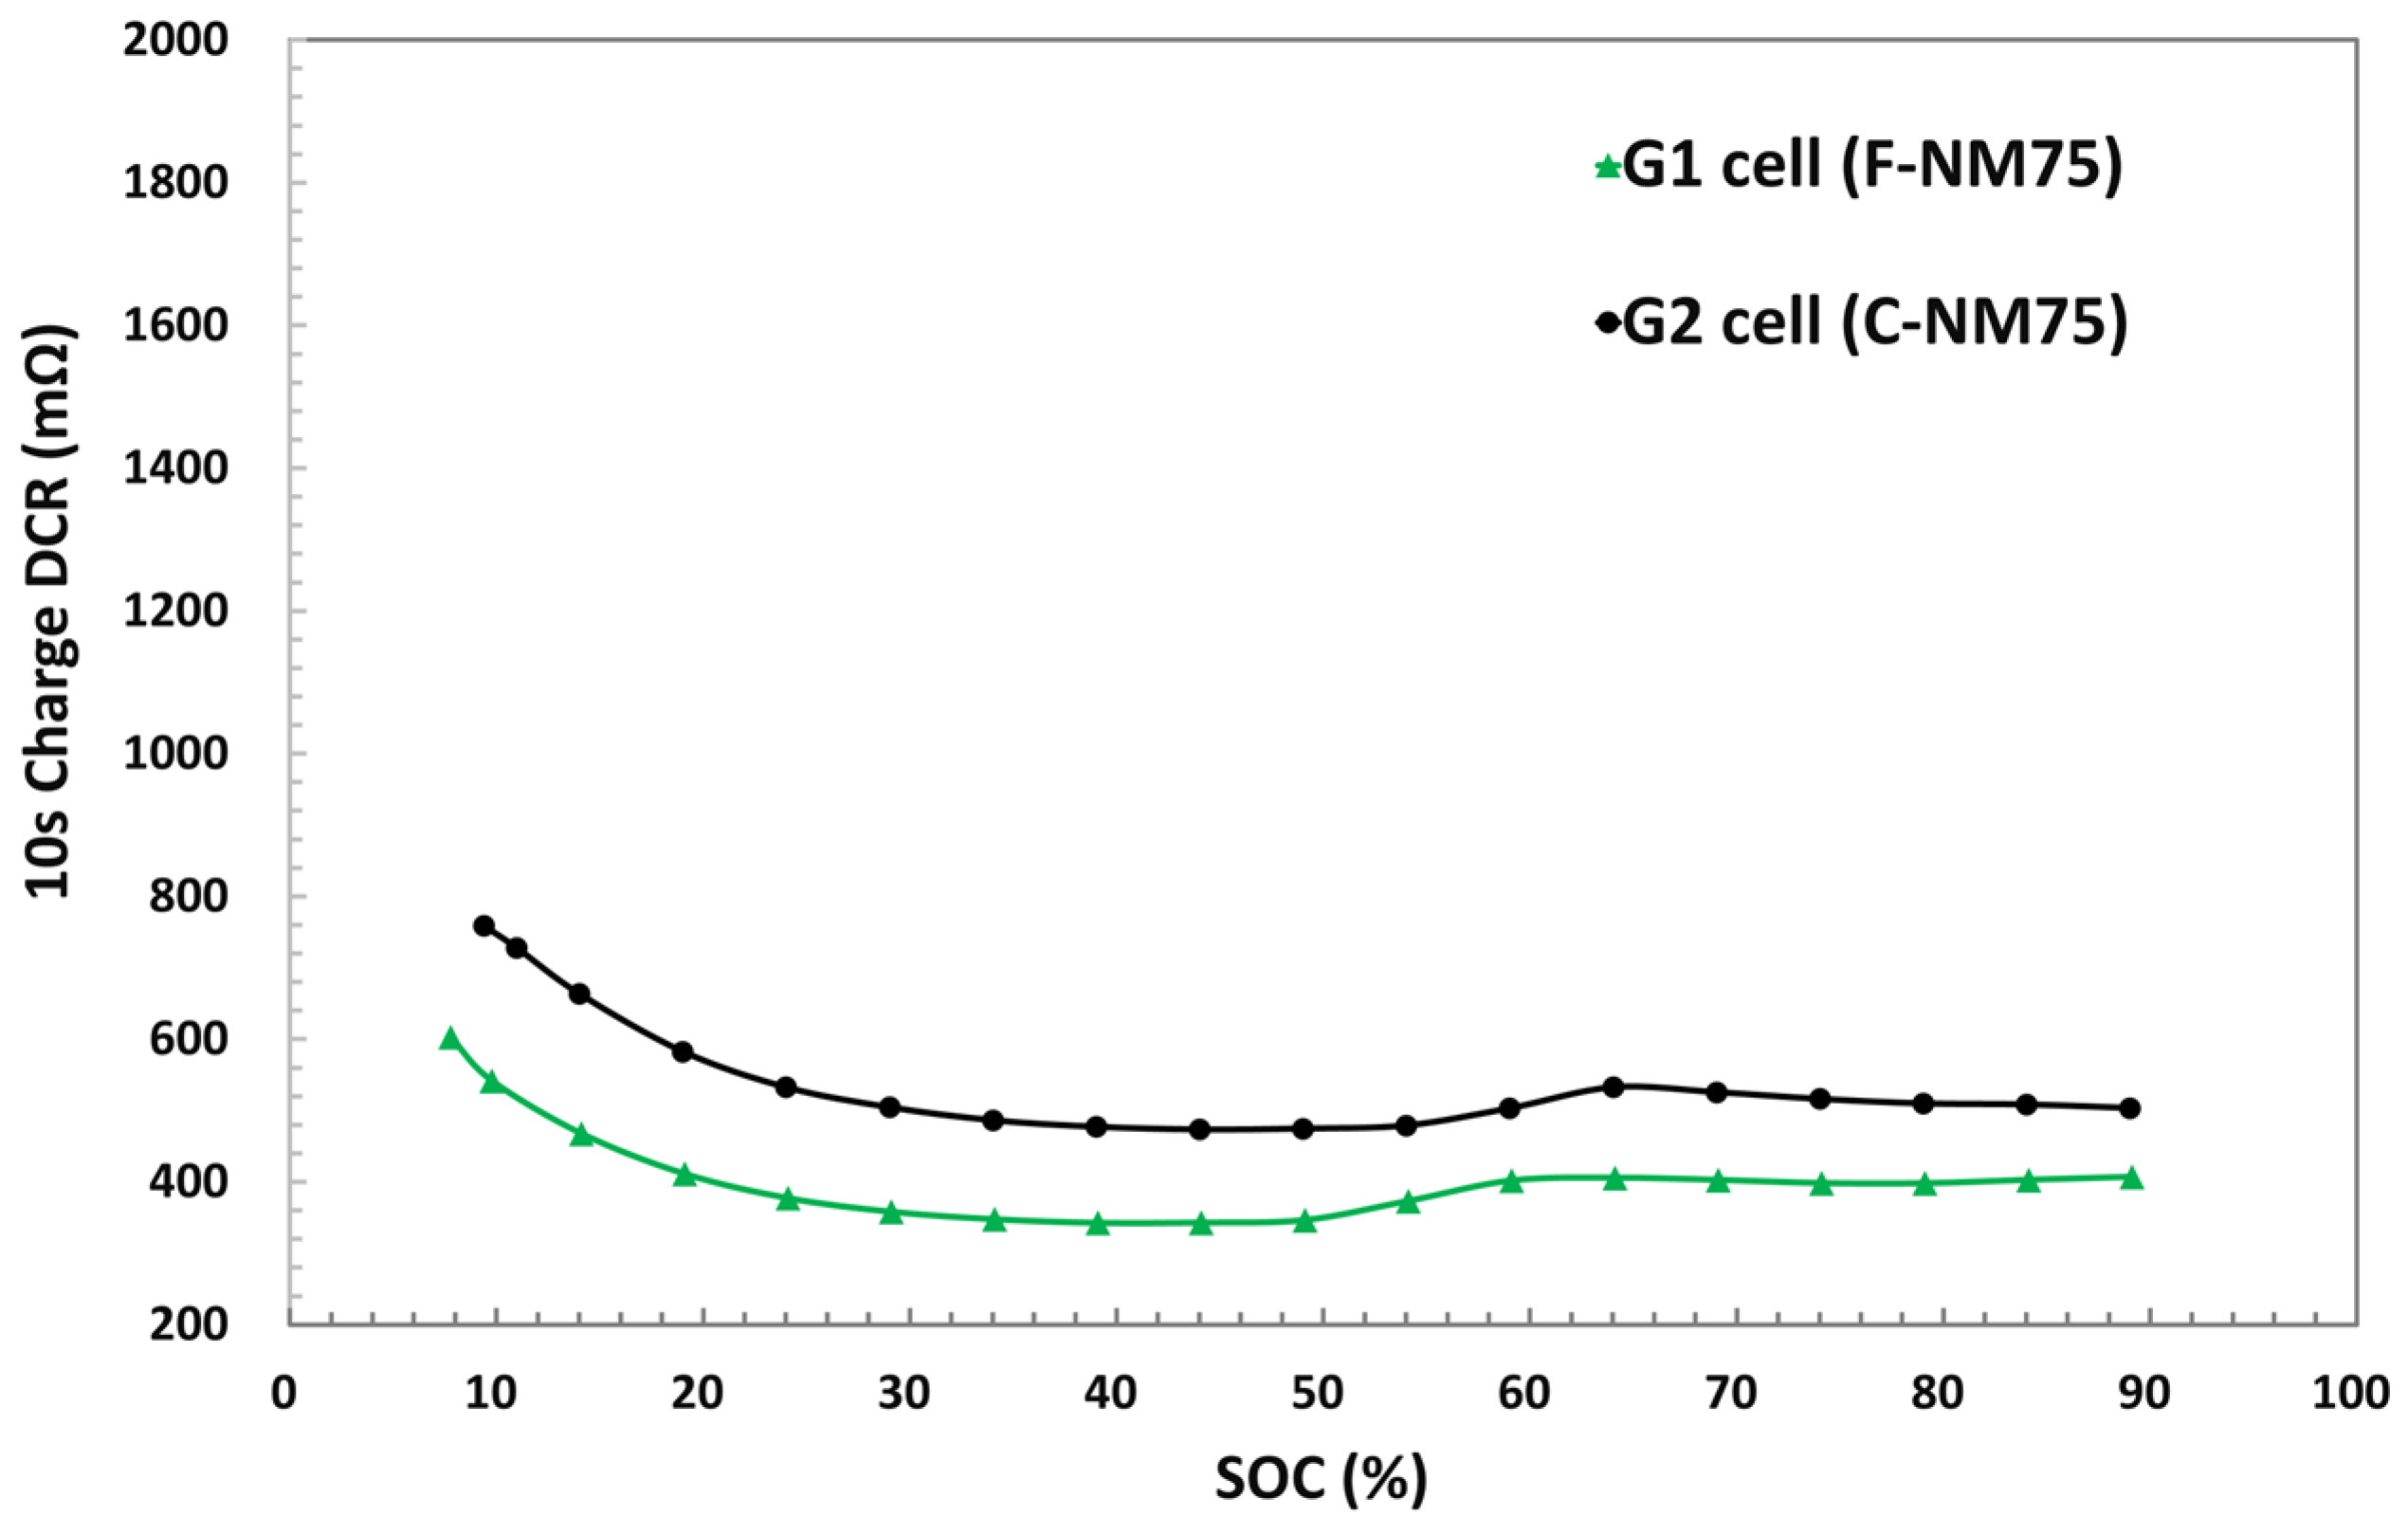
Figure 5 presents the 10 s charge resistance data collected through the HPPC test. The charge resistance values were comparable to the discharge resistance values at each SOC. The G1 cell also exhibited lower charge resistance throughout the whole SOC range. For instance, at 50% SOC, the charge resistance value for the G1 cell was 346.6 mΩ, which is approximately 36.9% lower than that of the G2 cell (474.6 mΩ). The lower resistance of the G1 cell allowed for more buffer room to handle the voltage rise caused by polarizations before reaching the upper voltage limit (4.2 V), which resulted in higher constant current charge capacities during the high C-rate charge process. The resistance values collected from the HPPC test encompassed all internal resistance components within the cell and were referred to as lump resistance. We further broke down the resistance value into charge transfer resistance through the EIS test and ohmic resistance using the electrode resistivity test. The Nyquist plot of F-NM75 (Figure S7) showed a lower impedance in the high-medium frequency region, specifically in the Rct, compared to C-NM75. The impedance values for F-NM75 and C-NM75 are 4.16 Ω and 8.75 Ω, respectively. Additionally, the resistivity of the NM75 electrode was measured under a 25 Mpa pressure with a sample size of 1.54 cm2. The resistivity of the F-NM75 electrode was identified to be 35.4 Ω·cm, which is half of the resistivity of the C-NM75 electrode (75.0 Ω·cm). The lower Rct and smaller electrode resistivity of the F-NM75 electrode contribute to the improved rate performance of G1 cells.

3.3.3. 1 C Discharge Capacity at Cold Temperatures

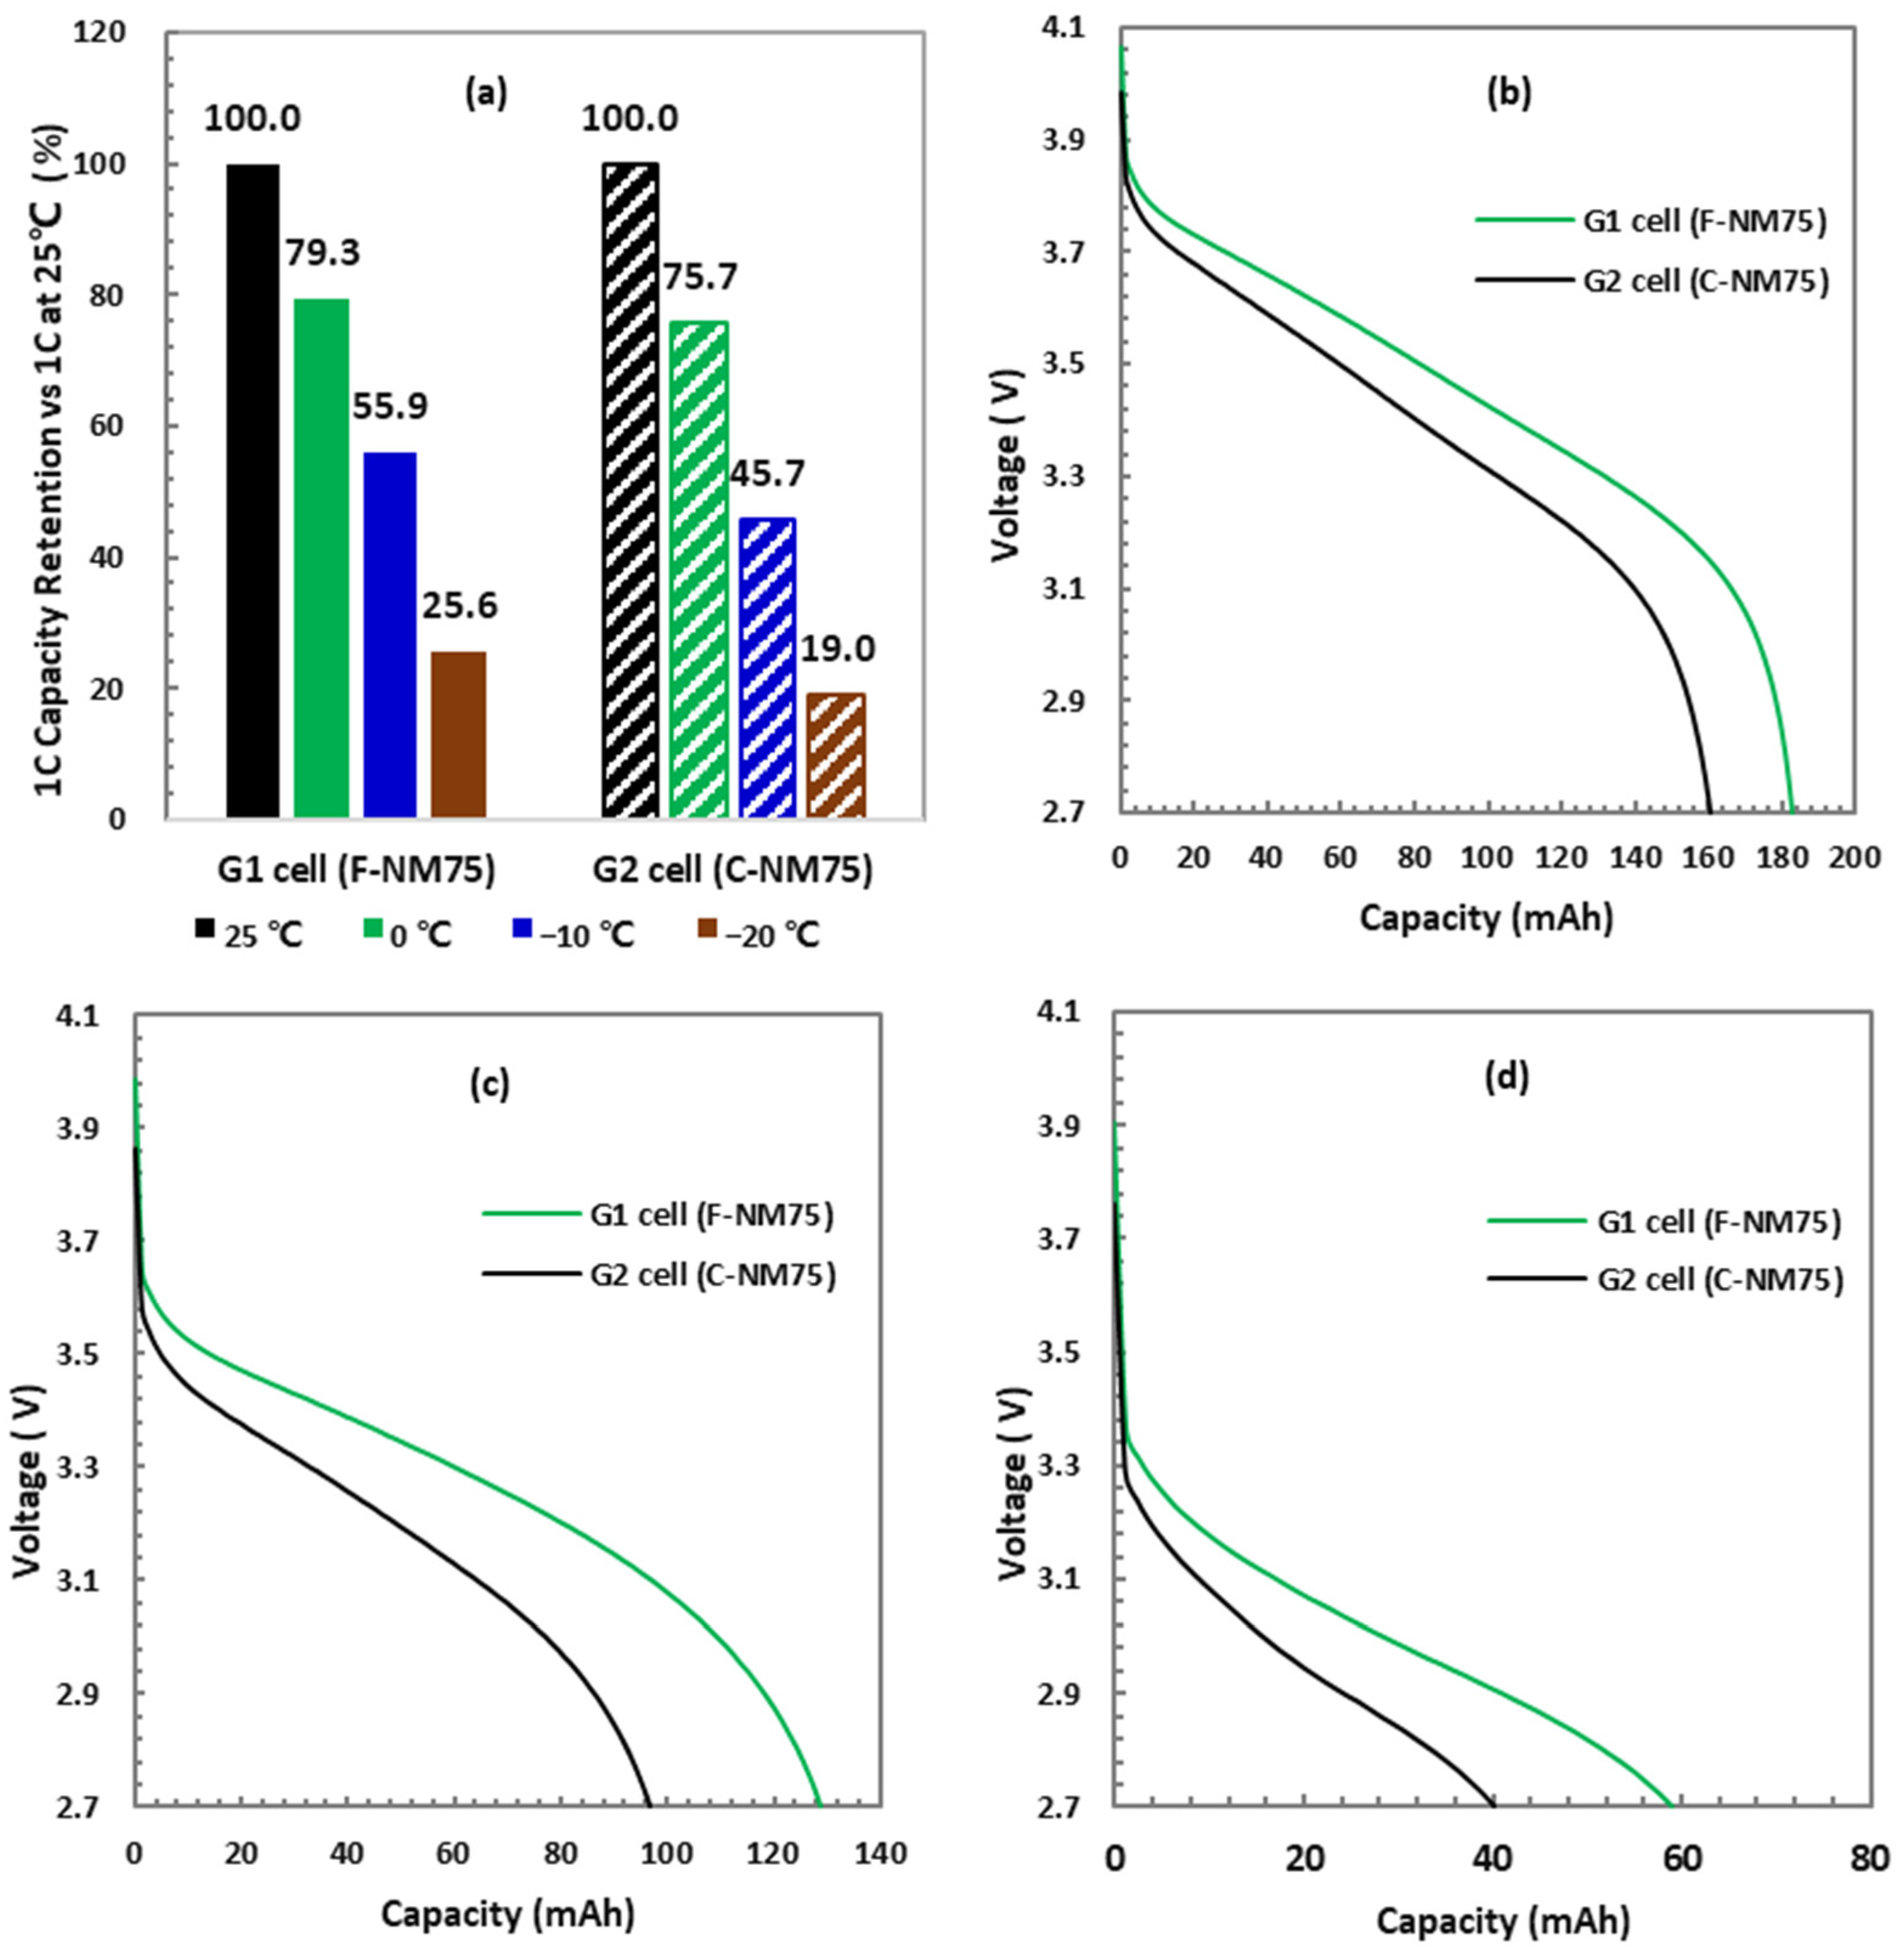
A cell’s discharge capability at cold temperatures is an important factor in determining the driving range of electric vehicles during the winter season [48]. In this study, the 1 C discharge capability of G1 and G2 cells was compared at different testing temperatures (−20 °C, −10 °C, and 0 °C). As shown in Figure 6a, the G1 cell exhibited higher 1 C capacity retention than G2 cells at various cold temperatures; the lower the temperature, the more margins on capacity retention. The 1 C discharge capacity ratios of the G1 cell at 0 °C, −10 °C, and −20 °C were 79.3%, 55.9%, and 25.6%, respectively. These values were approximately 3.6%, 10.2%, and 6.6% higher than those of the G2 cell with C-NM75 electrodes. Figure 6b–d compared the 1C discharge curves of the cells at cold temperatures of 0 °C, −10 °C, and −20 °C, respectively. The G1 cell with F-NM75 electrodes demonstrated clear advantages in discharge capability at cold temperatures, exhibiting larger discharge capacity. The lower resistance of the G1 cell contributed to better discharge capacity retention at low temperatures.
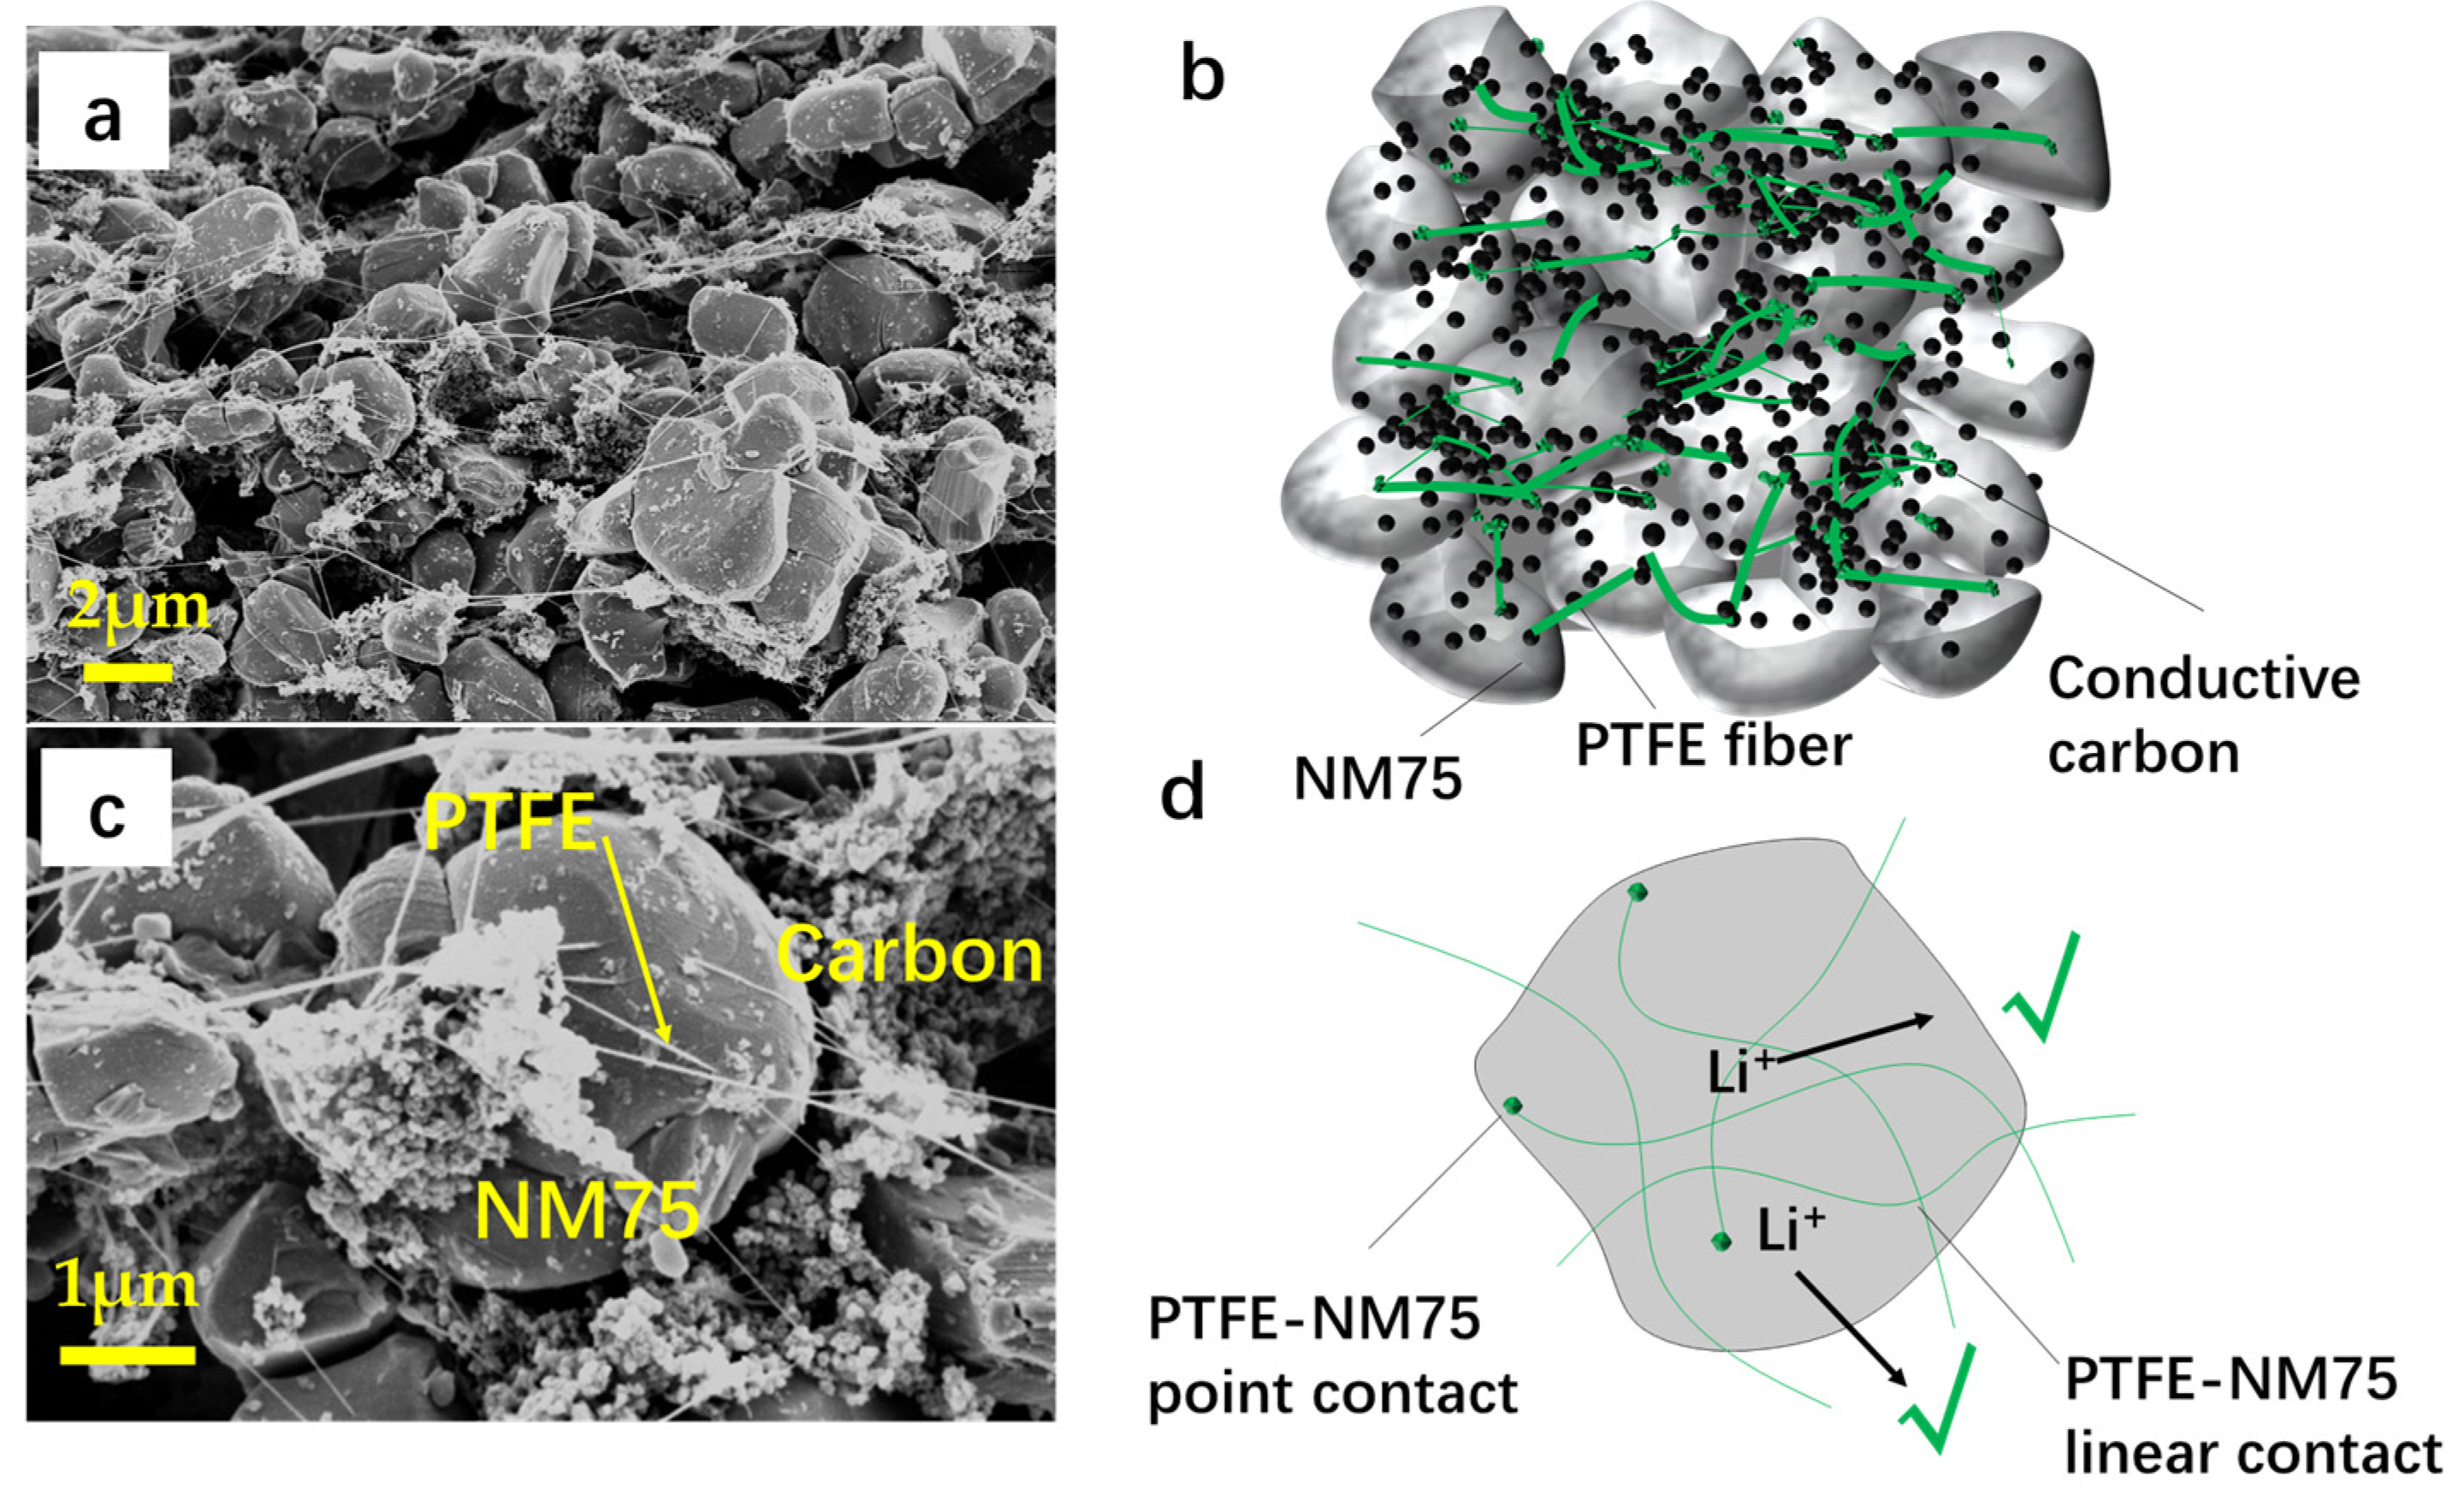
Beyond the internal resistance, the electrode architecture also influences the Li+ transport kinetics in the thick electrode [49]. The electrode inner structure is determined by the binder types and related fabrication processes. The cross-sectional SEM characterization of the NM75 electrodes at two magnifications (low magnitude in Figure S8 and high magnitude in Figure 7 and Figure 8) has revealed differences in the inner structure of the electrodes. In the slurry casting process, the dissolved PVDF binder was redistributed in the drying step; part of the binder agglomerated with carbons to form clusters, and the rest of the PVDF dissolved out and adhered to the NM75 particle surface at a facial contact way (Figure 7a,b). The PVDF on the NM75 surface blocked Li+ extraction in the discharge process and hindered Li+ insertion during the charging process, resulting in reduced rate performance (Figure 7c,d). In contrast, for the PTFE-based powder fibrillating process, the PTFE fibers constructed a unique bonding network comprised of linear/point contacts with the active material particle surface (Figure 8a,b). The PTFE fiber binding network acted as a host for the active material particles and provided superior solid–solid adhesion between layers. The presence of linear or point contact between the PTFE fibers and NM75 particles, as shown in Figure 8c,d, creates an interconnecting binding network structure that is less obtrusive. The galvanostatic intermittent titration technique (GITT) was used to discuss the Li+ transport kinetics. Figure S9 shows the GITT-based calculated ionic diffusion coefficient results as a function of the state-of-charge (SOC) and depth-of-discharge (DOD) at 25 °C. The F-NM75 electrode displayed an overall higher diffusion coefficient (4.71 × 10⁻⁸ cm2. s−1 in the charging process and 4.59 × 10⁻⁸ cm2 s−1 in discharging process) than that of the wet-coated C-NM75 electrode (2.79 × 10⁻⁸ cm2 s−1 in the charging process and 2.67 × 10⁻⁸ cm2 s−1 in discharging process), indicating that the F-NM75 had faster ionic transportation in both charge and discharge processes. The higher Li+ diffusion coefficient in F-NM75 is attributed to the unique PTFE binder network. This structure enables the easy access of Li+ to the NM75 particles [28], resulting in improved electrode performance.

3.3.4. C/3 Cycle Life Test

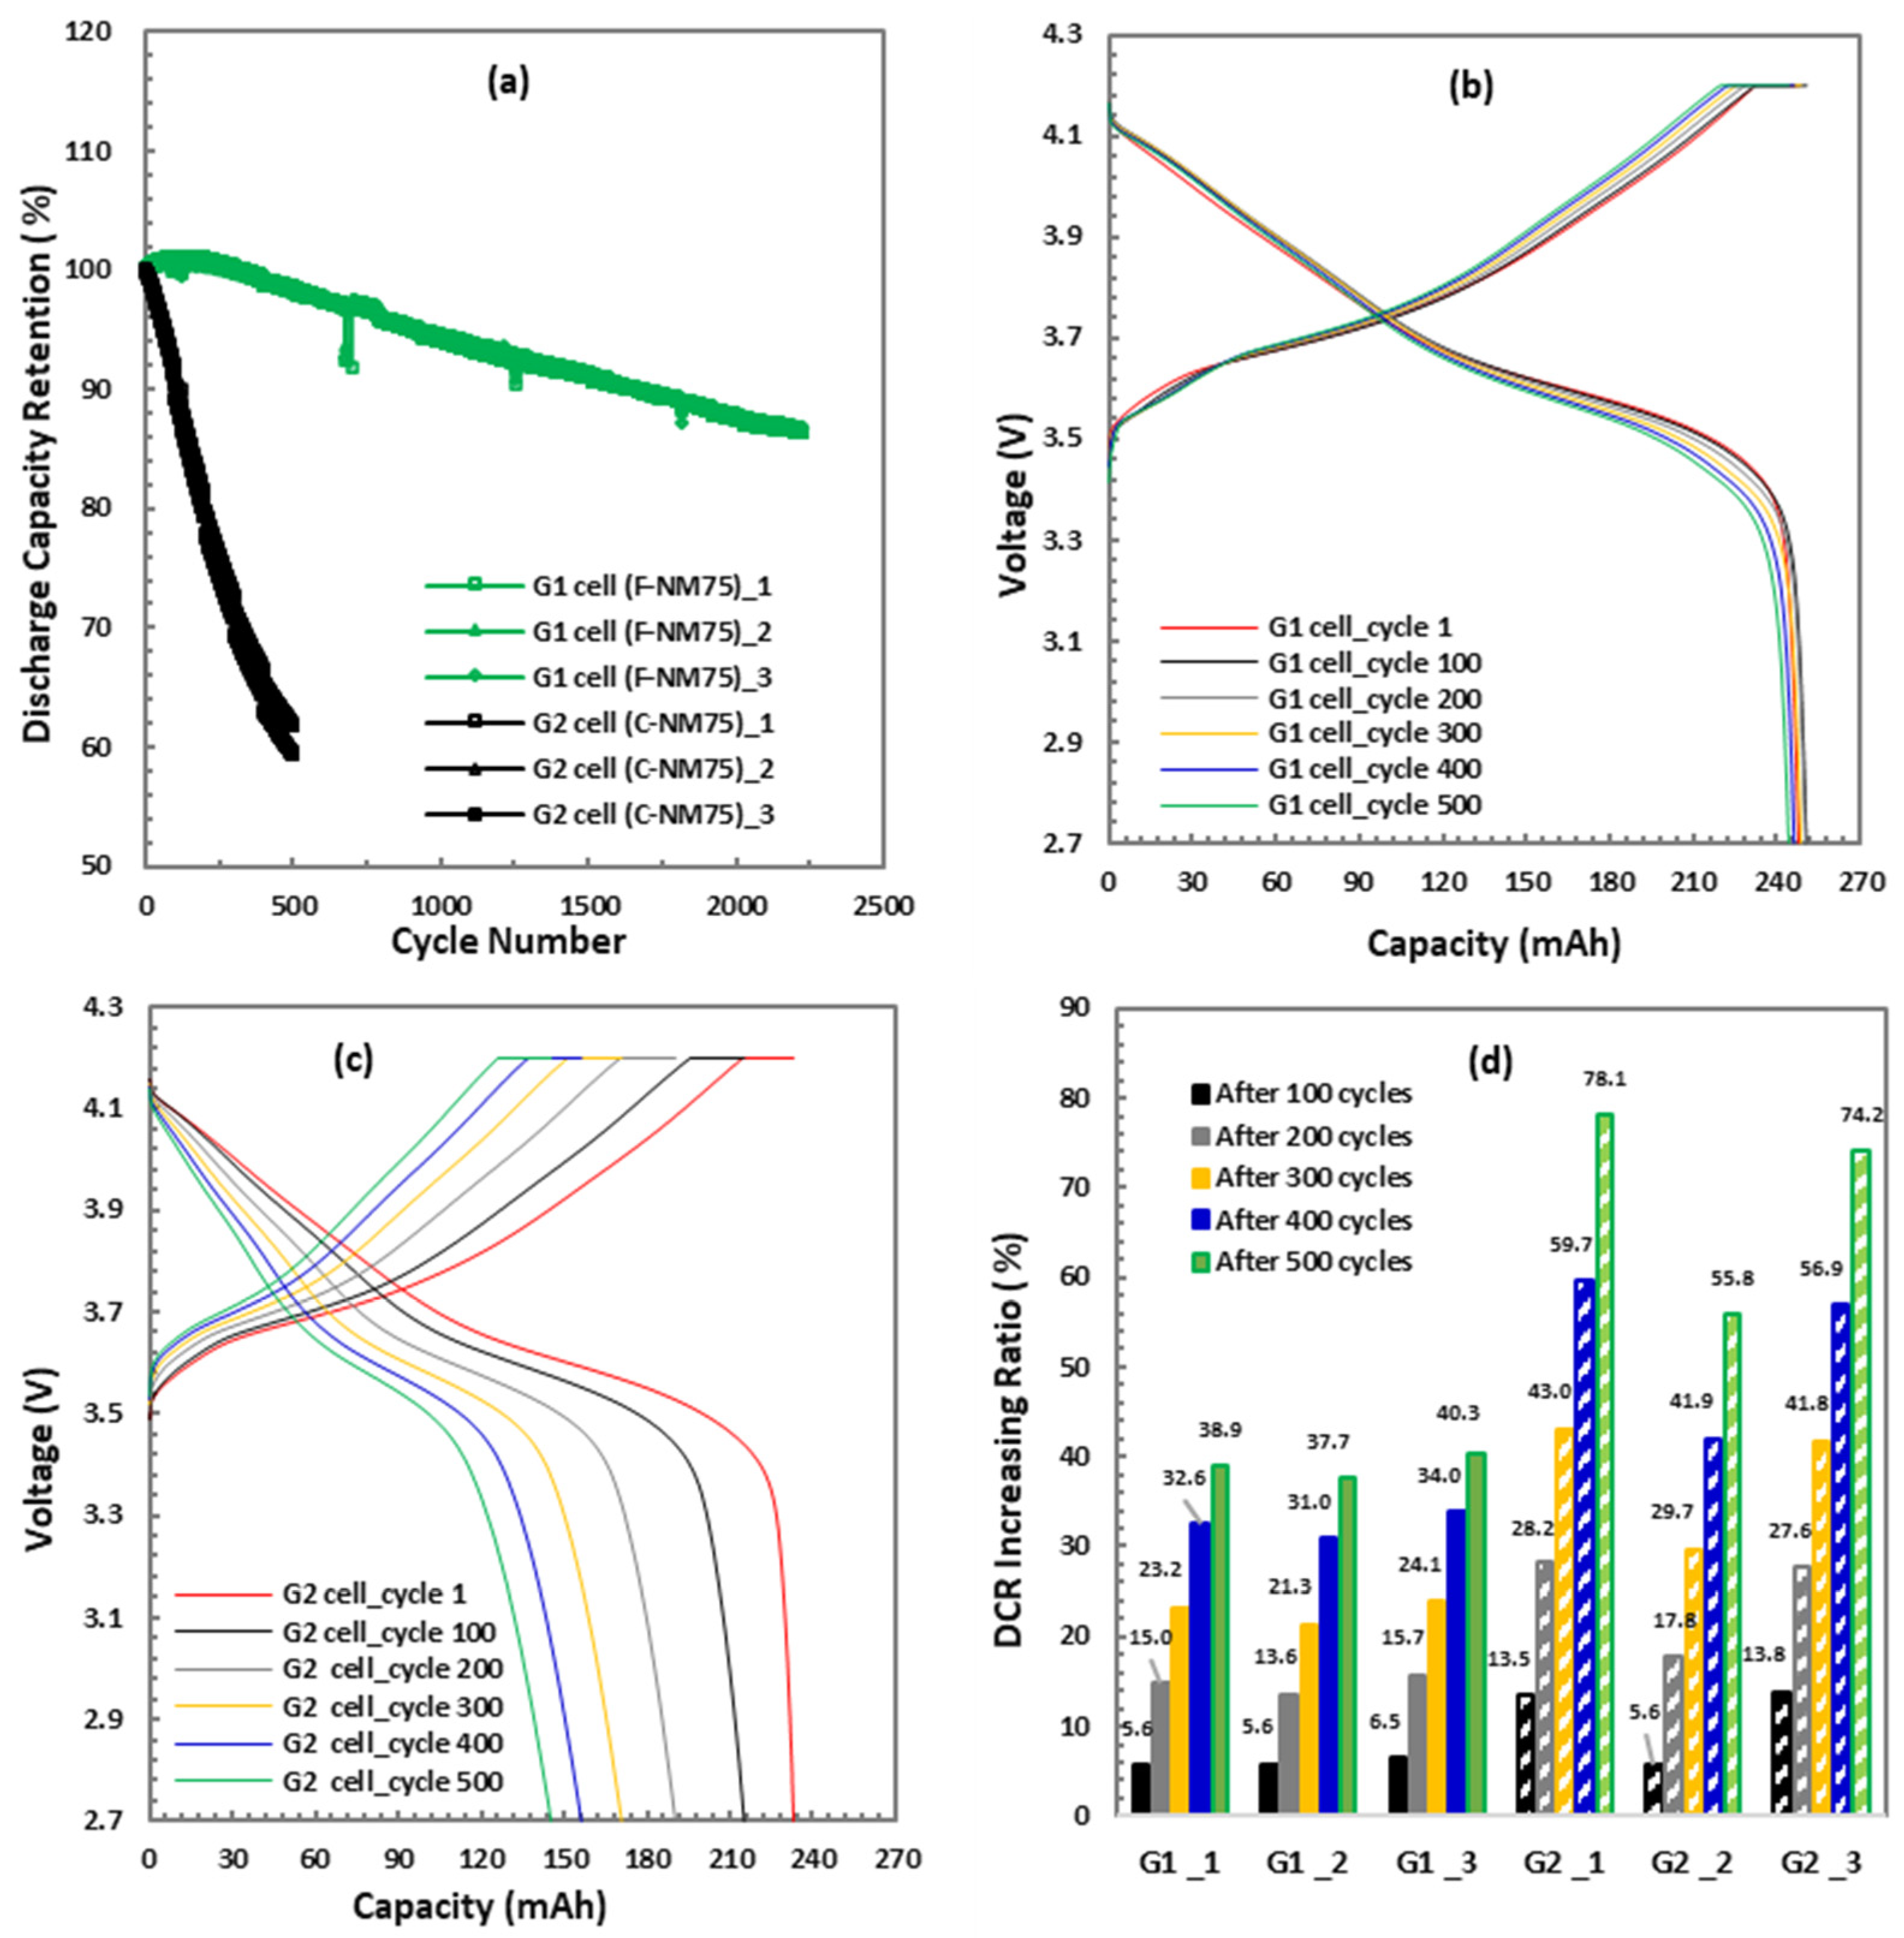
Figure 9a in the study presents the C/3 cyclic stability data of cells at 25 °C. The three cells in each group showed high consistency in both capacity retention and coulombic efficiency (Figure S11a). Figure 9b,c summarize the voltage profiles of G1 and G2 cells after specific cycles (1st, 100th, 200th, 300th, 400th, and 500th cycles). The initial discharge capacity of the G1 cell at C/3 was 247.7 mAh. The discharge capacity slightly decreased to 246.2 mAh for the G1 cell, corresponding to 99.4% capacity retention after 500 cycles at C/3. Even after 2200 cycles, the discharge capacity retention of all three cells was still higher than 86% (Figure 9a). In contrast, the discharge capacity of the G2 cell decayed from 233.0 mAh to 145.3 mAh after 500 cycles, resulting in a capacity retention of 62.4%. This fell short of the cycle life target of 80% discharge capacity retention at the 500th cycle. The capacity losses between cycles 1–100, 100–200, 200–300, 300–400, and 400–500 for the G2 cell were 7.7%, 10.7%, 8.3%, 6.3%, and 4.7%, respectively. The most significant capacity loss occurred during the initial cycles until the 300th cycle, with a 26.7% loss for the G2 cell.
In addition, Figure 9b,c compare the voltage profiles of the G1 and G2 cells as a function of cycling. A differential capacity plot of G1 and G2 cells is represented in Figure S10. The anodic peaks between 3.4 V and 3.8 V originate from the lithium insertion into the graphite and the phase transition from a hexagonal to a monoclinic (H1-M) lattice of the NM75. There is a small anodic feature at 3.98 V, which belongs to the M to H2 phase transition, and a large anodic peak at 4.15 V, which belongs to the H2-H3 phase transition [50,51]. Compared with the G1 cell, both the discharge capacity and discharge voltage of the G2 cell significantly decreased as the cells were continuously cycled. The differences in cyclability between the G1 and G2 cells were attributed to the internal resistance of the cells during the cycle life test (Figure 9d). The G1 cell exhibited a slower increasing ratio of DCR throughout the entire cycle life test, approximately 50% lower than that of the G2 cell at each RPT cycle. The lower DCR of the G1 cell (Figure S11b) and the smaller increment in DCR indicate that lower overpotential was generated during the charge and discharge processes. This resulted in higher capacity retention and more stable voltage profiles during cycling.
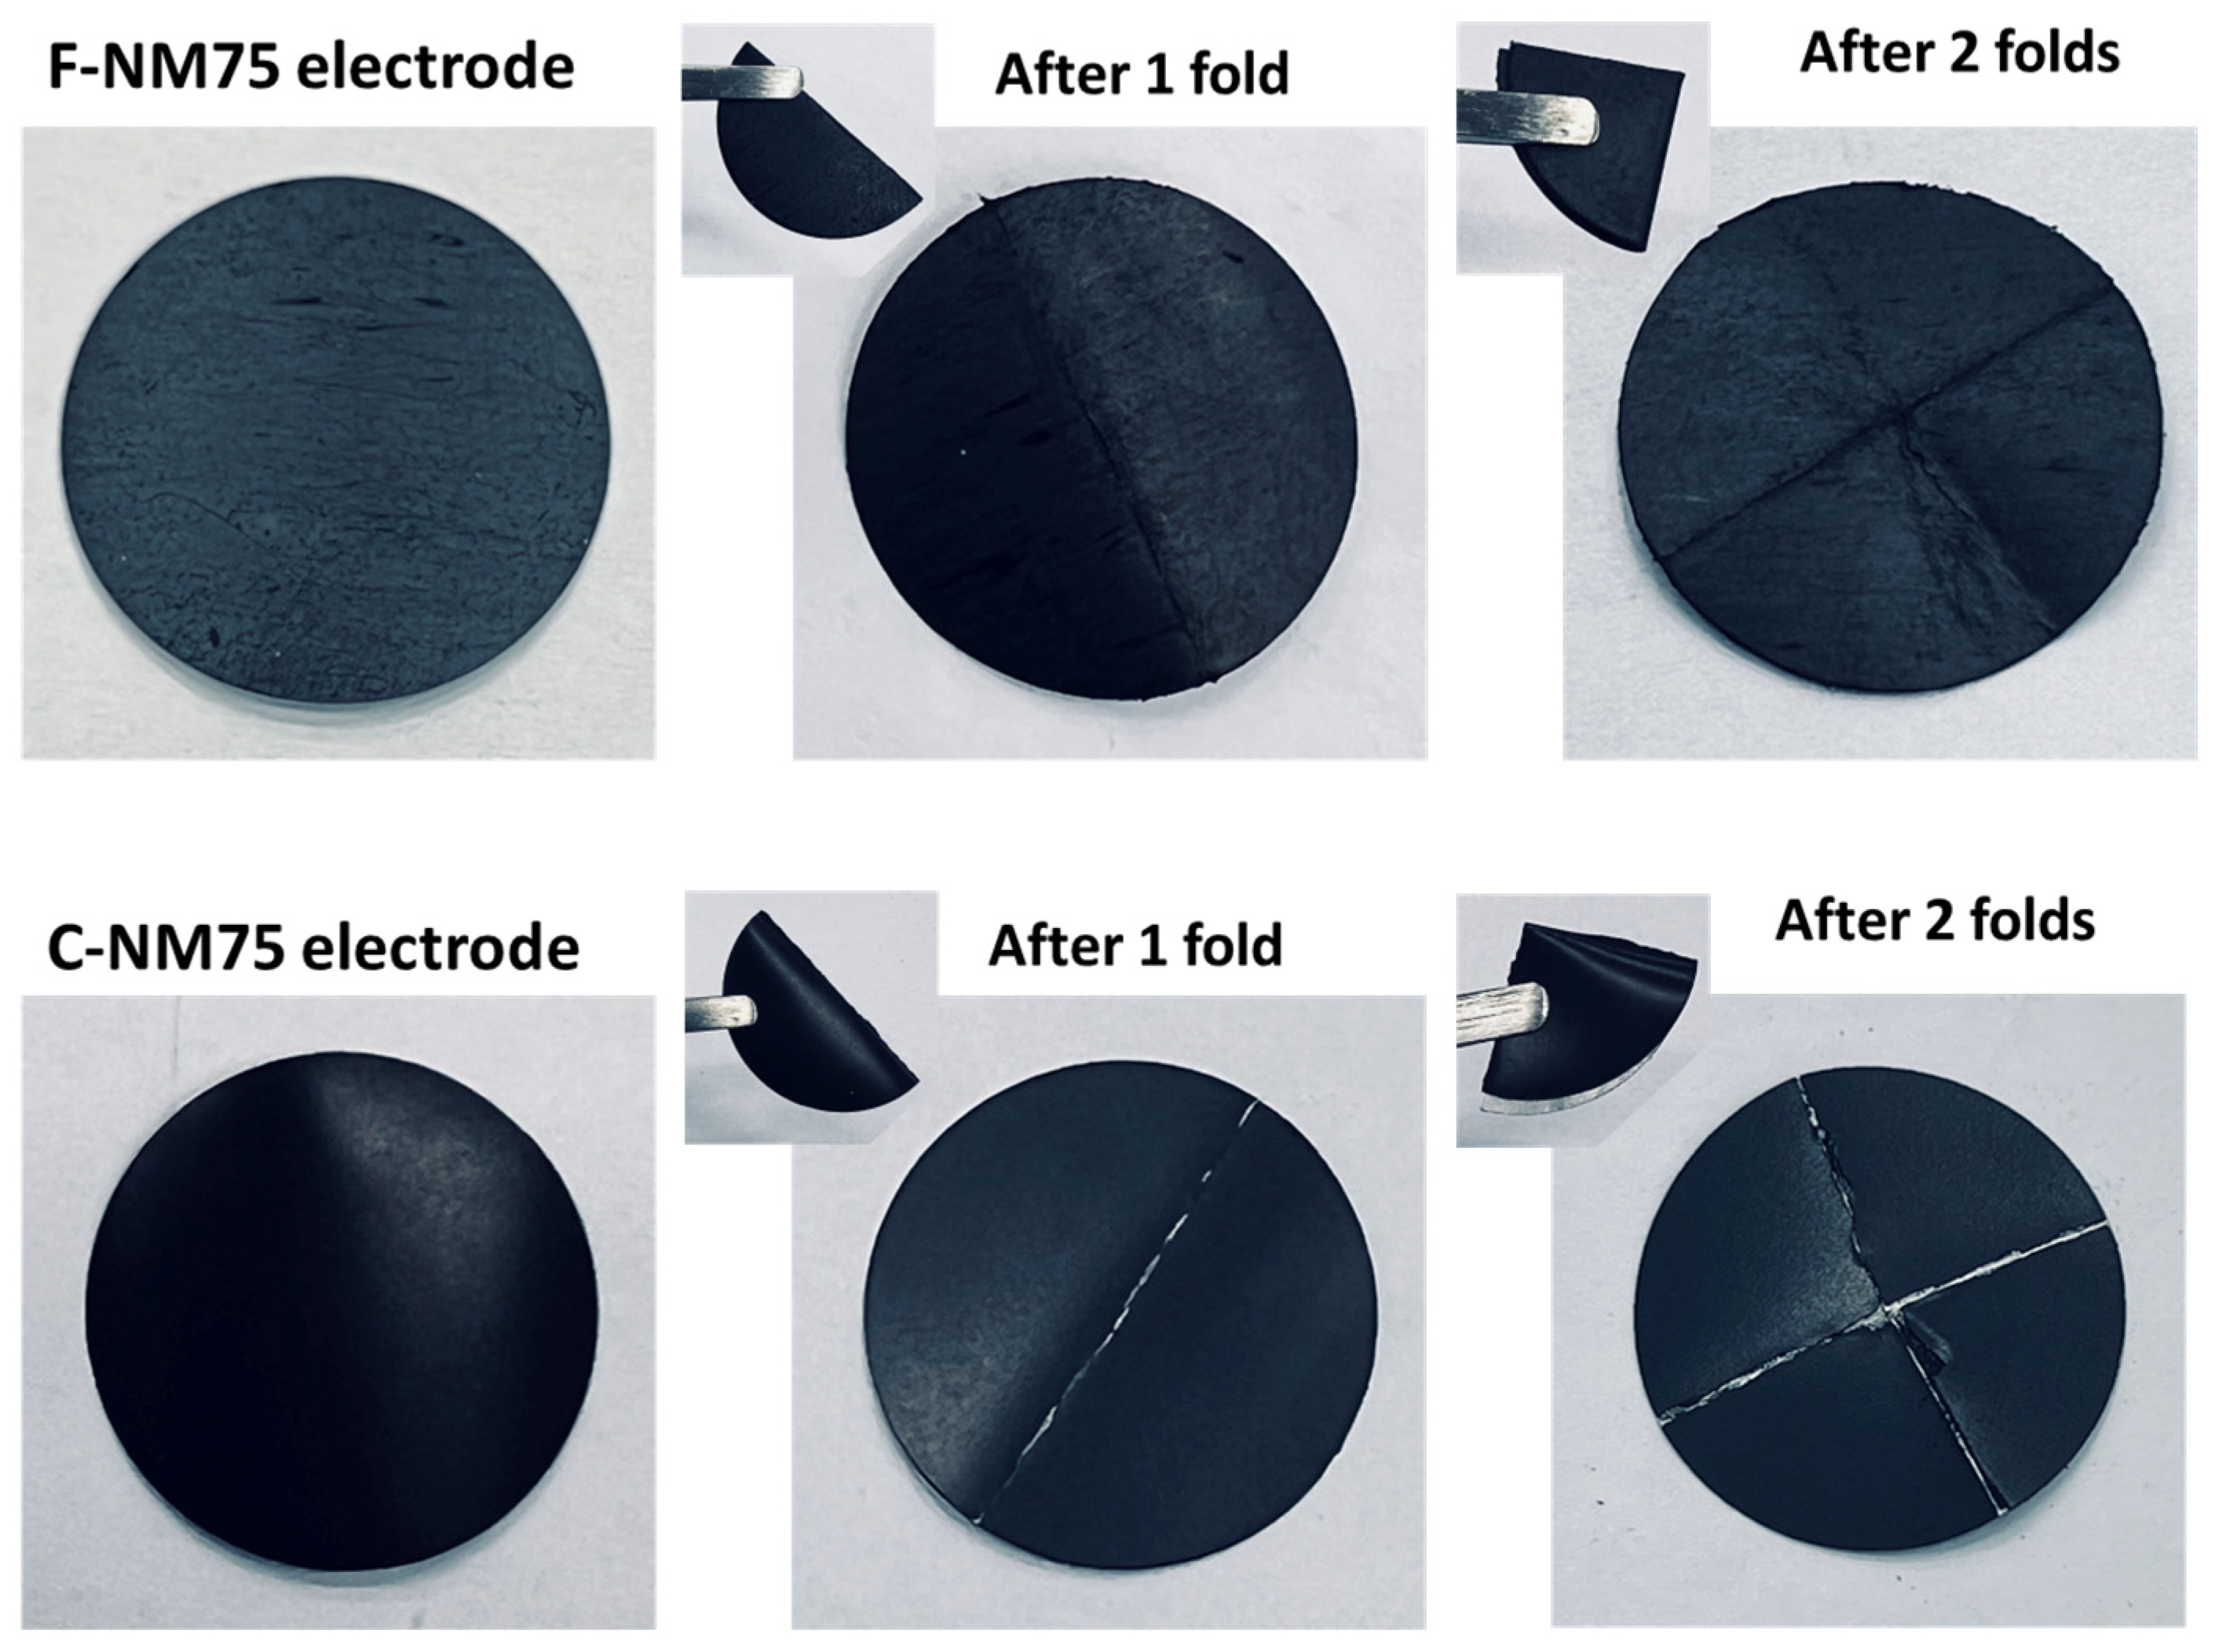
Furthermore, the F-NM75 electrode demonstrated exceptional flexibility in the folding test, as shown in Figure 10. It was observed that the C-NM75 electrode experienced delamination in the folding test. During the evaporation of the NMP solvent, the binder and conductive agent tended to float near the surface and agglomerate due to capillary action and diffusion, while the active materials precipitated. This uneven redistribution of PVDF binders, conductive agents, and NM75 particles during the drying process resulted in the poor adhesive force of the C-NM75 electrode [23,24,25,26,27]. In contrast, the F-NM75 electrode had a more uniform active material layer compared to the C-NM75 electrode and maintained its integrity without any crevices even after folding. This was further verified by comparing the adhesive force test of the two NM75 electrodes (Figure S12). The F-NM75 electrode demonstrated much higher 180° peel-off strength (64.0 N/m) than that of the C-NM75 electrode (11.6 N/m). This impressive flexibility of the active material layer in F-NM75 is owed to the unique PTFE fiber network. The PTFE fiber binding network acted as a host for the active material particles and provided superior solid–solid adhesion between layers. This robust electrode architecture not only contributed to outstanding cycle life performance but also offered greater flexibility in the manufacturing process, enabling the implementation of thick electrode designs in winding and cylindrical cells.

4. Conclusions

In this study, thick NM75 electrodes were fabricated using a PVDF-based slurry casting method and a PTFE-based powder fibrillating process. The electrochemical performance of these electrodes was systematically compared in pouch cells. The cells utilizing F-NM75 electrodes exhibited significantly improved discharge and charge performance at high C-rates and displayed enhanced discharge capability at cold temperatures. The enhanced rate performance can be attributed to the less-obtrusive PTFE inter-connecting binding network structure in the F-NM75 electrodes. This structure allows for easier access of Li+ ions into the active material particles with reduced resistance, thereby improving the cell rate capability. Furthermore, the F-NM75 electrodes contributed outstanding cell cycling performance at C/3, with a capacity retention of 86% even after 2200 cycles. The unique electrode structure constructed by fibrillated PTFE fibers contributes to the remarkable cycling performance and enables a flexible and robust mechanical strength electrode architecture. Our findings clearly indicate that cell performance is significantly influenced by the chosen thick electrode fabrication process. Specifically, it can be concluded that the PTFE-based powder fibrillating process is a promising method for fabricating high-performance thick cathode electrodes for electric vehicle applications. Both the battery industry and institute researchers should allocate more resources towards the development of novel cathode fabrication processes for EV applications.

Supplementary Materials

The following supporting information can be downloaded at: https://www.mdpi.com/article/10.3390/electrochem5040028/s1, Table S1: Materials specifications of active materials from supplier′s certificate of analysis (COA); Table S2. The formulations, mass loadings, and capacity loadings of F-NCMA, F-LMFP, and F-graphite electrodes; Figure S1. A scheme of F-NM75 electrode fabrication process; Figure S2. The charge and discharge curves of F-LMFP, F-NCMA, and F-graphite electrode in half-coin cells at C/20 at 25 °C; Figure S3. A schematic diagram (a) and image (b) of the NM75‖graphite bi-layer pouch cell; Figure S4. Comparison of the cross-section SEM and elemental mapping images of the NM75 electrodes; Figure S5. Voltage profiles of G1 (a) and G2 (b) in discharge rate test at 25 °C; Figure S6. Voltage profiles of G1 (a) and G2 (b) in charge rate test at 25 °C; Figure S7. Nyquist plots of the NM75 electrodes; Figure S8. Lower magnitude cross-sectional SEM images of the NM75 electrodes; Figure S9. Calculated Li+ diffusion coefficient as a function of SOC and DOD; Figure S10. A differential capacity plot of G1 and G2 cells; Figure S11. The coulombic efficiency (a) and DCR (b) of NM75‖graphite pouch cells in the cycle life test at 25 °C; Figure S12. Peeling strength/displacement curves in the 180° peel-off test of NM75 electrodes [52].

Author Contributions

Conceptualization, D.K. and H.L.; validation, S.C. and M.W.; writing—original draft preparation, D.K. and S.C.; writing—review and editing, H.L. All authors have read and agreed to the published version of the manuscript.

Funding

This research received no external funding.

Institutional Review Board Statement

Not applicable.

Informed Consent Statement

Not applicable.

Data Availability Statement

Data is contained within the article or Supplementary Material.

Conflicts of Interest

Author Dewen Kong, Haijing Liu, Si Chen and Meiyuan Wu were employed by the company Battery R&D, Battery Cell and Pack, General Motors. The remaining authors declare that the research was conducted in the absence of any commercial or financial relationships that could be construed as a potential conflict of interest.

References

  1. Mauro, M.; Biswas, A.; Fiorillo, C.; Wang, H.; Spessa, E.; Miretti, F.; Ahmed, R.; Bonfitto, A.; Emadi, A. Real-Time Implementable Integrated Energy and Cabin Temperature Management for Battery Life Extension in Electric Vehicles. Energies 2024, 17, 3185. [Google Scholar] [CrossRef]
  2. Un-Noor, F.; Padmanaban, S.; Mihet-Popa, L.; Mollah, M.N.; Hossain, E. A Comprehensive Study of Key Electric Vehicle (EV) Components, Technologies, Challenges, Impacts, and Future Direction of Development. Energies 2017, 10, 1217. [Google Scholar] [CrossRef]
  3. Nizam Uddin Khan, F.M.; Rasul, M.G.; Sayem, A.S.M.; Mandal, N.K. Design and optimization of lithium-ion battery as an efficient energy storage device for electric vehicles: A comprehensive review. J. Energy Storage 2023, 71, 108033. [Google Scholar] [CrossRef]
  4. Wei, Z.Q.; Kong, D.W.; Quan, L.J.; He, J.R.; Liu, J.Y.; Tang, Z.Y.; Chen, S.; Cai, Q.Q.; Zhang, R.Q.; Liu, H.J.; et al. Removing electrochemical constraints on polytetrafluoroethylene as dry-process binder for high-loading graphite anodes. Joule 2024, 8, 1350. [Google Scholar] [CrossRef]
  5. Tarascon, J.M.; Armand, M. Issues and challenges facing rechargeable lithium batteries. Nature 2001, 414, 359. [Google Scholar] [CrossRef]
  6. Olivetti, E.A.; Ceder, G.; Gaustad, G.G.; Fu, X. Lithium-ion battery supply chain considerations: Analysis of potential bottlenecks in critical metals. Joule 2017, 1, 229. [Google Scholar] [CrossRef]
  7. Dunn, B.; Kamath, H.; Tarascon, J.-M. Electrical Energy Storage for the Grid: A Battery of Choices. Science 2011, 334, 928. [Google Scholar] [CrossRef]
  8. Liu, Y.; Zhu, Y.; Cui, Y. Challenges and opportunities towards fast-charging battery materials. Nat. Energy 2019, 4, 540. [Google Scholar] [CrossRef]
  9. Li, W.; Erickson, E.M.; Manthiram, A. High-nickel layered oxide cathodes for lithium-based automotive batteries. Nat. Energy 2020, 5, 26. [Google Scholar] [CrossRef]
  10. Yoon, C.S.; Ryu, H.-H.; Park, G.T.; Kim, J.H.; Kim, K.H.; Sun, Y.K. Extracting maximum capacity from Ni-rich Li[Ni0.95Co0.025Mn0.025]O2 cathodes for high-energy-density lithium-ion batteries. J. Mater. Chem. A 2018, 6, 4126. [Google Scholar] [CrossRef]
  11. Deng, C.; Li, X.; Chen, R.; Ye, K.Q.; Lipton, J.; Maclean, S.A.; Wang, H.; Taylor, A.D.; Weng, G.M. Recent advances in rocking chair batteries and beyond. Energy Storage Mater. 2023, 60, 102820. [Google Scholar] [CrossRef]
  12. Sandstrom, S.K.; Chen, X.; Ji, X.L. A review of halide charge carriers for rocking-chair and dual-ion batteries. Carbon Energy 2021, 3, 627. [Google Scholar] [CrossRef]
  13. Hawley, W.B.; Li, J.L. Electrode manufacturing for lithium-ion batteries—Analysis of current and next generation processing. J. Energy Storage 2019, 25, 100862. [Google Scholar] [CrossRef]
  14. Singh, M.; Kaiser, J.; Hahn, H. Thick electrodes for high energy lithium ion batteries. J. Electrochem. Soc. 2015, 162, A1196. [Google Scholar] [CrossRef]
  15. Patry, G.; Romagny, A.; Martinet, S.; Froelich, D. Cost modeling of lithium-ion battery cells for automotive applications. Energy Sci. Eng. 2015, 3, 71. [Google Scholar] [CrossRef]
  16. Liu, Y.T.; Zhang, R.H.; Wang, J.; Wang, Y. Current and future lithium-ion battery manufacturing. iScience 2021, 24, 102332. [Google Scholar] [CrossRef]
  17. Liu, H.; Cheng, X.B.; Chong, Y.; Yuan, H.; Huang, J.Q.; Zhang, Q. Advanced electrode processing of lithium ion batteries: A review of powder technology in battery fabrication. Particuology 2021, 57, 56. [Google Scholar] [CrossRef]
  18. Chen, K.B.; Yu, Z.Q.; Deng, S.; Wu, Q.; Zou, J.X.; Zeng, X.Q. Evaluation of the low temperature performance of lithium manganese oxide/lithium titanate lithium-ion batteries for start/stop applications. J. Power Sources 2015, 278, 411. [Google Scholar] [CrossRef]
  19. Ludwig, B.; Zheng, Z.F.; Wan, S.; Wang, Y.; Pan, H. Solvent-Free Manufacturing of Electrodes for Lithium-ion Batteries. Sci. Rep. 2016, 6, 23150. [Google Scholar] [CrossRef]
  20. Al-Shroofy, M.; Zhang, Q.L.; Xu, J.G.; Chen, T.; Kaur, A.P.; Cheng, Y.T. Solvent-free dry powder coating process for low-cost manufacturing of LiNi1/3Mn1/3Co1/3O2 cathodes in lithium-ion batteries. J. Power Sources 2017, 352, 187. [Google Scholar] [CrossRef]
  21. Wood, D.L.; Li, J.L.; Daniel, C. Prospects for reducing the processing cost of lithium ion batteries. J. Power Sources 2015, 275, 234. [Google Scholar] [CrossRef]
  22. Li, J.L.; Rulison, C.; Kiggans, J.; Daniel, C.; Wood, D.L. Superior Performance of LiFePO4 Aqueous Dispersions via Corona Treatment and Surface Energy Optimization. J. Electrochem. Soc. 2012, 159, A1152. [Google Scholar] [CrossRef]
  23. Bauer, W.; Nötzel, D.; Wenzel, V.; Nirschl, H. Influence of dry mixing and distribution of conductive additives in cathodes for lithium ion batteries. J. Power Sources 2015, 288, 359. [Google Scholar] [CrossRef]
  24. Li, Y.X.; Wu, Y.J.; Wang, Z.X.; Xu, J.R.; Ma, T.H.; Chen, L.Q.; Li, H.; Wu, F. Progress in solvent-free dry-film technology for batteries and supercapacitors. Mater. Today 2022, 55, 92. [Google Scholar] [CrossRef]
  25. Jaiser, S.; Sanchez Salach, N.; Baunach, M.; Scharfer, P.; Schabel, W. Impact of drying conditions and wet film properties on adhesion and film solidification of lithium-ion battery anodes. Dry. Technol. 2017, 35, 1807. [Google Scholar] [CrossRef]
  26. Baunach, M.; Jaiser, S.; Schmelzle, S.; Nirschl, H.; Scharfer, P.; Schabel, W. Delamination behavior of lithium-ion battery anodes: Influence of drying temperature during electrode processing. Dry. Technol. 2016, 34, 462. [Google Scholar] [CrossRef]
  27. Jeong, D.; Lee, J. Electrode design optimization of lithium secondary batteries to enhance adhesion and deformation capabilities. Energy 2014, 75, 525. [Google Scholar] [CrossRef]
  28. Duong, H.; Shin, J.; Yudi, Y. Dry electrode coating technology. In Proceedings of the 48th Power Sources Conference, Denver, CO, USA, 11–14 June 2018; Volume 3, p. 34. [Google Scholar]
  29. Embleton, T.J.; Choi, J.H.; Won, S.J.; Ali, J.; Saqib, K.S.; Ko, K.; Jo, M.; Hwang, J.; Park, J.; Lee, J.H.; et al. High-energy density ultra-thick drying-free Ni-rich cathode electrodes for application in Lithium-ion batteries. Energy Storage Mater. 2024, 71, 103542. [Google Scholar] [CrossRef]
  30. Yao, W.L.; Chouchane, M.; Li, W.K.; Bai, S.; Liu, Z.; Li, L.T.; Chen, A.X.; Sayahpour, B.; Shimizu, R.; Raghavendran, G.; et al. A 5 V-class cobalt-free battery cathode with high loading enabled by dry coating. Energy Environ. Sci. 2023, 16, 1620. [Google Scholar] [CrossRef]
  31. Tao, R.M.; Steinhoff, B.; Sun, X.G.; Sardo, K.; Skelly, B.; Meyer, H.M.; Sawicki, C.; Polizos, G.; Lyu, X.; Du, Z.J.; et al. High-throughput and high-performance lithium-ion batteries via dry processing. Chem. Eng. J. 2023, 471, 144300. [Google Scholar] [CrossRef]
  32. Wang, F.Q.; Tang, S.; Han, Q.G.; Ji, S.J.; Wang, J.W.; Du, B.H.; Li, X.; Guan, M.Y.; Lou, P.; Zhang, W.X.; et al. Unraveling the impact of the design of current collector on dry-processed lithium-ion battery electrodes. J. Colloid Interface Sci. 2025, 678, 57. [Google Scholar] [CrossRef] [PubMed]
  33. Tang, B.; Wei, Y.K.; Jia, R.; Zhang, F.; Tang, Y.B. Rational Design of High-Loading Electrodes with Superior Performances Toward Practical Application for Energy Storage Devices. Small 2024, 20, 2308126. [Google Scholar] [CrossRef]
  34. Lee, T.; An, J.; Chung, W.J.; Kim, H.; Cho, Y.; Song, H.; Lee, H.; Kang, J.H.; Choi, J.W. Non-Electroconductive Polymer Coating on Graphite Mitigating Electrochemical Degradation of PTFE for a Dry-Processed Lithium-Ion Battery Anode. ACS Appl. Mater. Interfaces 2024, 16, 8930. [Google Scholar] [CrossRef] [PubMed]
  35. Zhang, K.; Li, D.; Wang, X.; Gao, J.; Shen, H.; Zhang, H.; Rong, C.; Chen, Z. Dry Electrode Processing Technology and Binders. Materials 2024, 17, 2349. [Google Scholar] [CrossRef]
  36. Lim, C.Y.; Park, G.; Lee, K.J. Effect of carbon conductor dispersion and composition in dry cathode electrode on LiB performances. Carbon Lett. 2024. [Google Scholar] [CrossRef]
  37. Bouguern, M.D.; Madikere Raghunatha Reddy, A.K.; Li, X.; Deng, S.; Laryea, H.; Zaghib, K. Engineering Dry Electrode Manufacturing for Sustainable Lithium-Ion Batteries. Batteries 2024, 10, 39. [Google Scholar] [CrossRef]
  38. Liu, J.; Ludwig, B.; Liu, Y.; Zheng, Z.; Wang, F.; Tang, M.; Wang, J.; Pan, H.; Wang, Y. Scalable dry printing manufacturing to enable long-life and high energy lithium-ion batteries. Adv. Mater. Technol. 2017, 2, 1700106. [Google Scholar] [CrossRef]
  39. Liu, J.; Chen, S.; Kong, D.; Wu, M.; Liu, H. Interaction between LMFP and NCMA and Its Effect on Blending Cathode-Based Cells. Energies 2024, 17, 808. [Google Scholar] [CrossRef]
  40. GMW16460; General Motors Worldwide Engineering Standards, Static Capacity and Hybrid Pulse Power Characterization Test of Rechargeable Energy Storage Systems. General Motors Worldwide: Detroit, MI, USA, 2021.
  41. Allart, D.; Montaru, M.; Gualous, H. Model of Lithium Intercalation into Graphite by Potentiometric Analysis with Equilibrium and Entropy Change Curves of Graphite Electrode. J. Electrochem. Soc. 2018, 165, A380. [Google Scholar] [CrossRef]
  42. Onda, K.; Ohshima, T.; Nakayama, M.; Fukuda, K.; Araki, T. Thermal behavior of small lithium-ion battery during rapid charge and discharge cycles. J. Power Sources 2006, 158, 535. [Google Scholar] [CrossRef]
  43. Chen, L.; Zhang, M.; Ding, Y.H.; Wu, S.X.; Li, Y.J.; Liang, G.; Li, H.; Pan, H.H. Estimation the internal resistance of lithium-ion-battery using a multi-factor dynamic internal resistance model with an error compensation strategy. Energy Rep. 2021, 7, 3050. [Google Scholar] [CrossRef]
  44. Belharouak, I.; Johnson, C.; Amine, K. Synthesis and electrochemical analysis of vapor-deposited carbon-coated LiFePO4. Electrochem. Commun. 2005, 7, 983. [Google Scholar] [CrossRef]
  45. Liu, S.Z.; Chen, J.J.; Zhang, C.; Jin, L.; Yang, Q.X. Experimental study on lithium-ion cell characteristics at different discharge rates. J. Energy Storage 2022, 45, 103418. [Google Scholar] [CrossRef]
  46. Guo, R.; Shen, W. A Review of Equivalent Circuit Model Based Online State of Power Estimation for Lithium-Ion Batteries in Electric Vehicles. Vehicles 2022, 4, 1. [Google Scholar] [CrossRef]
  47. Wang, S.; Verbrugge, M.; Wang, J.S.; Liu, P. Multi-Parameter Battery State Estimator Based on the Adaptive and Direct Solution of the Governing Differential Equations. J. Power Sources 2011, 196, 8735. [Google Scholar] [CrossRef]
  48. Steinstraeter, M.; Heinrich, T.; Lienkamp, M. Effect of Low Temperature on Electric Vehicle Range. World Electr. Veh. J. 2021, 12, 115. [Google Scholar] [CrossRef]
  49. Zhang, X.; Hui, Z.Y.; King, S.; Wang, L.; Ju, Z.Y.; Wu, J.Y.; Takeuchi, K.J.; Marschilok, A.C.; West, A.C.; Takeuchi, E.S.; et al. Tunable Porous Electrode Architectures for Enhanced Li-Ion Storage Kinetics in Thick Electrodes. Nano Lett. 2021, 21, 5896. [Google Scholar] [CrossRef]
  50. Jung, R.; Metzger, M.; Maglia, F.; Stinner, C.; Gasteiger, H.A. Oxygen Release and Its Effect on the Cycling Stability of LiNixMnyCozO2 (NMC) Cathode Materials for Li-Ion Batteries. J. Electrochem. Soc. 2017, 164, A1361. [Google Scholar] [CrossRef]
  51. Geldasa, F.T.; Kebede, M.A.; Shura, M.W.; Hone, F.G. Identifying surface degradation, mechanical failure, and thermal instability phenomena of high energy density Ni-rich NCM cathode materials for lithium-ion batteries: A review. RSC Adv. 2022, 12, 5891–5909. [Google Scholar] [CrossRef]
  52. Ryu, M.; Hong, Y.K.; Lee, S.Y. Ultrahigh loading dry-process for solvent-free lithium-ion battery electrode fabrication. Nat Commun. 2023, 14, 1316. [Google Scholar] [CrossRef]
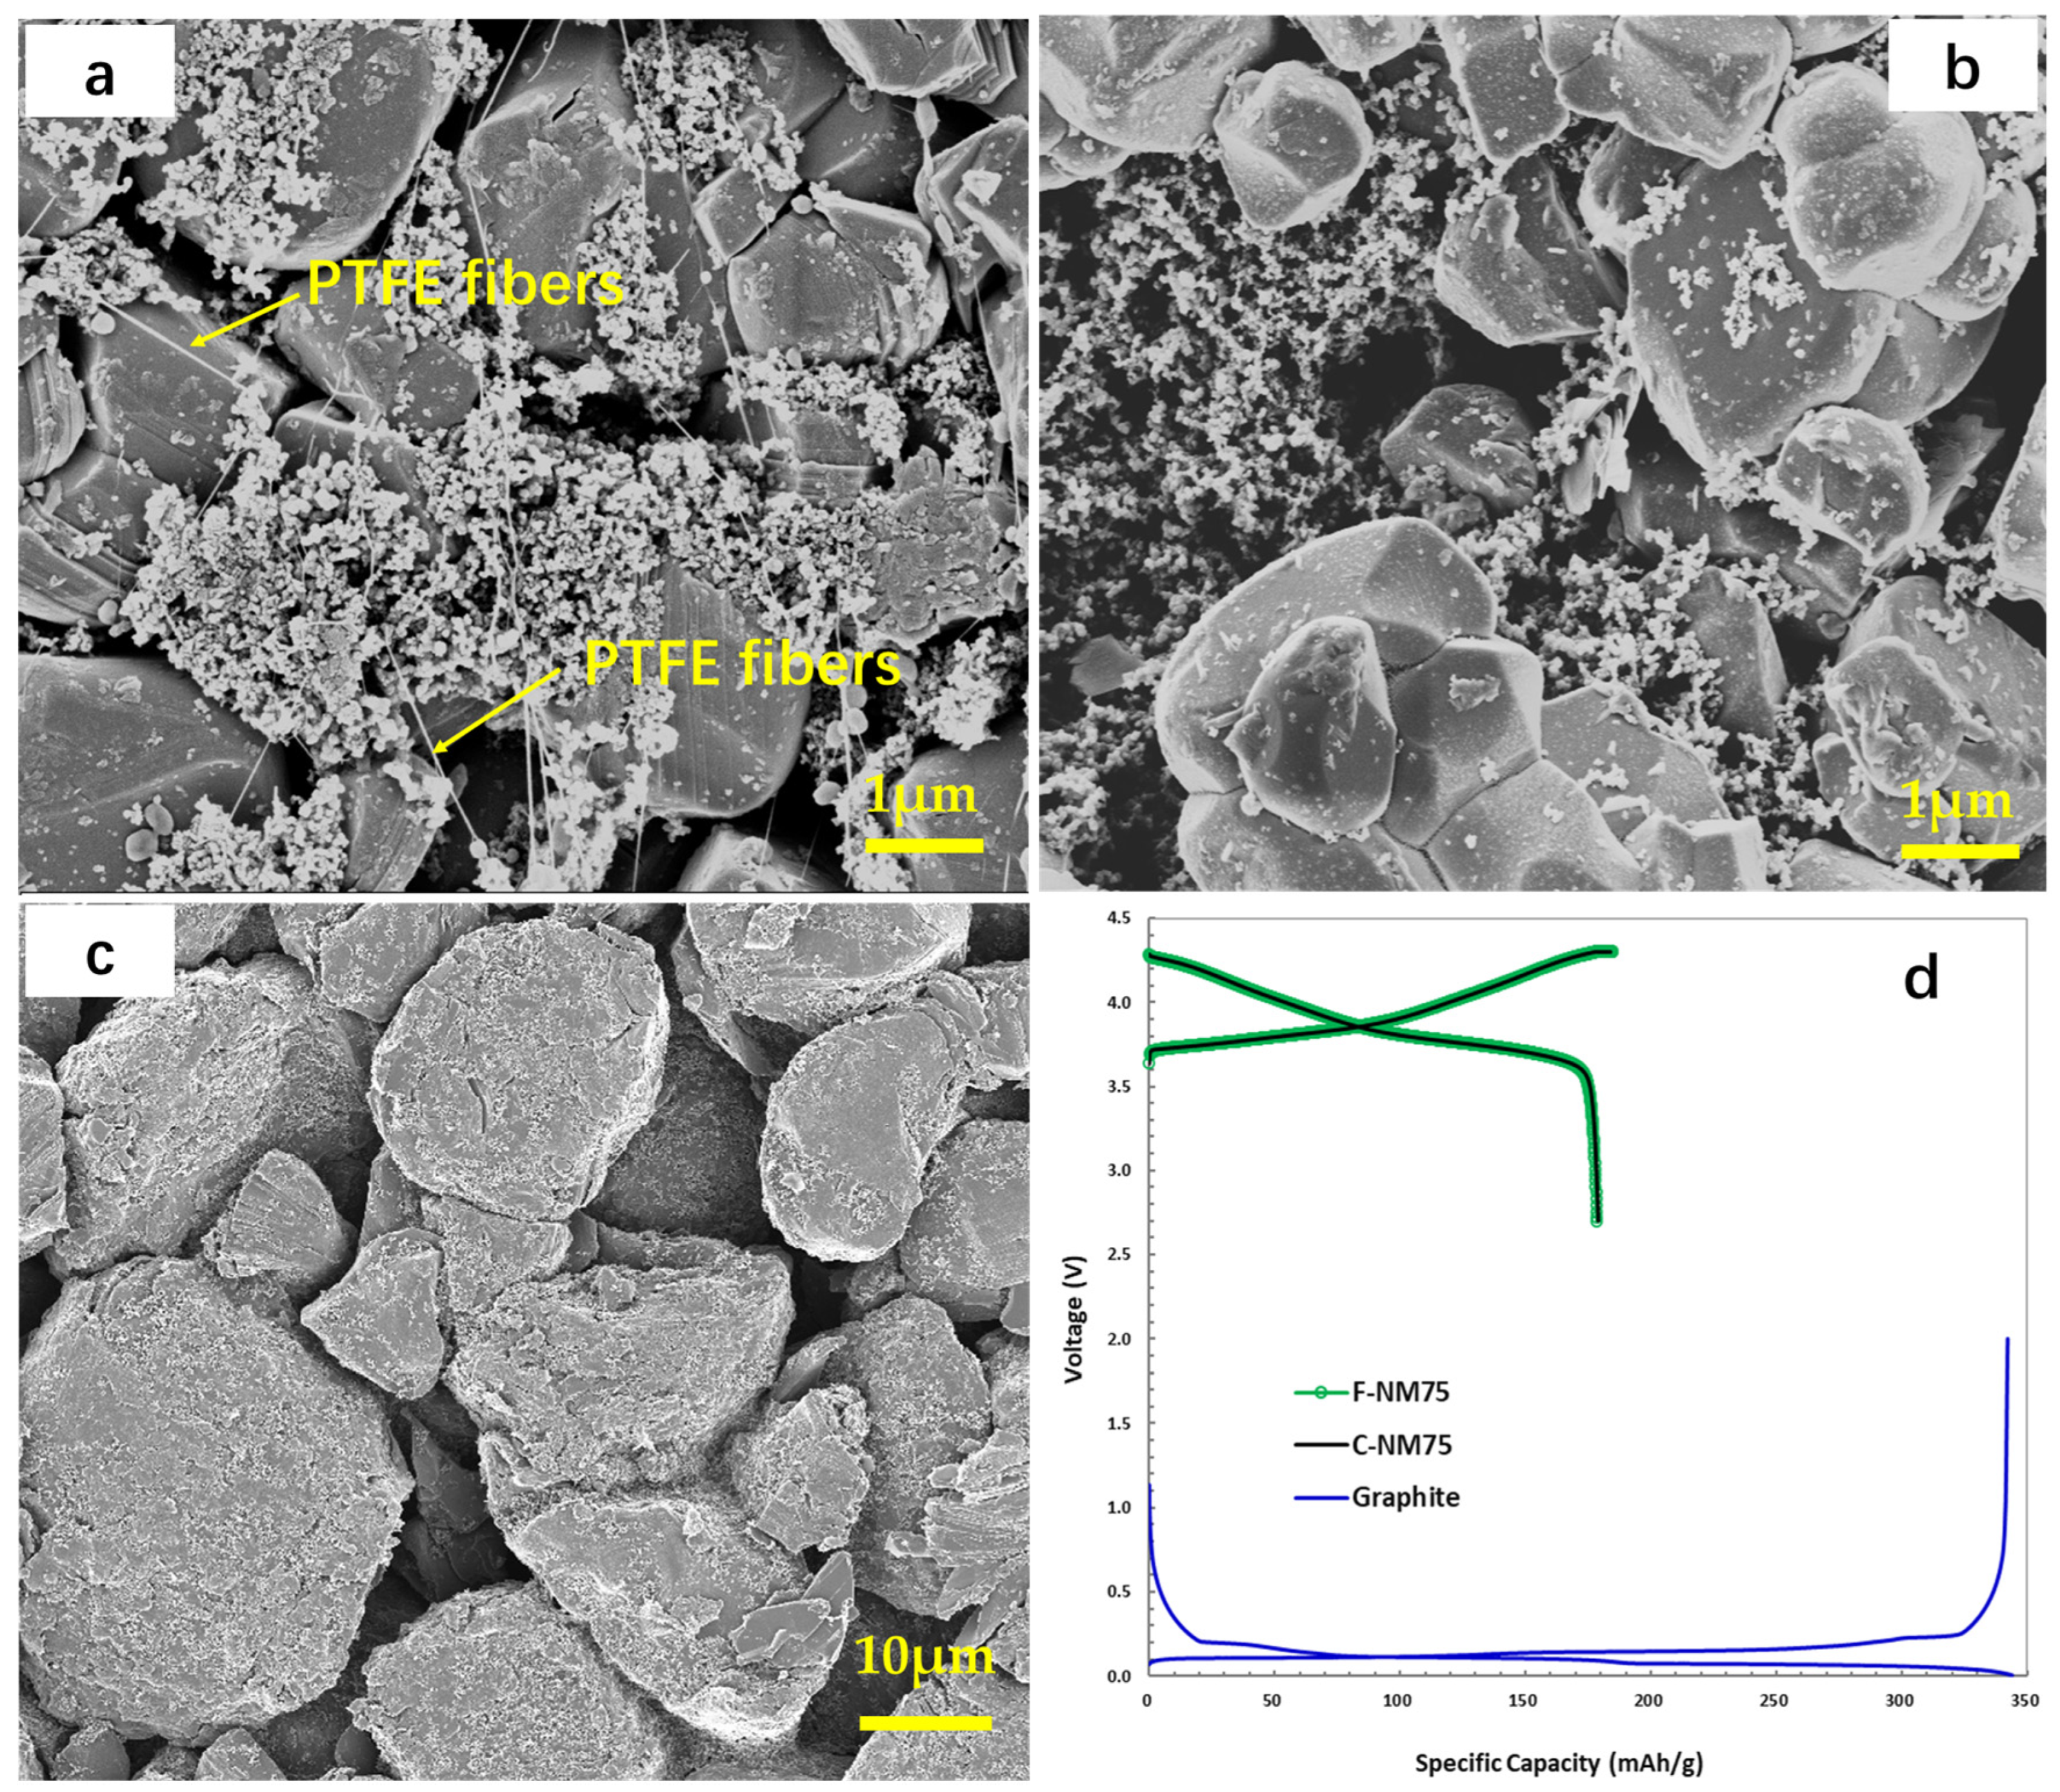
Figure 1. (a) SEM images of the F-NM75 electrode, (b) C-NM75 electrode, and (c) graphite electrode. (d) The charge and discharge curves of NM75 electrodes and graphite electrode in half-coin cells at C/10 at 25 °C.
Electrochem 05 00028 g001
Figure 2. (a) Discharge rate and (b) discharge curves at 3 C and C/3 of G1 (green) and G2 (black) cells at 25 °C.
Electrochem 05 00028 g002
Figure 3. The 10 s discharge resistance as a function of SOC for G1 (green) and G2 (black) cells at 25 °C.
Electrochem 05 00028 g003
Figure 4. (a) Charge rate and (b) charge curves at 2 C of G1 (green) and G2 (black) cells at 25 °C.
Electrochem 05 00028 g004
Figure 5. Comparison between G1 (green) and G2 (black) cells on 10 s charge resistance at 25 °C.
Electrochem 05 00028 g005
Figure 6. (a) 1 C discharge capacity retention vs 1 C at 25 °C, (b) 1 C discharge curves at 0 °C, (c) −10 C, and (d) −20 °C of G1 (green) and G2 (black) cells at 25 °C.
Electrochem 05 00028 g006
Figure 7. (a,c) Cross-sectional SEM image and (b,d) schematic descriptions of C-NM75 electrode.
Electrochem 05 00028 g007
Figure 8. (a,c) Cross-sectional SEM image and (b,d) schematic descriptions of F-NM75 electrode.
Electrochem 05 00028 g008
Figure 9. (a) The discharge capacity retention and (b) voltage profiles of G1 cell and (c) G2 cell, (d) DCR increasing ratio in C/3 cycle life test at 25 °C.
Electrochem 05 00028 g009
Figure 10. Folding test of F-NM75 electrode at room temperature. The sample diameter is 14 mm; the sample area is 153.86 mm2.
Electrochem 05 00028 g010
Table 1. The formulation, mass loading, press density, and specific capacity of NM75 and graphite electrodes.
ElectrodeFormulation at Mass Ratio, %1 Mass Loading
(mg/cm2)
Press Density
(g/cm3)
Specific Capacity (mAh/g)
F-NM75AM/SP/KB/PTFE = 96/1/ 1/228.03.02 178.6
C-NM75AM/SP/KB/PVDF = 94.5/ 2/1/2.526.73.02 178.9
GraphiteAM: SP: CMC:SBR = 94.5:1.8:1.4:2.316.31.53 342.2
1 Single-sided mass loading. 2 The voltage range is 2.7–4.3 V, C/10. 3 The voltage range is 10 mV–2.0 V, C/20.
Table 2. The design table of NM75‖graphite pouch cells.
ElectrodeGroup1 (G1)Group2 (G2)
CathodeF-NM75C-NM75
Cathode areal capacity (mAh/cm2) 4.84.5
AnodeSlurry casting graphite
Anode areal capacity (mAh/cm2) 5.3
N/P ratio1.101.18
SeparatorCelgard EH2010 (20 µm)
1 Nominal capacity250 mAh230 mAh
1 The voltage range is 2.7–4.2 V.
Disclaimer/Publisher’s Note: The statements, opinions and data contained in all publications are solely those of the individual author(s) and contributor(s) and not of MDPI and/or the editor(s). MDPI and/or the editor(s) disclaim responsibility for any injury to people or property resulting from any ideas, methods, instructions or products referred to in the content.